1 Effects of Ethanol Contamination on Friction and Elastohydrodynamic Film Thickness of Engine Oils Henara L. Costa Laboratorio de Tribologia e Materiais, Universidade Federal de Uberlandia, Uberlandia, Brazil Hugh Spikes Tribology Group, Department of Mechanical Engineering , Imperial College London , London , UK ABSTRACT: The use of ethanol as engine fuel has increased for environmental reasons, both in flex-fuel engines, and as increasing amounts of ethanol blended with gasoline in conventional engines. This paper describes an investigation into the effects of ethanol contamination of lubricants during engine use with ethanol fuel. To facilitate this, a new technique was developed to measure small amounts of ethanol in lubricants. Elastohydrodynamic film thickness measurements and Stribeck curves were obtained for Group I base and formulated oils containing small added amounts of ethanol. The effect of the water present in hydrated ethanol was evaluated by carrying out tests using both

Welcome message from author
This document is posted to help you gain knowledge. Please leave a comment to let me know what you think about it! Share it to your friends and learn new things together.
Transcript
1
Effects of Ethanol Contamination on Friction and Elastohydrodynamic
Film Thickness of Engine Oils
Henara L. Costa
Laboratorio de Tribologia e Materiais, Universidade Federal de Uberlandia, Uberlandia,
Brazil
Hugh Spikes
Tribology Group, Department of Mechanical Engineering , Imperial College London ,
London , UK
ABSTRACT: The use of ethanol as engine fuel has increased for environmental reasons,
both in flex-fuel engines, and as increasing amounts of ethanol blended with gasoline in
conventional engines. This paper describes an investigation into the effects of ethanol
contamination of lubricants during engine use with ethanol fuel. To facilitate this, a new
technique was developed to measure small amounts of ethanol in lubricants.
Elastohydrodynamic film thickness measurements and Stribeck curves were obtained for
Group I base and formulated oils containing small added amounts of ethanol. The effect of
the water present in hydrated ethanol was evaluated by carrying out tests using both
2
hydrated and anhydrous ethanol. Measurements were also carried out using a Group II base
oil with added ethanol. These measurements showed that in the low entrainment speed
region, where the elastohydrodynamic film is very thin so that boundary lubrication
prevails, the addition of ethanol produced a boundary film, which was not present for the
base oils. By contrast the addition of ethanol to formulated oil reduced film thickness in all
lubrication regimes. The friction tests showed friction reduction due to addition of ethanol
to the base oil, in particular at low speeds. For the formulated oil, ethanol reduced friction
at high speeds, which was associated with a reduction in the viscosity of the lubricant, but
at low speeds, ethanol reduced the formation of a boundary layer, increasing friction. The
presence of water in hydrated ethanol did not change significantly film thickness and
friction when compared with anhydrous ethanol.
Keywords: ethanol, fuel dilution, lubricant, engine oil, film thickness, ultrathin
interferometry, Stribeck curves
INTRODUCTION
Ethanol is being increasingly used as an alternative fuel to petroleum-based gasoline and
diesel derivatives, driven by the potentially damaging effect of global warming and
depletion in the supply of fossil fuels (Wu, et al. (1)). The addition of ethanol to gasoline
fuel started in many countries around 1930, but was greatly increased during the petroleum
crisis in the 1970s.
In Brazil, a governmental ethanol programme launched in 1975 aimed to implement
national technologies both for ethanol production from sugar cane and adaptation of car
3
engines for use with ethanol fuel (Bastian-Pinto, et al. (2)). The production of ethanol-
fuelled automobiles started in 1981 in Brazil, which was the global pioneer in promoting
ethanol at large-scale as a vehicle fuel, and is today the second largest world producer of
ethanol (Cavalcanti, et al. (3)). In the 1990s, facing the difficulties of reliable ethanol
supply throughout the year, the Brazilian automobile industry decided to develop a mixed
fuel engine which could run on any proportion of ethanol and gasoline, now known as the
flex-fuel engine. This fuel flexibility is possible due to an electronic system that uses the
lambda probe signal to monitor the composition of exhaust gases in order to identify the
fuel present in the tank and thereby choose the fuel mixture (Ahn, et al. (4)). This tank fuel
varies from 22% of anhydrous ethanol (99.5% of pure ethanol and 0.5% water), which is
the amount of ethanol normally added to gasoline according to Brazilian legislation, to pure
hydrated ethanol, containing 93% of ethanol and 7% of water. Nowadays half of the
amount of combustible used in Brazilian automobiles is renewable (Cavalcanti, et al. (3))
and according to the national association of automotive vehicle manufacturers (Anfavea),
flex-fuel engines account for 88% of the vehicles produced in Brazil. In the United Sates,
an Act of 1988 stimulated the development of bi-fuel vehicles, which use a fuel known as
E85, indicating a mixture of 85% ethanol and 15% gasoline (Bastian-Pinto, et al. (2)). This
limit was set to avoid engine cold start problems in the extreme weather conditions that
may occur in temperate countries. To meet this demand, the volume of ethanol produced in
the US increased 22-fold between 1980 and 2005 (Dutcher, et al. (5)). In Europe, the
directive (2003/30/EC (6)) aimed to introduce biofuels in transport, and in 2009 the
directive (2009/28/EC (7)) established a target of 10% of renewable fuels in transport by
4
2020. Many countries, such as Sweden (Linde (8)) and Belgium (Pelkmans, et al. (9)), have
been adopting policies that involve an increased use of biofuels to reach this 10% target.
As well as reducing dependence on oil supplies, the use of ethanol fuel can offer further
advantages. When the complete cycle is taken into account, from fuel production to use in
vehicles, CO2 emissions are reduced compared to gasoline (Dutcher, et al. (5)). Also, the
addition of ethanol to a fuel reduces the particulate mass concentration in the exhaust
(Dutcher, et al. (5, Maricq (10)). For example, it has been found that compared with pure
gasoline, the use of E85 reduces semivolatile organic formation by 4 to 7 times and the
soot agglomerates reduce in size to less than half (Maricq (10)).
However, the use of ethanol as fuel poses some tribological issues due to the possibility of
contamination of the lubricant with ethanol. Incorporation and dilution of ethanol in the
lubricant is particularly likely during engine cold start (Boons, et al. (11, Chui, et al. (12)).
Tribological challenges in automotive engines seem to be related to inadequate lubrication
and tribochemical wear (Ferrarese, et al. (13, De Silva, et al. (14, De Silva, et al. (15)).
Severe wear has been frequently reported by users of various sizes and models of flex-fuel
engines and components particularly affected are piston rings (Ferrarese, et al. (13)), valves
and valve lifters (Ferrarese, et al. (13, Volcci (16)). Despite this challenge, very few studies
on the effects of ethanol on friction (De Silva, et al. (14, De Silva, et al. (15)), lubrication
(Chui, et al. (12, Boons, et al. (17, Chui and Millard (18)) and wear (Ferrarese, et al. (13,
Volcci (16)) of automotive engine parts can be found in the literature.
This paper aims to investigate to which extent the tribological problems frequently reported
for flex-fuel engines are related to the effects of ethanol on film formation and friction. To
5
do this, elastohydrodynamic (EHL) film thicknesses were measured for lubricants
contaminated with ethanol over a wide range of speeds, to span lubrication regimes ranging
from boundary to EHL. These results were complemented with measurement of Stribeck
curves, to help understand the mechanisms by which the presence of ethanol can affect
friction. In order to separate the interaction of ethanol with the base oil from that with other
additives, both base oils and formulated oils without friction modifiers were investigated.
BACKGROUND
Since ethanol has a much higher latent heat of evaporation than gasoline, accumulation of
ethanol in the lubricant can be significant, particularly in cold-start/warm-up/short-trip
conditions (De Silva, et al. (15)). ASTM V-D oil sequence tests using neat ethanol have
shown ethanol accumulation in the sump of 25% (Chui, et al. (12)) while field tests using
E85 under conditions that lead to low lubricant temperatures have shown around 6%
ethanol accumulation (Boons, et al. (11)).
Since this ethanol accumulation is expected to influence lubrication and therefore friction,
De Silva et al. used a Plint TE77 reciprocating tribometer to investigate friction at the
piston ring/cylinder wall interface for a fully formulated gasoline engine lubricant
contaminated with ethanol and water (De Silva, et al. (15)). They found that although the
presence of ethanol did not affect friction measurements significantly, the combined
presence of water and ethanol in the lubricant reduced friction. They also measured friction
using the phases separated from a contaminated lubricant when left undisturbed, as would
happen when a vehicle is parked or garaged (De Silva, et al. (14)), and found friction
6
reduction when the contact was lubricated with the separated oil and the sludge phases of
the lubricant/ethanol/water mixtures compared to the formulated reference lubricant.
However, a more fundamental investigation of the effects of the contamination of
lubricants with ethanol on the tribological performance of automotive parts is still
necessary. Engine lubricants are composed of a base fluid and various dissolved additives.
The base fluid determines the blend’s physical properties, such as rheology, volatility and
solvency, while the additives improve specific aspects, mainly chemical, of the lubricant
performance. It is possible that ethanol may influence lubrication due to its interaction with
the base oil or with the additives such as the friction modifier, the anti-wear additive and
the detergent.
One possibility is the fractionation of the ethanol diluted in the lubricant close to the
moving surfaces. A substance that is more polar than the base fluid such as ethanol can be
preferentially attracted to the lubricated surface by van der Waals forces. Therefore, a very
thin layer mainly composed of the more polar component in the base oil + ethanol mixture
may form very close to the surface, changing the near-surface viscosity. Guangteng and
Spikes ((19)) have demonstrated the impact of molecular fractionation of base fluid
mixtures on metal surfaces using ultrathin film interferometry and friction coefficient
measurements as a function of entrainment velocity. The authors showed that for blends of
high viscosity esters in low viscosity hydrocarbons, ester accumulation and consequent
viscosity increase at the near surface increased EHD film thickness so that the transition
between EHD and boundary lubrication occurred at lower entrainment velocities. For low
viscosity esters in higher viscosity hydrocarbons the opposite was observed.
7
Stribeck curves ((20)) are used to identify lubrication mechanisms as a function of load,
velocity, viscosity and surface roughness. They present friction coefficient as a function of
the non-dimensional parameter ηV/FN, where η is the lubricant viscosity, V is the
entrainment velocity and FN is the normal load. This parameter dictates hydrodynamic
film thickness, which, when compared with the surface roughness of the two surfaces
defines the lubrication regime, varying from full-film hydrodynamic regime to mixed and
then to boundary lubrication as the value of the parameter is reduced. If ethanol
fractionation occurs, this may shift the transition between mixed lubrication and boundary
lubrication to conditions where mixed lubrication is normally expected to occur, since
ethanol has a viscosity much lower than the lubricant.
As well as their possible impact on hydrodynamic film thickness, it is also quite likely that
ethanol or its water component will influence the formation of boundary lubricating films.
Friction modifier and antiwear additives are used in engine oils to reduce boundary friction
and wear respectively. Both function by forming adsorbed or reacted protective films that
serve to prevent direct contact between opposing, rubbing ferrous surfaces when the latter
are not separated by a hydrodynamic oil film. In order to adsorb on metal surfaces these
additives are more polar than the base oil and it is possible that ethanol and water, which
are both very polar, may competitively adsorb on surfaces, or even solubilise additive
boundary films that form on these surfaces.
8
MATERIALS AND METHODS
Materials
Both engine oil and its corresponding base oils were studied in order to separate the effects
of ethanol on the base oil from its interactions with additives present in fully formulated oil.
A Group I base oil was selected, since this is the main base oil currently used in Brazil for
the production of lubricants. For comparison, film thickness measurements were also
carried out using a Group II base oil.
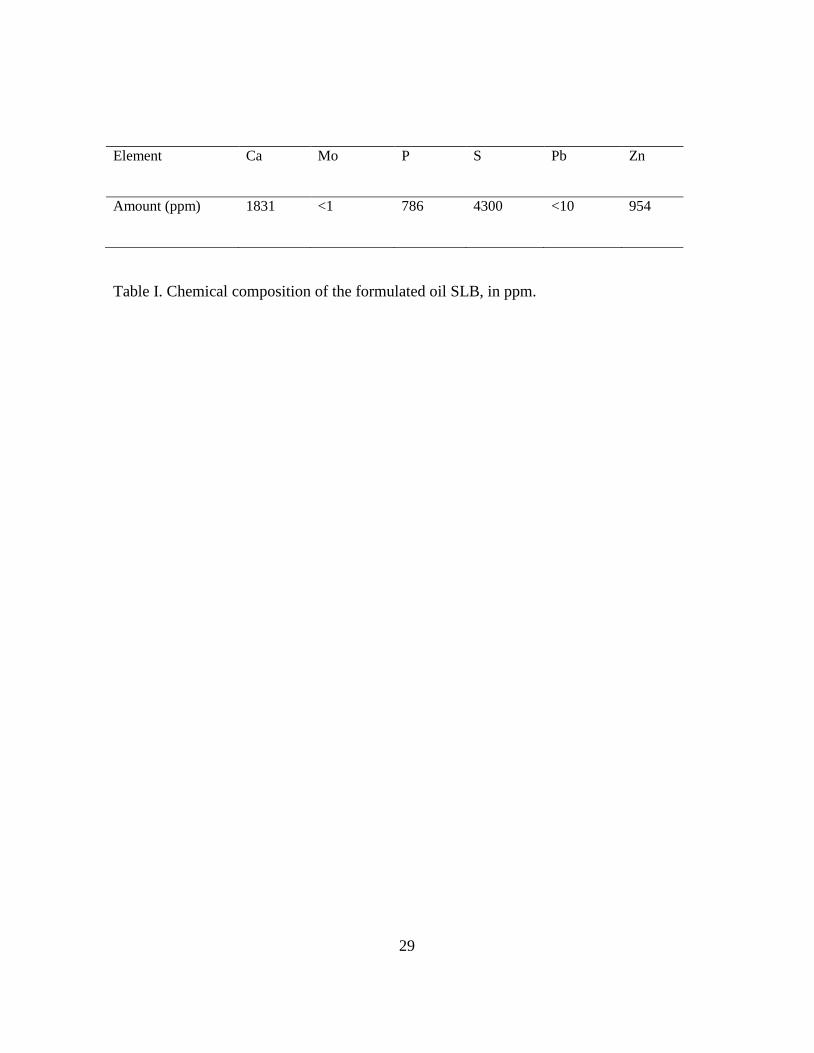
The formulated oil was SL classification without friction modifiers and is denoted SLB in
this paper. The main metallic components in this oil are listed in Table I. They suggest the
presence of a zinc dithiophosphate-based anti-wear additive and a calcium sulphonate-
based detergent.
Small amounts of ethanol were added to the lubricants to investigate the effects of ethanol
contamination. For tests with the base oils, the amount was 2%wt., but the measurement of
the amount of ethanol at the end of the tests (see section 2.4) showed a considerable
reduction of the amount of ethanol during high temperature tests and therefore this amount
was increased to 5% wt. for the formulated oil.
In Brazil, hydrated ethanol produced via sugar cane sugar fermentation is used in flex-fuel
engines. However, when added to gasoline, such as in E85, anhydrous ethanol is employed,
since water is not soluble in gasoline. The effect of the water present in hydrated ethanol
was evaluated by carrying out tests with both hydrated (HE) and anhydrous ethanol (AE).
9
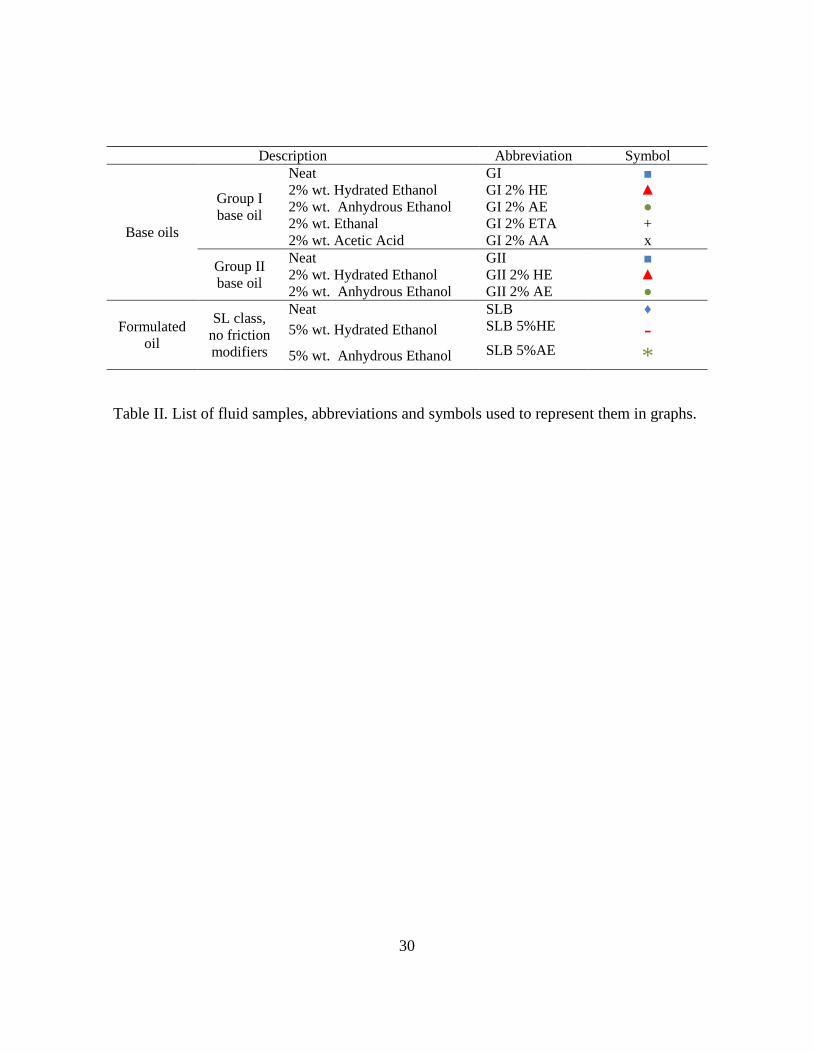
All the fluid samples investigated in this work, their abbreviations used throughout the
paper and the symbols used to represent them in the graphs shown in the Results sections
are presented in Table II. This table also shows the addition of ethanal (ETA) and acetic
acid (AA) to Group I base oils, and refers to a few additional tests carried out to help
interpret the main results. Heating of capped vials containing samples of the blends on a hot
plate at different temperatures showed that 5% wt. of AE was soluble in base oil at both
40oC and 100oC, but that HE was insoluble at both temperatures. In the case of formulated
oil, 5% of AE was soluble at both 40oC and 100oC, but HE remained insoluble over the
whole temperature range.
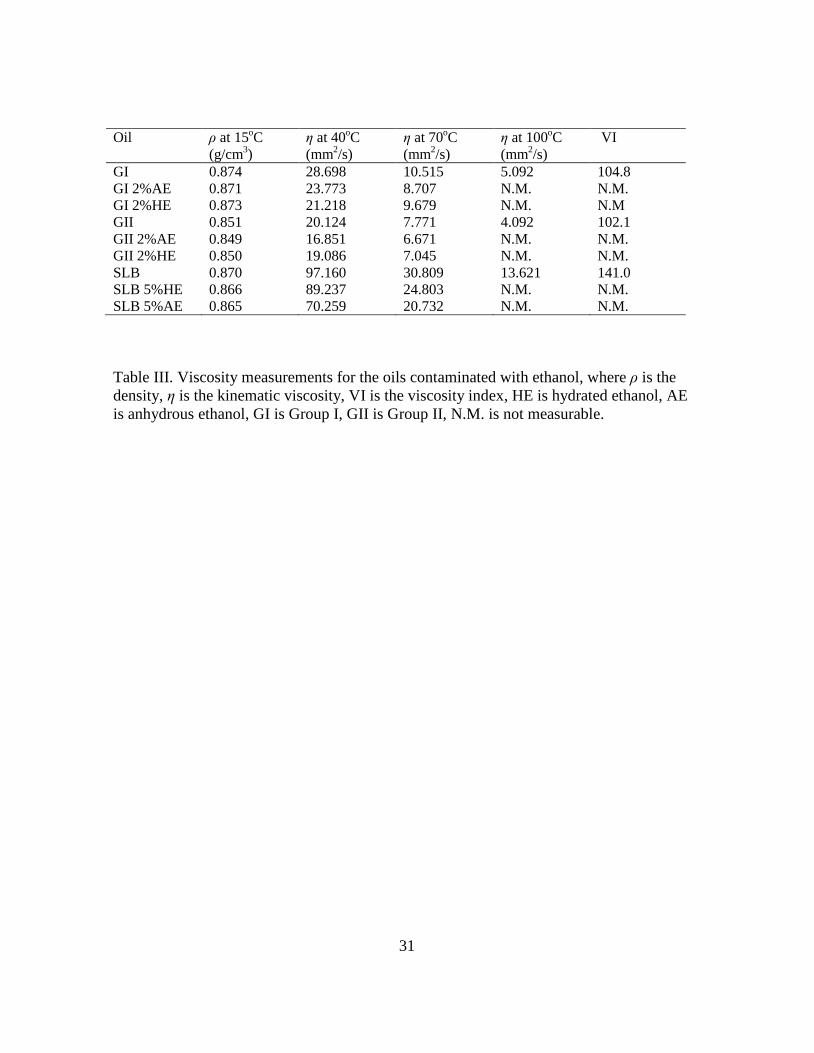
Viscosities and densities were measured for the oils and their blends with ethanol using a
SVM3000 Stabinger viscometer at the three test temperatures of 40oC, 70oC and 100oC.
Table III shows that the addition of HE reduced viscosity for the Group I and II base oils
and for the formulated oil at 40oC and 70oC. At 100oC, it was not possible to measure the
viscosity of the mixtures containing ethanol due to the formation of a large number of
bubbles in the measurement tube, probably resulting from evaporation of ethanol. AE,
when added to the oils, reduced viscosity more than HE.
EHL Film Thickness Measurements
Ultrathin interferometry was used to measure EHL film thickness at different rolling speeds
and temperatures for the oils and their blends with ethanol. A contact is formed between the
flat surface of a glass disc and a reflective steel ball. The glass disc is sputter-coated with a
thin, semi-reflecting layer of chromium, and subsequently with a thin silica spacer layer.
Some of the white light shone into the contact is reflected from the chromium layer whilst
10
some passes through the spacer layer and any lubricant film present before being reflected
from the steel ball. The two beams recombine and optically interfere. The interfered light
from a strip across the contact is then passed into a spectrometer where it is dispersed by
wavelength and detected by a solid-state, black and white TV camera. A frame grabber is
used to capture this image and a microcomputer program determines the wavelength of
maximum constructive interference either in the central region of the contact or as a profile
across the contact. The lubricant film thickness is then calculated from the difference
between the measured film thickness and the thickness of the silica spacer layer at the
position of image capture (Johnston, et al. (21)).
Both ball and disc can be independently driven, but in this work the disc was rotated and
drove the ball in nominally pure rolling. AISI 52100 steel balls of diameter 19 mm and
nominal root mean square surface roughness Rq between 10 to13 nm were used. The
applied load was 20 N, which produces a maximum contact pressure of 0.52 GPa. A new
steel ball was used for each test. Disc, ball and test chamber were thoroughly rinsed using
Analar toluene followed by Analar isopropanol prior to each test.
The test sequence was as follows: first, a test was carried out at 40oC, followed by a test at
100oC within the same test sequence, i.e., the balls and disk were not cleaned between the
tests at 40oC and 100oC, nor was the lubricant sample changed. In the tests, mean rolling
speed was increased from 1 mm/s to 1000 mm/s in 31 stages. At each speed stage, at least
three film thickness values were measured successively and averaged. For all of the
samples tested in this work, at least three repeat tests were carried out.
11
Friction Measurements
Friction tests were carried out using a Mini Traction Machine (MTM) ball on disk test. Ball
and disc are driven by two independent DC motors so that any combination of rolling and
sliding can be obtained. In this study, friction was measured over a range of entrainment
speeds (mean rolling speed) at a fixed slide roll ratio (SRR) to obtain Stribeck curves. SRR,
which was held constant at a value of 50%, is defined as (Uball-Udisk)/U, where |Uball – Udisk|
is the sliding speed and U is the entrainment or mean rolling speed, given by U = (Uball +
Udisk)/2. When SRR = 0% (i.e. Uball = Udisk), pure rolling contact occurs and when SRR =
200% (i.e. either Uball or Udisk =0), pure sliding contact occurs, while values between 0 and
200% represent mixed sliding/rolling contact (Lee, et al. (22)). The tests started at a mean
rolling speed of 1000 mm/s, which was continuously reduced (in 31 logarithmically-spaced
stages) down to 1 mm/s. The disc was fully-immersed in lubricant and the temperature of
the lubricant and contact was controlled to a set value within ± 0.5 oC. Set temperatures of
40oC, 70oC and 100oC were studied. The balls were AISI 52100 bearing steel with
diameter 19 mm, Young’s modulus 210 GPa and nominal Rq between 10 and13 nm while
the discs were AISI 52100 steel with nominal Rq between 25 and30 nm. The load applied
was 20 N, corresponding to a maximum Hertz pressure of 0.82 GPa. Fresh balls and disks
were used in each test, which were ultrasonically cleaned in Analar toluene followed by
Analar acetone prior to a test. The rig was cleaned using toluene followed by Analar
isopropanol before each test. The choice of temperatures for the tests tried to cover a range
that was relevant during the use of car engines, but that could still allow some ethanol to be
retained in the lubricant.
12
Measurement of the Amount of Ethanol in the Lubricant
Since the evaporation point of ethanol is relatively low (69oC), it was necessary to evaluate
if some ethanol remained in the lubricant at the end of the tests when they were carried out
at higher temperatures.
Due to the low molecular weight and high polarity of ethanol, it can be extracted from the
lubricant after the tests by aqueous extraction (Pauls and McCoy (23)). For this, 12 ml of
the oil sampled after the tests were accurately weighed into a vial and 2 ml of distilled
water were added. The vial was capped and shaken gently to avoid emulsification. After the
phases separated, the bottom aqueous layer was sampled using a clean syringe. After
sampling of the water layer, refractive index measurements were used to assess the amount
of ethanol in the water. Refractive index measurements are very simple, fast and precise
and small amounts of ethanol can produce measurable variations in the refractive index of
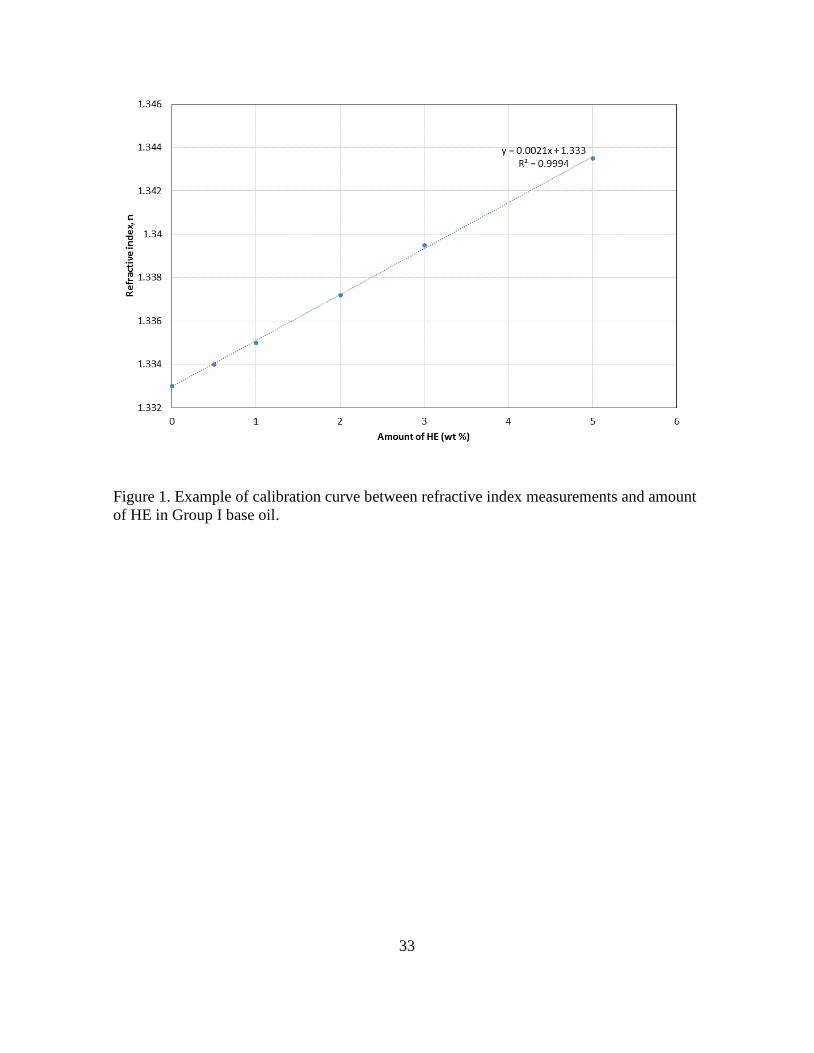
distilled water (Nowakowska (24)). Calibration of the procedure was carried out by
measuring refractive index of the bottom aqueous layer of mixtures of 12 ml of lubricant
containing 0%, 0.5%, 1%, 2%, 3% and 5% wt. of ethanol (AE and HE) with 2 ml of
distilled water, using the above procedure. All refractive index measurements were
performed at 30oC. An example of a calibration curve is shown in Figure 1 for different
additions of hydrated ethanol to the Group I base oil.
13
RESULTS
Influence of Ethanol on EHL Film Thickness Behaviour of Base and Formulated Oils
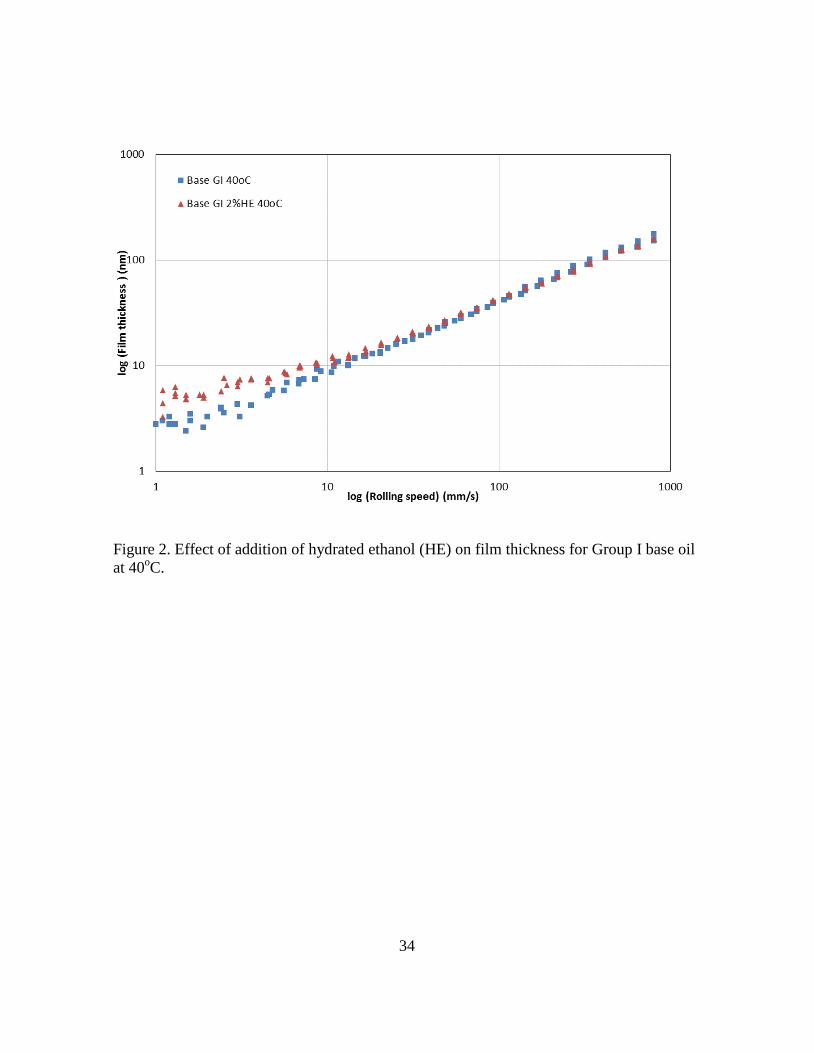
Figure 2 plots log (film thickness) vs. log (entrainment speed) to analyse the effect of
adding 2% of hydrated ethanol (HE) to a group I base oil at 40oC. The base oil shows an
approximately linear relationship between log (film thickness) and log (entrainment speed)
for the whole range of speeds tested, in accord with EHD theory. When HE ethanol is
added, a slightly thicker film is observed at low speeds (less than around 10 mm/s), where
mixed and boundary lubrication prevails.
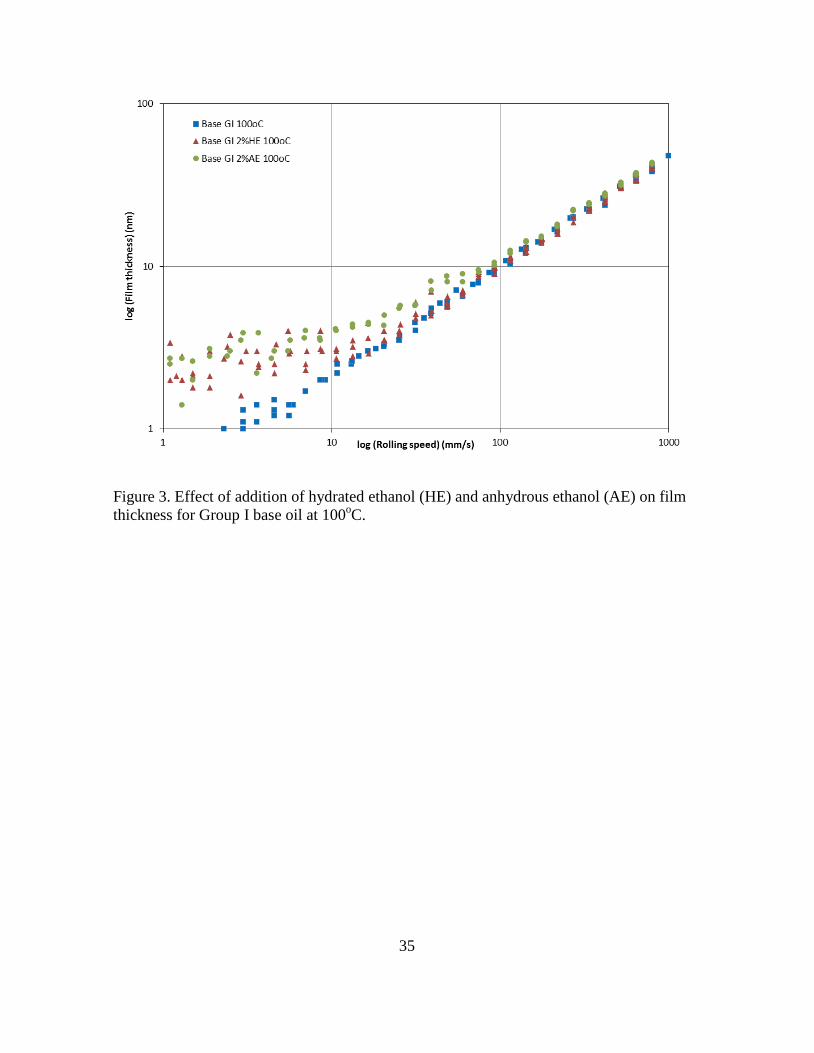
In Figure 3, the effect of the addition of both HE and anhydrous ethanol (AE) on film
thickness is shown for tests at 100oC. Both AE and HE generate a thin boundary film,
between 2 and 5 nm thick, which is not present with the ethanol-free base oil. Also, results
of film thickness when ethanol was added were more scattered than for the ethanol-free
base oil.
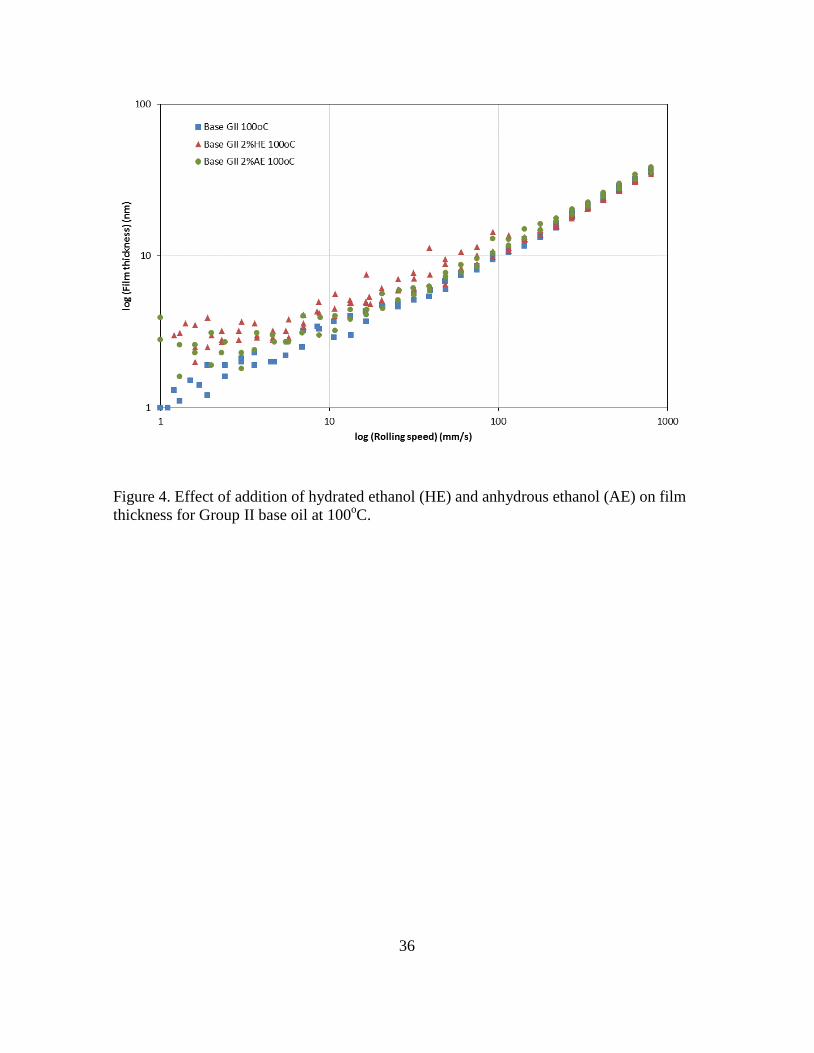
For comparison, AE and HE were also added to a group II base oil and the results for tests
at 100oC are shown in Figure 4. This figure again shows that both AE and HE produce
thicker films in the low speed region than the base oil and more scattered results when
ethanol was present in the lubricant. However, the effects of HE and AE are retained up to
a higher rolling speed.
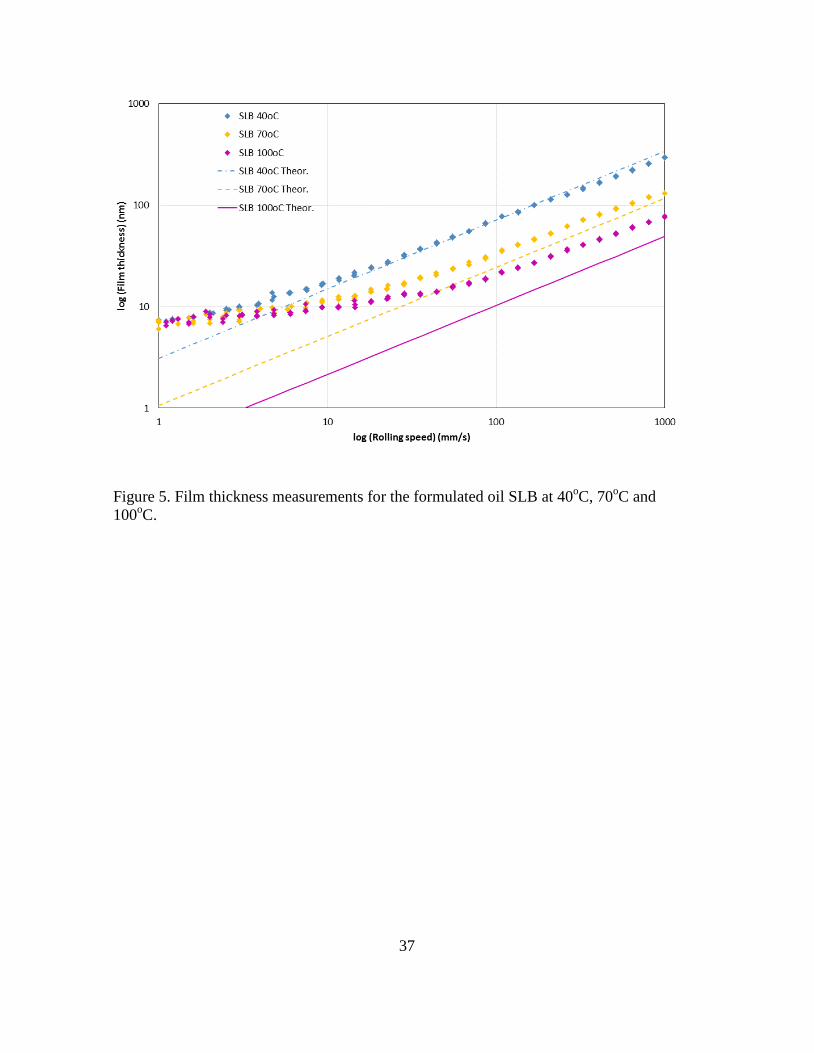
For the formulated oil, film thickness measurements at temperatures of 40oC, 70oC and
100oC are shown initially, in order to understand the behaviour of the formulated oil
without ethanol contamination (Figure 5). This figure also shows plots of the predicted film
14
thickness for each temperature based on the Hamrock and Dowson equation for an EHL
elliptical contact (Hamrock and Dowson (25)). The values for the pressure-viscosity
coefficients were estimated from (Linde (8)), while Esteel = 203 GPa, Esilica = 72 GPa, 𝜐steel =
0.3, 𝜐silica = 0.2 (Lee, et al. (22)). The experimental results suggest the formation of a
boundary film of thickness ca 8-9 nm at all temperatures tested. Comparison with the
theoretical curves show that at 40oC the measured values agree well with the predictions at
the higher speeds. When the temperature increases and therefore film thickness decreases,
the measured values are higher than the predicted, but the difference reduces as the speed
increases and remains approximately 10 nm. This suggests that the boundary film remains
on the sliding surfaces at relatively high speeds.
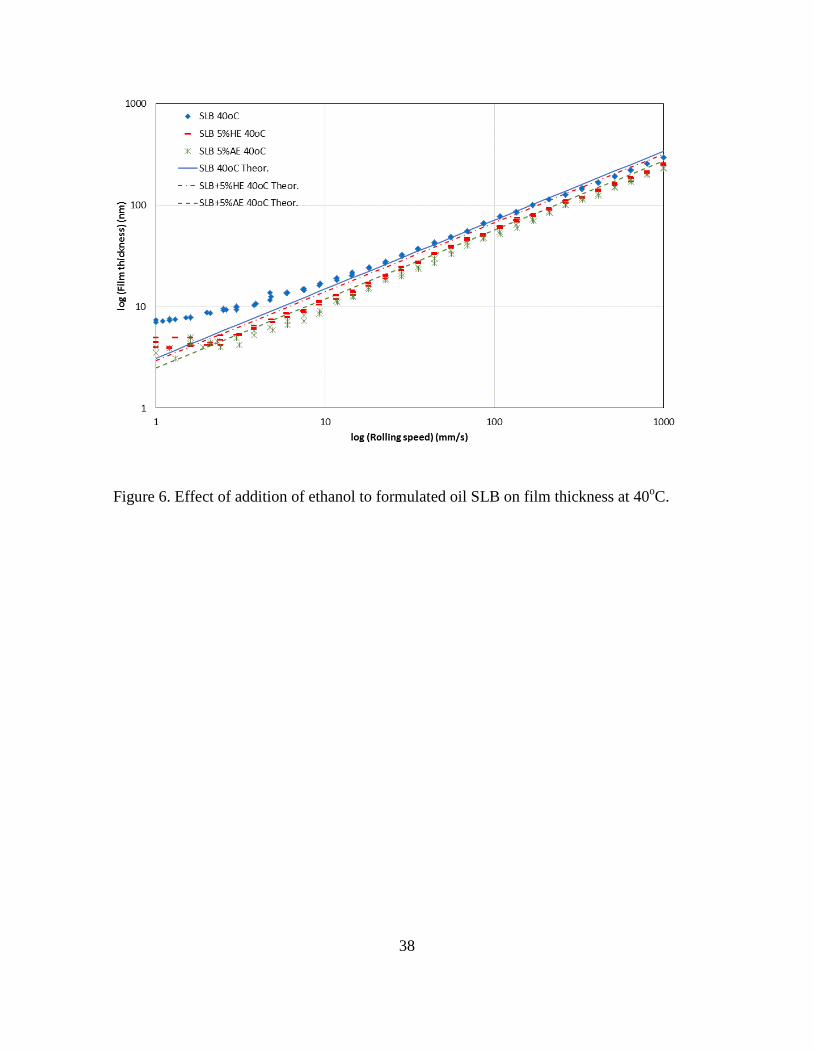
Figure 6 shows that the addition of ethanol reduces film thickness of the formulated oil for
the whole range of speeds investigated. The reduction in film thickness in the mixed and
full film lubrication regimes is slightly larger for AE than for HE, which agrees with the
viscosity measurements of the mixtures. In the boundary regime, a thinner boundary layer
is present than seen with the formulated oil for both AE and HE. Comparison of the
measured values with predicted EHD film thicknesses using the measured viscosities
suggests that when ethanol is added the measured and predicted values are close, although
the measured values are slightly lower. It is probable that the slight differences must be due
to the impact of dissolved ethanol on viscosity-pressure coefficient. The measured values
only deviate from a straight line at very low speeds, below 3 mm/s, where a thin boundary
film of around 3 to 5 nm is seen, similar to the behaviour found for the base oil. These
15
results suggest that the presence of ethanol inhibits the formation of the thick boundary film
otherwise formed for the formulated oil, but still allows a thin boundary layer.
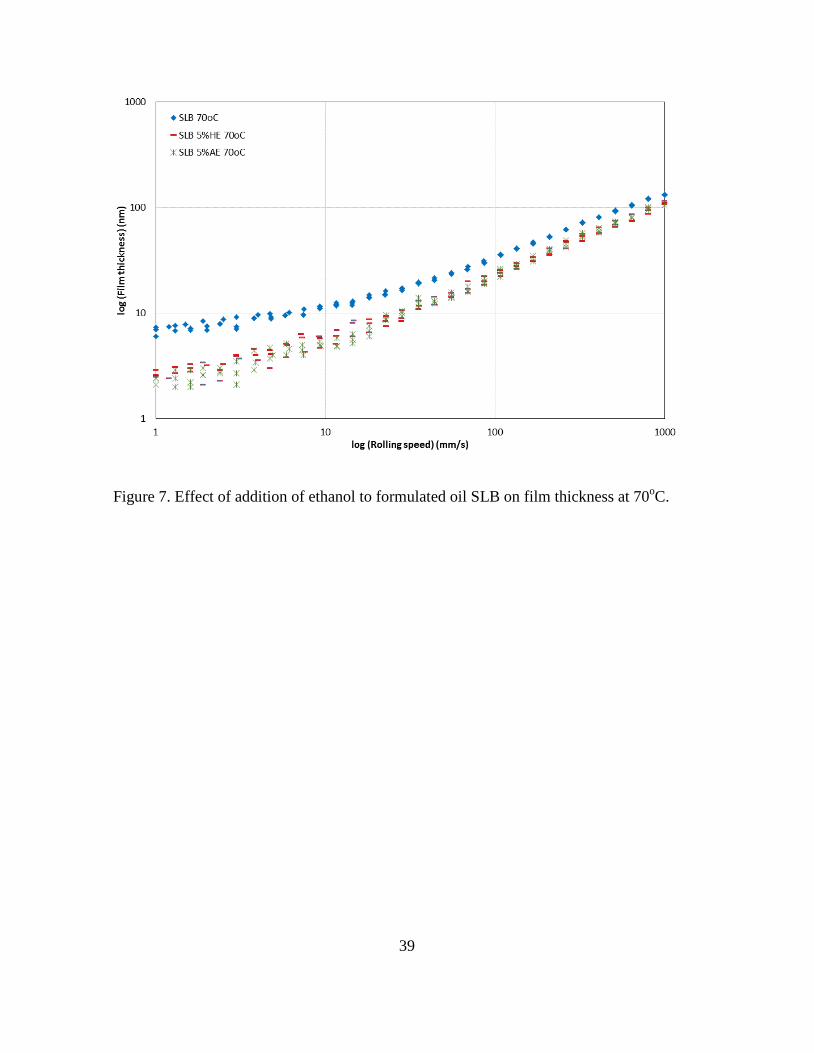
A similar influence of the addition of AE and HE was found at 70oC, as shown in Figure 7.
At this temperature, no difference between AE and HE could be detected for the highest
speeds.
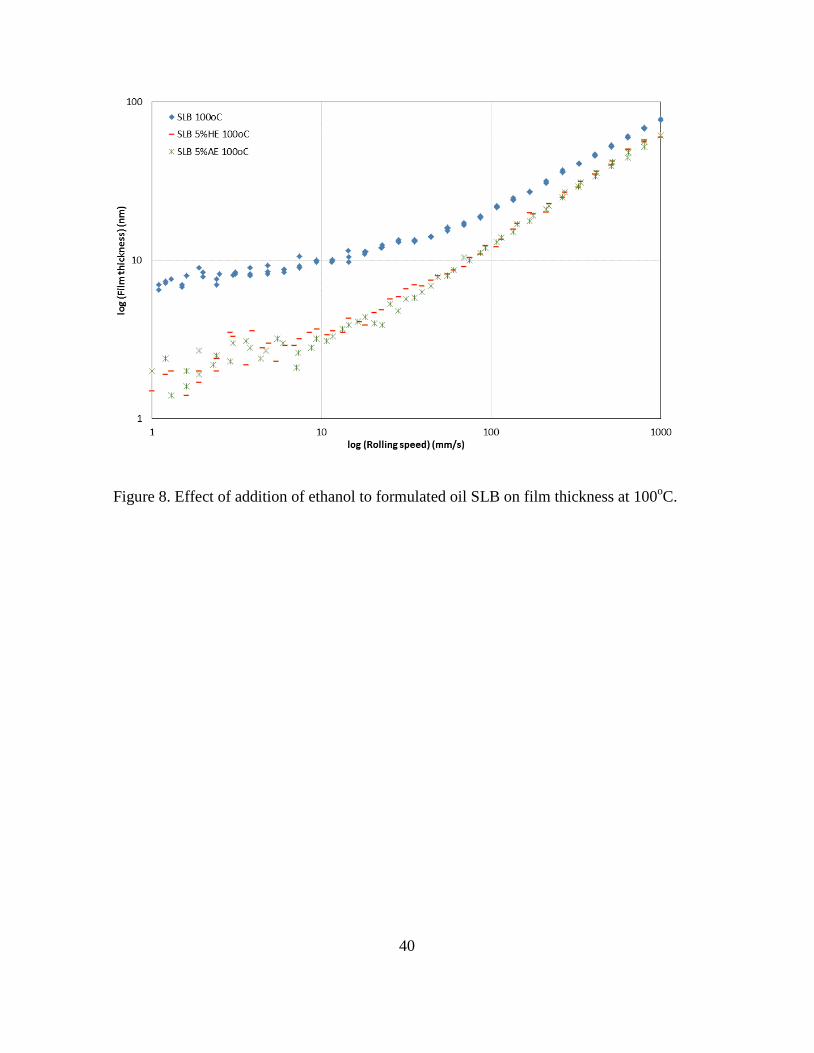
At 100oC, again both AE and HE reduce film thickness for the whole range of speeds
investigated, but no difference was detected between HE and AE, as shown in Figure 8.
Also, film thickness values for the lubricant containing ethanol were fairly more scattered,
as observed for the base oils.
Influence of Ethanol on Stribeck Friction Curves for Base and Formulated Oils
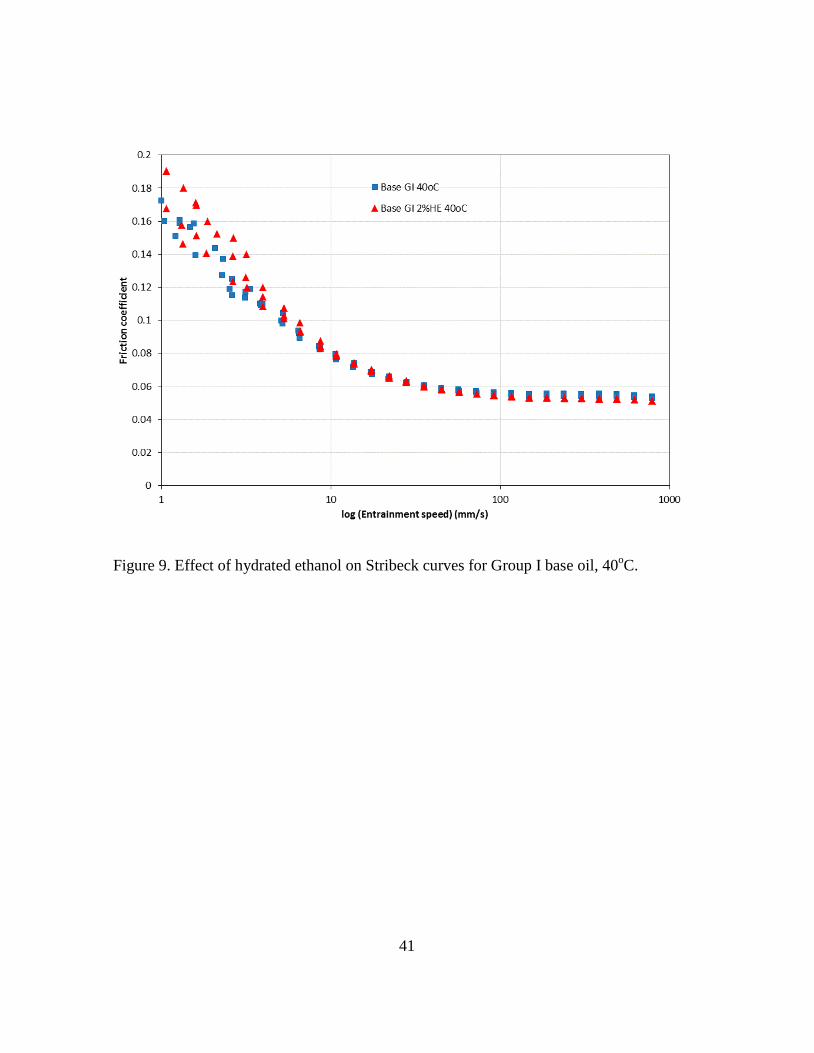
Figure 9 shows a plot of friction coefficient vs. log (entrainment speed) at 40oC (Stribeck
curve) comparing a Group I base oil and a mixture containing 2% HE. At high speeds, an
approximately constant plateau is reached, where friction is independent of the entrainment
speed. In this region, a slight reduction is observed in the friction coefficient when ethanol
is added. Film thickness measurements at 40oC under pure rolling showed a slightly thinner
film in the high speed region for the mixture with ethanol, which probably justifies the
friction reduction. In the region of intermediate speeds (mixed lubrication), the mixture
with HE presents slightly higher friction, but the difference is very small. The boundary
lubrication regime does not seem to have been fully achieved at this temperature at the
lowest speeds attained, so no significant effect of the addition of hydrated ethanol was
observed at the lowest speeds.
16
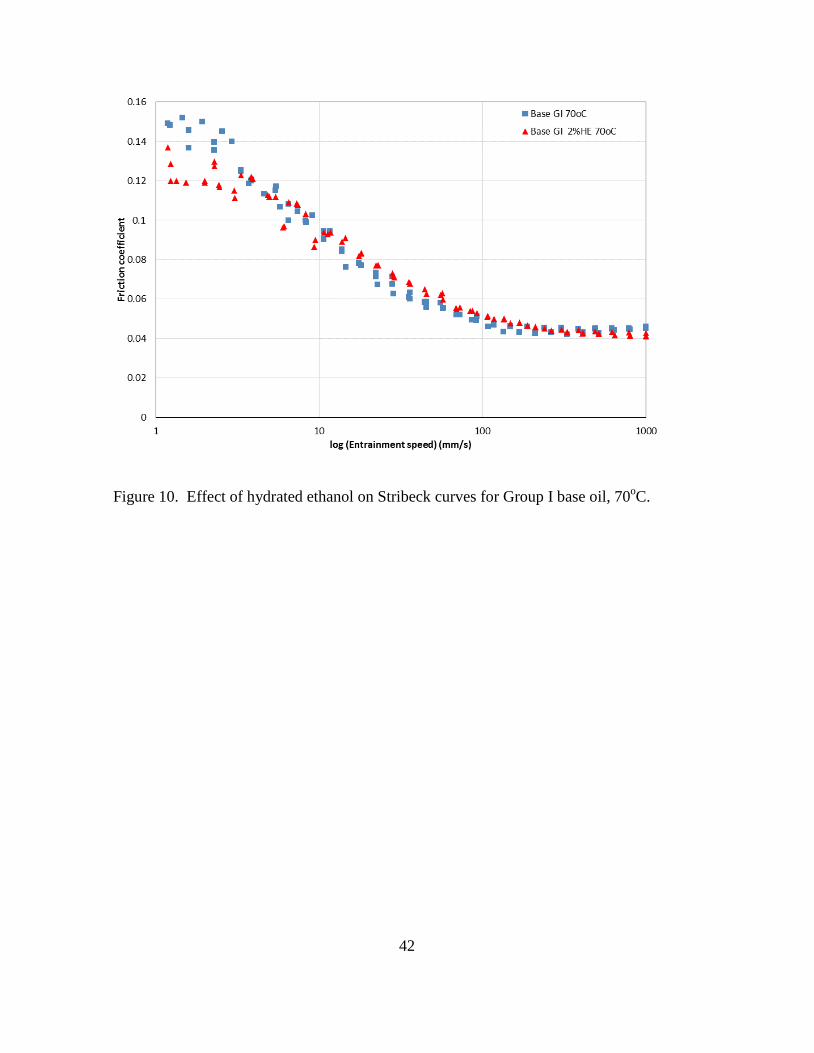
At 70oC (Figure 10), the addition of HE caused a slight increase in friction in the mixed
lubrication regime. The thinner film due to the decrease in viscosity may cause more
contact between the asperities of the surfaces, which could explain the slight increase in
friction coefficient. At the lowest speeds, the presence of HE decreased friction
coefficients slightly, suggesting the formation of a boundary film.
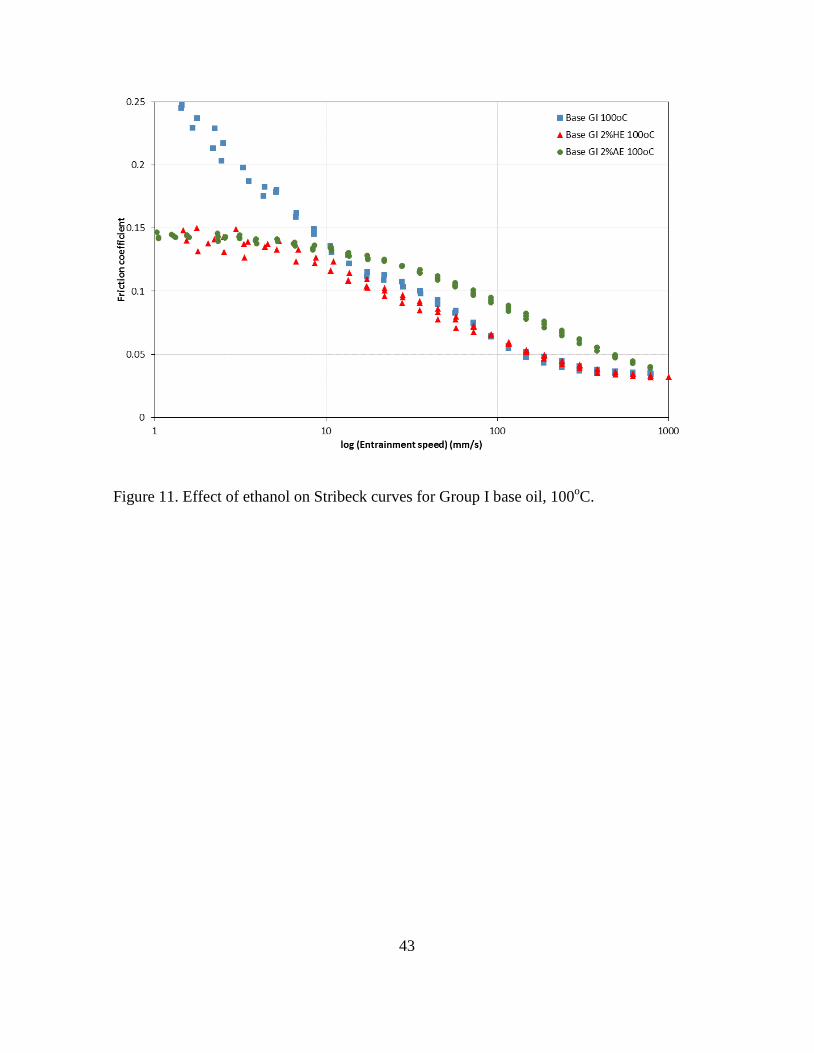
Stribeck curves obtained at 100oC are shown in Figure 11. The base oil approaches a
plateau, corresponding to full film EHD lubrication, at the highest speeds, but friction
coefficient increases as the speed reduced indicating mixed lubrication. The addition of HE
has no effect on friction coefficient at high speeds, but for AE a plateau was no longer
detected for the highest speeds. It appears that the transition from full film EHD lubrication
to mixed lubrication occurs at a higher speed for the blend with AE than for the base oil or
the HE blend. This probably originates from the lower viscosity of the AE blend, which
leads to thinner films and therefore more asperity contact. At low speeds, the formation of a
boundary film that stabilizes friction coefficient at around 0.15 is very clear for both HE
and AE, and is not present for the base oil.
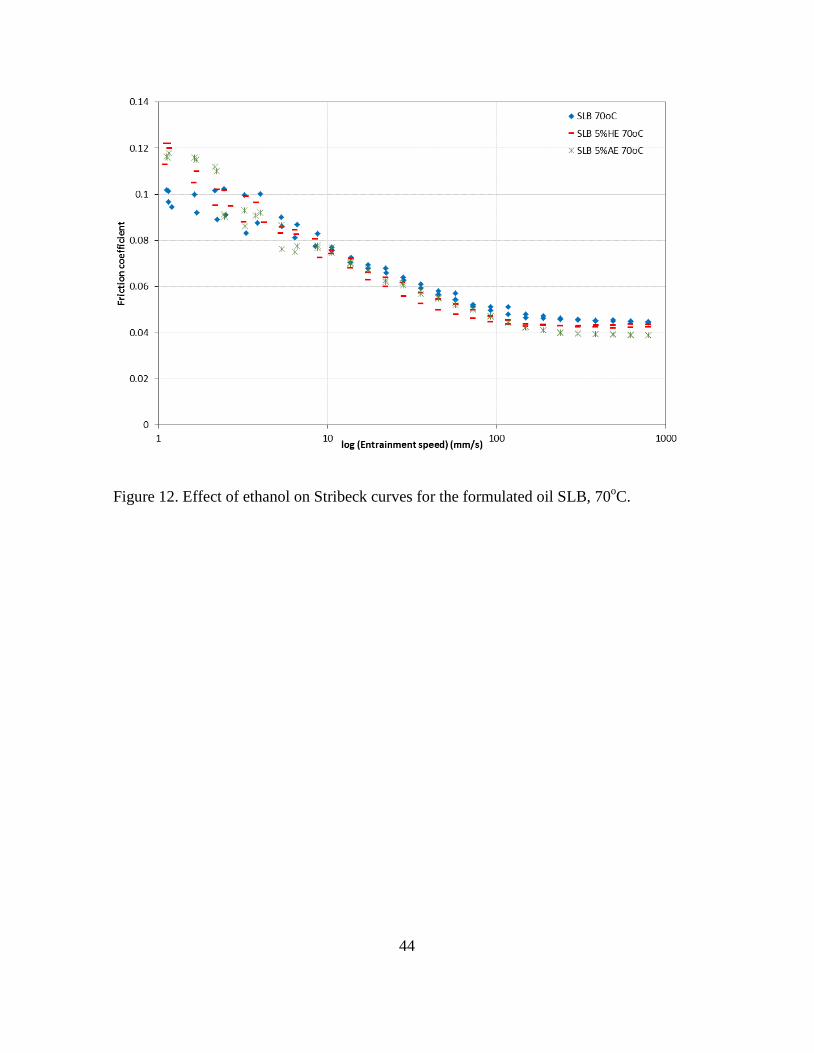
The effects of ethanol contamination on friction for the formulated oils were similar to
those observed for the base oils under conditions where full film or mixed lubrication
prevailed, but different in the boundary lubrication regime. As examples, the effects of
ethanol contamination on Stribeck curves for the formulated oil SLB at 70oC (Figure 12)
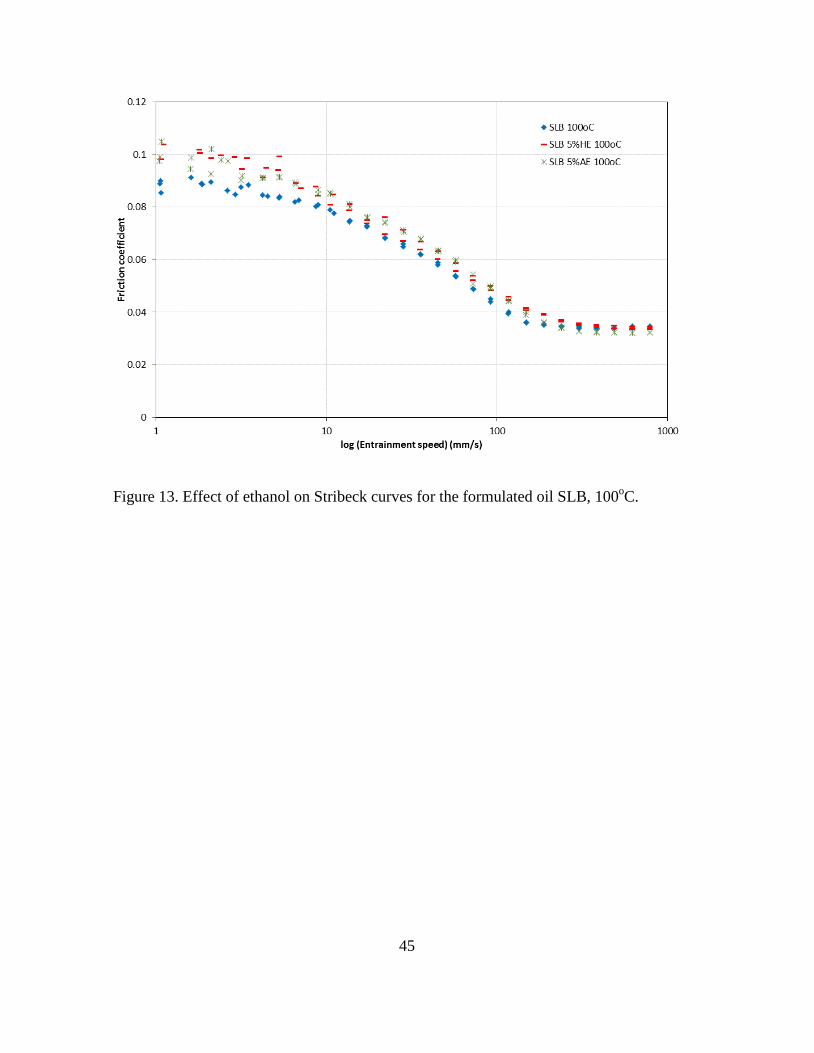
and 100oC (Figure 13) are presented.
At 70oC (Figure 12), the addition of ethanol reduced friction coefficients in the high speed
region, where a plateau is reached. The reduction in friction coefficient follows the
17
reduction in viscosity, which was greater for AE blend than for HE blend, as observed for
the base oils. However, in the low speed range, where boundary lubrication occurs, HE
increased friction. The EHD tests under pure rolling showed a thinner boundary film in the
presence of ethanol. Therefore, ethanol seems to interfere with the formation of the
boundary layer, leading to a thinner boundary film and also to higher friction.
At 100oC (Figure 13), in the region of mixed lubrication, the addition of ethanol increases
friction and the increase is slightly higher for AE than for HE. This can be attributed to the
reduction in viscosity caused by the presence of AE and HE, because thinner films enable
more metal contact. AE and HE appear to suppress some boundary film formation, slightly
increasing friction coefficient at low speeds, as seen for tests both at 70oC (Figure 12) and
100oC (Figure 13).
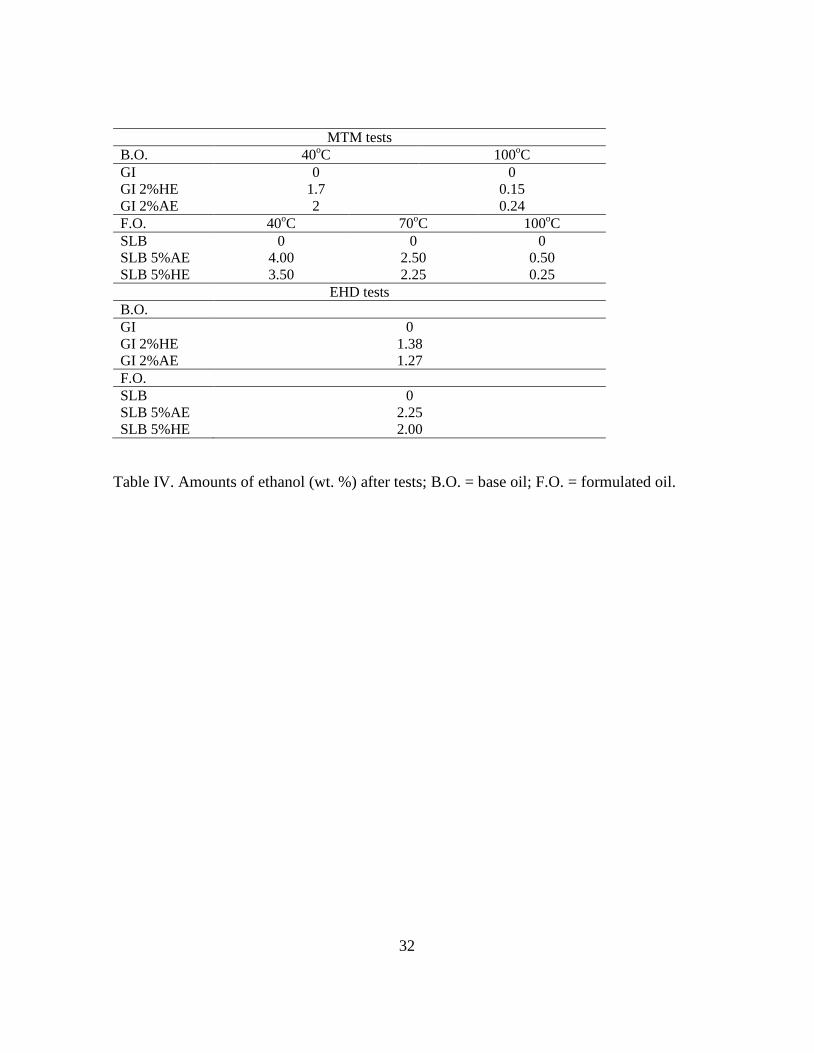
Amount of Ethanol after the Tests
At the end of each test the amount of ethanol present in the lubricant was determined using
refractive index measurements of the ethanol extracted with water, as described in Section
3.4. The results are shown in Table IV.
Measurements were also carried out on the ethanol-free oils after testing. All of the latter
gave the same value of 1.3330, which is the value of the refractive index of distilled water
found in the literature (Nowakowska (24)).
For the EHD tests there was some loss of ethanol at 100oC but more than half of the ethanol
content remained to the end of the tests. This is because the EHD test apparatus had a good
seal and the volume of oil used during the tests was relatively large (around 150 ml). The
18
reduction in the amount of ethanol due to evaporation during the MTM tests at 100oC was
much higher than for the EHD tests. This emphasizes the importance of running tests at
intermediate temperatures, such as 70oC, which is just above the evaporation point of
ethanol, and yet high enough for some of the antiwear additive present in the formulated
oil to be effective.
DISCUSSION
The results show that the effect of contamination with ethanol on friction and film thickness
is similar for the base oil and for the formulated oil when the contact operates in mixed
and/or full film lubrication. On the other hand, in the boundary lubrication regime, the
effect of the presence of ethanol in the base oil is very different from that in the formulated
oil. The two different situations are discussed in this section.
When ethanol is added to the base oil and to the formulated oil, it reduces friction at high
speeds in the full film EHD lubrication regime characterised by the friction levelling out at
a relatively low value (µL) (Evans and Johnson (26, Evans and Johnson (27)). Under these
conditions, friction depends only on the molecular structure of the lubricant and its free
volume. In general, the reduction in µL was found to be higher for AE than for HE, while
measurements also showed lower viscosities for blends with AE than with HE. This
suggests that the addition of ethanol confers a greater free volume, enabling lubricant
molecules slide more easily in relation to each other, reducing both viscosity and µL and
that this effect is more significant for AE than for HE. Although the viscosity of pure
ethanol is higher than that of water, we hypothesize that when both water and ethanol are
19
present the true solubility of the ethanol in hydrocarbon is reduced, resulting in some of the
ethanol being present as a microemulsion, thereby having little influence on viscosity.
However, this effect needs to be further investigated and explained.
(De Silva, et al. (15)) also detected a small reduction of mean friction coefficient measured
in lubricated reciprocating tests due to the presence of ethanol and water in a fully
formulated oil. However, since the authors measured mean friction coefficient, it was not
possible to identify if this reduction occurred in the middle of the stroke, where a full film
may be present, or in reversal regions where mixed and/or boundary lubrication prevails.
Also, since only formulated oil was studied it was not possible to identify the extent to
which the interaction of ethanol occurred with the base oil or with additives present in a
fully formulated oil, such as detergents, anti-wear additives and friction modifiers.
In the MTM tests, as speed and thus EHD film thickness is reduced, friction increased for
all the fluids tested, as the contact enters the mixed lubrication regime. In this region, the
addition of ethanol increases friction coefficient compared to the ethanol-free fluids, both
for the base oil and for the formulated oil. Also, a slight reduction in film thickness in pure
rolling was detected due to the addition of ethanol to the base oils and to the formulated oil
for tests conducted at lower temperature and higher rolling speeds. This film thickness
reduction seems then to be related to the reduction in the viscosity of the lubricant due to
the presence of ethanol, which was more significant for AE than for HE. Thinner films may
cause more contact between the asperities of the surfaces, which may explain the increase
in friction coefficient observed, in particular, with AE.
20
At very low speeds, especially when combined with higher temperatures, and therefore
very thin EHL films, the presence of ethanol seems to promote the formation of a boundary
layer that is not present for the ethanol-free base oils under pure rolling. Also, Stribeck
curves showed a small reduction of friction in the regions of very thin EHL film thickness
when ethanol is present in the base oil, also suggesting the formation of a boundary film.
One possible explanation of the formation of a boundary layer due to the addition of
ethanol could be the fractionation of ethanol to the metallic surfaces, due to its higher
polarity when compared with the base oil lubricant. However, since ethanol is less viscous
than the oil, the boundary layer should be thinner. Therefore, the hypothesis of fractionation
of ethanol molecules to the metal surface due to their higher polarity must be discarded.
Another possibility could be reaction or deposition of oxidation products on the hot metal
surface. In order to investigate this, some film thickness measurements were carried out in
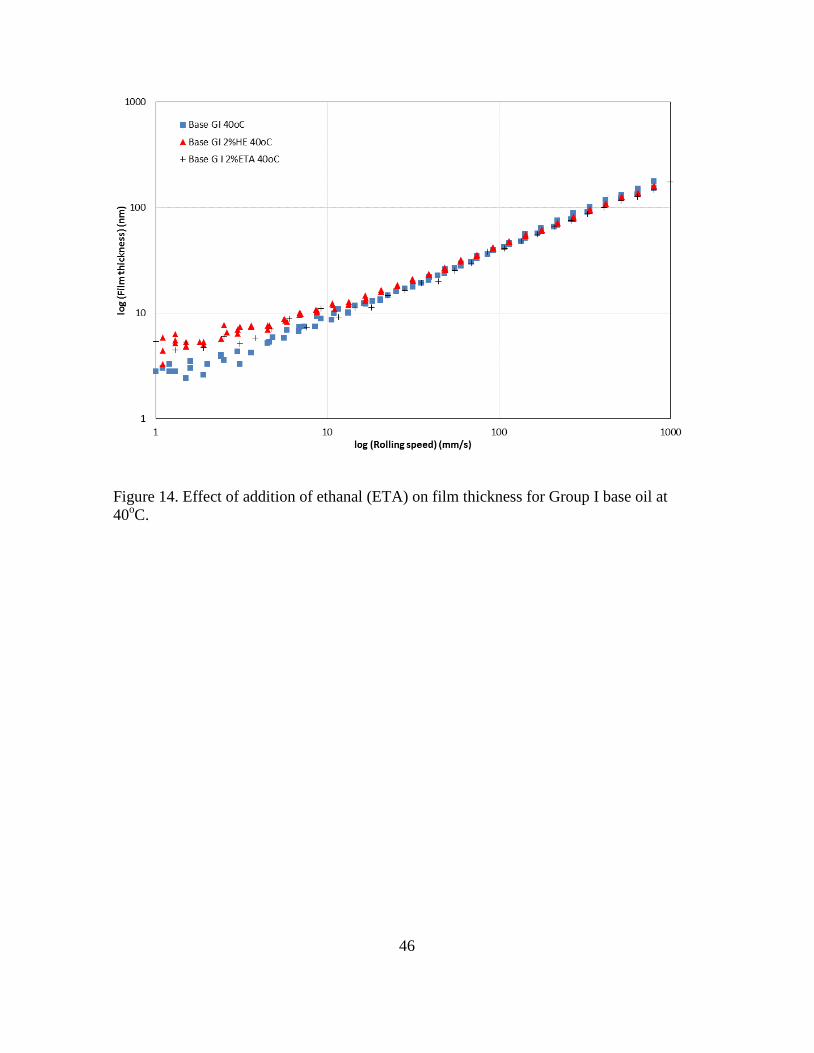
which small amounts (2%wt.) of ethanal (ETA), which is the first, and acetic acid (AA),
which is the second oxidation product of ethanol, were added to the Group I base oil. Both
ethanal and acetic acid were soluble in this base oil at room temperature. The results are
shown in Figures 14 and 15 for tests at 40oC and 100oC, respectively.
At 40oC, the reduction in film thickness due to the addition of ethanal in the full film region
was slightly larger than that due to the addition of ethanol, as shown in Figure 14.
However, in the boundary region, boundary films of similar thicknesses seem to form with
both hydrated ethanol and ethanal.
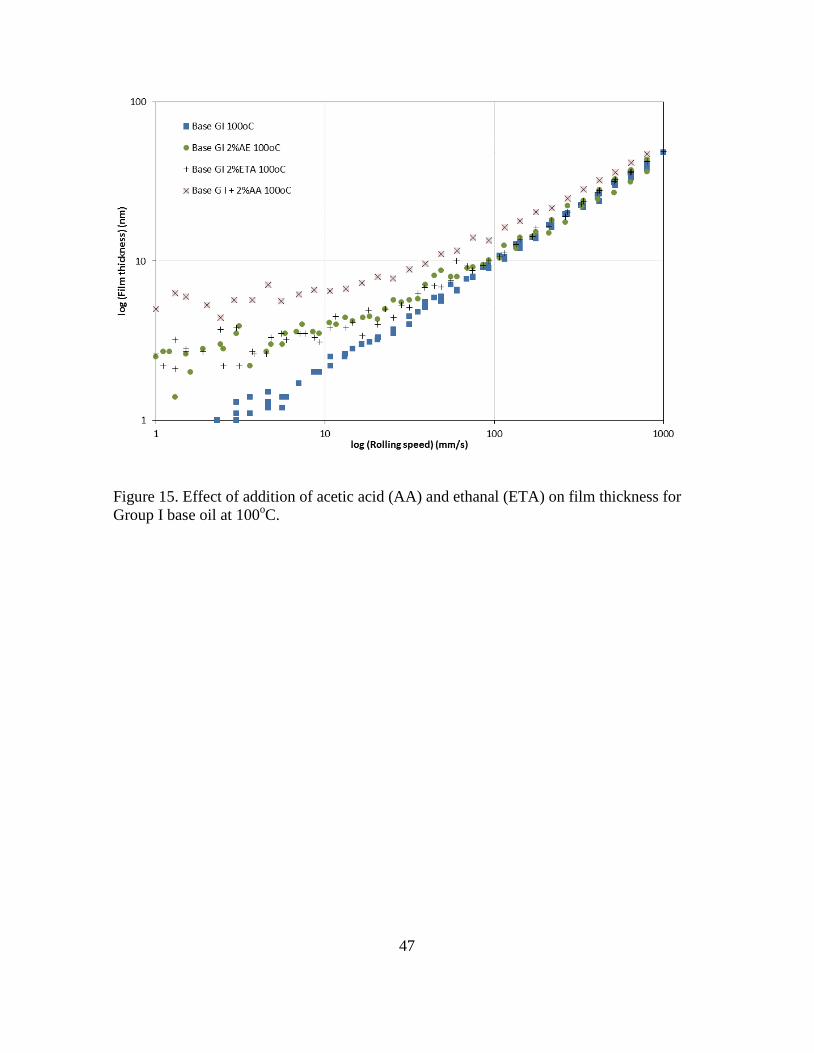
Figure 15 shows results at 100oC, for ethanal, acetic acid and anhydrous ethanol. The
effects of AE and ethanal were very similar. However, the addition of acetic acid produced
21
thicker films for the whole range of speeds tested. Also, apparent oxidation could be
observed on the balls after the tests.
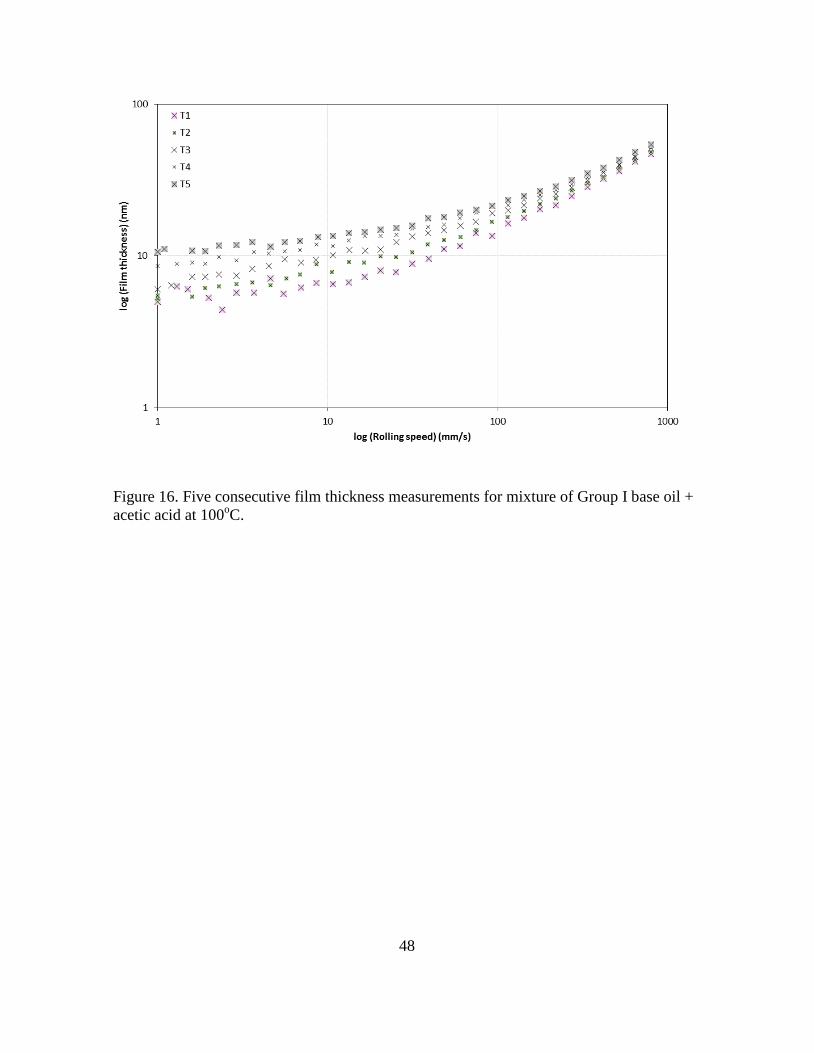
Another interesting feature with the addition of acetic acid is that when consecutive tests
were carried out using the same ball, disk and lubricant, film thickness increased
continuously from test to test for all speeds tested, as shown in Figure 16, where T1 to T5
are five consecutive tests on the same wear track. Also, the ball seemed severely oxidized
after the tests, suggesting the formation of an oxide film on the ball. In future work, surface
analysis would help determine the nature of the boundary film formed under these
conditions.
For the formulated oil, in the absence of ethanol, film thickness measurements show the
clear formation of a boundary film of thickness ca 9 nm. This forms at all temperatures and
is solid-like in the sense that it appears to continue to augment the film even at high speeds
when the overall film thickness is much greater than 9 nm. This film is almost certainly
produced mechanically by the adhesion and accumulation of overbased detergent particles
present in the oil, as described by (Topolovec-Miklozic, et al. (28)). Since calcium was
present in the oil as indicated in Table 1, it probably consists primarily of calcium
carbonate. Thick boundary films are also formed by the antiwear additive ZDDP , which
was also present in the formulated lubricant, but the formation of these generally requires
considerable sliding to take place (Fujita and Spikes (29)). Thick film formation by ZDDP
in nominally pure rolling conditions only occurs at temperatures well above 100oC (Gunsel,
et al. (30)).
22
The addition of both hydrated and anhydrous ethanol suppressed this thick boundary film
formation, suggesting that ethanol either solubilises the film or prevents the detergent
nanoparticless from adhering to the surfaces. To explore this further, two series of MTM
friction experiments were carried out at 100oC, where consecutive Stribeck curves were
obtained on the same wear track. Between each Stribeck curve, ball and disk were not
removed, but the lubricant was drained and fresh lubricant was added to the test chamber.
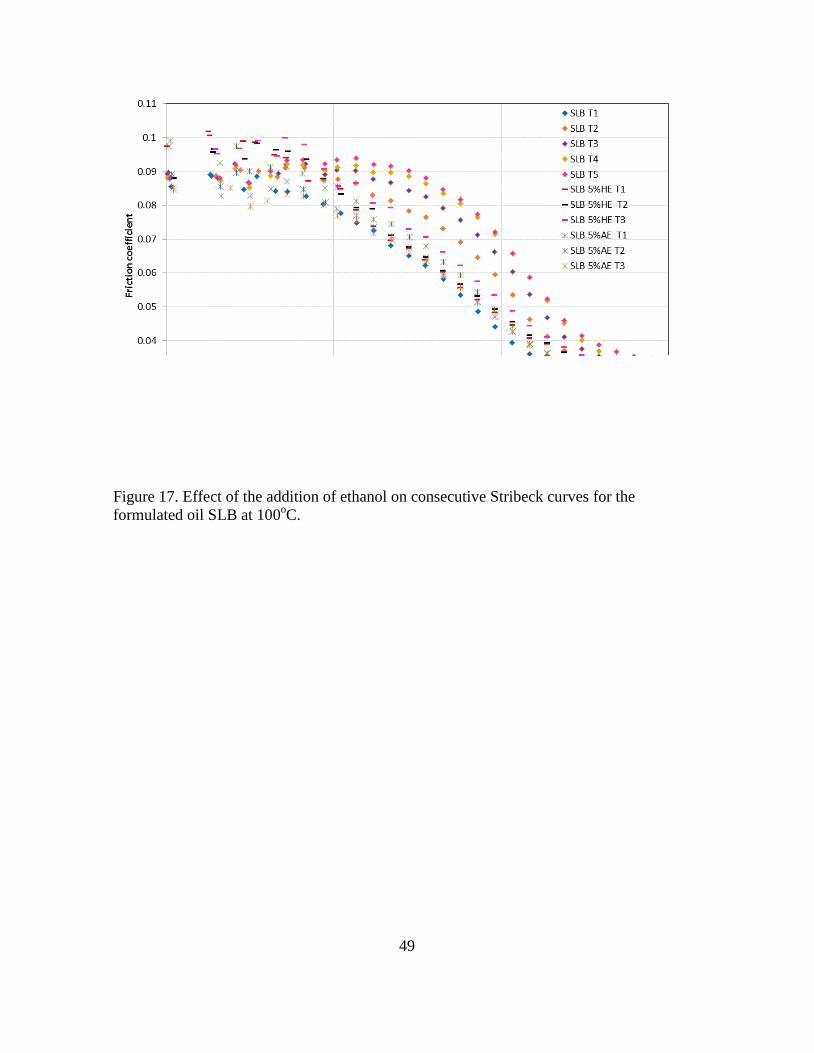
The results are shown in Figure 17.
For the ethanol-free formulated oil, a friction coefficient of around 0.09 is obtained in the
boundary regime, that does not vary during successive Stribeck curve measurements.
However, as consecutive curves are obtained, the Stribeck curves shift to the right, i.e., the
transition between boundary and full film lubrication occurs at progressively higher speeds.
This behaviour suggests the progressive growth of a rough boundary film and has been
reported to occur for both overbased detergents (Topolovec-Miklozic, et al. (28)) and
ZDDPs (Taylor and Spikes (31, Smeeth, et al. (32)). The growth of an uneven surface film
increases the effective roughness of the surfaces, requiring a higher mean rolling speed to
generate an inlet pressure and thus a fluid film.
On the other hand, when either AE or HE is added to the oil, this behaviour does not occur.
All tests with added ethanol show slightly larger friction in the boundary region, but in
particular they do not show the progressive shift in the Stribeck curves. This clearly
suggests that the addition of ethanol prevents the formation of thick, rough surface films.
Further investigation is necessary to clarify the exact mechanism by which ethanol hinders
the formation of this boundary film, but this work clearly shows that the presence of
23
ethanol in formulated oils can be detrimental in the boundary lubrication regime when this
oil contains ZDDP and/or Ca-based detergent additives.
A final remark is that film thickness measurements for tests with ethanol were more
scattered than for neat lubricants, and scatter was more significant at 100oC than at lower
temperatures. Due to the low evaporation point of ethanol, it is possible that bubbles may
form within the lubricant, as observed during the viscosity measurements at 100oC for the
blends containing ethanol, which might contribute to such scattering. Also, while in contact
with the top glass disk, ethanol may condensate back into the contact. From the
experimental point of view, the volume of lubricants used within the test chamber was
larger than usual, which reduced the gap between the level of lubricant and the glass disk,
in order to reduce ethanol condensation on the disk. However, despite these problems, the
tests at 100oC were considered appropriate, since it is important to understand the effects of
ethanol at higher engine temperatures.
CONCLUSIONS
The addition of quite small proportions of ethanol decreases the viscosity of both the base
and formulated oils, more significantly for AE than for HE. This has the effect of slightly
reducing EHD film thickness and friction and causing the shift from full film to mixed
lubrication to occur at a lower entrainment speed, as evidenced by friction measurements.
The effects of ethanol contamination on film thickness and friction were broadly similar for
the base and formulated oils for the test conditions in the full film and mixed lubrication
24
regimes. However in slow speed, boundary lubrication conditions, the effect of ethanol in
the base oil was very different from that of ethanol in the formulated oil.
In base oil the presence of ethanol promoted the formation of a boundary layer that was not
present with the ethanol-free base oils. It is suggested that this boundary layer may be due
to oxidation of ethanol when in contact with a hot, rubbing metal surface.
In a formulated engine oil, the presence of ethanol interferes with the formation of a thick
boundary film, reducing its thickness for ca 9 nm to ca 2-3 nm. With ethanol-free base oil,
consecutive Stribeck friction curves of the formulated oil showed a progressive shift to the
right, indicative of the growth of a thick, rough boundary film, but this was supressed by
the addition of both AE and HE.
A new technique using extraction with water and refractive index measurements has been
developed to evaluate the amount of ethanol present in a lubricant. The results using this
show that the ethanol content during a test is greatly reduced, especially in tests using the
MTM rig at high temperatures, probably due to evaporation.
ACKNOWLEDGEMENTS
The authors are grateful to Petrobras, in particular to Dr. Luis Fernando Lastres, for
providing lubricant and hydrated ethanol fuel samples and to CNPq (Brazil) for financial
support to H.L.Costa.
25
REFERENCES
(1) Wu, X. S., Daniel, R., Tian, G. H., Xu, H. M., Huang, Z. H. and Richardson, D. (2011), “Dual-injection: The flexible, bi-fuel concept for spark-ignition engines fuelled with various gasoline and biofuel blends,” Appl. Energy 88, 7, pp. 2305-2314. (2) Bastian-Pinto, C., Brandao, L. and Alves, M. D. (2010), “Valuing the switching flexibility of the ethanol-gas flex fuel car,” Ann. Oper. Res. 176, 1, pp. 333-348. (3) Cavalcanti, M., Szklo, A. and Machado, G. (2012), “Do ethanol prices in Brazil follow Brent price and international gasoline price parity?,” Renew. Energy 43, pp. 423-433. (4) Ahn, K. H., Stefanopoulou, A. G. and Jankovic, M. (2010), “Puddle Dynamics and Air-to-Fuel Ratio Compensation for Gasoline-Ethanol Blends in Flex-Fuel Engines,” IEEE Trans. Control Syst. Technol. 18, 6, pp. 1241-1253. (5) Dutcher, D. D., Stolzenburg, M. R., Thompson, S. L., Medrano, J. M., Gross, D. S., Kittelson, D. B. and McMurry, P. H. (2011), “Emissions from Ethanol-Gasoline Blends: A Single Particle Perspective,” Atmosphere 2, 2, pp. 182-200. (6) 2003/30/EC, D. (2003), “Directive 2003/30/EC of the European Parliament and of the Council of 8 May 2003 on the promotion of the use of biofuels or other renewable fuels for transport ” Editon Edition, European Commission Brussels, ISBN ISBN. (7) 2009/28/EC, D. (2009), “Directive 2009/28/EC of 23 April 2009 on the promotion of the use of energy from renewable sources and amending and subsequently repealing Directives 2001/77/EC and 2003/30/EC,” Editon Edition, European Commission, Brussels, ISBN ISBN. (8) Linde, R. a. F., J. (2010), “Emissions and experiences with E85 converted cars in the BEST project,” Editon Edition, Vaxjo, Sweden, ISBN ISBN. (9) Pelkmans, L., Lenaers, G., Bruyninx, J., Scheepers, K. and De Vlieger, I. (2011), “Impact of biofuel blends on the emissions of modern vehicles,” Proc. Inst. Mech. Eng. Part D-J. Automob. Eng. 225, D9, pp. 1204-1220. (10) Maricq, M. M. (2012), “Soot formation in ethanol/gasoline fuel blend diffusion flames,” Combust. Flame 159, 1, pp. 170-180. (11) Boons, M., Bulk, R. V. D. and King, T. (2008), “The impact of E85 use on lubricant performance,” SAE paper 2008-01-1763. (12) Chui, G. K., Baker, R. E. and Pinto, F. B. P. (Year), “Lubrication behaviour in ethanol-fueled engines,” Proc. 4th Symposium on Alcohol fuels, Gurujá, Brazil, 1980. (13) Ferrarese, A., Marques, G., Tomanik, E., Bruno, R. and Vatavuk, J. (2010), “Piston ring tribological challenges on the next generation of flex-fuel engines,” SAE Int. J. Engines 3, 2, pp. 85-91. (14) De Silva, P. R., Priest, M., Lee, P. M., Coy, R. C. and Taylor, R. I. (2011), “Tribometer Investigation of the Frictional Response of Piston Rings when Lubricated with the Separated Phases of Lubricant Contaminated with the Gasoline Engine Biofuel Ethanol and Water,” Tribol. Lett. 43, 2, pp. 107-120. (15) De Silva, P. R., Priest, M., Lee, P. M., Coy, R. C. and Taylor, R. I. (2011), “Tribometer investigation of the frictional response of piston rings with lubricant
26
contaminated with the gasoline engine biofuel ethanol and water,” Proc. Inst. Mech. Eng. Part J.-J. Eng. Tribol. 225, J6, pp. 347-358. (16) Volcci, G. A. (2007), “Comportamento tribológico do anel de primeiro canalete em motores operando em sistemas flex fuel,” 2007, UFPR, Engenharia Mecânica, (17) Boons, M., Bulk, R. V. D. and King, T. (2008), “The impact of E85 use on lubricant performance,” SAE paper 2008-01-1763. (18) Chui, G. K. and Millard, D. H. T. (1981), “Development and testing of crankcase lubricants for alcohol fueled engines,” SAE paper 811203. (19) Guangteng, G. and Spikes, H. A. (1997), “The control of friction by molecular fractionation of base fluid mixtures at metal surfaces,” Tribol T 40, 3, pp. 461-469. (20) Stribeck, R. (1902), “Die wesentlichen Eigenschaften der Gleit- und Rollenlager,” Zeitschrift des Vereins Deutscher Ingenieure 36, 46, pp. 1341-1348. (21) Johnston, G. J., Wayte, R. and Spikes, H. A. (1991), “The Measurement and Study of Very Thin Lubricant Films in Concentrated Contacts,” Tribol T 34, 2, pp. 187-194. (22) Lee, S., Muller, M., Ratoi-Salagean, M., Voros, J., Pasche, S., De Paul, S. M., Spikes, H. A., Textor, M. and Spencer, N. D. (2003), “Boundary lubrication of oxide surfaces by Poly(L-lysine)-g-poly(ethylene glycol) (PLL-g-PEG) in aqueous media,” Tribol. Lett. 15, 3, pp. 231-239. (23) Pauls, R. E. and McCoy, R. W. (1981), “Gas and liquid-chromatographic analyses of methanol, ethanol, tert-butanol, and methyl tert-butyl ether in gasoline,” J. Chromatogr. Sci. 19, 11, pp. 558-561. (24) Nowakowska, J. (1939), “The Refractive Indices of Ethyl Alcohol and Water Mixtures,” Master's Thesis 1939, Loyola University Chicago, (25) Hamrock, B. T. and Dowson, D. (1981), “Ball bearing lubrication: The elastohydrodynamics of elliptical Contacts,” Editon Edition, Wiley, New York, ISBN. (26) Evans, C. R. and Johnson, K. L. (1986), “The rheological properties of elastohydrodynamic lubricants,” Proceedings of the Institution of Mechanical Engineers Part C-Journal of Mechanical Engineering Science 200, 5, pp. 303-312. (27) Evans, C. R. and Johnson, K. L. (1986), “Regimes of traction in elastohydrodynamic lubrication,” Proceedings of the Institution of Mechanical Engineers Part C-Journal of Mechanical Engineering Science 200, 5, pp. 313-324. (28) Topolovec-Miklozic, K., Forbus, T. R. and Spikes, H. A. (2008), “The film-forming and friction properties of overbased calcium sulphonate detergents,” Trib. Letters 29, pp. 33-44. (29) Fujita, H. and Spikes, H. A. (2004), “The formation of zinc dithiophosphate antiwear films,” Proc. Inst. Mech. Eng. Part J.-J. Eng. Tribol. 218, J4, pp. 265-277. (30) Gunsel, S., Spikes, H. A. and Aderin, M. (1993), “In-situ measurement of ZDDP films in concentrated contacts,” Trib. Trans. 36, pp. 276-282. (31) Taylor, L. J. and Spikes, H. A. (2003), “Friction-enhancing properties of ZDDP antiwear additive: Part I - Friction and morphology of ZDDP reaction films,” Tribol T 46, 3, pp. 303-309. (32) Smeeth, M., Hamer, C. and Spikes, H. A. (2008), “A study of antiwear additive film build up using the MTM (mini-traction machine),” Editon Edition, ISBN 978-0-7918-4810-4.
27
TABLE CAPTIONS
Table I. Chemical composition of the formulated oil, in ppm.
Table II. List of fluid samples and abbreviations.
Table III. Viscosity measurements for the oils contaminated with ethanol, where ρ is the density, η is the dynamic viscosity, VI is the viscosity index, HE is hydrated ethanol, AE is anhydrous ethanol, GI is Group I, GII is Group II, N.M. is not measurable.
Table IV. Amounts of ethanol (wt. %) after tests; B.O. = base oil; F.O. = formulated oil.
28
FIGURE CAPTIONS
Figure 1. Example of calibration curve between refractive index measurements and amount of HE in Group I base oil.
Figure 2. Effect of addition of hydrated ethanol (HE) on film thickness for Group I base oil at 40oC.
Figure 3. Effect of addition of hydrated ethanol (HE) and anhydrous ethanol (AE) on film thickness for Group I base oil at 100oC.
Figure 4. Effect of addition of hydrated ethanol (HE) and anhydrous ethanol (AE) on film thickness for Group II base oil at 100oC.
Figure 5. Film thickness measurements for the formulated oil SLB at 40oC, 70oC and 100oC.
Figure 6. Effect of addition of ethanol to formulated oil SLB on film thickness at 40oC.
Figure 7. Effect of addition of ethanol to formulated oil SLB on film thickness at 70oC.
Figure 8. Effect of addition of ethanol to formulated oil SLB on film thickness at 100oC.
Figure 9. Effect of hydrated ethanol on Stribeck curves for Group I base oil, 40oC.
Figure 10. Effect of hydrated ethanol on Stribeck curves for Group I base oil, 70oC.
Figure 11. Effect of ethanol on Stribeck curves for Group I base oil, 100oC.
Figure 12. Effect of ethanol on Stribeck curves for the formulated oil SLB, 70oC.
Figure 13. Effect of ethanol on Stribeck curves for the formulated oil SLB, 100oC.
Figure 14. Effect of addition of ethanal on film thickness for Group I base oil at 40oC.
Figure 15. Effect of addition of acetic acid and ethanal on film thickness for Group I base oil at 100oC.
Figure 16. Five consecutive film thickness measurements for mixture of Group I base oil + acetic acid at 100oC.
Figure 17. Effect of the addition of ethanol on consecutive Stribeck curves for the formulated oil SLB at 100oC.
29
Element Ca Mo P S Pb Zn
Amount (ppm) 1831 <1 786 4300 <10 954
Table I. Chemical composition of the formulated oil SLB, in ppm.
30
Description Abbreviation Symbol
Base oils
Group I base oil
Neat GI ■ 2% wt. Hydrated Ethanol GI 2% HE ▲ 2% wt. Anhydrous Ethanol GI 2% AE ● 2% wt. Ethanal GI 2% ETA + 2% wt. Acetic Acid GI 2% AA x
Group II base oil
Neat GII ■ 2% wt. Hydrated Ethanol GII 2% HE ▲ 2% wt. Anhydrous Ethanol GII 2% AE ●
Formulated oil
SL class, no friction modifiers
Neat SLB ♦ 5% wt. Hydrated Ethanol SLB 5%HE - 5% wt. Anhydrous Ethanol SLB 5%AE *
Table II. List of fluid samples, abbreviations and symbols used to represent them in graphs.
31
Oil ρ at 15oC (g/cm3
η at 40)
oC (mm2
η at 70/s)
oC (mm2
η at 100/s)
oC (mm2
VI /s)
GI 0.874 28.698 10.515 5.092 104.8 GI 2%AE 0.871 23.773 8.707 N.M. N.M. GI 2%HE 0.873 21.218 9.679 N.M. N.M GII 0.851 20.124 7.771 4.092 102.1 GII 2%AE 0.849 16.851 6.671 N.M. N.M. GII 2%HE 0.850 19.086 7.045 N.M. N.M. SLB 0.870 97.160 30.809 13.621 141.0 SLB 5%HE 0.866 89.237 24.803 N.M. N.M. SLB 5%AE 0.865 70.259 20.732 N.M. N.M.
Table III. Viscosity measurements for the oils contaminated with ethanol, where ρ is the density, η is the kinematic viscosity, VI is the viscosity index, HE is hydrated ethanol, AE is anhydrous ethanol, GI is Group I, GII is Group II, N.M. is not measurable.
32
MTM tests B.O. 40oC 100oC GI 0 0 GI 2%HE 1.7 0.15 GI 2%AE 2 0.24 F.O. 40oC 70oC 100oC SLB 0 0 0 SLB 5%AE 4.00 2.50 0.50 SLB 5%HE 3.50 2.25 0.25
EHD tests B.O. GI 0 GI 2%HE 1.38 GI 2%AE 1.27 F.O. SLB 0 SLB 5%AE 2.25 SLB 5%HE 2.00
Table IV. Amounts of ethanol (wt. %) after tests; B.O. = base oil; F.O. = formulated oil.
33
Figure 1. Example of calibration curve between refractive index measurements and amount of HE in Group I base oil.
34
Figure 2. Effect of addition of hydrated ethanol (HE) on film thickness for Group I base oil at 40oC.
35
Figure 3. Effect of addition of hydrated ethanol (HE) and anhydrous ethanol (AE) on film thickness for Group I base oil at 100oC.
36
Figure 4. Effect of addition of hydrated ethanol (HE) and anhydrous ethanol (AE) on film thickness for Group II base oil at 100oC.
37
Figure 5. Film thickness measurements for the formulated oil SLB at 40oC, 70oC and 100oC.
38
Figure 6. Effect of addition of ethanol to formulated oil SLB on film thickness at 40oC.
39
Figure 7. Effect of addition of ethanol to formulated oil SLB on film thickness at 70oC.
40
Figure 8. Effect of addition of ethanol to formulated oil SLB on film thickness at 100oC.
41
Figure 9. Effect of hydrated ethanol on Stribeck curves for Group I base oil, 40oC.
42
Figure 10. Effect of hydrated ethanol on Stribeck curves for Group I base oil, 70oC.
43
Figure 11. Effect of ethanol on Stribeck curves for Group I base oil, 100oC.
44
Figure 12. Effect of ethanol on Stribeck curves for the formulated oil SLB, 70oC.
45
Figure 13. Effect of ethanol on Stribeck curves for the formulated oil SLB, 100oC.
46
Figure 14. Effect of addition of ethanal (ETA) on film thickness for Group I base oil at 40oC.
47
Figure 15. Effect of addition of acetic acid (AA) and ethanal (ETA) on film thickness for Group I base oil at 100oC.
48
Figure 16. Five consecutive film thickness measurements for mixture of Group I base oil + acetic acid at 100oC.
49
Figure 17. Effect of the addition of ethanol on consecutive Stribeck curves for the formulated oil SLB at 100oC.
Related Documents