EFFECTS OF ENVIRONMENTAL STRESS ON FOREST CROWN CONDITION IN EUROPE. PART III: ESTIMATION OF CRITICAL DEPOSITION AND CONCENTRATION LEVELS AND THEIR EXCEEDANCES WIM DE VRIES 1* , GERT JAN REINDS 1 , JACO M. KLAP 1 , ERIKP. VAN LEEUWEN 2 and JAN WILLEM ERISMAN 3 1 DLO Winand Staring Centre (SC-DLO), Wageningen, The Netherlands; 2 National Institute for Public Health and the Environment (RIVM), Bilthoven, The Netherlands; 3 Energie Centrum Nederland (ECN), Petten, The Netherlands ( * author for correspondence, e-mail: [email protected]) (Received 26 August 1998; accepted 6 May 1999) Abstract. The stress by air pollution at the systematic Pan-European 16 × 16 km 2 forest (crown) condition monitoring network, is discussed by comparing site-specific estimates of critical and present concentration and deposition levels for S and N compounds and ozone. Results indicate that the exceedance of critical levels, related to direct above-ground impacts, decrease going from O 3 > SO 2 > N compounds. Critical N loads related to effects on the forest understorey are exceeded at approximately 25% of the plots, located mainly in Western and Central Europe. Critical N loads related to effects on trees are hardly ever exceeded, but most likely, this is an under estimate. Critical acid deposition levels are exceeded at approximately 30% of the plots with a low base saturation, where acid inputs may release toxic Al. This is especially the case in Central and Eastern Europe, where present loads are high and in boreal forest in Southern Scandinavia where critical loads are low. Although the uncertainties in the calculated exceedances is large, the spatial pattern, which is most important for a correlative study, seems reliable, implying that the critical load concept is suitable for regional risk assessments. Keywords: acidity, air pollution, ammonia, AOT40, critical levels, critical loads, N deposition, nitrogen oxides, ozone, Simple Mass Balance model, sulphur 1. Introduction To assess the relationship between crown condition monitored at a systematic 16 × 16 km grid (level 1 plots) in Europe and stress factors, it is relevant to have in- formation on threshold values below which the effect of a stress factor is considered to be insignificant. With respect to stress factors related to air pollution, the concept of critical levels and critical loads has been introduced in this context (Nilsson, 1986). These thresholds are defined as ‘a quantitative estimate of an exposure to one or more pollutants below which significant harmful effects of specified sens- itive elements of the environment do not occur according to present knowledge’ (Nilsson and Grennfelt, 1988). Critical (concentration) levels are thresholds related to the direct above-ground effects of an exposure of gaseous air pollutants, such as Water, Air, and Soil Pollution 119: 363–386, 2000. © 2000 Kluwer Academic Publishers. Printed in the Netherlands.

Welcome message from author
This document is posted to help you gain knowledge. Please leave a comment to let me know what you think about it! Share it to your friends and learn new things together.
Transcript
EFFECTS OF ENVIRONMENTAL STRESS ON FOREST CROWNCONDITION IN EUROPE. PART III: ESTIMATION OF CRITICAL
DEPOSITION AND CONCENTRATION LEVELS AND THEIREXCEEDANCES
WIM DE VRIES1∗, GERT JAN REINDS1, JACO M. KLAP1, ERIK P. VANLEEUWEN2 and JAN WILLEM ERISMAN3
1 DLO Winand Staring Centre (SC-DLO), Wageningen, The Netherlands;2 National Institute forPublic Health and the Environment (RIVM), Bilthoven, The Netherlands;3 Energie Centrum
Nederland (ECN), Petten, The Netherlands(∗ author for correspondence, e-mail: [email protected])
(Received 26 August 1998; accepted 6 May 1999)
Abstract. The stress by air pollution at the systematic Pan-European 16×16 km2 forest (crown)condition monitoring network, is discussed by comparing site-specific estimates of critical and presentconcentration and deposition levels for S and N compounds and ozone. Results indicate that theexceedance of critical levels, related to direct above-ground impacts, decrease going from O3 >
SO2 > N compounds. Critical N loads related to effects on the forest understorey are exceeded atapproximately 25% of the plots, located mainly in Western and Central Europe. Critical N loadsrelated to effects on trees are hardly ever exceeded, but most likely, this is an under estimate. Criticalacid deposition levels are exceeded at approximately 30% of the plots with a low base saturation,where acid inputs may release toxic Al. This is especially the case in Central and Eastern Europe,where present loads are high and in boreal forest in Southern Scandinavia where critical loads arelow. Although the uncertainties in the calculated exceedances is large, the spatial pattern, whichis most important for a correlative study, seems reliable, implying that the critical load concept issuitable for regional risk assessments.
Keywords: acidity, air pollution, ammonia, AOT40, critical levels, critical loads, N deposition,nitrogen oxides, ozone, Simple Mass Balance model, sulphur
1. Introduction
To assess the relationship between crown condition monitored at a systematic16×16 km grid (level 1 plots) in Europe and stress factors, it is relevant to have in-formation on threshold values below which the effect of a stress factor is consideredto be insignificant. With respect to stress factors related to air pollution, the conceptof critical levels and critical loads has been introduced in this context (Nilsson,1986). These thresholds are defined as ‘a quantitative estimate of an exposure toone or more pollutants below which significant harmful effects of specified sens-itive elements of the environment do not occur according to present knowledge’(Nilsson and Grennfelt, 1988). Critical (concentration) levels are thresholds relatedto the direct above-ground effects of an exposure of gaseous air pollutants, such as
Water, Air, and Soil Pollution119: 363–386, 2000.© 2000Kluwer Academic Publishers. Printed in the Netherlands.
364 W. DE VRIES ET AL.
SO2, NO2, NH3 and O3, on the forest condition. Critical deposition levels (loads)are threshold values related to the indirect soil-mediated effects of atmosphericdeposition (loads) on forest condition, such as nutrient imbalances caused by soilacidification and N accumulation.
Literature information suggests that indirect soil-mediated effects of air pollut-ants on the vitality of forests are generally more important than direct above groundeffects (Robertset al., 1989; Heij and Schneider, 1995). The decrease in forestvitality, due to (relative) deficiencies in cation nutrients such as Mg, is consideredto be at least partly caused by the mobilisation of Al in soils in response to S and Ninputs (Heijet al., 1991). Numerous studies, both in the laboratory and in the field,have shown that nutrient imbalances resulting from high concentrations of Al andN (NH4) as compared to (divalent) base cations such as Ca and Mg, have a negativeinfluence on root elongation and root uptake (See Sverdrup and Warfvinge, 1993for a summarising overview). In this context critical Al/(Ca+Mg+K) ratios havebeen derived for various tree species (Sverdrup and Warfvinge, 1993). A strong de-crease in pH in response to depletion of readily available secondary Al compoundsmay also play a role. Furthermore, elevated N inputs increases the N content offoliage and soil humus, which in turn may lead to an increased susceptibility offorests to natural stresses, such as fungal diseases, drought and frost (Aronsson,1980; Roelofset al., 1985; Boxmanet al., 1986; De Visser, 1994) and vegetationchanges in forest understorey (Hommelet al., 1990; Van Dobbenet al., 1994;Bobbinket al., 1992, 1995).
This paper is the third in a series of four, describing the results of a studyin which observed data on forest (crown) condition, monitored since 1986 at asystematic 16×16 km grid in Europe, were correlated with site-specific estimatesof stress induced by meteorological conditions and air pollution. More informationon the background of the study is presented in De Vrieset al. (2000, this issue). Theaim of this paper is to present information on the order of magnitude, the spatialdistribution and the reliability of calculated annual average critical concentrationand deposition levels of air pollutants and their exceedances at the level 1 plots.Results are related to:
– concentration levels for the direct impact SO2, NO2, NH3 and O3 on the forestcanopy;
– deposition levels for N related to the eutrophying effect of this compound and;– deposition levels for the acidifying impact of both S and N on forest soils.
Special emphasis is given to the derivation of critical deposition levels, that aim toprevent a decrease in the biodiversity and vitality of forests. Unlike critical loads,which refer to long-term acceptable values, these critical deposition levels referto the actual thresholds at the monitoring plots during the time of consideration.Furthermore, the uncertainties in the critical concentration and deposition levelsare discussed.
EFFECTS OF ENVIRONMENTAL STRESS ON FOREST CROWN CONDITION IN EUROPE365
TABLE I
Critical levels (µg m−3) used for short-term andlong-term exposures to SO2, NOx and NH3
a
Exposure SO2 NOx NH3
Short termb 70 95 270
Long termc 20 30 8
a Based upon results of a UN/ECE Workshopon Critical Levels at Bad Hartzburg (UN/ECE,1989) and on revisions and additions agreedupon at a similar workshop at Egham (Ashmoreand Wilson, 1994). An overview is also givenin the Manual on methodologies and criteria formapping critical levels/loads (UN/ECE, 1996).b One day except for NOx where it equals fourhours.c One year.
2. Methods and Input Data
2.1. ASSESSMENT OF CRITICALCONCENTRATION LEVELS
Critical (no-adverse effect) levels have been derived for forests from a compila-tion of literature on dose (the product of pollutant concentration and duration ofexposure) response relationships (e.g. Ashmore and Wilson, 1994; UN/ECE 1989,1995, 1996). Even though critical levels are influenced by climatic conditions (tem-perature, relative humidity, soil water content) and internal growth factors (leaf age,stand of development), values are presently defined independent of location, treespecies and/or soil type. The only differentiation relates to exposure duration, i.e.‘acute’ effects of short-term exposures (1 hr or 1 day mean values) and ‘chronic’effects of long-term exposures (annual mean values) (UN/ECE, 1996). Criticalconcentration levels used in this study were based on this literature information(UN/ECE, 1989, 1995, 1996).
2.1.1. Sulphur and Nitrogen CompoundsA summary of critical levels for S and N compounds related to acute effects byshort-term exposures (one day or less) and to chronic effects by long-term ex-posures (one year) is given in Table I.
The critical values are related to adverse effects on all vegetation types, exceptfor SO2 where the values refer to forest ecosystems and natural vegetation. Mäkeläand Schöpp (1990) suggested that the critical level for SO2 should equal 15µg m−3
in areas where the effective temperature sum equals 1000◦C days. Note, however,that the calculated summer index, which is equal to this temperature sum, wasnearly always above this value (van Leeuwenet al., 2000, this issue).
366 W. DE VRIES ET AL.
For NOx and NH3, separate critical levels have not been set for different veget-ation classes, because of lack of information. The sensitivity is, however, thoughtto decrease according to (semi)natural vegetation> forests> crops. Critical levelsare related to both growth stimulation in response to the fertiliser effect of nitrogenand adverse physiological effects at toxic levels. The critical level for NOx is basedon the sum of NO and NO2 concentrations. The knowledge to establish separatecritical levels for the two gasses is still lacking, even though there is evidence thatNO is more phytotoxic than NO2 (Morganet al., 1992; UN-ECE, 1995, 1996).
2.1.2. OzoneCritical ozone levels for forests are based on results from UN/ECE workshopsrelated to this topic in Bern (Führer and Achermann, 1994) and in Kuopio (Kären-lampi and Skärby, 1996). Critical levels for ozone have been defined by the sum ofdifferences between the hourly ozone concentrations in ppb during daylight hours(defined as the period with a global radiation>50 W m−2) and a threshold valueof 40 ppb during the growing season. The inclusion of daylight hours is basedon the observation that ozone uptake at night is negligible due to closure of thestomatal pores (Ashmore and Wilson, 1994). This accumulated ozone exposureover a threshold of 40 ppb, called AOT40, is expressed in ppb hours or ppm hours.
For forests, a critical AOT40 of 10 000 ppb h (10 ppm h) accumulated over asix-month growing season commencing at the first of April has been adopted, inde-pendent of the tree species considered. In this context, the following considerationsshould be kept in mind (Kärenlampi and Skärby, 1996):
– The value is based on data for beech, since the deciduous trees are consideredmore sensitive to ozone than coniferous trees.
– The cut-off concentration of 40 ppb, which is based on a reduction in annualbiomass increment, is not an absolute value and an AOT30 may be more ap-propriate in the Nordic countries. In this case, however, the accumulated dosemight include some background ozone (UN/ECE, 1995).
– The use of a six months growing season, starting the first of April is an un-derestimation for the Mediterranean countries and an overestimation for theNordic countries.
2.2. ASSESSMENT OF CRITICAL DEPOSITION LEVELS
Unlike critical levels, critical deposition levels were calculated for each stand whileaccounting for effects of location, tree species and soil type. As stated before, thecritical deposition levels used in this study, do not refer, however, to long-termacceptable loads, used for policy making (e.g. Poschet al., 1995a, b) but to actualthresholds at the monitoring plots for the time of consideration (1985–1995). Theassumed steady-state situation in deriving long-term critical loads was thus notapplied. Critical deposition levels were calculated for each monitoring site with an
EFFECTS OF ENVIRONMENTAL STRESS ON FOREST CROWN CONDITION IN EUROPE367
adapted version of the simple mass balance (SMB) model (e.g. De Vries, 1993;Sverdrup and De Vries, 1994).
2.2.1. General Mass Balance Models ApproachThe principle of the SMB model is that it calculates critical loads by includingprocesses influencing acid production and consumption during infinite time only.This implies that dynamic processes are not considered in the assessment of a long-term acceptable (critical) load (De Vries, 1993; UN-ECE, 1996). The SMB modelcalculates critical loads for the acidifying impact of S and N,(S + N)td(crit),according to (all fluxes in molc ha−1 a−1):
S + Ntd(crit) =BC∗td + BCwe − BCgu +Ngu +Nim +Nde + Alle(crit)+Hle(crit) (1)
whereBC∗td is the chloride corrected total deposition flux of base cations,BCweis a base cation weathering flux,BCgu andNgu are the net uptake fluxes of basecations and nitrogen needed for forest growth,Nim is a long-term nitrogen immob-ilisation flux at critical load,Nde is a denitrification flux at critical N load, whereas,Alle(crit) andHle(crit) are a critical leaching fluxes of Aluminium and protons,respectively. A critical load of S and N is thus calculated as the sum of majorprocesses buffering the incoming acidity and a critical leaching rate of acidity.
The critical Al leaching flux,Alle(crit), was calculated by multiplying the netbase cation leaching rate(BCtd+BCwe−BCgu)with a critical molar Al/(Ca+Mg+K)ratio in the soil solution. The critical Al/(Ca+Mg+K) ratio has been set at 0.8 forconiferous tree species (Pinus sylvestrisandPicea abies) and of 1.7 for deciduoustree species (Quercus robur, Quercus petraea, Fagus sylvaticaandQuercus ilex)based on an extensive literature review of numerous pot experiments with seedlingsor young trees (Sverdrup and Warfvinge, 1993). The critical H leaching flux wascalculated by multiplying a critical H concentration with the precipitation excessleaving the root zone. The critical H concentration was calculated from the criticalAl concentration (the critical Al leaching flux divided by the precipitation excess)using a gibbsite equilibrium equation.
In addition to acidification, N deposition may cause adverse effects due toeutrophication of an ecosystem. Critical N loads related to these effects can becalculated according to (De Vries, 1993; UN/ECE, 1996):
Ntd(crit) = Ngu +Nim +Nde +Nle(crit) (2)
whereNtd(crit) is the critical N load with respect to eutrophication andNle(crit)is a critical N leaching flux. Calculation of the critical N load with this simplesteady-state model is based on the assumption that any N input above a net Nuptake by forest growth, N immobilisation, denitrification and an acceptable rateof N leaching will finally lead to unacceptable high N contents in foliage and soil
368 W. DE VRIES ET AL.
organic matter, thus causing adverse affects such as nutrient imbalances, increasedsensitivity to frost, drought and diseases and vegetation changes.
In the present study, critical loads were calculated in relation to effects on (i) theunderstorey of forests (vegetation changes) and (ii) the sensitivity of trees to stress.In deriving critical N loads, related to vegetation changes, a natural low N leachingflux of 100 molc ha−1 a−1 has been used, since vegetation changes may alreadyoccur in that situation (Bobbinket al., 1995). Critical loads for N related to effectson forest vitality were, however, derived by relating the critical N leaching rate to acritical N content in foliage, associated with an increased sensitivity to fungal dis-eases (Boxman and Van Dijk, 1988). Using this critical N content in a relationshipfound by Tietema and Beier (1995) between N contents in foliage and N leachingfor a number of intensively monitored plots (NITREX sites) lead to a critical Nleaching rate of 1400 mol ha−1 a−1.
2.2.2. AdaptationsThe major premise of the calculation of a critical load described above is thatit assumes a steady-state situation to derive a long-term acceptable load. In thecorrelative study between crown condition and stress factors, however, we need toknow the actual threshold at the time of consideration. This implies that dynamicprocesses buffering the acid input at present can not be neglected. Simulation ofsuch processes requires the use of a dynamic model, such as SMART (De Vrieset al., 1989). However, since the uncertainty in the considered soil parameters,especially CEC, base saturation and C/N ratio, at each stand is likely to be muchhigher than the possible change in a 10 yr period, we used an intermediate approachas described below.
First of all, critical deposition levels were only calculated for soils with a basesaturation below 25%. Above this value, all the incoming acidity was assumed tobe buffered by base cations only and the critical deposition level was assumed toequal the present deposition level. Below this value, Al release was considered tostart which may cause the exceedance of a critical Al/(Ca+Mg+K) ratio. The basesaturation of 25% was based on model simulations (De Vrieset al., 1989) andlaboratory data (De Vries, 1997) indicating a significant Al release starting in arange between 10 and 25%.
Apart from inclusion of base cation exchange, as indicated above, the calcula-tion of nearly all model inputs in this study differed from the standard applicationof the SMB model. Instead of using a long-term average value for the calculationof each model input, we considered the time period 1985–1995 in deriving inputdata, to account for the buffer processes at the time of consideration. For examplein deriving critical loads related to a steady-state situation, a long-term acceptablerate of net immobilisation of stable organic N compounds in the soil (stable formsof humus) is calculated (De Vries, 1993). The actual accumulated amount at eachstand may however be much higher since the system is not yet at steady state.More specifically, the differences are indicated in Table II. Especially for acidity,
EFFECTS OF ENVIRONMENTAL STRESS ON FOREST CROWN CONDITION IN EUROPE369
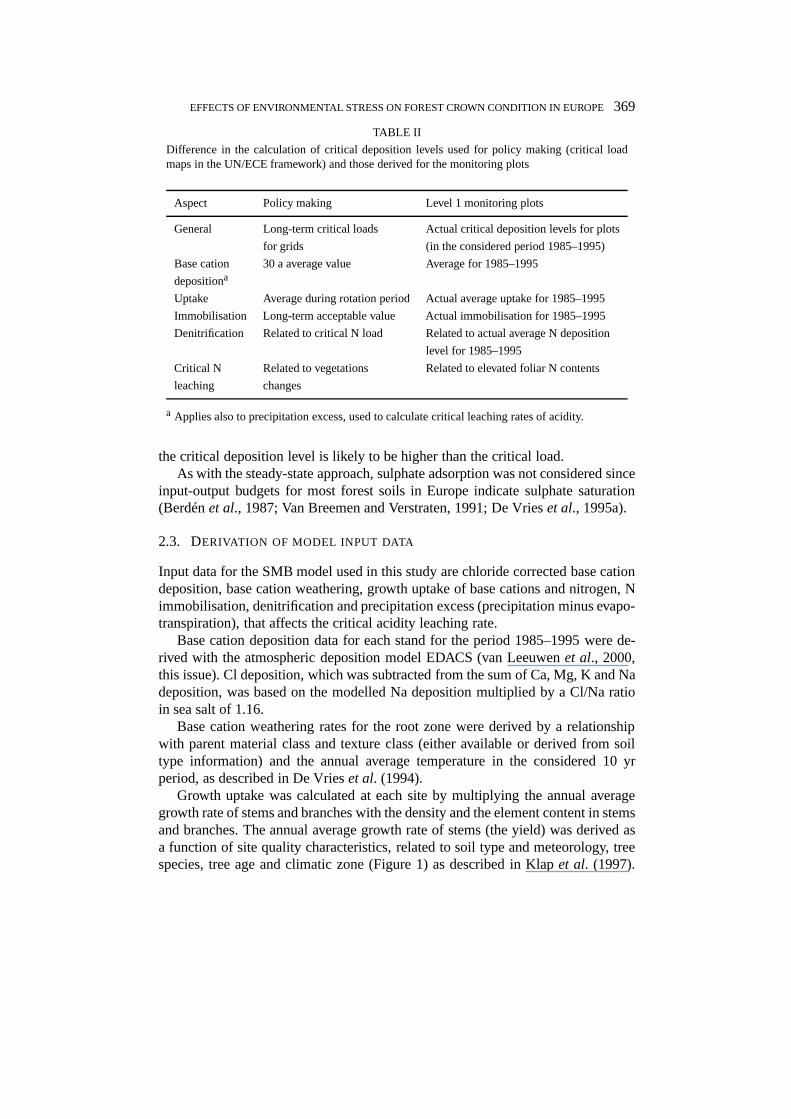
TABLE II
Difference in the calculation of critical deposition levels used for policy making (critical loadmaps in the UN/ECE framework) and those derived for the monitoring plots
Aspect Policy making Level 1 monitoring plots
General Long-term critical loads Actual critical deposition levels for plots
for grids (in the considered period 1985–1995)
Base cation 30 a average value Average for 1985–1995
depositiona
Uptake Average during rotation period Actual average uptake for 1985–1995
Immobilisation Long-term acceptable value Actual immobilisation for 1985–1995
Denitrification Related to critical N load Related to actual average N deposition
level for 1985–1995
Critical N Related to vegetations Related to elevated foliar N contents
leaching changes
a Applies also to precipitation excess, used to calculate critical leaching rates of acidity.
the critical deposition level is likely to be higher than the critical load.As with the steady-state approach, sulphate adsorption was not considered since
input-output budgets for most forest soils in Europe indicate sulphate saturation(Berdénet al., 1987; Van Breemen and Verstraten, 1991; De Vrieset al., 1995a).
2.3. DERIVATION OF MODEL INPUT DATA
Input data for the SMB model used in this study are chloride corrected base cationdeposition, base cation weathering, growth uptake of base cations and nitrogen, Nimmobilisation, denitrification and precipitation excess (precipitation minus evapo-transpiration), that affects the critical acidity leaching rate.
Base cation deposition data for each stand for the period 1985–1995 were de-rived with the atmospheric deposition model EDACS (van Leeuwenet al., 2000,this issue). Cl deposition, which was subtracted from the sum of Ca, Mg, K and Nadeposition, was based on the modelled Na deposition multiplied by a Cl/Na ratioin sea salt of 1.16.
Base cation weathering rates for the root zone were derived by a relationshipwith parent material class and texture class (either available or derived from soiltype information) and the annual average temperature in the considered 10 yrperiod, as described in De Vrieset al. (1994).
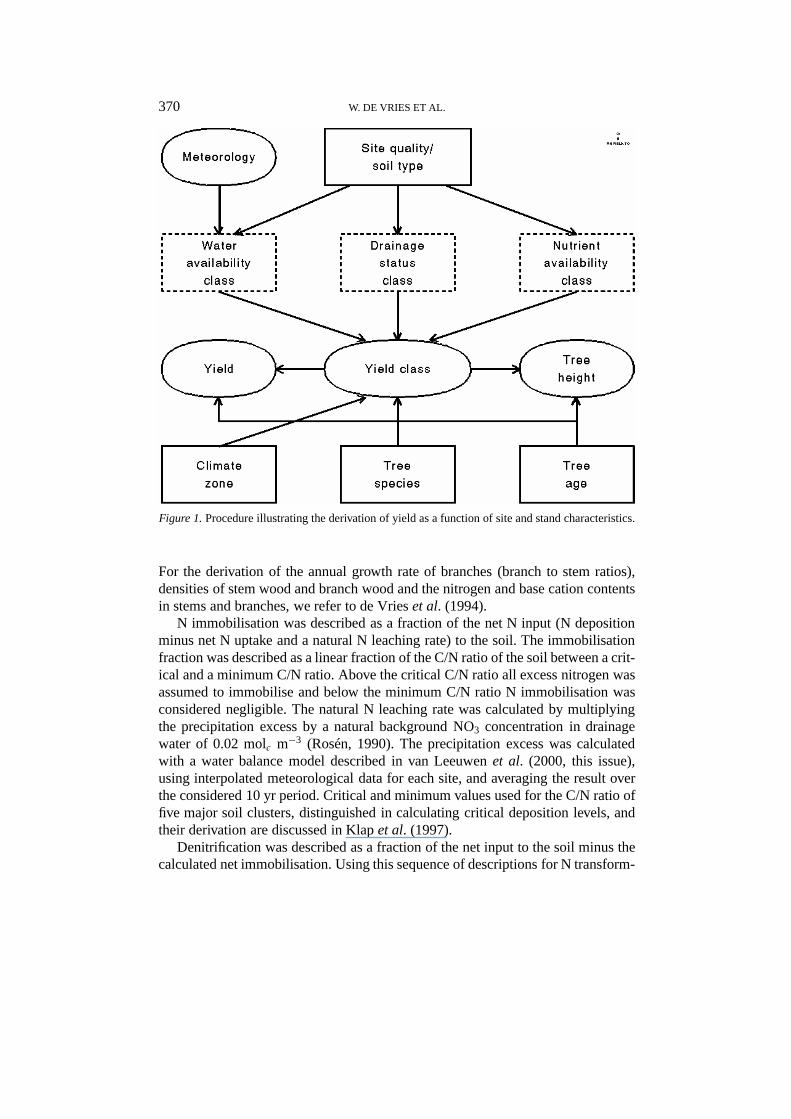
Growth uptake was calculated at each site by multiplying the annual averagegrowth rate of stems and branches with the density and the element content in stemsand branches. The annual average growth rate of stems (the yield) was derived asa function of site quality characteristics, related to soil type and meteorology, treespecies, tree age and climatic zone (Figure 1) as described in Klapet al. (1997).
370 W. DE VRIES ET AL.
Figure 1.Procedure illustrating the derivation of yield as a function of site and stand characteristics.
For the derivation of the annual growth rate of branches (branch to stem ratios),densities of stem wood and branch wood and the nitrogen and base cation contentsin stems and branches, we refer to de Vrieset al. (1994).
N immobilisation was described as a fraction of the net N input (N depositionminus net N uptake and a natural N leaching rate) to the soil. The immobilisationfraction was described as a linear fraction of the C/N ratio of the soil between a crit-ical and a minimum C/N ratio. Above the critical C/N ratio all excess nitrogen wasassumed to immobilise and below the minimum C/N ratio N immobilisation wasconsidered negligible. The natural N leaching rate was calculated by multiplyingthe precipitation excess by a natural background NO3 concentration in drainagewater of 0.02 molc m−3 (Rosén, 1990). The precipitation excess was calculatedwith a water balance model described in van Leeuwenet al. (2000, this issue),using interpolated meteorological data for each site, and averaging the result overthe considered 10 yr period. Critical and minimum values used for the C/N ratio offive major soil clusters, distinguished in calculating critical deposition levels, andtheir derivation are discussed in Klapet al. (1997).
Denitrification was described as a fraction of the net input to the soil minus thecalculated net immobilisation. Using this sequence of descriptions for N transform-
EFFECTS OF ENVIRONMENTAL STRESS ON FOREST CROWN CONDITION IN EUROPE371
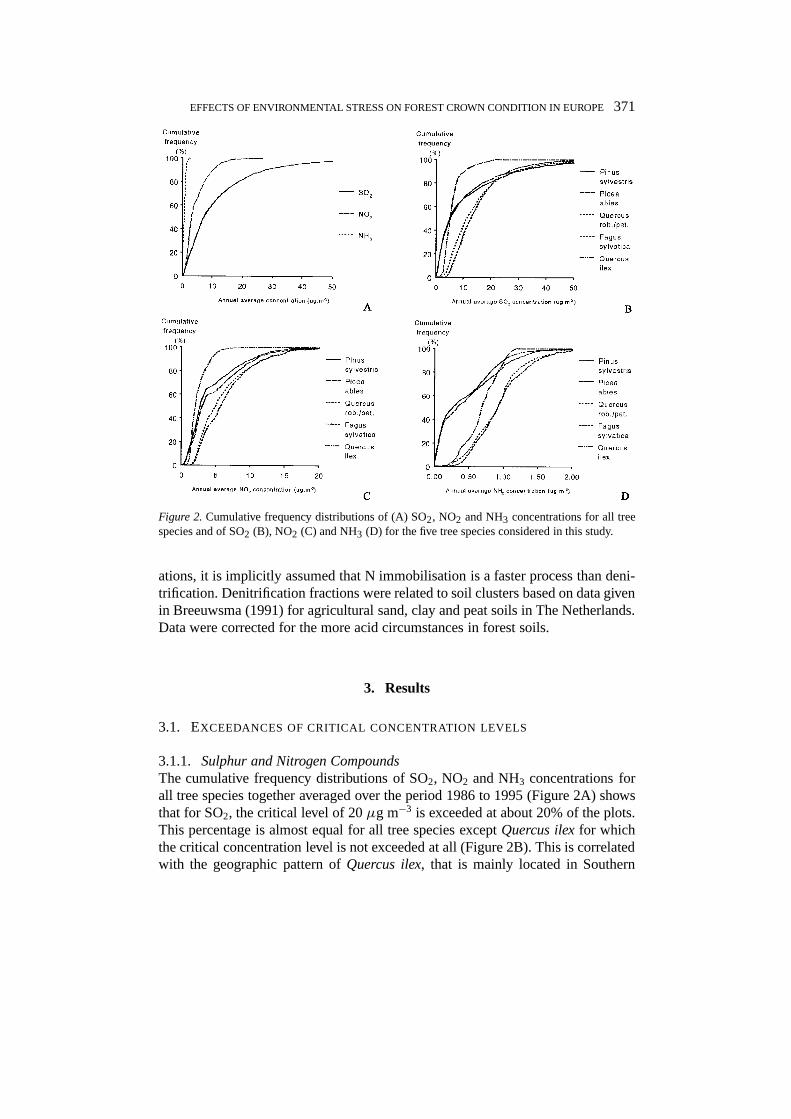
Figure 2.Cumulative frequency distributions of (A) SO2, NO2 and NH3 concentrations for all treespecies and of SO2 (B), NO2 (C) and NH3 (D) for the five tree species considered in this study.
ations, it is implicitly assumed that N immobilisation is a faster process than deni-trification. Denitrification fractions were related to soil clusters based on data givenin Breeuwsma (1991) for agricultural sand, clay and peat soils in The Netherlands.Data were corrected for the more acid circumstances in forest soils.
3. Results
3.1. EXCEEDANCES OF CRITICAL CONCENTRATION LEVELS
3.1.1. Sulphur and Nitrogen CompoundsThe cumulative frequency distributions of SO2, NO2 and NH3 concentrations forall tree species together averaged over the period 1986 to 1995 (Figure 2A) showsthat for SO2, the critical level of 20µg m−3 is exceeded at about 20% of the plots.This percentage is almost equal for all tree species exceptQuercus ilexfor whichthe critical concentration level is not exceeded at all (Figure 2B). This is correlatedwith the geographic pattern ofQuercus ilex, that is mainly located in Southern
372 W. DE VRIES ET AL.
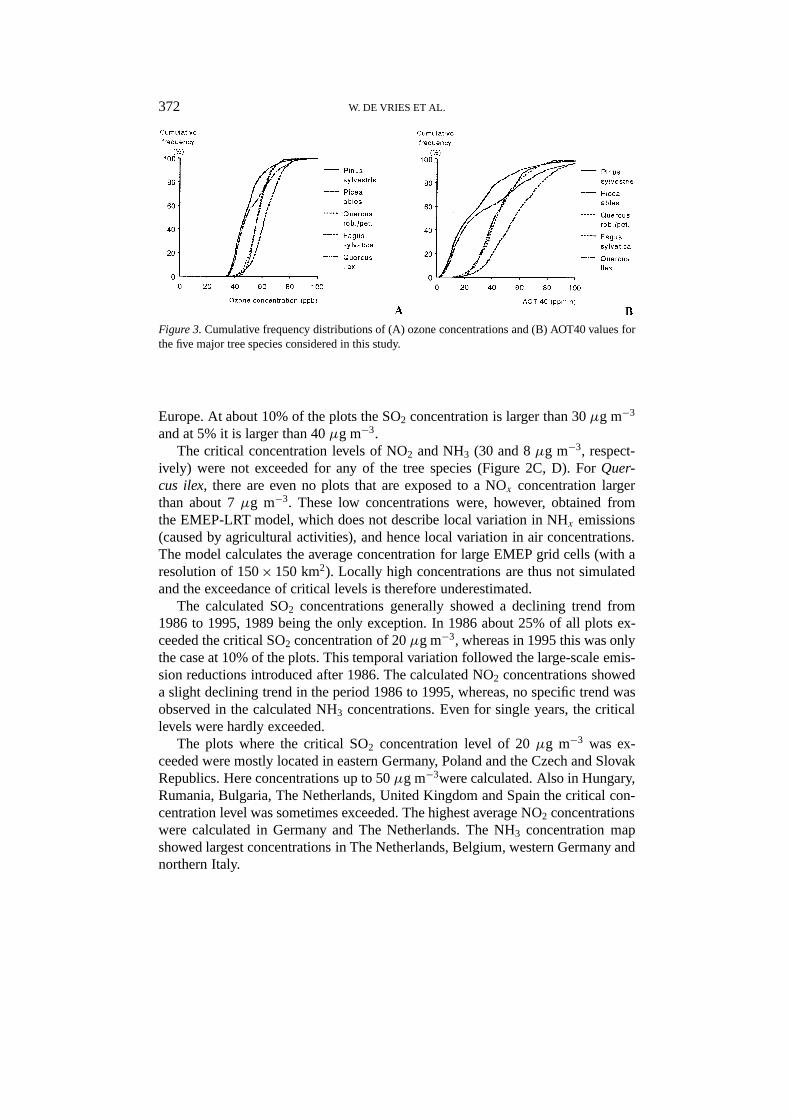
Figure 3.Cumulative frequency distributions of (A) ozone concentrations and (B) AOT40 values forthe five major tree species considered in this study.
Europe. At about 10% of the plots the SO2 concentration is larger than 30µg m−3
and at 5% it is larger than 40µg m−3.The critical concentration levels of NO2 and NH3 (30 and 8µg m−3, respect-
ively) were not exceeded for any of the tree species (Figure 2C, D). ForQuer-cus ilex, there are even no plots that are exposed to a NOx concentration largerthan about 7µg m−3. These low concentrations were, however, obtained fromthe EMEP-LRT model, which does not describe local variation in NHx emissions(caused by agricultural activities), and hence local variation in air concentrations.The model calculates the average concentration for large EMEP grid cells (with aresolution of 150× 150 km2). Locally high concentrations are thus not simulatedand the exceedance of critical levels is therefore underestimated.
The calculated SO2 concentrations generally showed a declining trend from1986 to 1995, 1989 being the only exception. In 1986 about 25% of all plots ex-ceeded the critical SO2 concentration of 20µg m−3, whereas in 1995 this was onlythe case at 10% of the plots. This temporal variation followed the large-scale emis-sion reductions introduced after 1986. The calculated NO2 concentrations showeda slight declining trend in the period 1986 to 1995, whereas, no specific trend wasobserved in the calculated NH3 concentrations. Even for single years, the criticallevels were hardly exceeded.
The plots where the critical SO2 concentration level of 20µg m−3 was ex-ceeded were mostly located in eastern Germany, Poland and the Czech and SlovakRepublics. Here concentrations up to 50µg m−3were calculated. Also in Hungary,Rumania, Bulgaria, The Netherlands, United Kingdom and Spain the critical con-centration level was sometimes exceeded. The highest average NO2 concentrationswere calculated in Germany and The Netherlands. The NH3 concentration mapshowed largest concentrations in The Netherlands, Belgium, western Germany andnorthern Italy.
EFFECTS OF ENVIRONMENTAL STRESS ON FOREST CROWN CONDITION IN EUROPE373
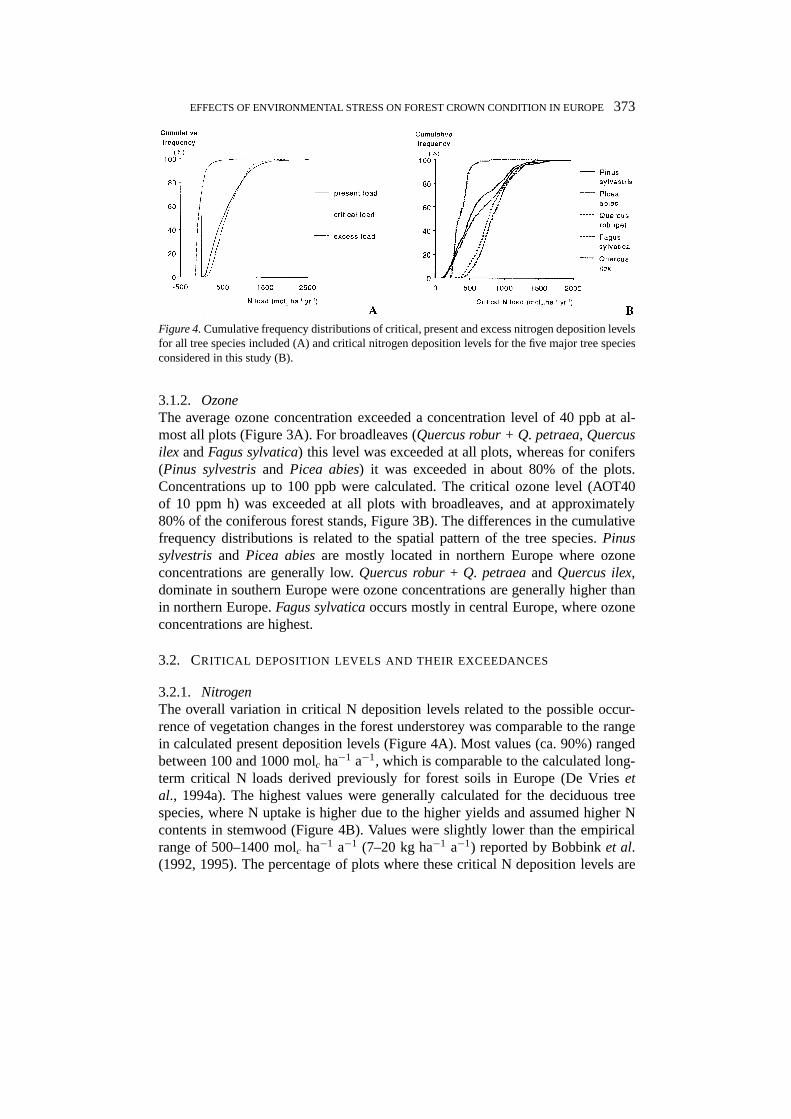
Figure 4.Cumulative frequency distributions of critical, present and excess nitrogen deposition levelsfor all tree species included (A) and critical nitrogen deposition levels for the five major tree speciesconsidered in this study (B).
3.1.2. OzoneThe average ozone concentration exceeded a concentration level of 40 ppb at al-most all plots (Figure 3A). For broadleaves (Quercus robur + Q. petraea, Quercusilex andFagus sylvatica) this level was exceeded at all plots, whereas for conifers(Pinus sylvestrisand Picea abies) it was exceeded in about 80% of the plots.Concentrations up to 100 ppb were calculated. The critical ozone level (AOT40of 10 ppm h) was exceeded at all plots with broadleaves, and at approximately80% of the coniferous forest stands, Figure 3B). The differences in the cumulativefrequency distributions is related to the spatial pattern of the tree species.Pinussylvestrisand Picea abiesare mostly located in northern Europe where ozoneconcentrations are generally low.Quercus robur+ Q. petraeaandQuercus ilex,dominate in southern Europe were ozone concentrations are generally higher thanin northern Europe.Fagus sylvaticaoccurs mostly in central Europe, where ozoneconcentrations are highest.
3.2. CRITICAL DEPOSITION LEVELS AND THEIR EXCEEDANCES
3.2.1. NitrogenThe overall variation in critical N deposition levels related to the possible occur-rence of vegetation changes in the forest understorey was comparable to the rangein calculated present deposition levels (Figure 4A). Most values (ca. 90%) rangedbetween 100 and 1000 molc ha−1 a−1, which is comparable to the calculated long-term critical N loads derived previously for forest soils in Europe (De Vriesetal., 1994a). The highest values were generally calculated for the deciduous treespecies, where N uptake is higher due to the higher yields and assumed higher Ncontents in stemwood (Figure 4B). Values were slightly lower than the empiricalrange of 500–1400 molc ha−1 a−1 (7–20 kg ha−1 a−1) reported by Bobbinket al.(1992, 1995). The percentage of plots where these critical N deposition levels are
374 W. DE VRIES ET AL.
exceeded equalled 25% (Figure 4). The maximum excess equalled 1370 molc ha−1
a−1.Critical deposition levels related to effect on trees were much higher and varied
mostly between 1500 and 2500 molc ha−1 a−1 or 20–35 kg ha−1 a−1 (not shownhere). This coincides with the empirical range of 15–30 kg ha−1 a−1 reported byBobbinket al. (1992, 1995). These values were hardly ever exceeded. The calcu-lated N deposition levels were, however, strongly underestimated in source areas(Van Leeuwenet al., this volume). Available literature indicate that elevated Ndeposition is a serious problem in relation to forest condition (e.g. nutrient imbal-ances, elevated susceptibility to natural stress factors) in high N deposition areas,which are mainly located in Western and Central Europe (e.g. Boxmanet al., 1986;De Visser, 1994).
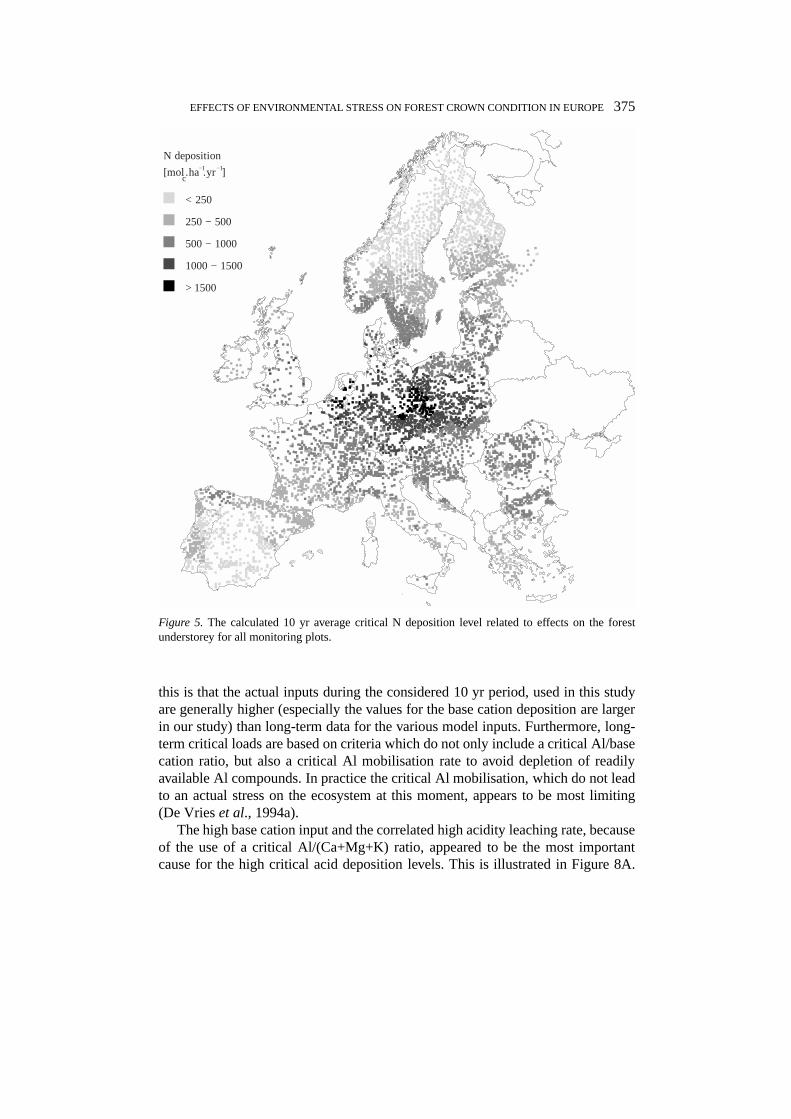
The spatial pattern of critical N deposition levels, related to the occurrence ofvegetation changes (Figure 5) is only partly correlated with the distribution of treespecies over Europe. Extremely low critical N deposition levels (below 250 molc
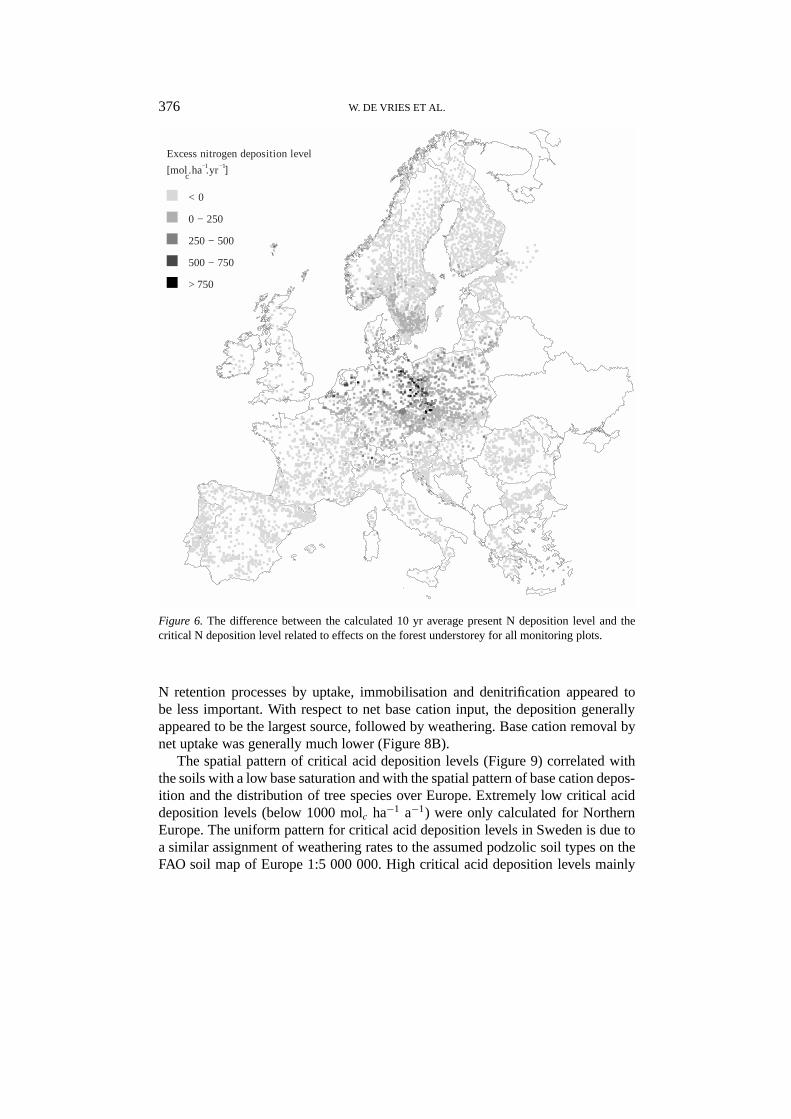
ha−1 a−1) occurred in the Northern countries, where tree growth is limited by theextreme climate and N uptake is low, whereas high values (>1000 molc ha−1 a−1)occurred nearly all in Central Europe. In this region, N immobilisation and deni-trification were enhanced because of the larger input of N from the atmosphere.The relatively low critical N deposition level in Southern Europe (specifically inSpain) was due to the low uptake of N in these areas by slow growing trees such asQuercus ilex. An excess of present N deposition levels over critical N depositionlevels was mainly calculated in the high N deposition areas in Central and WesternEurope (Figure 6).
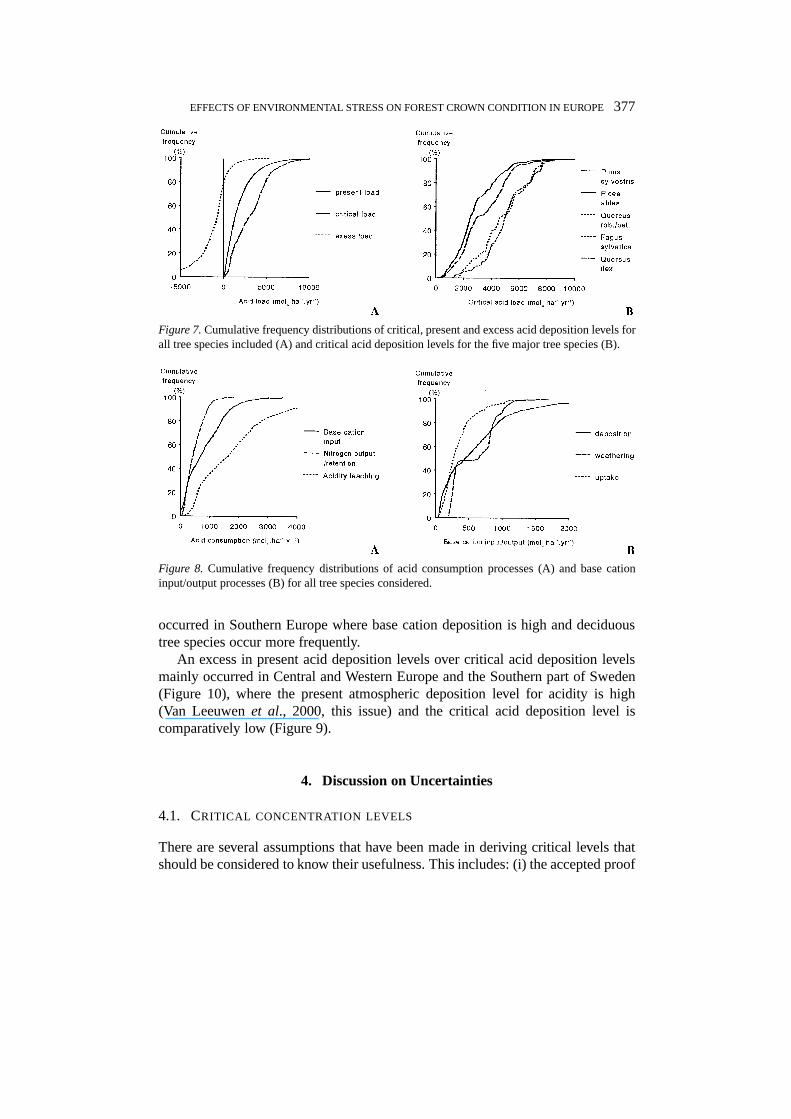
3.2.2. AcidityBoth present deposition levels and critical deposition levels varied mostly between1000 and 8000 molc ha−1 a−1 (Figure 7A). The area where actual critical depositionlevels were exceeded equalled only 12%. Note, however, that calculations of crit-ical deposition levels for acidity were limited to stands with a base saturation ofless than 25%, covering 42% of all the monitoring plots. At these plots, criticaldeposition levels of acidity were thus exceeded in 29% of the cases. The excessof the critical deposition level at these plots varied between 0 and 5400 molc
ha−1 a−1 (Figure 7A). Critical acid deposition levels increased going from theconiferous tree species (Pinus sylvestris) to the deciduous tree species (Quercusrobur + petraeaand Fagus sylvatica; Figure 7B) This is partly due to the factthat the coniferous trees mainly occur on acidic soils with a low weathering ratein areas where base cation deposition is mostly relatively low. Another importantreason is the higher Al/(Ca+Mg+K) ratio used for deciduous trees (1.7) comparedto coniferous trees (0.8).
The actual critical deposition levels for the considered 10 yr period at the vari-ous plots are generally much higher than long-term critical loads derived for forestsoils in Europe (e.g. De Vrieset al., 1994a; Poschet al., 1995b). One reason for
EFFECTS OF ENVIRONMENTAL STRESS ON FOREST CROWN CONDITION IN EUROPE375
N deposition
< 250
250 − 500
500 − 1000
1000 − 1500
> 1500
[molc.ha−1.yr−1]
Figure 5. The calculated 10 yr average critical N deposition level related to effects on the forestunderstorey for all monitoring plots.
this is that the actual inputs during the considered 10 yr period, used in this studyare generally higher (especially the values for the base cation deposition are largerin our study) than long-term data for the various model inputs. Furthermore, long-term critical loads are based on criteria which do not only include a critical Al/basecation ratio, but also a critical Al mobilisation rate to avoid depletion of readilyavailable Al compounds. In practice the critical Al mobilisation, which do not leadto an actual stress on the ecosystem at this moment, appears to be most limiting(De Vrieset al., 1994a).
The high base cation input and the correlated high acidity leaching rate, becauseof the use of a critical Al/(Ca+Mg+K) ratio, appeared to be the most importantcause for the high critical acid deposition levels. This is illustrated in Figure 8A.
376 W. DE VRIES ET AL.
Excess nitrogen deposition level
< 0
0 − 250
250 − 500
500 − 750
> 750
[molc.ha−1.yr−1]
Figure 6. The difference between the calculated 10 yr average present N deposition level and thecritical N deposition level related to effects on the forest understorey for all monitoring plots.
N retention processes by uptake, immobilisation and denitrification appeared tobe less important. With respect to net base cation input, the deposition generallyappeared to be the largest source, followed by weathering. Base cation removal bynet uptake was generally much lower (Figure 8B).
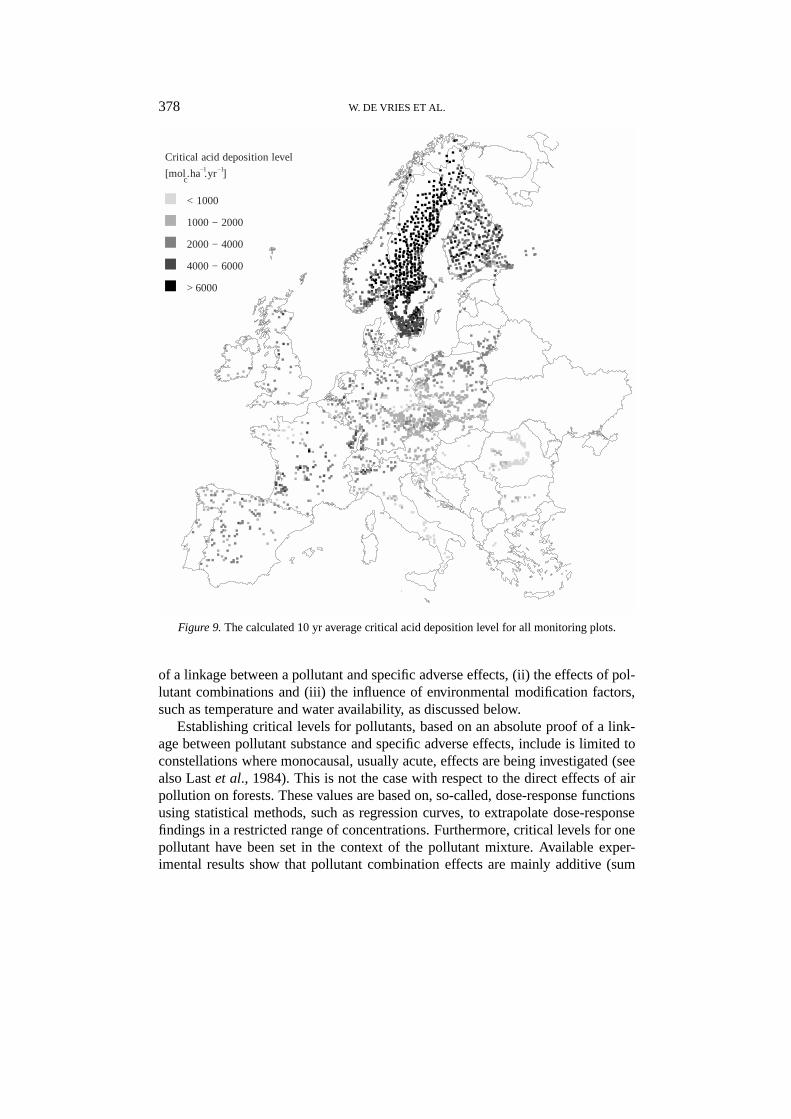
The spatial pattern of critical acid deposition levels (Figure 9) correlated withthe soils with a low base saturation and with the spatial pattern of base cation depos-ition and the distribution of tree species over Europe. Extremely low critical aciddeposition levels (below 1000 molc ha−1 a−1) were only calculated for NorthernEurope. The uniform pattern for critical acid deposition levels in Sweden is due toa similar assignment of weathering rates to the assumed podzolic soil types on theFAO soil map of Europe 1:5 000 000. High critical acid deposition levels mainly
EFFECTS OF ENVIRONMENTAL STRESS ON FOREST CROWN CONDITION IN EUROPE377
Figure 7.Cumulative frequency distributions of critical, present and excess acid deposition levels forall tree species included (A) and critical acid deposition levels for the five major tree species (B).
Figure 8. Cumulative frequency distributions of acid consumption processes (A) and base cationinput/output processes (B) for all tree species considered.
occurred in Southern Europe where base cation deposition is high and deciduoustree species occur more frequently.
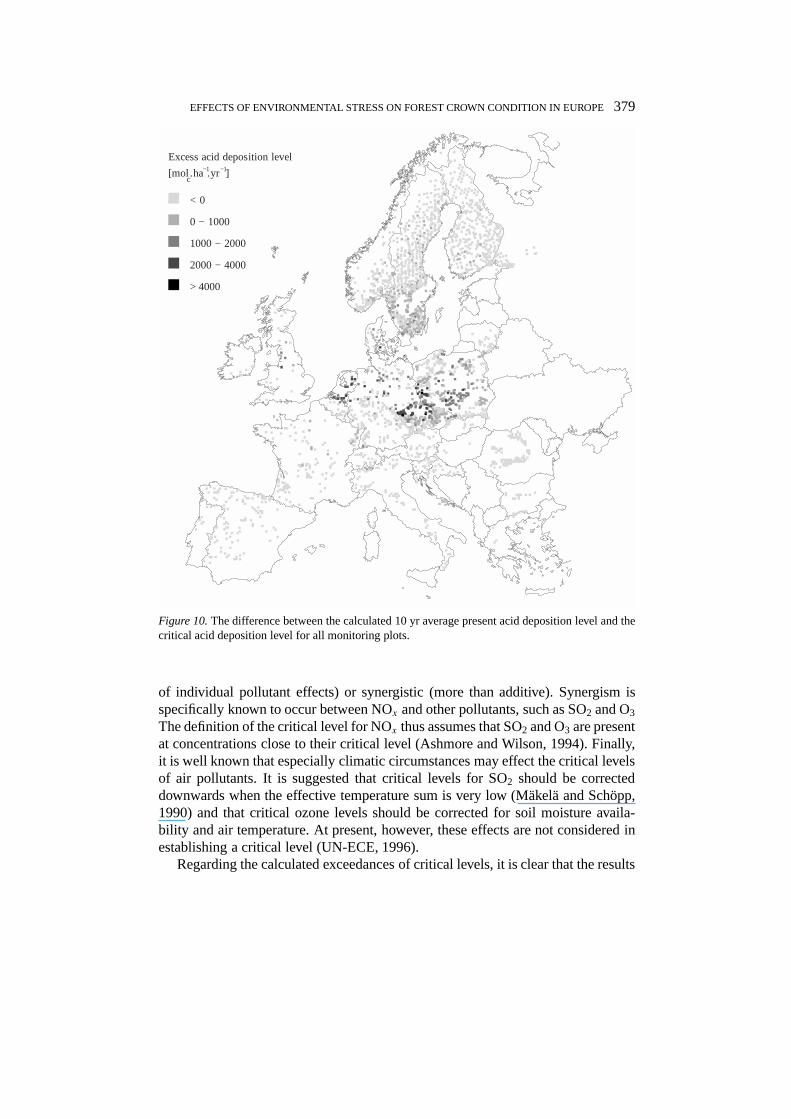
An excess in present acid deposition levels over critical acid deposition levelsmainly occurred in Central and Western Europe and the Southern part of Sweden(Figure 10), where the present atmospheric deposition level for acidity is high(Van Leeuwenet al., 2000, this issue) and the critical acid deposition level iscomparatively low (Figure 9).
4. Discussion on Uncertainties
4.1. CRITICAL CONCENTRATION LEVELS
There are several assumptions that have been made in deriving critical levels thatshould be considered to know their usefulness. This includes: (i) the accepted proof
378 W. DE VRIES ET AL.
Critical acid deposition level
< 1000
1000 − 2000
2000 − 4000
4000 − 6000
> 6000
[molc.ha−1.yr−1]
Figure 9.The calculated 10 yr average critical acid deposition level for all monitoring plots.
of a linkage between a pollutant and specific adverse effects, (ii) the effects of pol-lutant combinations and (iii) the influence of environmental modification factors,such as temperature and water availability, as discussed below.
Establishing critical levels for pollutants, based on an absolute proof of a link-age between pollutant substance and specific adverse effects, include is limited toconstellations where monocausal, usually acute, effects are being investigated (seealso Lastet al., 1984). This is not the case with respect to the direct effects of airpollution on forests. These values are based on, so-called, dose-response functionsusing statistical methods, such as regression curves, to extrapolate dose-responsefindings in a restricted range of concentrations. Furthermore, critical levels for onepollutant have been set in the context of the pollutant mixture. Available exper-imental results show that pollutant combination effects are mainly additive (sum
EFFECTS OF ENVIRONMENTAL STRESS ON FOREST CROWN CONDITION IN EUROPE379
Excess acid deposition level
< 0
0 − 1000
1000 − 2000
2000 − 4000
> 4000
[molc.ha−1.yr−1]
Figure 10.The difference between the calculated 10 yr average present acid deposition level and thecritical acid deposition level for all monitoring plots.
of individual pollutant effects) or synergistic (more than additive). Synergism isspecifically known to occur between NOx and other pollutants, such as SO2 and O3
The definition of the critical level for NOx thus assumes that SO2 and O3 are presentat concentrations close to their critical level (Ashmore and Wilson, 1994). Finally,it is well known that especially climatic circumstances may effect the critical levelsof air pollutants. It is suggested that critical levels for SO2 should be correcteddownwards when the effective temperature sum is very low (Mäkelä and Schöpp,1990) and that critical ozone levels should be corrected for soil moisture availa-bility and air temperature. At present, however, these effects are not considered inestablishing a critical level (UN-ECE, 1996).
Regarding the calculated exceedances of critical levels, it is clear that the results
380 W. DE VRIES ET AL.
are affected by the uncertainties in the calculated concentration levels for SO2,NO2 and NH3 (Van Leeuwenet al., 2000, this issue). The underestimation for theconcentration levels for N compounds means that the negligible excess at all mon-itoring plots is questionable. This is specifically true for NO2, where the calculatedmaximum concentration nearly equals the critical level. For NH3, it is likely thatthere are only very few stands where the critical level is exceeded (stands nearlocal NH3 sources), since the critical value is approximately four times as high asthe calculated maximum concentration level.
4.2. CRITICAL DEPOSITION LEVELS OF NITROGEN
The uncertainty in the calculated critical N deposition levels is mainly due to un-certainties in the assumed critical N leaching rates in relation to effects, modelassumptions and input data as described below.
4.2.1. CriteriaThe choice of the critical N leaching rate strongly affects the critical depositionlevels of N. The nearly negligible N leaching rate that was taken to calculate cri-tical N deposition levels related to vegetation changes might not be appropriate incertain situations. Empirical data on vegetation changes in forest (e.g. Bobbinket al., 1992, 1995) are slightly higher than the calculated critical N depositionlevels, although the results are in a similar order of magnitude. The same is thecase with the critical N deposition levels related to effects on trees. Assumingan uncertainty in the critical N leaching rate of 50%, the resulting uncertainty incritical N deposition levels will be in the same order of magnitude.
4.2.2. Model AssumptionsUncertainties related to the description of N dynamics in the SMB model resultfrom (i) neglecting N fixation which is important for trees such as red alder, (ii)neglecting NH4 fixation which may play a role in clay soils, (iii) assuming thatnitrification is complete, while it is likely to be inhibited at high C/N ratios, (iv)the simple description of net N immobilisation as a function of net atmospheric Ninput and the C/N ratio, while the carbon pool in the soil is fixed and (v) neglectingthe interaction between net N uptake and a change in soil conditions (De Vrieset al., 1994b). Even though the dynamics of the N transformation processes arestrongly simplified, the resulting fluxes for net N uptake, N immobilisation anddenitrification seem plausible in view of available data on these processes for forestsoils (De Vrieset al., 1994a).
4.2.3. Input dataAssuming that the model structure is correct, the effect of the uncertainty in theinput data can directly be quantified (Equation (2)). The most important inputparameter is the net uptake, which is affected by the interpolated yield values and
EFFECTS OF ENVIRONMENTAL STRESS ON FOREST CROWN CONDITION IN EUROPE381
the assumed N contents in stemwood. Comparison between model inputs used ina previous study carried out at a European scale and values derived in variousindividual countries indicated that the overall uncertainty in N uptake was generallyless than 50%, although it can be more than 100% at specific plots (De Vrieset al.,1994a). Consequently, considering the previously mentioned uncertainty in criticalN leaching rates, the resulting uncertainty will also vary mostly within a range ofplus or minus 50%.
4.3. CRITICAL DEPOSITION LEVELS OF ACIDITY
As with nitrogen, the critical acid deposition levels, that were derived by applyingthe SMB model, are subject to (large) uncertainties due to the uncertainties in theassumed critical Al/(Ca+Mg+K) ratios in relation to effects, model assumptionsand input data.
4.3.1. CriteriaUncertainties in critical values for the Al/(Ca+Mg+K) ratio, related to direct toxiceffects of Al, are mainly due to a lack of knowledge about the effects of Al inthe field situation. Values are mainly based on laboratory experiments and theapplicability in the field situation seems often limited. The uncertainty is also partlydue to a natural range in the sensitivity of various tree species for Al toxicity(Sverdrup and Warfvinge, 1993). Note also that we used critical annual averagevalues whereas the temporal variation can be large, with peak values in the sum-mer. Finally, the Al/(Ca+Mg+K) ratio may be irrelevant for peat soils, since Almobilisation hardly occurs in these soils. When one wants to avoid a decrease inbase saturation or pH, the critical acid deposition level is likely to be much lower.
4.3.2. Model AssumptionsFirst of all the derivation of critical loads with a simple mass balance model, limitedto abiotic effects on the soil only, is questionable. The development of multi-stressmodels, including interactions of desiccation, acidification and eutrophication onforests and effects of drought, pests and diseases, are necessary to support theresults of such simplified models. A first comparison of critical deposition levelsfor a Norway spruce stand in Solling (Germany), derived with integrated forest-soilmodels and simple mass balance models seems promising in this context (De Vrieset al., 1995b).
An important assumption in the SMB model is the assumed homogeneity of therootzone both in a horizontal and vertical direction. Use of a one-layer model suchas SMB implies that the critical Al/(Ca+Mg+K) ratio used refers to the situation atthe bottom of the rootzone, whereas most roots occur in the topsoil. Values forthe Al/(Ca+Mg+K) ratio generally increase with depth due to Al mobilisation,BC uptake and transpiration. Other assumptions in the SMB model such as (i)disregarding SO4 interactions, (ii) neglecting complexation of Al with inorganic
382 W. DE VRIES ET AL.
and organic anions and (iii) a simple hydrology are likely to be less significant (DeVries et al., 1994b).
4.3.3. Input DataAssuming that the model structure is correct, the effect of the uncertainty in the in-put data can directly be quantified (Equation (1)). The uncertainty in the calculatednet base cation input (deposition and weathering minus uptake), combined with theuncertainty in Al/(Ca+Mg+K) ratio, which affects the associated acidity leaching,has the largest effect on the calculated critical acid deposition level. Comparisonbetween model inputs used in a previous study carried out at a European scale andvalues derived in various individual countries indicated that the overall uncertaintyof these model inputs was generally less than 50%, although it can be more than100% at specific plots (De Vrieset al., 1994a). At plots where the soil type hasbeen derived by interpolation (e.g. all plots in Sweden), the uncertainty of thesoil related model inputs (all inputs except the base cation deposition) is not onlyaffected by the inherent uncertainty in the estimate itself, but also by the uncertainty(reliability) of the soil map. Considering the above mentioned uncertainties in inputdata, it is likely that the overall uncertainty in critical acid deposition levels variesmostly between plus or minus 50%.
5. Discussion and Conclusions
Direct above-ground impacts of air pollution on a European scale most likely de-crease going from O3 > SO2 > N compounds. Exceedances of critical levels werehigh for ozone, intermediate for SO2 and negligible for NO2 and NH3. Even thoughthe calculated concentration levels of both N compounds are underestimated, it isclear that direct above-ground effects of NOx and NH3 only plays a role at certainlocal circumstances but not on a European scale.
Calculated critical N deposition levels related to the possible occurrence of ve-getation changes in the forest understorey varied mostly between 100 and 1000 molc
ha−1 a−1, which is slightly lower than an empirical range of 500–1400 molc ha−1
a−1. The percentage of plots where these critical N deposition levels are exceededequals 25%. Excess deposition levels mainly occur in Central and Western Europe,such as Germany, Poland, the Czech Republic and The Netherlands, where presentdeposition levels are highest. It is unclear, however whether the changes in forestunderstorey (ground vegetation) are related to crown condition effects. The rangein calculated critical N deposition levels related to effects on trees, such as nutrientimbalances and increased susceptibility to drought, frost and diseases/pests variedmostly between 1500 and 2500 molc ha−1 a−1. These values which coincide withan empirical range, were hardly ever exceeded. The calculated N deposition levelsare, however, underestimated in some areas. In these areas, occurring mainly inCentral and Western Europe, it is well known that N deposition plays an important
EFFECTS OF ENVIRONMENTAL STRESS ON FOREST CROWN CONDITION IN EUROPE383
role in affecting forest vitality.Both present deposition levels and critical deposition levels for acidity varied
mostly between 1000 and 8000 molc ha−1 a−1. The number of plots where criticalacid deposition levels are exceeded equalled 12% of all plots and 29% of the plotswhere base saturation was below 25% and acid inputs may release toxic Al. Thecritical deposition level excess at these plots, which are mainly located in Centraland Western Europe varied between 0 and 5400 molc ha−1 a−1. The excess ofactual critical deposition levels on the level 1 plots was much lower than the excessof long-term critical loads.
The uncertainties in the calculated critical deposition levels for nitrogen andacidity are largely due to uncertainties in the assumed values for critical N leachingrates or critical Al/(Ca+Mg+K) ratios in relation to effects, model assumptions andinput data. High critical N-deposition levels in central Europe, for example, maybe biased by the description of N-immobilisation as a function of N-input. Onaverage the uncertainty likely varies between plus and minus 50%. The uncertaintyin critical deposition level exceedances, which is affected by uncertainties in bothpresent deposition levels and critical deposition levels, can be very high. The cal-culated high exceedances in central Europe are, however, quite reliable consideringair pollution measurements in this area.
The area with excess deposition levels for nitrogen and acidity does coincidewith an area where both current defoliation is high and negative trends in defo-liation were observed (De Vrieset al., 2000, this issue). However, such clustersof plots were also found in southern Europe, especially in Spain, where the atmo-spheric inputs of nitrogen and acidity is generally low. Here, the elevated ozoneconcentrations may be one of the causes for the decline. Such interpretations are,however, of little use unless all relevant stress factors are included in the analyses,as presented in the paper by Klapet al. (2000, this issue).
Acknowledgements
We thankfully acknowledge the European Commission DG VI Forestry Sectionand the Dutch Ministry of Environment for their financial support.
References
Aronsson, A.: 1980,Studia Forest Suecica155, 1.Ashmore, M. R. and Wilson R. B. (eds.): 1994,Critical levels of Air Pollutants for Europe, Back-
ground Papers prepared for ECE Workshop on Critical levels. Egham, U.K. 23–26 March 1992,U.K. department of the environment.
Berdén, M., Nilsson, S. I., Rosén, K. and Tyler, G.: 1987,Soil Acidification Extent, Causes andConsequences, National Swedish Environment Protection Board, Report 3292, 164 pp.
384 W. DE VRIES ET AL.
Bobbink, R., Hornung, M. and Roelofs, J. G. M.: 1995, ‘The Effects of Air-Borne Nitrogen Pollutionon Vegetation-Critical Loads’, in WHO Europe,Updating and Revision of Air Quality Guidelinesfor Europe.
Bobbink, R., Boxman, D., Fremstad, E., Heil, G., Houdijk, A. and Roelofs, J.: 1992, ‘Critical Loadsfor Nitrogen Eutrophication of Terrestrial and Wetland Ecosystems Based Upon Changes in Ve-getation and Fauna’, in P. Grennfelt and E. Thornelof (eds.),Critical Loads for Nitrogen. Reportfrom a Workshop held at Lökeberg, Sweden, 6–10 April 1992. Nordic Council of Ministers,Report 1992, 41, pp. 111–161.
Boxman, A. W. en Van Dijk, H. F. G.: 1988,Het effect van landbouw ammonium deposities op bos-en heidevegetaties, Katholieke Universiteit Nijmegen, 96 pp.
Boxman, A. W., Sinke, R. J. and Roelofs, J. G.: 1986,Water, Air, and Soil Pollut.32, 517.Breeuwsma, A., Chardon, J. P., Kragt, J. F. and De Vries, W.: 1991, ‘Pedotransfer Functions for
Denitrification’, in ECE, 1991,Soil and Groundwater Research Report II ‘Nitrate in Soils’,Commission of the European Community, Luxembourg, pp. 207–215.
De Visser, P. H. B.: 1994,Growth and Nutrition of Douglas-Fir, Scots Pine and Pedunculate Oak inRelation to Soil Acidification, Wageningen, Doctoral thesis, Wageningen Agricultural University,The Netherlands, 185 pp.
De Vries, W.: 1993,Water, Air, and Soil Pollut.68, 399.De Vries, W., 1997: ‘Rates and Mechanisms of Aluminium, Base Cation and Silica Release in Sandy
Soils at pH 3.0.’,Geoderma(submitted).De Vries, W., Posch, M. and Kämäri, J.: 1989,Water, Air, and Soil Pollut.48, 349.De Vries, W., Reinds, G. J. and Posch, M.: 1994a,Water, Air, and Soil Pollut.72, 357.De Vries, W., Posch, M., Reinds, G. J. and Kämäri, J.: 1994b,Water, Air, and Soil Pollut.78, 215.De Vries, W., Van Grinsven, J. J. M., Van Breemen, N., Leeters, E. E. J. M. and Jansen, P. C.: 1995a,
Geoderma67, 17.De Vries, W., Posch, M., Oja, T., Van Oene, H., Kros, J., Warfvinge, P. and Arp, P. A.: 1995b,
Ecological Modelling83, 283.De Vries W., Klap, J. M. and Erisman, J. W.: 2000, ‘Effects of Environmental Stress on Forest Crown
Condition in Europe. Part I: Hypotheses and Approach to the Study’,Water, Air, and Soil Pollut.119, 317.
Fürher, J. and Achermann, B. (eds.): 1994,Critical Levels for Ozone, A UN-ECE workshop report;Schriftenreihe der FAC No16. Berne-Liebefield, 329 pp
Heij, G. J. and Schneider, F. (eds.): 1995,Eind Rapport Additioneel Programma VerzuringsOnderzoek, Derde Fase (1991–1994), Rapport 100-05, 160 pp.
Heij, G. J., De Vries, W., Posthumus, A. C. and Mohren, G. M. J.: 1991, ‘Effects of Air Pollution andAcid Deposition on Forests and Forest Soils’, in T. Schneider and G. J. Heij (eds.),AcidificationResearch in The Netherlands. Final Report of the Dutch Priority Programme on Acidification,Studies in Environmental Science 46, Elsevier Science Publishers, Amsterdam, The Netherlands,pp. 97–137.
Hommel, P. W. F. M., Leeters, E. E. J. M., Mekkink, P. and Vrielink, J. G.: 1990,Vegetation Changesin the Speulderbos (The Netherlands) During the Period 1958–1988, Wageningen, The Nether-lands, DLO Winand Staring Centre for Integrated Land, Soil and Water Research, Report 23,9 pp.
Kärenlampi, L. and Skärby, L. (eds.): 1994,Proceedings of the Workshop on Critical Levels forOzone in Europe, Testing and Finalising the Concepts, Kuopio, Finland, 15–17 April 1996.Published by the University of Kuopio, Dept. of Ecology and Environmental Science.
Klap, J. M., De Vries, W., Hendriks, C. M. A., Oude Voshaar, J. H., Reinds, G. J., Van Leeuwen, E. P.and Erisman, J. W.: 1997,Assessment of the Possibilities to Derive Relationships Between StressFactors and Forest Condition for Europe, DLO Winand Staring Centre for Integrated Land, Soiland Water Research, Report 149.
EFFECTS OF ENVIRONMENTAL STRESS ON FOREST CROWN CONDITION IN EUROPE385
Klap, J. M., Oude Voshaar, J. H., De Vries, W. and Erisman, J. W.: 2000, ‘Effects of EnvironmentalStress on Forest Crown Condition in Europe. Part IV: Statistical Analyses of Relationships’,Water, Air, and Soil Pollut.119, 387.
Last, F. T., Fowler, D. and Freer Smith, P. H.: 1984,Forstwissenschaftliches Zentralblatt103, 28.Mäkelä, A. and Schöpp, W.: 1990, ‘Regional-Scale SO2 Forest-Impact Calculations’, in J. Alcamo,
R. Shaw and L. Hordijk (eds.),1990 The Rains Model of Acidification, Science and Strategies inEurope, Kluwer Academic Publishers, Dordrecht, pp. 263–269.
Morgan, S. M., Lee, J. A. and Ashenden, T. W.: 1992,New Phytologist120, 89.Nilsson, J.: 1986,Critical Loads for Nitrogen and Sulphur, Report 1986: 11, Nordic Council of
Ministers, Copenhagen, Denmark, 183 pp.Nilsson, J. and Grennfelt P. (eds.): 1988,Critical Loads for Sulphur and Nitrogen, Report from
a Workshop held at Skokloster, Sweden, March 19–24, 1988. Miljø rapport 1988: 15. NordicCouncil of Ministers, Copenhagen, Denmark, 418 pp.
Posch, M., de Vries, W. and Hetteling, J. P.: 1995a, ‘Critical Loads of Sulfur and Nitrogen’, in M.Posch, P.A.M. De Smet, J. P. Hettelingh and R. J. Downing (eds.),Calculation and Mappingof Critical Thresholds in Europe, Bilthoven, The Netherlands, Coordination Centre for effects,Status Report 1995, pp. 31–41.
Posch, M., De Smet, P. A. M., Hettelingh J. P. and Downing, R. J. (eds.): 1995b,Calculation andMapping of Critical Thresholds in Europe, Bilthoven, The Netherlands, Coordination Centre foreffects, Status Report 1995, 198 pp.
Roberts, T. M., Skeffington, R. A. and Blank, L. W.: 1989,Forestry62(3), 179–222.Roelofs, J. G. M., Kempers, A. J., Houdijk, A. L. F. M. and Jansen, J.: 1985,Plant and Soil84, 45.Rosén, K.: 1990,The Critical Load of Nitrogen to Swedish Forest Ecosystems, Uppsala, Sweden,
Swedish University of Agriculture Science, Department of forest soils. Internal Report, 15 pp.Sverdrup, H. U. and Warfvinge, P. G.: 1992,Journal of Applied Geochemistry27, 273.Sverdrup, H. U. and Warfvinge, P. G.: 1993,The Effect of Soil Acidification on the Growth of
Trees, Grass and Herbs as Expressed by the (Ca+Mg+K)/Al Ratio, Reports in Ecology andEnvironmental Engineering 1993: 2, Lund University, Department of Chemical Engineering II,108 pp.
Sverdrup, H. and de Vries, W.: 1994,Water, Air, and Soil Pollut.72, 143.Tietema, A. and Beier, C.: 1995,Forest Ecology and Management71, 143.UN-ECE: 1989,Report of the Critical Levels Workshop, Bad Harzburg, Germany, 14–18 March
1988; Federal Environment Agency Berlin, GermanyUN-ECE: 1995,Effects of Nitrogen and Ozone, Report of the International Cooperative Programmes
and the Mapping Program of the Working Group on Effects. EVB. AIR/WF.1/R.110, 77 pp.UN-ECE: 1996,Manual on Methodologies and Criteria for Mapping Critical Levels/Loads and
Geographical Areas Where They are Exceeded, Berlin, Germany. Umwelt Bundes Amt, Texte71/96, 144 pp.
UN/ECE and EC: 1996,Forest Condition in Europe. Report on the 1995 Survey, Geneva, Brussels:UN/ECE, CEC, 156 pp.
Van Breemen, N., Driscoll, C. T. and Mulder, J.: 1984,Nature307, 599.Van Breemen, N. and Verstraten, J. M.: 1991, ‘Soil Acidification and N Cycling’, in T. Schneider and
G. J. Heij (eds.),Acidification Research in The Netherlands. Final Report of the Dutch PriorityProgramme on Acidification, Studies in Environmental Science 46, Elsevier Science Publishers,Amsterdam, The Netherlands, pp. 289–352.
Van Dobben, H. F., Vocks, M. J. M. R., Jansen, E. and Dirkse, G. M.: 1994,Veranderingen in deondergroei van het Nederlandse dennenbos over de periode 1985–1993, IBN Rapport 085, 37 pp.
Van Leeuwen, E. P., Hendriks, C. M. A., de Jong, E., Erisman, J. W., Klap, J. M. and de Vries, W.:2000, ‘Effects of Environmental Stress on Forest Crown Condition in Europe. Part II: Estimationof Stress Induced by Meteorology and Air Pollutants’,Water, Air, and Soil Pollut.119, 335.

386 W. DE VRIES ET AL.
Van Leeuwen E. P., Potma, C. J. M., Draaijers, G. P. J., Erisman, J. W. and Van Pul, W. A. J.:1995,European Wet Deposition Maps Based on Measurements, RIVM report No. 722108006,Bilthoven, The Netherlands.
Van Leeuwen, E. P., Draaijers, G. P. J. and Erisman, J. W.: 1996,Atmospheric Environment30, 2495.Van Leeuwen, E. P., de Jong, P. G. H., Draaijers, G. P. J. and Erisman, J. W.:Mapping Deposition
of Acidifying Components and Base Cations on a Small Scale in Europe: Results for 1993 andModel Evaluation, RIVM report, Bilthoven, The Netherlands (in prep.).
Related Documents


