International Journal of Energy Economics and Policy | Vol 10 • Issue 1 • 2020 360 International Journal of Energy Economics and Policy ISSN: 2146-4553 available at http: www.econjournals.com International Journal of Energy Economics and Policy, 2020, 10(1), 360-370. Effects of Environmental Strategy, Uncertainty and Top Management Commitment on the Environmental Performance: Role of Environmental Management Accounting and Environmental Management Control System Bismark Kusi Appiah 1 , Zhang Donghui 2 , Shapan Chandra Majumder 3 *, Malepekola Precious Monaheng 1 1 PhD Candidate, School of Economics, Shandong University, 27 Shanda Nanlu, Jinan-250100, P. R. China, 2 School of Economics, Shandong University, 27 Shanda Nanlu, Jinan-250100, P. R. China, 3 Department of Economics, Comilla University, Comilla - 3506, Bangladesh.*Email: [email protected] Received: 12 September 2019 Accepted: 13 November 2019 DOI: https://doi.org/10.32479/ijeep.8697 ABSTRACT The aim of this paper is to check the effect of top management commitment, perceived environmental uncertainty and environmental strategy on the environmental performance (EP) of manufacturing firms of China by considering the role of environmental management accounting (EMA) and environmental management control system (EMCS). With the increase in economic activities the environmental issues have also increased. Companies are now more conscious for the preservation of environment and thus are working on it. Environmental Accounting is the system through which companies manage environmental issues. Economic development of any country along with the well-being of that country’s society can only be attained when there is equilibrium between optimization of wealth and environmental protection. This perspective is raising its importance day by day and hence spreading awareness in public and government as well. Therefore, there is more pressure on companies to focus on environmental protection and to align their operations in such a way that there is no damage to the ecosystem. On the basis of results of this research it is believed that EMA and EMCS play very important role in the achievement of perfect EP. EMA and EMCS are two separate tools and good mediators which improve the performance of the firm regarding environment and align the management regarding environmental costs with sequence. This study will help government and manufacturing firms in making policies regarding environment friendliness through EMA and EMCS as previous studies have also generated same kind of help and benefits. Keywords: China, Environmental Strategy, Environmental Management Control System, Environmental Management Accounting JEL Classifications: Q56, Q58 1. INTRODUCTION Environmental management accounting (EMA) is progressively gaining importance in the field of research for sustainable firms (Burritt and Schaltegger, 2014). This is for the reason that now stakeholders are much aware about the environmental issues and the solutions regarding it, therefore, they pressurize the managers to consider more the evaluation of environmental performance (EP) (Burritt and Schaltegger, 2010; Rodrigue et al., 2013). For many companies the purpose of attaining better environmental management is that the key indicators which they consider for and as a competitive advantage are the usage of and the execution of environmental strategies (Gunarathne and Lee, 2015; Lisi, 2015). Albelda Pérez et al. (2007), stated about the ingredients of continuous and sustainable environmental improvement which need the involvement of intangible assets consisting of: (i) This Journal is licensed under a Creative Commons Attribution 4.0 International License

Welcome message from author
This document is posted to help you gain knowledge. Please leave a comment to let me know what you think about it! Share it to your friends and learn new things together.
Transcript
International Journal of Energy Economics and Policy | Vol 10 • Issue 1 • 2020360
International Journal of Energy Economics and Policy
ISSN: 2146-4553
available at http: www.econjournals.com
International Journal of Energy Economics and Policy, 2020, 10(1), 360-370.
Effects of Environmental Strategy, Uncertainty and Top Management Commitment on the Environmental Performance: Role of Environmental Management Accounting and Environmental Management Control System
Bismark Kusi Appiah1, Zhang Donghui2, Shapan Chandra Majumder3*, Malepekola Precious Monaheng1
1PhD Candidate, School of Economics, Shandong University, 27 Shanda Nanlu, Jinan-250100, P. R. China, 2School of Economics, Shandong University, 27 Shanda Nanlu, Jinan-250100, P. R. China, 3Department of Economics, Comilla University, Comilla - 3506, Bangladesh.*Email: [email protected]
Received: 12 September 2019 Accepted: 13 November 2019 DOI: https://doi.org/10.32479/ijeep.8697
ABSTRACT
The aim of this paper is to check the effect of top management commitment, perceived environmental uncertainty and environmental strategy on the environmental performance (EP) of manufacturing firms of China by considering the role of environmental management accounting (EMA) and environmental management control system (EMCS). With the increase in economic activities the environmental issues have also increased. Companies are now more conscious for the preservation of environment and thus are working on it. Environmental Accounting is the system through which companies manage environmental issues. Economic development of any country along with the well-being of that country’s society can only be attained when there is equilibrium between optimization of wealth and environmental protection. This perspective is raising its importance day by day and hence spreading awareness in public and government as well. Therefore, there is more pressure on companies to focus on environmental protection and to align their operations in such a way that there is no damage to the ecosystem. On the basis of results of this research it is believed that EMA and EMCS play very important role in the achievement of perfect EP. EMA and EMCS are two separate tools and good mediators which improve the performance of the firm regarding environment and align the management regarding environmental costs with sequence. This study will help government and manufacturing firms in making policies regarding environment friendliness through EMA and EMCS as previous studies have also generated same kind of help and benefits.
Keywords: China, Environmental Strategy, Environmental Management Control System, Environmental Management Accounting JEL Classifications: Q56, Q58
1. INTRODUCTION
Environmental management accounting (EMA) is progressively gaining importance in the field of research for sustainable firms (Burritt and Schaltegger, 2014). This is for the reason that now stakeholders are much aware about the environmental issues and the solutions regarding it, therefore, they pressurize the managers to consider more the evaluation of environmental performance
(EP) (Burritt and Schaltegger, 2010; Rodrigue et al., 2013). For many companies the purpose of attaining better environmental management is that the key indicators which they consider for and as a competitive advantage are the usage of and the execution of environmental strategies (Gunarathne and Lee, 2015; Lisi, 2015). Albelda Pérez et al. (2007), stated about the ingredients of continuous and sustainable environmental improvement which need the involvement of intangible assets consisting of: (i)
This Journal is licensed under a Creative Commons Attribution 4.0 International License
Appiah, et al.: Effects of Environmental Strategy, Uncertainty and Top Management Commitment on the Environmental Performance: Role of Environmental Management Accounting and Environmental Management Control System
International Journal of Energy Economics and Policy | Vol 10 • Issue 1 • 2020 361
Employee knowledge (ii) employee awareness (iii) expertise and skills of employee (iv) manager commitment (v) communication and coordination among all the related functions of the firm (vi) a specific planning which links the corporate strategy to the environmental issues, and at the end (vii) the usage of good accounting practices. And these accounting practices need the persisting involvement of the management accountants for the best performance of company using better environmental strategy (ES). Guenther et al. (2016) claimed that environmental management control system (EMCS) provides an approach of integrating the lines of enquiry regarding the managerial processes and internal drivers that may help in the improvement of financial and EP. In general, the meaning of management control system means rules, systems, values, practices and other activities which management considers getting employee behaviour. EMCS provides the opportunity of integrating the environmental issues with company’s ES and processes.
The sector on which this study is conducted is manufacturing sector. China is 30th in the list of world largest manufacturing countries. 20% of total revenue of China comes from manufacturing sector. Therefore, this sector holds much importance in the economy of China. But this is also that sector which causes the environmental issues most. Manufacturing firms make policies and systems to combat with the environmental issues. So, there is a dire need to make research on this sector that whether or not the EMA and EMCS affect the EP. Almost all organizations want sustainable EP by inducing environmental components and representing them to the stakeholders for the better repute and image. But many companies are not reporting their environmental concerns due to which their EP defuses due to not acting upon the environmental standards set by the government or law-making bodies. But the absence of these law-making bodies is also another problem. Due to the absence of these bodies proper check and balance is not put on companies and then consequently these companies don’t follow environmental laws. And again, due to this top management commitment (TMC) remain absent, proper environmental strategies are not made and then environmental uncertainty increases. These all factors affect the EP of the companies. These problems are found only in developing countries because in developed countries the rules regarding the implementation of environmental laws are very strict and no company can violate those rules. These problems don’t affect the financial performance but pollute the environment too much and ultimately become cause of global warming. When companies don’t implement environmental laws and make pollution, this casts very bad impact on the customers and they detach from that company’s products. And as a whole, if all companies in a country don’t follow environmental laws and create pollution then that country will be on the list of most polluted countries and will be defamed from business world too. For all these problems the implementation of EMA and EMCS is very important because these factors have set proper rules and regulation regarding environmental issues and this is the only solution to control these problems.
1.1. Research Objectives• To determine the effect of TMC on EP of manufacturing firms.• To assess the effect of ES on EP of manufacturing firms.
• To find the effect of perceived environmental uncertainty (PEU) on EP of manufacturing firms.
• To check the effect of TMC on EP of manufacturing firms through EMA and also through EMCS.
• To evaluate the effect of ES on EP of manufacturing firms through EMA and EMCS.
• To know the effect of PEU on EP of manufacturing firms through EMA and EMCS.
2. LITERATURE REVIEW
2.1. ES and EP with EMCS and EMAScholars have highlighted that strategies employed in a business are closely coupled to the performance associated. Good strategies enhance the EP and those strategies can be implemented and regulated by EMCS and EMA. The necessary subject here to address is however how the organizations respond to the environment. The effects of ES focus on three parts of the company; product, price and stakeholders’ relationships, both internal and external. Hence, if or not it will bring about a reduction in price of the corporation high sales and product quality and high stakeholders’ relations both internal and external. Cost is required to be outlined as a result the associate capricious use of “cost” in the study of the environment. A number of researchers have equalled the cost to “production cost”. Meanwhile, price may be studied from a wider view. It’s going to consider production price, capital cost, and total price (Hart, 1995; Darnall and Edwards, 2006). Considering the influence on product, initial studies saw sturdy relationships between environmental practices and enhancement in products results and method quality (Pil and Rothenberg, 2003). Melnyk et al. (2003) showed that companies which have initial environmental management systems improved their product quality whilst those who have certified programs were even higher than those without Ginsberg and Bloom (2009) indicated the short falls selling strategy. They reason that in other to reply to customers’ concerns about environmental problem, distributors will encounter the market into totally different reminder inexperienced, blue greens, dollar greens, sprouts, basic browns and grousers. In terms of impact on company relations with varied stakeholders, initial studies shows that being proactive environmentally improve a company’s image and shows the loyalty of such major stakeholders as customers, government and employees (Hart, 1995; Shrivastava, 1995b). Researchers have indicated that sensible community relations will enhance a company to get competitive advantage through tax benefits, a minimized protective burden, and enhanced within the quality of local labour force (Waddock and Graves, 1997.)H1a: There is significant positive relationship between environmental
strategies and EP.H1b: There is positive relationship between ES and EP through
EMA.H1c: There is positive relationship between ES and EP through
EMCS.
2.2. TMC with EPAuthors have suggested it is the duty of top management to introduce a solid culture which can enable liberty and boost the ability of worker to make environmental advances without any
Appiah, et al.: Effects of Environmental Strategy, Uncertainty and Top Management Commitment on the Environmental Performance: Role of Environmental Management Accounting and Environmental Management Control System
International Journal of Energy Economics and Policy | Vol 10 • Issue 1 • 2020362
interference. ISO 14000 necessitates an extensive contribution from all the employees at all levels in the organization (Anusingh et al., 2015). This is possibly achieved if the overall management is more dedicated towards work and diligent towards all employees. Commitment of the prime management and the performance with in an environment are linked with the efficiency and effectiveness of management control systems (Jing and Lin, 2008). Since managers are key players for the determination of management control system, they play a role in regulating the ways through which management control systems are implemented. Scholars have argued that if top management is less committed or less effective, then the firm would fail to provide quality services and overall performance will also be affected. Management systems make sure that employees become better at decision making (Poksinska et al., 2003). Authors have described that whenever the manager are commitment towards such change in plans in which environmental strategies have to be incorporated in manufacturing processes then it is easy to enhance EP. Some other authors have also described the same view that commitment can enhance implementation in programs and those programs can be about EP.H2a: TMC has positive effect on the EP.H2b: The greater the top management involvement, the greater will
be EP in an organization through EMAH2c: TMC has positive effect on the EP through EMCS.
2.3. EMA and EMCS with EPEMCS is regarded as a vital tool for monitoring and evaluation hence developing the firm’s EP. It also provides important information of the existing firm’s condition. Therefore, it significantly contributes to the examination of current EP (Daryani et al., 2012; Jasch, 2000). ISO has launched EMCS principles to hinder different applications in in miscellaneous countries and the uniform activities. Hence, the organizations carry out their activities according to the guidelines provided by ISO 14001 EMCS principles. The uses of management accounting tools in EP are performance analysis system within the build of company environment performance analysis system supported four basic dimensions of the balanced scorecard. The development of Balanced Scorecard framework of company’s EP supported the suitable fusion of the environmental indicators and Balanced Scorecard. Original four dimensions build the mix between the qualitative indicators and quantitative indicators; the money indicators and non-financial indicators return true. Scholars’ ways of building EP analysis system by the BSC are placing the environmental indicator into a part of dimensions and adding new environmental dimension.
Qian and Hong (2012) combined the social responsibility and balanced scorecard to structure four dimensions (financial, stakeholders, internal environmental management, learning and growth) company EP analysis system underneath the social responsibility perspective. Zheng and Liu (2013) established a company EP analysis system at goal of maximizing price for investors in four dimensions (financial, customer, internal processes, learning and growth) of balanced scorecard framework: they planned the thought of environmental strategic price, and analysed the practicability of linking the GEVA and environmental strategic price within the money dimensions; at the educational
and growth dimension, they planned the employment of Kaplan and Norton’s strategic readiness to assess the terms of intangible assets for company ES, and mentioned a way to judge company’s ES readiness at four dimensions of human capital readiness, inexperienced technology readiness, inexperienced resources readiness, stakeholders’ readiness.
2.4. Environmental Uncertainty and EPPrevious studies on the link between environmental uncertainty and performances showed that these two are oppositely related. Lorenzi et al. (1981) found evidence that showed uncertainty results in decrease performance, but the nature of the relationship continues to be in doubt. Downey and Slocum (1975) together found a negative relationship between perceived uncertainty and management’s performance. Meanwhile, Pennings (1975) in Gerloff et al., (1991) showed no relationship among perceived uncertainty, performance and structure. Aldag (1975 in Gerloff et al., (1991) found the familiar levels of uncertainty might result in completely different performances. The believed that internal and external uncertainty need structural amendment and flexibility severally. Based on that, it’s necessary to separate the two uncertainties. A major debate on the impact of uncertainty on performance is; the distinction between real surroundings and managers’ perception. Bourgeois (1985) indicates that once compliance exist between the surroundings, since it’s extreme and also the surroundings, because it is perceived by high managers, the economic performance of the organization gets higher.H3a: There is an inverse relationship between environmental
uncertainty and EP.H3b: There is positive effect of PEU on the use of EMAH3c: There is positive effect of PEU on the use of EMCS.
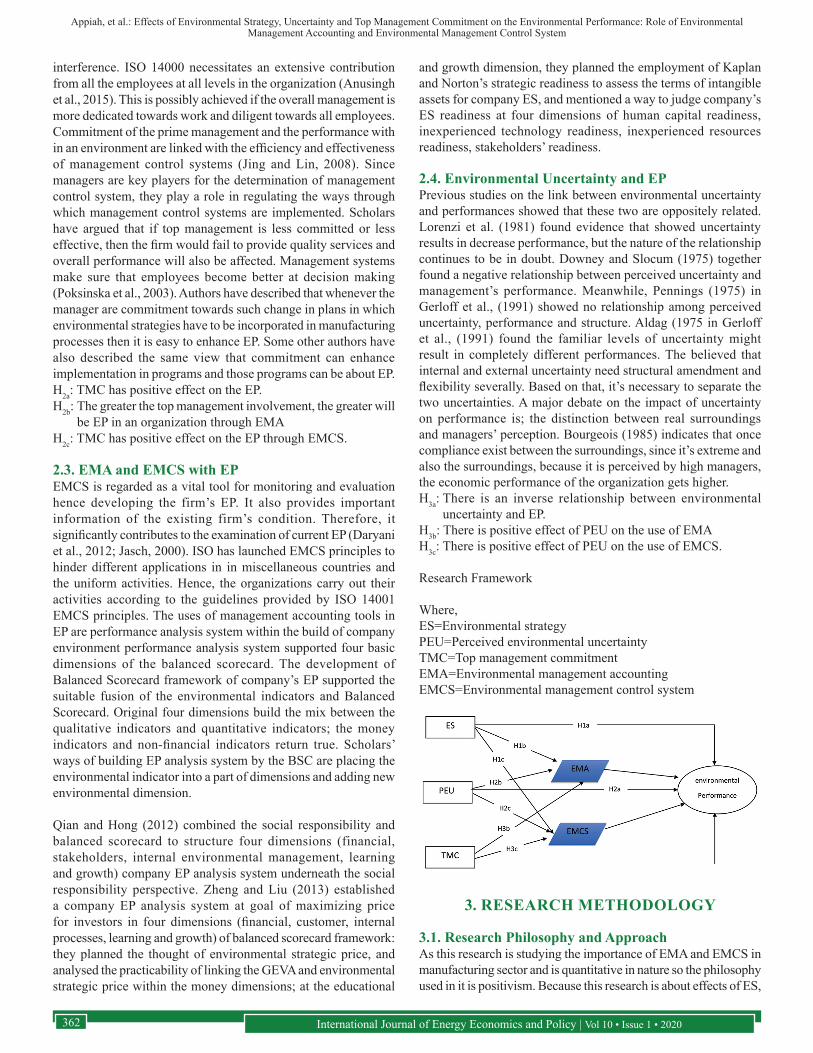
Research Framework
Where,ES=Environmental strategyPEU=Perceived environmental uncertaintyTMC=Top management commitmentEMA=Environmental management accountingEMCS=Environmental management control system
3. RESEARCH METHODOLOGY
3.1. Research Philosophy and ApproachAs this research is studying the importance of EMA and EMCS in manufacturing sector and is quantitative in nature so the philosophy used in it is positivism. Because this research is about effects of ES,
Appiah, et al.: Effects of Environmental Strategy, Uncertainty and Top Management Commitment on the Environmental Performance: Role of Environmental Management Accounting and Environmental Management Control System
International Journal of Energy Economics and Policy | Vol 10 • Issue 1 • 2020 363
uncertainty and TMC with the role of EMA and EMCS. It is studying reality as an objective opinion not as the subjective opinion, and it is not interfering the already studied phenomenon. Moreover, this study is testing various hypothesis and the relationships of these variables have been studied in past so to remain unbiased is very important. That’s why the best suited philosophy for this research was positivism and positivism is used in it. As, this research is about EMA and EMCS and is quantitative in nature and is testing different hypothesis therefore, deductive approach has been used in it. Moreover, another reason for adopting deductive approach is that the study has moved from general literature review of ES, environmental uncertainty, TMC, EMA and EMCS towards the specific sector which is manufacturing sector and then hypothesis have been tested after the collection of data. As, the data has been collected in a specific environment and the objective of this study is not to build a new theory but is only testing the hypothesis on the already existing theory therefore best suited approach was deductive approach. This research work used quantitative method because the data collected was primary and numeric. As, objective opinion can explain more comprehensively about EMA and EMCS instead of subjective opinion and qualitative approach that’s why quantitative method has been used.
3.2. Research Nature and Time HorizonThis research work is explanatory in nature as it is not replicating the existing work which was about the EMA but now a new variable has been added which is EMCS and is a mediator. Moreover, this study is checking the relationships between ES, environmental uncertainty and TMC on the EP with the role of EMA and EMCS which is also the reason for being explanatory in nature. The current study is cross-sectional kind of research as; data collected in it is 1-time data. From multiple respondents i.e., different manufacturing firm’s data have been collected in one short time. Cross-sectional type was used because time for collection of data was limited and one observation was enough for this study. No repeated observations were required. Moreover, it also has some benefits like it is less expensive and don’t take much time of the researcher. It is also beneficial in gathering all data about all variables in one-shot (Lillis and Mundy, 2005).
3.3. Population and SamplingThe population for this research is upper level employees of the manufacturing firms of China i.e. finance managers, cost mangers, general managers, accounts managers or collectively the top management of the firms. The sector selected for this study was manufacturing sector of China as it is that sector which is contributing 20% revenue to total revenue of China and is also under growth and needs more research on it so that improvements can be made in the functions of manufacturing firms. As, this research is about the application of EMA and environment is more effected by the pollutants of manufacturing firms and EMA is also practiced by manufacturing firms that’s why the manufacturing sector was selected. And top management was contacted to get information because they have accurate information about upper level operations. The sample size was not randomly selected but according to the formula given by (Kline, 2015) which is:
Number of questionnaire items×10
3.4. ProcedureThere were 40 items in the questionnaire of this study which were then multiplied by 10 hence, 400 responses were required to satisfy the generalizability of the results of this research work. 48 e-questionnaires were sent to the managers of different firms through e-mail, 137 e-questionnaires were got filled from different groups on social media and remaining 215 paper questionnaires were distributed by personal visit to the manufacturing firms. After sending reminders to the managers only 19 responses were collected from the questionnaires which were sent by e-mail. Amongst 215 paper questionnaires 15 were not returned, 38 questionnaires were not properly filled, 5 questionnaires were blank and 6 were incomplete. So, the total useable questionnaires were 317 which were enough for the analysis hence, the response rate was 79.25%. The response rate which is equal or >70% is very good (Babbie, 1991) hence 79.25% response rate of this research is more than enough and is very good.
3.5. Data AnalysisAs, this research is quantitative in nature so the software which were used for analysis were SPSS and AMOS. Every software has its pros and cons but the reason behind choosing these two software is their features and acceptability (Tabachnick and Fidell, 2007). The initial analysis like normality test, outliers and missing values were performed through SPSS v20 and then main analysis like regression, correlation and mediation were run through AMOS v21. When there are more than one independent and dependent variables, AMOS is very suitable in such a case and it was main reason that AMOS was used for main analysis. Moreover, AMOS has the feature of path analysis and SEM. To analyse the structural relationships SEM has been used. This technique is the amalgamation of multiple regression analysis and factor analysis and it has been used to analyse the structural relationship of measured variables and theories. Whereas, the path analysis is a straight forward for multiple regression and its objective is to provide the estimates of the significance and magnitude of the hypothesized relationships between the variables (Hair et al., 2006; Tabachnick and Fidell, 2007).
4. ANALYSIS AND RESULTS
4.1. Demographic TraitsFor the data collection of this research 400 questionnaires were required but 317 questionnaires were received which were complete and useable for analysis. Table 1 demonstrates that there were total 243 males and 74 were females.
However, equivalence had not been achieved regarding the gender of respondents; females as managers are very few in the manufacturing sector of China. The reason behind it may be that females don’t get equal opportunities as compared to the males. May be females don’t prefer companies to work in due to uncomfortable environment that is why females are more in education sector and also in banking sector as compared to the manufacturing sector. In order to empower the females, more opportunities must be given to females and the environment of manufacturing sector should be made easier and more comfortable that the number of females in this sector can be increased. Because
Appiah, et al.: Effects of Environmental Strategy, Uncertainty and Top Management Commitment on the Environmental Performance: Role of Environmental Management Accounting and Environmental Management Control System
International Journal of Energy Economics and Policy | Vol 10 • Issue 1 • 2020364
if males and females both will struggle for the development of economy then economy will grow definitely (Sinha et al., 2019).
The figures in the table above display that the target group of most of the respsondents is business. It signifies that in the manufacturing sector most of the employees are young fresh graduates.
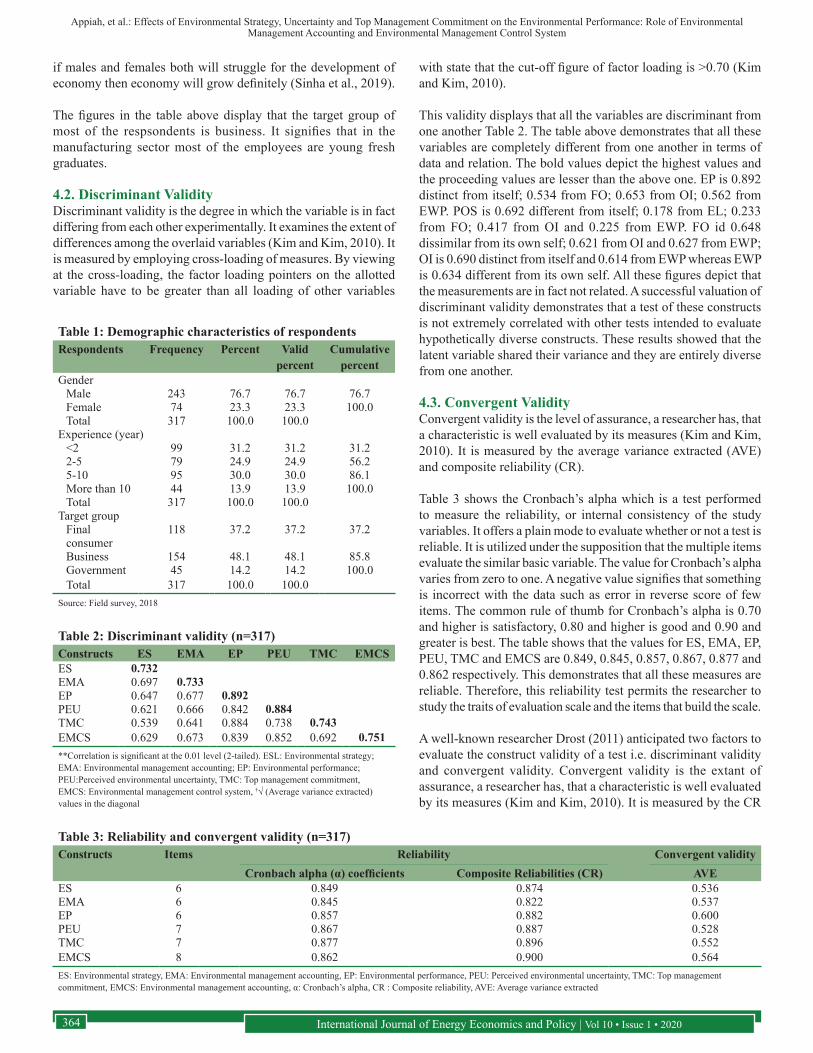
4.2. Discriminant ValidityDiscriminant validity is the degree in which the variable is in fact differing from each other experimentally. It examines the extent of differences among the overlaid variables (Kim and Kim, 2010). It is measured by employing cross-loading of measures. By viewing at the cross-loading, the factor loading pointers on the allotted variable have to be greater than all loading of other variables
with state that the cut-off figure of factor loading is >0.70 (Kim and Kim, 2010).
This validity displays that all the variables are discriminant from one another Table 2. The table above demonstrates that all these variables are completely different from one another in terms of data and relation. The bold values depict the highest values and the proceeding values are lesser than the above one. EP is 0.892 distinct from itself; 0.534 from FO; 0.653 from OI; 0.562 from EWP. POS is 0.692 different from itself; 0.178 from EL; 0.233 from FO; 0.417 from OI and 0.225 from EWP. FO id 0.648 dissimilar from its own self; 0.621 from OI and 0.627 from EWP; OI is 0.690 distinct from itself and 0.614 from EWP whereas EWP is 0.634 different from its own self. All these figures depict that the measurements are in fact not related. A successful valuation of discriminant validity demonstrates that a test of these constructs is not extremely correlated with other tests intended to evaluate hypothetically diverse constructs. These results showed that the latent variable shared their variance and they are entirely diverse from one another.
4.3. Convergent ValidityConvergent validity is the level of assurance, a researcher has, that a characteristic is well evaluated by its measures (Kim and Kim, 2010). It is measured by the average variance extracted (AVE) and composite reliability (CR).
Table 3 shows the Cronbach’s alpha which is a test performed to measure the reliability, or internal consistency of the study variables. It offers a plain mode to evaluate whether or not a test is reliable. It is utilized under the supposition that the multiple items evaluate the similar basic variable. The value for Cronbach’s alpha varies from zero to one. A negative value signifies that something is incorrect with the data such as error in reverse score of few items. The common rule of thumb for Cronbach’s alpha is 0.70 and higher is satisfactory, 0.80 and higher is good and 0.90 and greater is best. The table shows that the values for ES, EMA, EP, PEU, TMC and EMCS are 0.849, 0.845, 0.857, 0.867, 0.877 and 0.862 respectively. This demonstrates that all these measures are reliable. Therefore, this reliability test permits the researcher to study the traits of evaluation scale and the items that build the scale.
A well-known researcher Drost (2011) anticipated two factors to evaluate the construct validity of a test i.e. discriminant validity and convergent validity. Convergent validity is the extant of assurance, a researcher has, that a characteristic is well evaluated by its measures (Kim and Kim, 2010). It is measured by the CR
Table 1: Demographic characteristics of respondentsRespondents Frequency Percent Valid
percentCumulative
percentGender
Male 243 76.7 76.7 76.7Female 74 23.3 23.3 100.0Total 317 100.0 100.0
Experience (year)<2 99 31.2 31.2 31.22-5 79 24.9 24.9 56.25-10 95 30.0 30.0 86.1More than 10 44 13.9 13.9 100.0Total 317 100.0 100.0
Target groupFinal consumer
118 37.2 37.2 37.2
Business 154 48.1 48.1 85.8Government 45 14.2 14.2 100.0Total 317 100.0 100.0
Source: Field survey, 2018
Table 2: Discriminant validity (n=317)Constructs ES EMA EP PEU TMC EMCSES 0.732EMA 0.697 0.733EP 0.647 0.677 0.892PEU 0.621 0.666 0.842 0.884TMC 0.539 0.641 0.884 0.738 0.743EMCS 0.629 0.673 0.839 0.852 0.692 0.751**Correlation is significant at the 0.01 level (2-tailed). ESL: Environmental strategy; EMA: Environmental management accounting; EP: Environmental performance; PEU:Perceived environmental uncertainty, TMC: Top management commitment, EMCS: Environmental management control system, †√ (Average variance extracted) values in the diagonal
Table 3: Reliability and convergent validity (n=317)Constructs Items Reliability Convergent validity
Cronbach alpha (α) coefficients Composite Reliabilities (CR) AVEES 6 0.849 0.874 0.536EMA 6 0.845 0.822 0.537EP 6 0.857 0.882 0.600PEU 7 0.867 0.887 0.528TMC 7 0.877 0.896 0.552EMCS 8 0.862 0.900 0.564ES: Environmental strategy, EMA: Environmental management accounting, EP: Environmental performance, PEU: Perceived environmental uncertainty, TMC: Top management commitment, EMCS: Environmental management accounting, α: Cronbach’s alpha, CR : Composite reliability, AVE: Average variance extracted
Appiah, et al.: Effects of Environmental Strategy, Uncertainty and Top Management Commitment on the Environmental Performance: Role of Environmental Management Accounting and Environmental Management Control System
International Journal of Energy Economics and Policy | Vol 10 • Issue 1 • 2020 365
and AVE. AVE evaluates the degree of discrepancy observed by a variable against the degree caused by evaluation error, standards higher than 0.7 are considered very well, while, the value of 0.5 is also satisfactory. CR is a less partial measure of reliability than Cronbach’s alpha. It cut off value is 0.7. Convergent validity is basically the examination of strong correlations between two tests that are anticipated to estimate the similar variable. The CR values are 0.874, 0.822, 0.882, 0.887, 0.896 and 0.900 for ES, EMA, EP, PEU, TMC and EMCS respectively. As all these values are >0.7 which implies that these values are acceptable, and the model of these constructs are satisfactory. The AVE values are 0.536, 0.537, 0.600, 0.528, 0.552, and 0.564 for ES, EMA, EP, PEU, TMC and EMCS correspondingly. All these values are higher than 0.50 which means that these are acceptable values. Therefore, the established convergent validity depicts that these constructs are associated are actually related with each other.
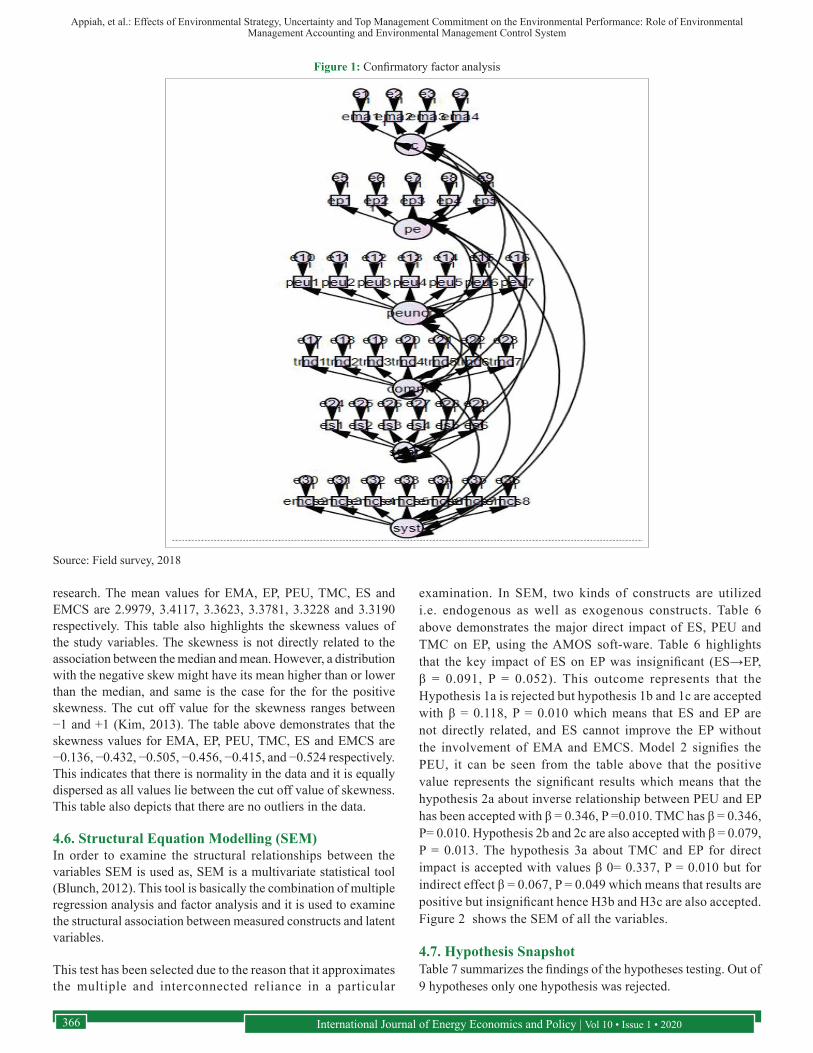
4.4. Confirmatory Factor Analysis (CFA)The CFA is a multivariate arithmetic process which is used to examine how good the studied hypothesis indicates the figure of variables. In CFA, the researcher identifies the figure of aspects needed in the data and which studied construct is related to which latent construct as shown in Figure 1.
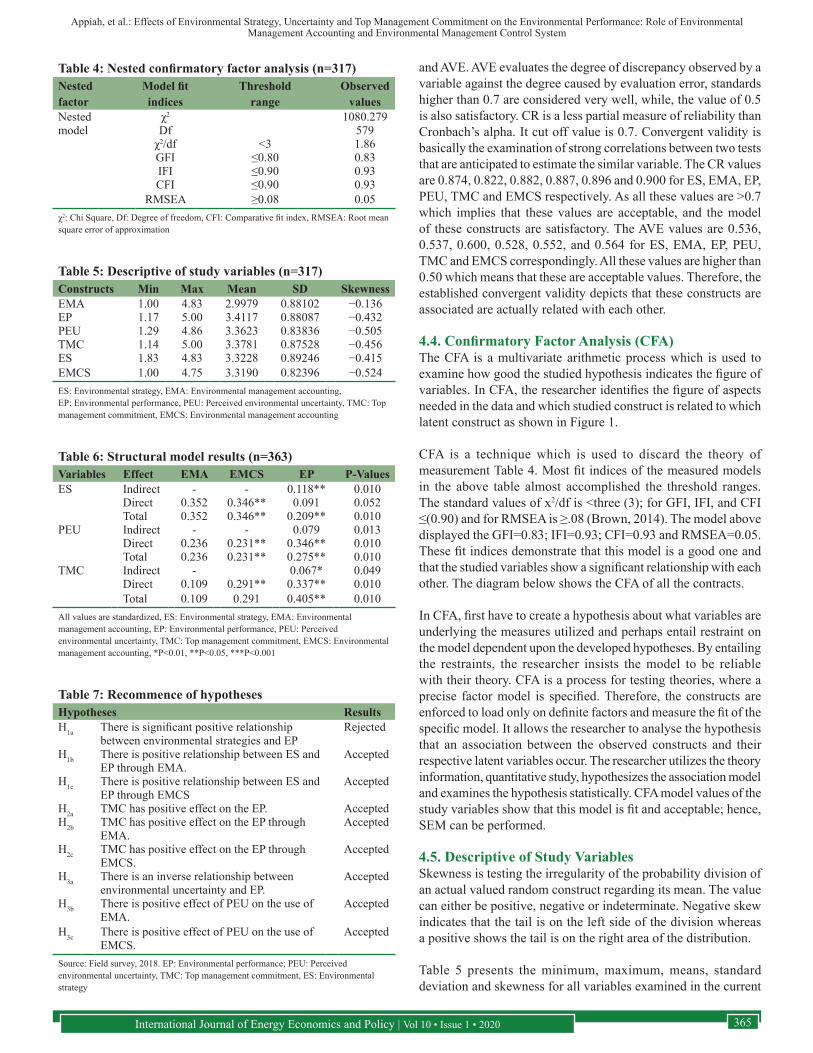
CFA is a technique which is used to discard the theory of measurement Table 4. Most fit indices of the measured models in the above table almost accomplished the threshold ranges. The standard values of x2/df is <three (3); for GFI, IFI, and CFI ≤(0.90) and for RMSEA is ≥.08 (Brown, 2014). The model above displayed the GFI=0.83; IFI=0.93; CFI=0.93 and RMSEA=0.05. These fit indices demonstrate that this model is a good one and that the studied variables show a significant relationship with each other. The diagram below shows the CFA of all the contracts.
In CFA, first have to create a hypothesis about what variables are underlying the measures utilized and perhaps entail restraint on the model dependent upon the developed hypotheses. By entailing the restraints, the researcher insists the model to be reliable with their theory. CFA is a process for testing theories, where a precise factor model is specified. Therefore, the constructs are enforced to load only on definite factors and measure the fit of the specific model. It allows the researcher to analyse the hypothesis that an association between the observed constructs and their respective latent variables occur. The researcher utilizes the theory information, quantitative study, hypothesizes the association model and examines the hypothesis statistically. CFA model values of the study variables show that this model is fit and acceptable; hence, SEM can be performed.
4.5. Descriptive of Study VariablesSkewness is testing the irregularity of the probability division of an actual valued random construct regarding its mean. The value can either be positive, negative or indeterminate. Negative skew indicates that the tail is on the left side of the division whereas a positive shows the tail is on the right area of the distribution.
Table 5 presents the minimum, maximum, means, standard deviation and skewness for all variables examined in the current
Table 5: Descriptive of study variables (n=317)Constructs Min Max Mean SD SkewnessEMA 1.00 4.83 2.9979 0.88102 −0.136EP 1.17 5.00 3.4117 0.88087 −0.432PEU 1.29 4.86 3.3623 0.83836 −0.505TMC 1.14 5.00 3.3781 0.87528 −0.456ES 1.83 4.83 3.3228 0.89246 −0.415EMCS 1.00 4.75 3.3190 0.82396 −0.524ES: Environmental strategy, EMA: Environmental management accounting, EP: Environmental performance, PEU: Perceived environmental uncertainty, TMC: Top management commitment, EMCS: Environmental management accounting
Table 6: Structural model results (n=363)Variables Effect EMA EMCS EP P-Values ES Indirect
Direct Total
-0.3520.352
-0.346**0.346**
0.118**0.091
0.209**
0.0100.0520.010
PEU Indirect Direct Total
-0.2360.236
-0.231**0.231**
0.0790.346**0.275**
0.0130.0100.010
TMC Indirect - 0.067* 0.049Direct 0.109 0.291** 0.337** 0.010Total 0.109 0.291 0.405** 0.010
All values are standardized, ES: Environmental strategy, EMA: Environmental management accounting, EP: Environmental performance, PEU: Perceived environmental uncertainty, TMC: Top management commitment, EMCS: Environmental management accounting, *P<0.01, **P<0.05, ***P<0.001
Table 7: Recommence of hypothesesHypotheses ResultsH1a There is significant positive relationship
between environmental strategies and EPRejected
H1b There is positive relationship between ES and EP through EMA.
Accepted
H1c There is positive relationship between ES and EP through EMCS
Accepted
H2a TMC has positive effect on the EP. AcceptedH2b TMC has positive effect on the EP through
EMA.Accepted
H2c TMC has positive effect on the EP through EMCS.
Accepted
H3a There is an inverse relationship between environmental uncertainty and EP.
Accepted
H3b There is positive effect of PEU on the use of EMA.
Accepted
H3c There is positive effect of PEU on the use of EMCS.
Accepted
Source: Field survey, 2018. EP: Environmental performance; PEU: Perceived environmental uncertainty, TMC: Top management commitment, ES: Environmental strategy
Table 4: Nested confirmatory factor analysis (n=317)Nested factor
Model fit indices
Threshold range
Observed values
Nested model
χ2 1080.279Df 579
χ2/df <3 1.86GFI ≤0.80 0.83IFI ≤0.90 0.93CFI ≤0.90 0.93
RMSEA ≥0.08 0.05χ2: Chi Square, Df: Degree of freedom, CFI: Comparative fit index, RMSEA: Root mean square error of approximation
Appiah, et al.: Effects of Environmental Strategy, Uncertainty and Top Management Commitment on the Environmental Performance: Role of Environmental Management Accounting and Environmental Management Control System
International Journal of Energy Economics and Policy | Vol 10 • Issue 1 • 2020366
research. The mean values for EMA, EP, PEU, TMC, ES and EMCS are 2.9979, 3.4117, 3.3623, 3.3781, 3.3228 and 3.3190 respectively. This table also highlights the skewness values of the study variables. The skewness is not directly related to the association between the median and mean. However, a distribution with the negative skew might have its mean higher than or lower than the median, and same is the case for the for the positive skewness. The cut off value for the skewness ranges between −1 and +1 (Kim, 2013). The table above demonstrates that the skewness values for EMA, EP, PEU, TMC, ES and EMCS are −0.136, −0.432, −0.505, −0.456, −0.415, and −0.524 respectively. This indicates that there is normality in the data and it is equally dispersed as all values lie between the cut off value of skewness. This table also depicts that there are no outliers in the data.
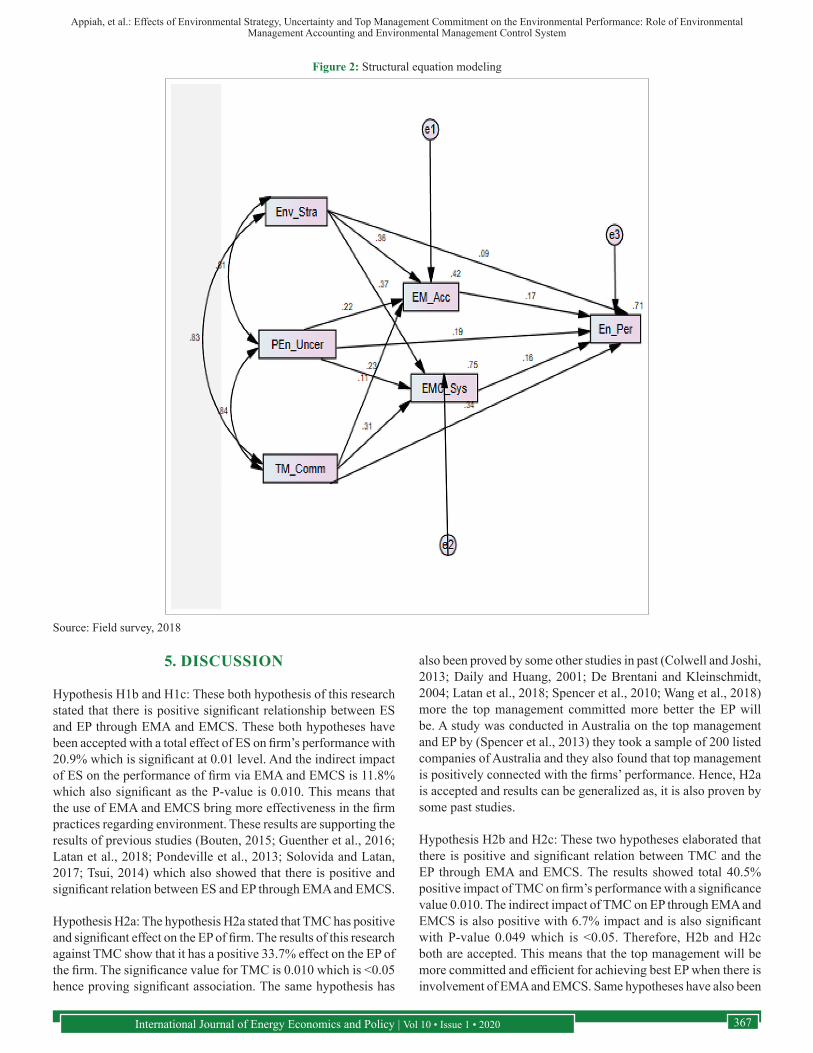
4.6. Structural Equation Modelling (SEM)In order to examine the structural relationships between the variables SEM is used as, SEM is a multivariate statistical tool (Blunch, 2012). This tool is basically the combination of multiple regression analysis and factor analysis and it is used to examine the structural association between measured constructs and latent variables.
This test has been selected due to the reason that it approximates the multiple and interconnected reliance in a particular
examination. In SEM, two kinds of constructs are utilized i.e. endogenous as well as exogenous constructs. Table 6 above demonstrates the major direct impact of ES, PEU and TMC on EP, using the AMOS soft-ware. Table 6 highlights that the key impact of ES on EP was insignificant (ES→EP, β = 0.091, P = 0.052). This outcome represents that the Hypothesis 1a is rejected but hypothesis 1b and 1c are accepted with β = 0.118, P = 0.010 which means that ES and EP are not directly related, and ES cannot improve the EP without the involvement of EMA and EMCS. Model 2 signifies the PEU, it can be seen from the table above that the positive value represents the significant results which means that the hypothesis 2a about inverse relationship between PEU and EP has been accepted with β = 0.346, P =0.010. TMC has β = 0.346, P= 0.010. Hypothesis 2b and 2c are also accepted with β = 0.079, P = 0.013. The hypothesis 3a about TMC and EP for direct impact is accepted with values β 0= 0.337, P = 0.010 but for indirect effect β = 0.067, P = 0.049 which means that results are positive but insignificant hence H3b and H3c are also accepted. Figure 2 shows the SEM of all the variables.
4.7. Hypothesis SnapshotTable 7 summarizes the findings of the hypotheses testing. Out of 9 hypotheses only one hypothesis was rejected.
Source: Field survey, 2018
Figure 1: Confirmatory factor analysis
Appiah, et al.: Effects of Environmental Strategy, Uncertainty and Top Management Commitment on the Environmental Performance: Role of Environmental Management Accounting and Environmental Management Control System
International Journal of Energy Economics and Policy | Vol 10 • Issue 1 • 2020 367
5. DISCUSSION
Hypothesis H1b and H1c: These both hypothesis of this research stated that there is positive significant relationship between ES and EP through EMA and EMCS. These both hypotheses have been accepted with a total effect of ES on firm’s performance with 20.9% which is significant at 0.01 level. And the indirect impact of ES on the performance of firm via EMA and EMCS is 11.8% which also significant as the P-value is 0.010. This means that the use of EMA and EMCS bring more effectiveness in the firm practices regarding environment. These results are supporting the results of previous studies (Bouten, 2015; Guenther et al., 2016; Latan et al., 2018; Pondeville et al., 2013; Solovida and Latan, 2017; Tsui, 2014) which also showed that there is positive and significant relation between ES and EP through EMA and EMCS.
Hypothesis H2a: The hypothesis H2a stated that TMC has positive and significant effect on the EP of firm. The results of this research against TMC show that it has a positive 33.7% effect on the EP of the firm. The significance value for TMC is 0.010 which is <0.05 hence proving significant association. The same hypothesis has
also been proved by some other studies in past (Colwell and Joshi, 2013; Daily and Huang, 2001; De Brentani and Kleinschmidt, 2004; Latan et al., 2018; Spencer et al., 2010; Wang et al., 2018) more the top management committed more better the EP will be. A study was conducted in Australia on the top management and EP by (Spencer et al., 2013) they took a sample of 200 listed companies of Australia and they also found that top management is positively connected with the firms’ performance. Hence, H2a is accepted and results can be generalized as, it is also proven by some past studies.
Hypothesis H2b and H2c: These two hypotheses elaborated that there is positive and significant relation between TMC and the EP through EMA and EMCS. The results showed total 40.5% positive impact of TMC on firm’s performance with a significance value 0.010. The indirect impact of TMC on EP through EMA and EMCS is also positive with 6.7% impact and is also significant with P-value 0.049 which is <0.05. Therefore, H2b and H2c both are accepted. This means that the top management will be more committed and efficient for achieving best EP when there is involvement of EMA and EMCS. Same hypotheses have also been
Source: Field survey, 2018
Figure 2: Structural equation modeling
Appiah, et al.: Effects of Environmental Strategy, Uncertainty and Top Management Commitment on the Environmental Performance: Role of Environmental Management Accounting and Environmental Management Control System
International Journal of Energy Economics and Policy | Vol 10 • Issue 1 • 2020368
accepted in other research works like (Dangelico, 2015; Gibassier and Alcouffe, 2018; Latan et al., 2018; Roetzel et al., 2018) hence the results can be generalized.
Hypothesis H3a: This hypothesis is about PEU that there is inverse relationship between environmental uncertainty and firm’s performance. The outcomes of this research revealed that the results are positive at 34.6% with a significance value of 0.010 which means that this hypothesis is accepted, and environmental uncertainty do affect the performance of an organization. Ani (2011) conducted a case study research on PEU and chose the telecommunication sector of Ghana. He selected one telecommunication organization out of six and he found that environmental uncertainty does influence the working of a firm and are inversely related to each other. Some other authors also studied the same hypothesis and their results were also the same (Folami and Powers, 2009; Lewis and Harvey, 2001). As, this hypothesis was not included in the base paper which was (Latan et al., 2018) so, no support from that research could be found.
Hypotheses H3b and H3c: These two hypotheses indicated the indirect effect of PEU on firm’s performance through EMA and EMCS that there is positive effect of PEU on the use of EMA and EMCS to improve EP. Total results showed a positive 27.75% effect of PEU on the use of EMA and EMCS with a P-value of 0.010 while the indirect effect of PEU for the usage of EMA and EMCS for improving firm’s performance was 7.9% with level of significance 0.013 which is <0.05 and hence the results are accepted. Previous studies also support the results of current research so results can be generalized (Ani, 2011; Latan et al., 2018; Samsami et al., 2015).
6. CONCLUSION
This research intended to study the impact of the intangible assets, which are the part of all the organizational resources, on the EP so that a continuous improvement in the EP can be achieved. This research work has filled the gap which was presented by Latan et al. (2018) that if the EMCS is also taken as mediator along with EMA then more accurate results can be found. Moreover, this research work extended the hypothesis testing of (Latan et al., 2018) by contributing the direct impact of PEU on the EP. In this thesis it was argued that to achieve the improvement in the EP, TMC is required, implementation of the suitable ES and usage of EMA and EMCS. The outcomes have confirmed the predictions of the researcher. This study supports the hypothesis that the blend of all the resources which are inherent in the organizations like, ES, TMC and awareness about uncertainty of environment can improve the EP continuously. It is elaborated from the empirical evidence that there is positive relationship between the organization’s resources (variables of this research) on the EP except one hypothesis which was about direct effect of ES on EP. Findings has been confirmed by some prior studies (Gibassier and Alcouffe, 2018; Guenther et al., 2016; Horne et al., 2018; Latan et al., 2018; Lillis and Mundy, 2005; Mansor et al., 2013; Polit and Beck, 2009; Pondeville et al., 2013). Moreover, on the basis of results of this research it is believed that EMA and EMCS play very important role in the achievement of perfect EP. EMA and EMCS are two separate
tools and good mediators which improve the performance of the firm regarding environment and align the management regarding environmental costs with sequence.
6.1. ImplicationsThis research will contribute to the existing literature review on EMA and EMCS and literature on empirical evidences on these variables will increase also. In addition, it will contribute the general literature review. This research work will provide motivation to the manufacturing firms to consider the environmental procedures so that these firms can improve their EP through EMA and EMCS. Because, this provides a proper check and balance on TMC and makes proper ES by mitigating environmental uncertainty. This study will help government and manufacturing firms in making policies regarding environment friendliness through EMA and EMCS as previous studies have also generated same kind of help and benefits.
6.2. Limitations and Further SuggestionsThere are some limitations which were faced to this research that should be considered. First, the sample size selected for this study was limited and from China due to short time period. The researcher had only 4 months to complete the entire process of research. Moreover, the results can only be applicable in China. Second, this study is based on China and data was only collected from the manufacturing sector. Third, this study collected 1-time data by using the cross-sectional method. Forth, this study did not use the basic dimensions of environmental accounting and did research without going in the depth of dimensions. Fifth, this research only considered EP for testing and ignored the impact on financial performance and on economy as a whole (Journeault, 2016; Saeidi and Othman, 2017; Wang et al., 2018).
REFERENCES
Ani, I.Y. (2011), The Relationship Between Environmental Uncertainty and Business-level Strategy in the Telecommunications Sector in Ghana. Ghana: Heriot-Watt University.
Anusingh, L., Shikha, G. (2015), Impact of green human resource factors on environmental performance in manufacturing companies: An empirical evidence. International Journal of Engineering and Management Sciences, 6(1), 25-30.
Babbie, E. (1991), The Practice of Social Research, Wadsworth. Belmont, CA, California. P. Burnard. p461-466.
Blunch, N. (2012), Introduction to Structural Equation Modeling Using IBM SPSS Statistics and AMOS. London: Sage.
Bouten, L. (2015), Environmental management control systems: The role of contextual and strategic factors. Social and Environmental Accountability Journal, 35(1), 66-67.
Bourgeois, L.J 3rd. (1985), Strategic goals, perceived uncertainty, and economic performance in volatile environments. Academy of Management Journal, 28(3), 548-573.
Brown, T.A. (2014), Confirmatory Factor Analysis for Applied Research. New York: Guilford Publications.
Burritt, R., Schaltegger, S. (2014), Accounting towards sustainability in production and supply chains. The British Accounting Review, 46(4), 327-343.
Burritt, R.L., Schaltegger, S. (2010), Sustainability accounting and reporting: Fad or trend? Accounting, Auditing and Accountability Journal, 23(7), 829-846.
Appiah, et al.: Effects of Environmental Strategy, Uncertainty and Top Management Commitment on the Environmental Performance: Role of Environmental Management Accounting and Environmental Management Control System
International Journal of Energy Economics and Policy | Vol 10 • Issue 1 • 2020 369
Colwell, S.R., Joshi, A.W. (2013), Corporate ecological responsiveness: Antecedent effects of institutional pressure and top management commitment and their impact on organizational performance. Business Strategy and the Environment, 22(2), 73-91.
Daily, B.F., Huang, S.C. (2001), Achieving sustainability through attention to human resource factors in environmental management. International Journal of Operations and Production Management, 21(12), 1539-1552.
Dangelico, R.M. (2015), Improving firm environmental performance and reputation: The role of employee green teams. Business Strategy and the Environment, 24(8), 735-749.
Darnall, N., Edwards, D Jr. (2006), Predicting the cost of environmental management system adoption: The role of capabilities, resources and ownership structure. Strategic Management Journal, 27(4), 301-320.
Daryani, S.M., Ali, S., Asli-zadeh, A. (2012), Organizational theory, systemic thinking and system management. International Journal of Organizational Leadership, 1(2), 71-79.
De Brentani, U., Kleinschmidt, E.J. (2004), Corporate culture and commitment: impact on performance of international new product development programs. Journal of Product Innovation Management, 21(5), 309-333.
Downey, H.K., Slocum, J.W. (1975), Uncertainty: Measures, research, and sources of variation. Academy of Management Journal, 18(3), 562-578.
Drost, E.A. (2011), Validity and reliability in social science research. Education Research and Perspectives, 38(1), 105-123.
Folami, L.B., Powers, T.L. (2009), Managerial and functional influences on perceived environmental uncertainty. Journal of Finance and Accountancy, 1, 1-14.
Gerloff, E.A., Muir, N.K., Bodensteiner, W.D. (1991), Three components of perceived environmental uncertainty: An exploratory analysis of the effects of aggregation. Journal of Management, 17(4), 749-768.
Ginsberg, J.M., Bloom, P.N. (2004), Choosing the right green marketing strategy. MIT Sloan Management Review, 46(1), 79-84.
Gibassier, D., Alcouffe, S. (2018), Environmental management accounting: The missing link to sustainability? Social and Environmental Accountability Journal, 38, 1-18.
Guenther, E., Endrikat, J., Guenther, T.W. (2016), Environmental management control systems: A conceptualization and a review of the empirical evidence. Journal of Cleaner Production, 136, 147-171.
Gunarathne, N., Lee, K.H. (2015), Environmental management accounting (EMA) for environmental management and organizational change: An eco-control approach. Journal of Accounting and Organizational Change, 11(3), 362-383.
Hair, J.F., Black, W.C., Babin, B.J., Anderson, R.E., Tatham, R.L. (2006), Multivariate Data Analysis. Vol. 6. Upper Saddle River, NJ: Pearson Prentice Hall.
Hart, O. (1995), Corporate governance: Some theory and implications. The Economic Journal, 105(430), 678-689.
Horne, A.C., Szemis, J.M., Webb, J.A., Kaur, S., Stewardson, M.J., Bond, N., Nathan, R. (2018), Informing environmental water management decisions: Using conditional probability networks to address the information needs of planning and implementation cycles. Environmental Management, 61(3), 347-357.
Jasch, C. (2000), Environmental performance evaluation and indicators. Journal of Cleaner Production, 8(1), 79-88.
Jing, C., Lin, F. (2008), Dynamic model of environmental performance evaluation for industrial enterprises based on eco-efficiency. China Environment Science, 27(5), 717-720.
Journeault, M. (2016), The influence of the eco-control package on environmental and economic performance: A natural resource-based approach. Journal of Management Accounting Research, 28(2), 149-178.
Kim, H.Y. (2013), Statistical notes for clinical researchers: assessing normal distribution (2) using skewness and kurtosis. Restorative Dentistry and Endodontics, 38(1), 52-54.
Kim, M.G., Kim, J. (2010), Cross-validation of reliability, convergent and discriminant validity for the problematic online game use scale. Computers in Human Behavior, 26(3), 389-398.
Kline, R.B. (2015), Principles and Practice of Structural Equation Modeling. New York: Guilford Publications.
Latan, H., Jabbour, C.J.C., de Sousa Jabbour, A.B.L., Wamba, S.F., Shahbaz, M. (2018), Effects of environmental strategy, environmental uncertainty and top management’s commitment on corporate environmental performance: The role of environmental management accounting. Journal of Cleaner Production, 180, 297-306.
Lewis, G.J., Harvey, B. (2001), Perceived environmental uncertainty: The extension of Miller’s scale to the natural environment. Journal of Management Studies, 38(2), 201-234.
Lillis, A.M., Mundy, J. (2005), Cross-sectional field studies in management accounting research closing the gaps between surveys and case studies. Journal of Management Accounting Research, 17(1), 119-141.
Lisi, I.E. (2015), Translating environmental motivations into performance: The role of environmental performance measurement systems. Management Accounting Research, 29, 27-44.
Lorenzi, P., Sims, H.P Jr., Slocum, J.W Jr. (1981), Perceived environmental uncertainty: An individual or environmental attribute?. Journal of Management, 7(2), 27-41.
Mansor, N., Che-Ahmad, A., Ahmad-Zaluki, N., Osman, A. (2013), Corporate governance and earnings management: A study on the Malaysian family and non-family owned PLCs. Procedia Economics and Finance, 7, 221-229.
Melnyk, S.A., Sroufe, R.P., Calantone, R. (2003), Assessing the impact of environmental management systems on corporate and environmental performance. Journal of Operations Management, 21(3), 329-351.
Pennings, J.M. (1975), The relevance of the structural-contingency model for organizational effectiveness. Administrative Science Quarterly, 20(3), 393-410.
Pérez, E.A., Ruiz, C.C., Fenech, F.C. (2007), Environmental management systems as an embedding mechanism: a research note. Accounting, Auditing and Accountability Journal, 20(3), 403-422.
Pil, F.K., Rothenberg, S. (2003), Environmental performance as a driver of superior quality. Production and Operations Management, 12(3), 404-415.
Polit, D.F., Beck, C.T. (2009), International gender bias in nursing research, 2005-2006: A quantitative content analysis. International Journal of Nursing Studies, 46(8), 1102-1110.
Poksinska, B., Dahlgaard, J.J., Eklund, J.A. (2003), Implementing ISO 14000 in Sweden: motives, benefits and comparisons with ISO 9000. International Journal of Quality and Reliability Management, 20(5), 585-606.
Pondeville, S., Swaen, V., De Rongé, Y. (2013), Environmental management control systems: The role of contextual and strategic factors. Management Accounting Research, 24(4), 317-332.
Qian, Z., Hong, S. (2012), A study on the building of enterprises’ environmental performance Index system in social responsibility perspective. Business Economy, 7, 54-56.
Rodrigue, M., Magnan, M., Boulianne, E. (2013), Stakeholders’ influence on environmental strategy and performance indicators: A managerial perspective. Management Accounting Research, 24(4), 301-316.
Roetzel, P.G., Pedell, B., Stehle, A., Hummel, K. (2018), Integrating Environmental Management Control Systems-Boosting the Translation of Environmental Strategy into Environmental Managerial Performance. Research Paper.
Saeidi, S.P., Othman, M.S.H. (2017), The mediating role of process
Appiah, et al.: Effects of Environmental Strategy, Uncertainty and Top Management Commitment on the Environmental Performance: Role of Environmental Management Accounting and Environmental Management Control System
International Journal of Energy Economics and Policy | Vol 10 • Issue 1 • 2020370
and product innovation in the relationship between environmental management accounting and firm’s financial performance. International Journal of Business Innovation and Research, 14(4), 421-438.
Samsami, F., Hosseini, S.H.K., Kordnaeij, A., Azar, A. (2015), Managing environmental uncertainty: From conceptual review to strategic management point of view. International Journal of Business and Management, 10(7), 215-229.
Shrivastava, P. (1995a), Ecocentric management for a risk society. Academy of Management Review, 20(1), 118-137.
Shrivastava, P. (1995b), Environmental technologies and competitive advantage. Strategic Management Journal, 16(S1), 183-200.
Sinha, M., Mahapatra, S.S., Dutta, A., Sengupta, P.P. (2019), Microfinance and Women Empowerment: An Empirical Analysis. Handbook of Research on Microfinancial Impacts on Women Empowerment, Poverty, and Inequality. London ODI. p52-64.
Solovida, G.T., Latan, H. (2017), Linking environmental strategy to environmental performance: Mediation role of environmental management accounting. Sustainability Accounting, Management and Policy Journal, 8(5), 595-619.
Spencer, S., Adams, C., Yapa, P. (2010), The Mediating Effects of the Use of an Environmental Information System on top Management’s Commitment and Environmental Performance. Paper Presented at
the Global Accounting and Organizational Change Conference.Spencer, S.Y., Adams, C., Yapa, P.W. (2013), The mediating effects
of the adoption of an environmental information system on top management’s commitment and environmental performance. Sustainability Accounting, Management and Policy Journal, 4(1), 75-102.
Tabachnick, B.G., Fidell, L.S. (2007), Using Multivariate Statistics. Boston, MA: Allyn and Bacon/Pearson Education.
Tsui, C.S. (2014), A literature review on environmental management accounting (EMA) adoption. Web Journal of Chinese Management Review, 17(3), 1-19.
Wang, S., Li, J., Zhao, D. (2018), Institutional pressures and environmental management practices: The moderating effects of environmental commitment and resource availability. Business Strategy and the Environment, 27(1), 52-69.
Waddock, S.A., Graves, S.B. (1997), The corporate social performance financial performance link. Strategic Management Journal, 18(4), 303-319.
Zheng, L.Q., Liu, Y. (2013), Government leading or stockholders leading -the comparison of two environmental performance management methods. Journal of North China Electric Power University, 2(1), 25-30.
Related Documents