EFFECTS OF DIFFERENT DRYING METHODS ON THE TOTAL PHENOLICS, ANTIOXIDANT PROPERTIES, AND FUNCTIONAL PROPERTIES OF APPLE POMACE DDDDDDDDDDDDDDDDDDDDDDDDDDDDDDDDDDDDDDDDDDDDDDDDDDDDDD By DDDDDDDDDDDDDDDDDDDDDDDDDDDDDDDDDDDDDDDDDDDDDDDDDDDDDD Mohammed Tuwayrish Aldosari A THESIS DDDDDDDDDDDDDDDDDDDDDDDDDDDDDDDDDDDDDDDDDDDDDDDDDDDDDD Submitted to Michigan State University in partial fulfillment of the requirements for the degree of DDDDDDDDDDDDDDDDDDDDDDDDDDDDDDDDDD Food Science—Master of Science DDDDDDDDDDDDDDDDDDDDDDDDDDDDDDDDDDDDDDDDDDDDDDDDDDDDDD 2014

Welcome message from author
This document is posted to help you gain knowledge. Please leave a comment to let me know what you think about it! Share it to your friends and learn new things together.
Transcript

EFFECTS OF DIFFERENT DRYING METHODS ON THE TOTAL PHENOLICS, ANTIOXIDANT PROPERTIES, AND FUNCTIONAL PROPERTIES O F APPLE
POMACE DDDDDDDDDDDDDDDDDDDDDDDDDDDDDDDDDDDDDDDDDDDDDDDDDDDDDD
By DDDDDDDDDDDDDDDDDDDDDDDDDDDDDDDDDDDDDDDDDDDDDDDDDDDDDD
Mohammed Tuwayrish Aldosari
A THESIS DDDDDDDDDDDDDDDDDDDDDDDDDDDDDDDDDDDDDDDDDDDDDDDDDDDDDD
Submitted to Michigan State University
in partial fulfillment of the requirements for the degree of
DDDDDDDDDDDDDDDDDDDDDDDDDDDDDDDDDD Food Science—Master of Science
DDDDDDDDDDDDDDDDDDDDDDDDDDDDDDDDDDDDDDDDDDDDDDDDDDDDDD2014

ABSTRACT ddddddddddddddddddddddddddddddddddddddddddddddddddd dddddddddd
EFFECTS OF DIFFERENT DRYING METHODS ON THE TOTAL PHENOLICS, ANTIOXIDANT PROPERTIES, AND FUNCTIONAL PROPERTIES O F APPLE
POMACE ddddddddddddddddddddddddddddddddddddddddddddddddddd dddddddddd
By ddddddddddddddddddddddddddddddddddddddddddddddddddd dddddddddd
Mohammed Tuwayrish Aldosari ddddddddddddddddddddddddddddddddddddddddddddddddddd ddddddddd
Apple pomace was dried using three different drying methods: freeze drying at
air temperature of 20ºC, drum drying at drum temperature of 140ºC, and cabinet drying
at air temperatures of 60 ºC, 80 ºC, and 100 ºC. The dried samples were measured
using Hunter Color CIE L*,a*, and b* values. The total color difference (△E) of apple
pomace was affected by the drying temperature and the type of drying method. The
freeze dried pomace was significantly higher in L* value compared to all of the other
samples, whereas cabinet drying at 100°C showed the highest average color a* and b*
values. The dried apple pomace was analyzed for total phenolics and antioxidant
capacity using ORAC, and DPPH. The total phenolics of dried pomace, with the highest
value ( 3.05 mg GAE/g) observed in freeze dried and the lowest (1.85 mg GAE/g). In
the cabinet dried pomace, total phenolics decreased gradually as the process
temperature was increased from 60 °C to 80 °C or 10 0 °C. Freeze dried pomace had
the highest antioxidant activity as exhibited by ORAC and DPPH results, 350.27 and
278.8 µmol TE/g, db, respectively. Drum drying of pomace at 140 °C reduced activity to
158.06 and 216.45 µmol TE/g, db, by ORAC and DPPH assays, respectively. Cabinet
drying of pomace resulted in lower antioxidant values as drying temperature increased
from 60 °C to 80 °C or 100 °C.

iii
ACKNOWLEDGEMENTS kkkkkkkkkkkkkkkkkkkkkkkkkkkkkkkkkkkkkkkkkkkkkkkkkkk kkkkkkkkkkkkkkkkkkkkkkkkkkkkkkkkkkkkkkkkkkkkkkkkkkkkkkkkkkkkkkkkkkkkkk kkkkkkkkkkkkkkkkkkk
I cannot express enough thanks to my committee for their continued support and
encouragement: Dr. Kirk Dolan, my advisor; Dr. Leslie Bourquin and Dr. Gale
Strasburg. I offer my sincere appreciation for the learning opportunities provided by my
committee.
My completion of this project could not have been accomplished without the
support of Saudi Arabian FDA for funding M.S. program; Phil Hill from BE Dept. for
refurbishing the drum dryer; Professor Loescher and Jesse Traub for use and training
on the freeze dryer; Sunisa Roidoung for training on the Biotek Plate Reader;
Abdulmajeed Alotaibi from Engineering Department– thank you for allowing me time
away from you to research and write.
Thanks to my parents as well, Mr. Tuawayrish Aldosari and Mrs. Nora Aldosari.
The countless times you kept the children during our hectic schedules will not be
forgotten.
Finally, to my caring, loving, and supportive wife, Dalal Aldosari: my deepest
gratitude. Your encouragement when the times got rough are much appreciated and
duly noted. It was a great comfort and relief to know that you were willing to provide
management of our household activities while I completed my work. My heartfelt thanks.

iv
TABLE OF CONTENTS
LIST OF TABLES ............................................................................................................vi
LIST OF FIGURES ........................................................................................................ viii
INTRODUCTION ............................................................................................................. 1
1 LITERATURE REVIEW ............................................................................................ 3
1.1 Apple Pomace .................................................................................................... 3
1.2 Antioxidants........................................................................................................ 4
1.3 Phenolic Components ........................................................................................ 5
1.4 Pomace drying ................................................................................................... 8
1.5 Drying Methods .................................................................................................. 8
1.5.1 Principles of Hot-air Drying ........................................................................ 10
1.5.2 Principles of Freeze Drying ........................................................................ 11
1.6 Analysis of Total Phenlics and Antioxidant Capacity ........................................ 12
1.6.1 Total Phenolic Assay ................................................................................. 12
1.6.2 Oxygen Radical Absorbance Capacity (ORAC) ......................................... 13
1.6.3 Diphenylpicrylhydrazyl Assay (DPPH) ....................................................... 13
2 MATERIALS AND METHODS ............................................................................... 15
2.1 Apple Powder Preparation ............................................................................... 15
2.2 Sample Preparation ......................................................................................... 15
2.3 Drying Methods ................................................................................................ 15
2.3.1 Drum Drying .............................................................................................. 16
2.3.2 Hot-air Drying ............................................................................................ 16
2.3.3 Freeze Drying ............................................................................................ 16
2.4 Hunter Color CIE .............................................................................................. 17
2.5 Antioxidants Extraction ..................................................................................... 18
2.6 Determination of Total Phenolic Content .......................................................... 19
2.6.1 Preparation of Reagent.............................................................................. 19
2.6.2 The procedure of experiment ..................................................................... 19
2.7 Determination of Antioxidant Activity: Oxygen Radical Absorbance Capacity (ORAC) ...................................................................................................................... 20
2.7.1 Preparation of Reagent.............................................................................. 20
2.7.2 The procedure of experiment ..................................................................... 21
2.8 Diphenylpicrylhydrazyl (DPPH) Antioxidant Assay ........................................... 22
2.8.1 Preparation of Reagent.............................................................................. 22
2.8.2 The procedure of experiment ..................................................................... 22
2.9 Data Analysis ................................................................................................... 23

v
3 RESULTS AND DISCUSSION ............................................................................... 24
3.1 Effects of Drying Methods on the Color Properties of Dried Apple Pomace ..... 24
3.1.1 Hunter Color CIE ....................................................................................... 24
3.2 Effects of Drying Methods on the Antioxidant Properties of Dried Apple Pomace 29
3.2.1 Total Phenolics .......................................................................................... 29
3.2.2 Antioxidant Capacity assayed by ORAC.................................................... 31
3.2.3 Antioxidant activity by DPPH (diphenylpicrylhydrazyl) assay ..................... 32
4 CONCLUSIONS ..................................................................................................... 34
4.1 Conclusions...................................................................................................... 34
4.2 Future Research .............................................................................................. 35
APPENDIX .................................................................................................................... 36
REFERENCES .............................................................................................................. 48

vi
LIST OF TABLES fffffffffffffffffffffffffhhhhhhhhhhhhhhhhhhhhhhhhhh hhhhhhhhhhhhhhhhhhhhhhhhhhhhhhhhhhhhhhhhhhhhhhhhhhhhhhhhhhhhhhhhhhhhhhhhhff fffffffffffffffffffffffff
ffffffffffffffffffffffffffffffff Table 1. Gallic acid concentrations for the standard curve ............................................ 19
Table 2. Trolox concentrations used for the standard curve .......................................... 22
Table 3 Moisture percent of apple pomace sample before drying methods .................. 37
Table 4 Moisture percent of drum dried apple sample .................................................. 37
Table5 Moisture percent of freeze dried apple sample.................................................. 37
Table 6 Moisture percent of cabinet dried apple sample at 60 ºC ................................. 37
Table 7 Moisture percent of cabinet dried apple sample at 80 ºC ................................. 37
Table 8 Moisture percent of cabinet dried apple sample at 100 ºC ............................... 38
Table 9 The relative humidity of drum dried apple sample ............................................ 38
Table 10 The relative humidity of cabinet dried apple sample at 60 ºC ......................... 38
Table11 The relative humidity of cabinet dried apple sample at 80 ºC .......................... 38
Table 12 The relative humidity of cabinet dried apple pomace at 100 ºC ...................... 38
Table 13 Air velocity of cabinet drying ........................................................................... 39
Table 14 The Hunter Color CIE data of apple pomace before drying methods ............. 39
Table15 Location of blank, Trolox and sample wells .................................................... 39
Table 16 The Hunter Color CIE data of apple pomace after drying methods ................ 40
Table 17 Effects drying methods on the antioxidant in apple pomace before drying ..... 41
Table 18 Effects drying methods on the antioxidant in apple pomace after drying ........ 42
Table 19 Effects drying methods on total phenolics in apple pomace before drying ..... 45
Table 20 Effects drying methods on the total phenolics in apple pomace after drying .. 46
Table 21 Effects drying methods on DPPH in apple pomace before drying .................. 46

vii
Table 22 Effects drying methods on DPPH in apple pomace after drying ..................... 47
viii
LIST OF FIGURES kkkkkkkkkkkkkkkkkkkkkkkkkkkkkkkkkkkkkkkkkkkkkkkkkkk kkkkkkkkkkkkkkkkkkkkkkkkkkkkkkkkkkkkkkkkkkkkkkkkkkkkkkkkkkkkkkkkkkkkkk kkkkkkkkkkkkkkkkkkk
kkkkkkkkkkkkkkk Figure 1. Apple processing for juice production .............................................................. 4
Figure 2. A quercetin (flavonol); B apigenin (flavone); C naringenin (flavanone); D (+)-catechin (flavan-3-ol); E cyaniding (anthocyanidins) ....................................................... 7
Figure 3. Schematic representation of a top loading double drum dryer (GOUDA) ......... 9
Figure 4. Schematic Diagram of a Hot-Air Dryer ........................................................... 11
Figure 5. Scheme of L*a*b* model ................................................................................ 18
Figure 6. Effect of different drying methods on the Hunter color L* values of dried apple pomace (means sharing the same letters are not significantly different from each other at p= 0.0023, based on Tukey’s HSD test) .................................................................... 26
Figure 7. Effect of different drying methods on the Hunter color a* values of dried apple pomace (means sharing the same letters are not significantly different from each other at p= 0.0071 , based on Tukey’s HSD test) ................................................................... 27
Figure 8. Effect of different drying methods on the Hunter color b* values of dried apple pomace (means sharing the same letters are not significantly different from each other at p= 0.1174, based on Tukey’s HSD test). ................................................................... 28
Figure 9. Effect of different drying methods on the color changes (∆E values) of dried apple pomace (means sharing the same letters are not significantly different from each other at p= 0.1348, based on Tukey’s HSD test) ........................................................... 29
Figure 10. Effect of different drying methods on the total phenolics content of dried apple pomace (means sharing the same letters are not significantly different from each other at p= 0.0001, based on Tukey’s HSD test) ........................................................... 31
Figure 11. Effect of different drying methods on the ORAC values of dried apple pomace (means sharing the same letters are not significantly different from each other at p= 0.0001, based on Tukey’s HSD test) .................................................................... 32
Figure 12. Effect of different drying methods on the antioxidant values of dried apple pomace using DPPH assay (means sharing the same letters are not significantly different from each other at p= 0.0001, based on Tukey’s HSD test) ............................ 33

INTRODUCTION
Fruit juices are considered “healthy” drinks. In recent years, consumption and
exporting of juices have increased because of the improvement in processing methods
and transportation (Askar 1998). In 2006-2007 the world produced 46.1 million tons of
apples. The country that produces the most apples is China, which harvests more than
50 % of the world’s apples followed by the USA. The world processes 25-30% of the
fruit into juice (Figure 1) (Bhushan and others 2008). Brazil produces 800,000 tons of
apple pomace each year (Protas 2003).Michigan ranks second in apple production in
USA. Many of the apple-growing farmers have small orchards. According to Michigan
Apple Committee, in 2013, Michigan harvested approximately 1260 million pounds of
apple, and the average of harvest is 828 million pounds of apples per year. Besides
fresh consumption, a large portion of production is used to produce apple juice/ cider.
The remaining residue after juice extraction (skins, flesh, and stems) is considered to be
a waste product, and is called pomace. Apple pomace is nutritionally rich and contains
bioactive compounds, such as antioxidants. To process apple pomace into a value-
added ingredient, moisture must be removed by drying, which can be done using
different drying methods (e.g., freeze drying, cabinet drying, and drum drying). These
methods are different with respect to cost, processing time, heat application, and
production rate.
The objectives of this research were to compare the effects of three different
drying methods (drum drying at one drum temperature at 140 °C, freeze drying at 20 °C,
and cabinet drying at three different temperatures 60 °C, 80 °C and 100 °C) :1) on the

2
nutritional characteristics of total phenolics and antioxidant activity as assayed by
ORAC and DPPH; and 2) on color values for the quality of apple pomace (Hunter Color
CIE).

3
1 LITERATURE REVIEW
1.1 Apple Pomace
Apple pomace is a by-product that is generated by processing apples into
different apple products such as juice, cider, and wines (Figure 1) (Vendruscolo and
others 2008). Recently, the emphasis on apple pomace has been to utilize it for the
extraction of value-added products, such as antioxidants and dietary fiber (Bhushan
and others 2008). Other uses for apple pomace include extraction of pectin, animal
feed, and more recently fermentation to produce citric acid or alcohol (Hang 1987).
Apple pomace has started to be increasingly used as source of apple fiber and bioactive
compounds (Walter and others 1985), which in turn has been incorporated into cookies,
granola bars, and muffins to add to the overall fiber value (Ingredients 2012); (Carson
and others 1994). Although the addition of apple pomace is good for products
nutritionally, it lowers the overall appearance, texture, and flavor (Beereboom and
Glicksman 1979). Of these issues, only the flavor can be addressed by the addition of
spices, and use of flavors such as vanilla (Belshaw 1978).

4
Figure 1. Apple processing for juice production
1.2 Antioxidants
Antioxidants play an important role in our health; as they may protect us from
serious diseases such as cancer (Borek 1997). An antioxidant is defined as “any
substance, when present at low concentrations compared to those of an oxidizable
substrate, significantly delays or prevents oxidation of that substrate (Halliwell 1989).”
Oxygen is important for life, and is used for energy production in our bodies. However,
1-3% of oxygen we breathe has detrimental effects that make “reactive oxygen species”
(ROS), which include superoxide radical (O2−) and hydrogen peroxide (H2O2). Through
providing contact with metal ions that make free radicals, which are atoms with an

5
unpaired electron created by interaction between oxygen and molecules. Free radicals
attack and damage almost everything in our bodies If O2− and H2O2 combine with
transition metal ions, the resulting free radical species can damage the human body
(Halliwell 1997).
The antioxidants come from different sources, such as enzymes (catalase), large
molecules (albumin), small molecules (polyphenols) and hormones (melatonin) (Prior
and others 2005). Also, fruits and vegetables contain many antioxidants such as vitamin
C + E, found in berries, tomato garlic, ginger, carotenoids and apple pomace (Moure
and others 2001).
The antioxidants are divided into two classes: 1) primary antioxidants that are
called chain-breaking antioxidants, they can interact with lipid radicals which result in
more stable products , and 2) secondary or preventative antioxidants, which retard the
oxidation rate (Antolovich and others 2002). The difference between them is that the
secondary antioxidants postpone the oxidation by interfering with the prooxidant
system, and the secondary antioxidants disable the conversion of free radical species to
a more stable product (Abulude and others 2013) .
1.3 Phenolic Components
Phenolic compounds are free radical scavenging molecules present in fruits and
vegetables, and include phenolic acids, flavonoids, coumarins (Larson 1988). There are
some studies showing that phenolic compounds from plants are more efficient than
vitamins E or C in our bodies as antioxidants (Rice-Evans and others 1997). Therefore,
phenolic compounds may have an important role in protecting our health (Rice-Evans

6
and others 1997). Recently, many research studies have focused on the importance of
phytochemical components such as phenolic acids, phenylpropanoids and flavonoids
because they have an active role in antioxidant activity (Rice-Evans and others 1997).
Phenols are divided into different groups. The first group is simple phenols that
contain an aromatic ring with one or more -OH groups (Schwannecke 2009). Phenolic
acids in the form of substituted derivatives of hydroxybenzoic and hydroxycinnamic
acids are the predominant phenolic acids in fruits. These derivatives differ in patterns of
hydroxylations and methoxylations of their aromatic rings (Lule and Xia 2012). The
second group, phenol carboxylic acids, include simple phenols, that bear a carboxyl
group. The third group of compounds, phenyl propane, have an aromatic ring that has 3
carbon atoms. The fourth group, flavan derivatives, is a flavan skeleton that consists of
3 rings. A and B are an aromatic ring and the ring in the center contains oxygen (figure
2) (Hess 1975).

7
Figure 2. A quercetin (flavonol); B apigenin (flavo ne); C naringenin (flavanone); D (+)-catechin (flavan-3-ol); E cyaniding (anthocyani dins)

8
1.4 Pomace drying
The drying of pomace has been done by other groups. Yan and Kerr (2012) dried
apple pomace by vacuum-belt drying at 80 ºC, 95 ºC and 110 ºC, they measured total
phenolics content, anthocyanins, dietary fiber content and color properties. Also, Sogi
and others (2013) dried mango peel and kernel by different drying methods (freeze
drying at , hot air drying, vacuum and infrared drying), they measured total phenolics,
antioxidant activity, and functional properties. However, in this study, the drum drying
method has been added. This drying method has favorable characteristics for
commercial production, such as low cost, rapid drying time, and large throughput.
1.5 Drying Methods
There are many drying methods that are commonly used for fruits, such as spray
drying, hot air drying, drum drying, freeze drying, and microwave-vacuum drying. Fresh
fruits have a short shelf life because they have a high moisture content and high sugar
content, allowing microorganisms to grow.. Thus, drying will help extend the shelf life of
fruits through reducing water activity. In industry, much attention is paid to the quality of
products. As mentioned, the fruits have valuable components of vitamins, minerals,
fiber, etc. Thus, these components can be preserved through drying processing.
Polyphenolic compounds in fruits are sensitive to high temperature. For example, drum
drying exposes the product to temperature from 95 to 100 C (Hsu and others 2003) or
as high as 130°C. Due to sublimation, freeze drying does not damage the structure or
quality properties of product (Mejia-Meza 2008). Principles of Drum Drying
Drum drying is one of the most common methods used worldwide for drying the
food in pureed form. This method is appropriate for pureed foods or foods that become
9
pureed after treatment such as milk, mashed potato and fruit pulps (Falagas 1985).
There are many products coming from the drum drying method, such as breakfast
cereals, yeast and fruit puree (Moore and Dekker. 1995). Compared to other drying
methods; drum drying has the best efficiency in terms of high rate of production and
low labor requirements (Moore and Dekker. 1995).
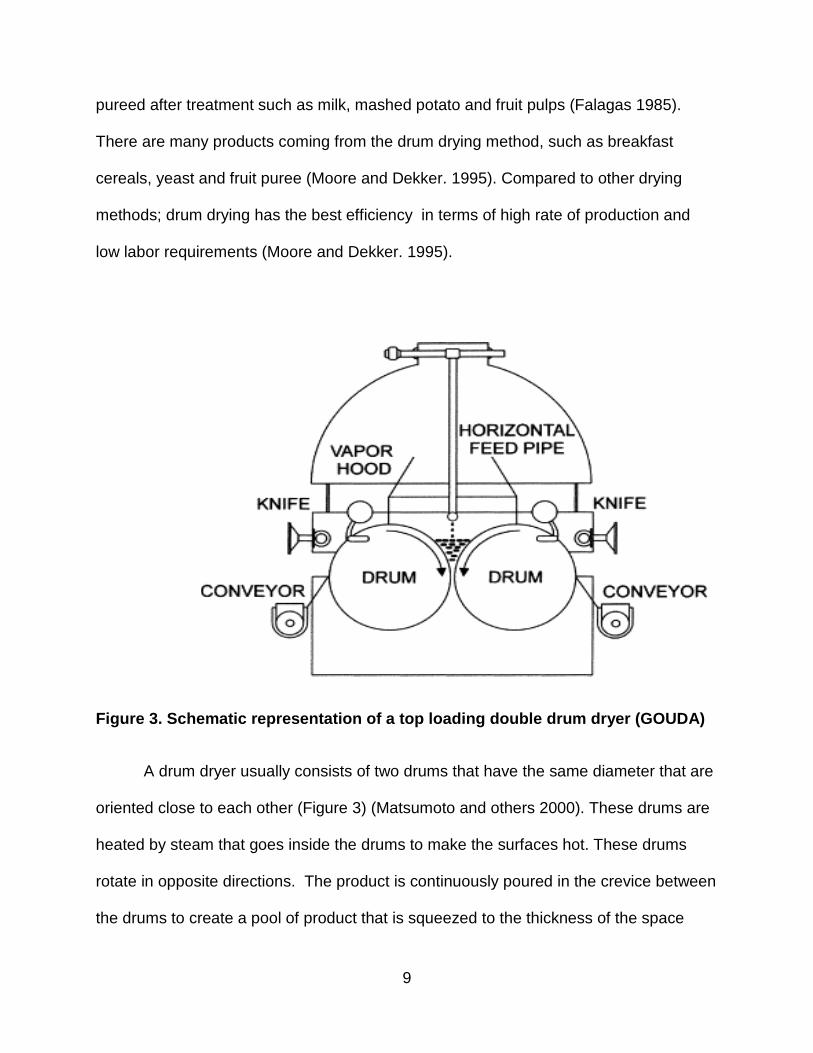
Figure 3. Schematic representation of a top loading double drum dryer (GOUDA)
A drum dryer usually consists of two drums that have the same diameter that are
oriented close to each other (Figure 3) (Matsumoto and others 2000). These drums are
heated by steam that goes inside the drums to make the surfaces hot. These drums
rotate in opposite directions. The product is continuously poured in the crevice between
the drums to create a pool of product that is squeezed to the thickness of the space

10
between the drums, and begins to dry on the drum surfaces. Two fixed knives touch the
surfaces of drums to continuously scrape and remove the dried product to a container
below the drums. The important factors that affect the product are: steam pressure
inside the drums, the clearance or gap between the drums, rotational speed, pool level
between the drums and chemical and physical characteristics of sample being fed
(Gavrielidou and others 2002).
1.5.1 Principles of Hot-air Drying
The hot-air drying method is used to remove water from fruit. The purpose of this
drying method is to decrease the moisture content in the fruit, to avoid growth of
microorganisms and reduce the activity of enzymes, so that the products can be stored
for a long time (Schwannecke 2009) ; (Feng and others 2002). Hot-air drying removes
most of the water from the product by evaporation (Fellows 2000). In hot-air drying,
removing the first 33% of moisture uses about 66% of the total time of drying. Also, the
components of the product may not be stable under thermal processing, possibly
damaging the structure of the crust of vegetables (Zhao 2000). In China, because of
the low cost, hot-air drying is used for over 90% of dried vegetables. However, the
quality of these dried products is poor (Zhang 1999).

11
Figure 4. Schematic Diagram of a Hot-Air Dryer
Trays containing the product are exposed to hot air, which passes along the
surface of the product (Figure 4) (Tang and Yang 2003). Trays have the ability to hold a
depth of 2-6 cm of product per tray (Tang and Yang 2003).The passage of hot air in an
enclosed cabin from above and below the product will increase the effectiveness of
drying. There are influential factors on the rate of drying efficiency, such as the air
speed and heaters (Mejia-Meza 2008). Low relative humidity maintains hot air drying
efficiency, through the integration of fresh air and hot air in the enclosed cabin, which
are connected with the product to remove moisture (Mejia-Meza 2008).
1.5.2 Principles of Freeze Drying
The main purpose of freeze drying is to preserve fruits for an extended time,
especially for fruits that are sensitive to normal or high temperature. This drying method
is expensive and takes a relatively long time of 12 to 24 hours (Mejia-Meza 2008). The
principle of the freeze drying method is based on two phases. The first one is to freeze
the fruit and the second one is to remove the moisture via sublimation of the ice from
12
the fruit that is frozen (Oetjen 2004). Packaging materials are excellent barriers to
prevent the oxidation if the dried fruit is frozen. If dried fruit is not frozen the dried fruit
can easily be rehydrated, which may cause the oxidation. (Oetjen 2004).
The drying cabinet provides vacuum and refrigeration, and contains a heating
shelf and trays. Heating temperature in the drying cabinet is 20 ºC and in the
condenser cabinet from −30 ºC to -60 ºC (Mejia-Meza 2008). In this method we have
two phases: The first phase is the freezing of fruits quickly at atmospheric pressure and
at low temperature of −20 ºC. The second phase is the reduction of the pressure to
below the triple point of water, when moisture will leave the fruit as sublimated vapor,
which will minimize damage to the fruit structure (Fellows 2000) that occurs with other
drying methods.
1.6 Analysis of Total Phenlics and Antioxidant Capa city
1.6.1 Total Phenolic Assay
There are many methods to determine total phenolics such as traditional
methods that depend on absorbed radiation measurement in the ultraviolet region
(Somers and Ziemelis 1972). Folin–Ciocalteu’s reagent has been used to determine
total phenolics since 1965, and was developed by Singleton and Rossi (Singleton and
Rossi 1965). Gallic acid is a popular reagent to estimate total phenolics as molar
equivalents (Arnous and others 2001). Also, gallic acid and 3,4,5-trihydroxybenzoic acid
( C7H6O5) are commonly used to determine total phenolics in fruits and vegetables
(Protas 2003).

13
1.6.2 Oxygen Radical Absorbance Capacity (ORAC)
ORAC assays are used to determine the activity of antioxidants and their
relationship with total carotenoid content, total phenolics and ascorbic acid in fruit
(Thaipong and others 2006). This assay is based on the inhibition of the peroxyl-radical
induced oxidation, which is initiated by heat-induced or thermal decomposition of
azocompounds [e.g., 2,2’-azobis(2-amidino-propane) dihydrochloride or AAPH]
(Ganske and Dell 2006) (Glazer 1990). On the basis of this technique, the ORAC assay
utilizes a biological relevant radical source thus uniquely combining both the inhibition
time and the degree of inhibition into one quantity (Ou and others 2001). Some
modifications have been made to the ORAC assay, which include the use of fluorescein
as the probe (Ou and others 2001).
Advantages of the ORAC assay include: the free radicals are used from the
biological perspective; and the ORAC method is a good comparison tool between
different results from different laboratories and it combines reaction time and reaction
degree of antioxidants, . Disadvantages: It requires expensive equipment, it is possible
to get data with large variability, it is sensitive to pH, and it is time-consuming (Frankel
and Meyer 2000).
1.6.3 Diphenylpicrylhydrazyl Assay (DPPH)
(DPPH) is a stable free radical (diphenylpicrylhydrazyl) that is used to determine
antioxidant activity (Gil and others 2002). DPPH is a common method to estimate the
antioxidant activity (Sharma and Bhat 2009). DPPH measures the efficiency of
antioxidants at room temperature to avoid the deterioration of molecules from the heat,
but structural conformation of the antioxidant plays an important role in mechanical

14
interaction between DPPH and antioxidants (Bondet and others 1997). Compounds
can be divided into two groups based on reaction with DPPH: (1) there is a minority that
react very rapidly with DPPH (2) there is a the majority of compounds that react slowly
with DPPH and they have a complicated mechanism (Bondet and others 1997). Also,
there is a combination of factors that affect absorption of DPPH such as pH, oxygen and
light (Ozcelik and others 2003).
15
2 MATERIALS AND METHODS
2.1 Apple Powder Preparation
Raw apple pomace (Rome,Spy, Ida red, Jonathan, Joagold, empire and York)
was obtained from Peterson Farms (3104 West Baseline Road, Shelby, MI 49455. The
raw material was grounded by coffee grinder (Cuisinart, Model DCG-20, East Windsor,
NJ) at room temperature 25 ºC. Dried samples (15 g each) were loaded into the
pulverizer. Samples were prepared for antioxidant extraction, by crushing the sample,
placing in dark bags and keeping in the freezer. Samples were taken from four locations
of the batch. Moisture content was measured by moisture analysis ( Santorius
Corporation, Bohemia, NY, 11716), 1.5 – 3 grams were loaded on the analyzer. Drying
measurements took approximately 30 minutes for each sample ( Raw and dried
sample).
2.2 Sample Preparation
The pomace was kept in a freezer at – 9 ºC in dark bags to avoid losses of
antioxidants by light; each bag contained approximately 45g. The sample was thawed at
room temperature of 25 ºC before drying.
2.3 Drying Methods
Three drying methods were used; drum drying, hot air drying, and freeze drying.
The reason for drying was to remove moisture from apple pomace while saving valuable
quality components, such as antioxidants and phenolic compounds, the levels of the
components were compared using chemical assays.

16
2.3.1 Drum Drying
Samples of 1.6 Kg of apple pomace were mixed with water (1:2) to pour the
slurry onto a drum dryer (American Drum Dryers, Overton Machine Company,
Dowagiac, Michigan USA). The experiment was conducted three times. Drum drying
was run continuously for 15 minutes at a drum surface temperature of 140 °C. The
temperature of the drum was estimated using an infra-red thermometer (Model 9645,
CEN-Tech Company). The sample slurry was dried by pouring it on to the hot surface
of the drums, then by using knives to continuously scrape off the sample from the drum
so that the dried product was collected in stainless steel trays.
2.3.2 Hot-air Drying
The sample was dried at different air temperatures at 60 °C, 80 °C , or 100 °C.
The drying time was 25, 20 and 15 minutes respectively. The perforated tray was
loaded with approximately 150g for each temperature. The velocity of air was 15.2 m/s
measured with a hot-wire anemometer (Model number 407001, Extech Instruments
Corporation, the address is 9 Townsend West Nashua, NH 03063 U.S.A). The relative
humidity was 30.7%, 35.3% and 39% respectively. After drying, the content of moisture
in apple pomace was 3.0%, 3.0% and 3.2% respectively.
2.3.3 Freeze Drying
The freeze drying machine that used to dry apple pomace was Virtis Genesis
(25L Genesis SQ Super XL-70, 2010). The freeze dryer had a sample chamber, seven
shelves, a vacuum pump and a refrigerated condenser chamber. The shelf temperature
was lowered to−30 °C, and the sample was placed ont o shelves with the chamber
closed. The condenser was lowered to –60 ºC and the vacuum pump was turned on

17
until it pulled a near complete vacuum, approximately 50 mTorr. Then, the shelf heater
was turned on to warm up the samples to around 20 ºC. Samples were dried for 3 days
under these conditions, until the dryer had a stable reading of around 10 mTorr
pressure inside the freeze dryer. The samples were removed and kept frozen in dark
colored polyethylene bags at −20 °C.
2.4 Hunter Color CIE
Raw apple pomace’s color depends on the kind of apple. This color plays an
important role in food additives, in making the food attractive. Apple pomace color is
affected by drying method. The color is sensitive to heat, oxygen, enzymes. For
example, in the drum dryer, the high temperature will affect the color because the
temperature of drums is around 135 ºC to 140 ºC . Color was measured before and
after the treatment. The change of color indicates that the product loses part of its
quality through degradation of some important components of apple pomace.

Figure 5. Scheme of L*a*b* model
There are different models to measure the color, such as the L*a*b* model,
where RGB represents red, green and blue, and CMYK means cyan, magenta, yellow
and black (Yam and Papadakis 2004
L*a*b* model (Minolta Color Reader CR
where, L* means lightness component that has specific range from 0 to 100,
the component from green to red and b* means the component from blue to
(Figure 5) (Okubo and others 1998
2.5 Antioxidants Extraction
For extraction of phenolics
(2014) was followed. Briefly, dried pomace samples (2.5
tubes and 20mL of 80% methanol solution was added. The tubes were covered with
aluminum foil. Then, they were put in a sha
18
Scheme of L*a*b* model
There are different models to measure the color, such as the L*a*b* model,
where RGB represents red, green and blue, and CMYK means cyan, magenta, yellow
Yam and Papadakis 2004). In this work, the Hunter color parameters and
model (Minolta Color Reader CR-10, Ramsey, NJ) was used for color evaluation
means lightness component that has specific range from 0 to 100,
the component from green to red and b* means the component from blue to
Okubo and others 1998) (Yam and Papadakis 2004).
Extraction
For extraction of phenolics and antioxidants, the method of Sogi and others
(2014) was followed. Briefly, dried pomace samples (2.5 g) were placed into separate
tubes and 20mL of 80% methanol solution was added. The tubes were covered with
aluminum foil. Then, they were put in a shaker for one hour at 200 g.
There are different models to measure the color, such as the L*a*b* model,
where RGB represents red, green and blue, and CMYK means cyan, magenta, yellow
parameters and
color evaluation.
means lightness component that has specific range from 0 to 100, a* means
the component from green to red and b* means the component from blue to yellow
and antioxidants, the method of Sogi and others
g) were placed into separate
tubes and 20mL of 80% methanol solution was added. The tubes were covered with

19
The samples were centrifuged for 10 min at 11,180 g . The supernatant was
poured off into separate tubes. Then, 10 mL of 80% methanol was added into the
residue, placed back in the centrifuge for an additional 10 min at 10,000 g and the
supernatant was poured off again into a separate tube. This step was done twice and
approximately 40 mL of product was obtained.
2.6 Determination of Total Phenolic Content
2.6.1 Preparation of Reagent
The total phenolic compounds test contains two reagents. Saturated sodium
carbonate 7.5%; 7.5 g of anhydrous sodium carbonate was weighed and dissolved in
92.5 mL water. Gallic Acid (0−500 mg/L) was prepared in two steps (1) stock solution:
0.1 g of Gallic acid was weighed and dissolved in 10 ml ethanol to obtain 10 mg/ml, (2)
working solution (100 mg/L): 200 µL of stock solution was weighed and ethanol was
added to make the volume 20 ml to get 100 mg/L. The standard curve was made on
these concentrations, as shown in Table 3.
Table 1. Gallic acid concentrations for the standar d curve Working solution (ml) Ethanol (ml) Gallic acid (mg/L)
0 5 0 1 4 20 2 3 40 3 2 60 4 1 80 5 0 100
2.6.2 The procedure of experiment
A volume of 0.5 mL of apple pomace extract was taken (1 part apple pomace
extract: 10 part water) and added to 0.5 m Folin-Ciocalteu reagent (1+9 water) in a test

20
tube that was mixed thoroughly, and the solutions were incubated for 3 minutes. After
incubation, 1 ml of saturated sodium carbonate (7.5%) was added followed by 1 ml of
distilled water. The solution was then incubated for 2 hours in the dark at room
temperature. A spectrophotometer was used at 750 nm and the absorbance was
compared to 0.5 ml of gallic acid (0−100 mg/L) standard curve.
2.7 Determination of Antioxidant Activity: Oxygen R adical Absorbance
Capacity (ORAC)
There are many ways to determine antioxidant level. ORAC assays are used to
determine the activity of antioxidants and their relationship with total carotenoids
contents, total phenolics and ascorbic acid in fruit (Thaipong and others 2006).
2.7.1 Preparation of Reagent
Preparation of stock solutions: Three stock solutions were prepared, which were
sodium phosphate buffer (pH 7.4), using 11.741 g of dibasic sodium phosphate
Na2HPO4 and 4.306 g of monobasic monohydrate sodium phosphate 1M NaH2PO4 that
was mixed and stirred in 900-1000mL of distilled water, pH was adjusted to 7.4 by 1M
NaOH and 1M HCl. Trolox (6-hydroxy -2,5,7,8-tetramethylchroman-2-carboxylic acid),
from hydrophilic group (Zulueta and others 2009), Trolox stock 2.0 mM was prepared
from 0.025g Trolox and 50 ml sodium phosphate buffer (pH 7.4) that were mixed and
stirred in glass flask, which were then wrapped in foil and stored in the refrigerator. The
final stock solution fluorescein was prepared from 0.1g Fluorescein and 100 ml sodium
phosphate buffer (pH 7.4), which was wrapped in foil and placed in refrigerator. These
stock solutions were stored for no more than three months due to their stability.

21
Dilutions of the three stock solutions were prepared on the day of the experiment.
Fluorescein dilution was prepared by adding 10 ml of sodium phosphate buffer (pH 7.4)
10 µL of Fluorescein stock into test tube, then by vortexing the solution. Trolox was
diluted to several different concentrations, 100µM (10mL sodium phosphate + 529 µL
Trolox), 50 µM (10 mL sodium phosphate + 264 µL Trolox), 25 µM (10 mL sodium
phosphate + 132 µL Trolox), 12.5 µM (10mL sodium phosphate + 66 µL Trolox) and
6.25 µM (10 mL sodium phosphate + 33 µL Trolox). Apple pomace dilution was
prepared by adding 10 mL of sodium phosphate buffer (pH 7.4) and 100 µL of sample
extraction into test tubes then mixing by vortex. Finally, AAPH (2,2′-azobis (2-
amidinopropane) dihydrochloride) was prepared by adding 0.414g AAPH and 10 ml of
sodium phosphate buffer into a test tube, then mixing thoroughly by vortex (Sogi and
others 2014).
2.7.2 The procedure of experiment
Fluorometer Operation: The Biotek Plate Reader was equilibrated to 37 °C. The
wells were loaded as shown in Appendix Table 13: Blank wells were loaded with 25µL
sodium phosphate buffer (pH 7.4). Trolox wells were loaded with 25µL of Trolox
dilutions. Sample wells were loaded with 25µL of sample dilutions and 150µL diluted
fluorescein solution was added to all experimental wells. Plates were placed in the
fluorometer. After 30 minutes, 25µL of AAPH was added to all experimental wells and
the plate was put again in the fluorometer for 3 hours to get the result.

22
2.8 Diphenylpicrylhydrazyl (DPPH) Antioxidant Assay
DPPH analysis: DPPH is stable free radical diphenylpicrylhydrazyl that was used
to determine the antioxidants (Gil and others 2002). DPPH analysis is common method
to measure antioxidant activity (Sharma and Bhat 2009).
2.8.1 Preparation of Reagent
The DPPH test uses 2.0 mM Trolox. Thus, the standard curve was made from
Trolox concentrations listed in Table 2.
Table 2. Trolox concentrations used for the standar d curve
Trolox 2.0 mM (ml) Ethanol (ml) Trolox concentration (µM)
0 4 0
0.1 3.9 50
0.2 3.8 100
0.3 3.7 150
0.4 3.6 200
0.5 3.5 250
DPPH+ was prepared from 10 ml of DPPH stock and 50 ml of Ethanol. distilled
water was used to obtain 100% Transmittance at 515 nm to get absorbance of
0.7±0.01.
2.8.2 The procedure of experiment
A volume of 3 mL DPPH+ was taken with 0.6 mL of apple pomace extract (1
apple pomace extract: 10 water) and placed into a test tube. It was incubated for 20
minutes in the dark and measured at 515 nm. An absorbance reading was obtained and
compared to the Trolox standard curve (0−250 µM).

23
2.9 Data Analysis
All data were analyzed using JMP 9.0 software (SAS Institute, Inc., Cary, North
Carolina, USA). One-way analysis of variance (ANOVA) was used to analyze the data
on the effects of drying techniques on the physical and antioxidant properties of dried
mango pomace. The significant difference comparisons were made by Tukey’s HSD
test and the statistical significance was defined as p ≤ 0.05.

24
3 RESULTS AND DISCUSSION
3.1 Effects of Drying Methods on the Color Properti es of Dried Apple Pomace
3.1.1 Hunter Color CIE
Apple pomace’s color was examined by Hunter Color CIE L* a* b* system. Color
Reader CR-10 was used to analyze all samples. The mean L*, a*, b* variables for raw
apple pomace were 33.8, 13.73 and 29.2 respectively. The mean values for apple
pomace after freeze drying methods, drum drying method and cabinet drying methods
are shown in Figures 6, 7, 8 and 9.
The freeze dried pomace sample showed the highest average level in whiteness
(L*), whereas the drum dried sample showed the lowest L* value (Figure 6). As
expected, higher temperature used in drum drying affected the Hunter color L* values
negatively. The drying methods used had significant impact on (L*) (p= 0.0023). On the
other hand, increasing temperature from 60 °C to 10 0 °C in the cabinet dryer did not
affect the L* values significantly (Figure 6). There is limited literature on apple pomace
drying using the same methods used in the present study. However, Yan and Kerr
(2013) also reported lower whiteness values in vacuum-belt dried apple pomace when
the temperature was increased from 80° C to 110 °C (Yan and Kerr 2013).
The cabinet drying at 100°C was shown to impart the highest redness or color a*
values, and freeze drying showed the lowest redness or color a* values (Figure 7).
Similar to the Hunter color L*, a* values did not change significantly when cabinet drying
temperatur was increased from 60 °C to 100 °C. The cabinet drying at 100°C showed
the highest average level in yellowness or b* value, and the drum drying sample

25
showed the lowest average level in yellowness b* value (Figure 8); however, the
differences were not significant statistically among all samples (p=0.1174).
The total color difference (△E) values did not show any significant difference
(p=0.1348) when the apple pomace was dried using different drying methods (Figure 9).
This showed that although there were differences in individual color parameter L* and
a*, these did not impact the overall color, as determined by △E. The study by Yan and
Kerr (2013) reported similar results to my result on Hunter color L*, a*, or b* of dried
apple pomace, the apple pomace was dried by freeze drying and vacuum-belt drying at
80C, 95C and 110C. freeze dried sample was the highest average level in whiteness
(L*), whereas the vacuum-belt dried sample at 110C was the lowest L* value(Yan and
Kerr 2013).

26
Figure 6. Effect of different drying methods on the Hunter color L* values of dried apple pomace (means sharing the same letters are no t significantly different from each other at p= 0.0023, based on Tukey’s HSD test)
a
c b,c
a,bb,c
0
10
20
30
40
50
60
Freeze drying (20 °C)
Drum drying (140 °C)
Cabinet drying (60 °C)
Cabinet drying(80 °C)
Cabinet drying(100 °C)
Hun
ter
Col
or L
* V
alue

27
Figure 7. Effect of different drying methods on the Hunter color a* values of dried apple pomace (means sharing the same letters are no t significantly different from each other at p= 0.0071 , based on Tukey’s HSD test)
b
b
a,ba,b
a
0
3
6
9
12
15
18
Freeze drying (20 °C)
Drum drying (140 °C)
Cabinet drying (60 °C)
Cabinet drying(80 °C)
Cabinet drying(100 °C)
Hun
ter
Col
or a
* V
alue

28
Figure 8. Effect of different drying methods on the Hunter color b* values of dried apple pomace (means sharing the same letters are no t significantly different from each other at p= 0.1174, based on Tukey’s HSD test) .
aa a a
a
0
5
10
15
20
25
30
35
Freeze drying (20 °C)
Drum drying (140 °C)
Cabinet drying (60 °C)
Cabinet drying(80 °C)
Cabinet drying(100 °C)
Hun
ter
Col
or b
* V
alue

29
Figure 9. Effect of different drying methods on the color changes ( ∆E values) of dried apple pomace (means sharing the same letters are not significantly different from each other at p= 0.1348, based on Tukey’s HSD test)
3.2 Effects of Drying Methods on the Antioxidant Pr operties of Dried Apple Pomace
3.2.1 Total Phenolics
The mean of total phenolics in apple pomace was measured by
spectrophotometer and expressed in milligrams of gallic acid equivalents (GAE) per
gram of apple pomace. The mean of total phenolic in raw apple pomace was 3.56 ±
0.18 mg GAE/ g apple pomace. Total phenolic of apple pomace average for all samples
are shown and Figure 10. The highest value of total phenolics was noticed in freeze
drying samples and the lower value was noticed in the drum dryer at 140 °C. The total
antioxidant activity of dried apple pomace was significantly affected by temperature and
drying methods (p=0.0001).
a
aa
a a
0
5
10
15
20
25
30
Freeze drying (20 °C)
Drum drying (140 °C)
Cabinet drying (60 °C)
Cabinet drying(80 °C)
Cabinet drying(100 °C)
Col
or △△ △△
E

30
Phenolic compounds are heat-sensitive and, even cabinet drying at the lowest
temperature (60 °C) resulted in significant decreas e as compared to freeze drying
method. Yan and Kerr (2013) also reported that higher temperature used during
vacuum belt drying of pomace negatively impacted total phenolic content (Yan and Kerr
2013). The results of the present study are also similar to those reported by Sogi and
others (2013) for mango peel and kernel drying, they have used four different drying
methods; freeze drying -20C, hot air drying at 60C, vacuum drying at 60C and infra-red.
The highest value of total phenolic was noticed in freeze drying samples and hot air
drying at 60C was lower the freeze dried sample (Sogi and others 2013). The heat
treatment decreases the total phenolic content due to the cleaving of esterified bond
and glycosylated bond (Xu and others 2007).

31
Figure 10. Effect of different drying methods on th e total phenolics content of dried apple pomace (means sharing the same letters are not significantly different from each other at p= 0.0001, based on Tukey’s HSD test)
3.2.2 Antioxidant Capacity assayed by ORAC
The antioxidant properties of dried apple pomace were compared using ORAC
and DPPH assays. The mean ORAC in raw apple pomace was 1136.2 ± 480 µmol
TE/gsample db. The mean ORAC values of dried apple pomace using different drying
methods are shown in Table 6. The highest mean ORAC value of 350.275 µmol TE/g
(dry basis) was observed in freeze dried apple pomace and the lowest in the drum dryer
at 140 °C sample (Figure 11). The highest content o bserved in freeze dried samples
might be due to lack of any heat used in other methods. The freeze drying method
showed significantly higher (p=0.0001) ORAC values as compared to the other drying
methods used. These results are similar with those reported by Sogi and other (2013),
a
c
bc
c
0
1
2
3
4
5
Freeze-dried (20 °C)
Drum -dried (140 °C)
Cabinet -dried (60 °C)
Cabinet -dried (80 °C)
Cabinet -dried (100 °C)
Tota
l Phe
nolic
s (m
g G
AE
/g, d
b)

32
who dried mango peel and kernel using freeze, cabinet (60 °C) and infra-red and
vacuum drying. They reported the highest value of ORAC was in freeze dried sample
and hot air dried sample was lower freeze dried sample (Sogi and others 2013).
Figure 11. Effect of different drying methods on th e ORAC values of dried apple pomace (means sharing the same letters are not sign ificantly different from each other at p= 0.0001, based on Tukey’s HSD test)
3.2.3 Antioxidant activity by DPPH (diphenylpicrylh ydrazyl) assay
The DPPH assay was the second method used to assess effect of drying
methods on antioxidant levels of dried apple pomace. The mean of DPPH in raw apple
pomace was 294.839 ± 6.132 µM TE/ g (dry basis). Total phenolic of apple pomace
average for all samples are shown in Table 7 and Figure 12. The highest mean of total
DPPH was observed in freeze drying sample and the lower in the drum dryer at 140° C.
Successively lower DPPH values were observed in cabinet dried apple pomace, as the
a
c
b
b,cb,c
0
50
100
150
200
250
300
350
400
Freeze drying (20 °C)
Drum drying (140 °C)
Cabinet drying (60 °C)
Cabinet drying(80 °C)
Cabinet drying(100 °C)
OR
AC
(µm
ol T
E/g
, db)

33
temperature was increased from 60 °C to 80 °C and 1 00 °C. The DPPH of dried apple
pomace was significantly affected by temperature and drying methods (p=0.0001). Sogi
and others also reported similar results where freeze dried mango peel and kernels
retained the highest DPPH values, as compared to cabinet drying (Sogi and others
2013).
Figure 12. Effect of different drying methods on th e antioxidant values of dried apple pomace using DPPH assay (means sharing the sa me letters are not significantly different from each other at p= 0.0001, based on Tukey’s HSD test)
Trolox was used as standard curve for ORAC and DPPH assays. There are
some differences between these assays. The ORAC assay is sensitive, more expensive
and requires more time. However, it measures the degradation throughout the
experiment. The DPPH assay is quicker than the ORAC assay, but it measures the
degradation only at one time, rather than throughout the experiment.
a
e
bc d
0
50
100
150
200
250
300
Freeze-dried (20 °C)
Drum-dried (140 °C)
Cabinet-dried (60 °C)
Cabinet-dried (80 °C)
Cabinet-dried (100 °C)
DP
PH
(µm
ol T
E/g
, db)

34
4 CONCLUSIONS
4.1 Conclusions
The apple pomace color was affected by the type of drying method and
temperature. Hunter Color CIE variables were used to measure affect on L*, a*, and b*
values to assess differences among drying methods. The freeze dried sample was the
highest in L* values. Cabinet drying at 100 °C was shown to result the highest average
a* and b* values. The freeze dried sample showed the lowest average level in a* value,
which was slightly different with drum drying sample.
The total antioxidant activity of dried apple pomace was significantly affected by
the three different drying methods; freeze drying, drum drying, and cabinet drying.
However, cabinet drying air temperatures of 60 ºC, 80 ºC, or 100 ºC did not significantly
influence on total antioxidant in apple pomace. Type of drying method was shown to
have a significant effect on total antioxidant of dried sample of apple pomace.
The total phenolics of dried apple pomace samples did change significantly; the
freeze dried sample contained the highest levels of total phenolics, and the lowest
levels of the total phenolics were observed in the drum dried sample.
The DPPH of dried apple pomace samples did show significant differences; the
highest average of total phenolic was absorbed in the freeze dried sample, and the
lowest average of the total phenolics was observed in the drum-dried sample. The
results of this study demonstrated that freeze drying was the best method to process
apple pomace for value-added ingredient use. The next best method was cabinet drying
at lower temperatures, and finally drum drying.

35
Although drum drying showed the most detrimental effect on color, phenolics, and
antioxidants, its significantly lower cost and faster speed of drying may offset the
negative nutritional effects. For example, drum-dried apple pomace could be used as a
low-percentage ingredient or blended with premium-dried apple pomace to meet both
cost and nutritional requirements.
4.2 Future Research
1. Investigate other drying methods such as vacuum drying or infrared drying, which
use different drying temperatures.
2. Study various packaging options for shelf life, which include microbial analysis
and sensory analysis.
3. Do analysis of vitamins and minerals and dietary fiber of the pomace.

36
APPENDIX

37
Table 3 Moisture percent of apple pomace sample bef ore drying methods
Raw apple pomace Sample
Percent Moisture %
Average Percent Moisture %
1 76.2
2 76.4 76.06 ± 0.4163
3 75.6 Table 4 Moisture percent of drum dried apple sample
drum dried apple sample
Percent Moisture %
Average Percent Moisture %
1 3.03
2 3.12 3.01 ± 0.1212
3 2.88 Table 5 Moisture percent of freeze dried apple samp le
Drum dried apple sample
Percent Moisture %
Average Percent Moisture %
1 5.06
2 4.86 5.04 ± 0.1755
3 5.21 Table 6 Moisture percent of cabinet dried apple sam ple at 60 ºC
Drum dried apple sample
Percent Moisture %
Average Percent Moisture %
1 3.14
2 3.17 3.16 ± 0.0251
3 3.19 Table 7 Moisture percent of cabinet dried apple sam ple at 80 ºC
Drum dried apple sample Percent Moisture % Average Percent Moisture %
1 3.02
2 3.04 3.04 ± 0.0251
3 3.07

38
Table 8 Moisture percent of cabinet dried apple sam ple at 100 ºC
Drum dried apple sample Percent Moisture % Average Percent Moisture %
1 3.01
2 2.96 2.97 ± 0.0321
3 2.95 Table 9 The relative humidity of drum dried apple s ample
Samples Relative humidity % Average Percent Moisture %
1 45.2
2 47.2 45.2 ± 2.4637
3 42.3 Table 10 The relative humidity of cabinet dried app le sample at 60 ºC
Samples Relative humidity % Average Percent Moisture %
1 31
2 31 30.66 ± 0.5773
3 30 Table11 The relative humidity of cabinet dried appl e sample at 80 ºC
Samples Relative humidity % Average Percent Moisture %
1 35
2 36 35.33 ± 0.5773
3 35 Table 12 The relative humidity of cabinet dried app le pomace at 100 ºC
Samples Relative humidity % Average Percent Moisture %
1 39
2 40 39.00 ± 1.00
3 38

39
Table 13 Air velocity of cabinet drying
Samples Air velocity m/s Average Air velocity m/s
1 15.8
2 14.8 15.23 ± 0.5131
3 15.1
Table 14 The Hunter Color CIE data of apple pomace before drying methods
L*
Average L*
a* Average
a* b*
Average b*
△E* Average △E
Sample 1
30.1
33.8 ± 5.00
13.0
13.73 ± 0.94
24.8
29.2 ± 3.96
7.44
3.96 ± 3.22
Sample 2
31.8 14.8 30.3 3.40
Sample 3
39.5 13.4 32.5 1.06
Table 15 Location of blank, Trolox and sample well s
1 2 3 4 5 6 7 8 9 10 11 12
A
B BLK STD1 STD3 STD5 SPL1 SPL2 SPL3 SPL4 SPL5 SPL6
0 50 12.5 100 100 100 100 100 100
C BLK STD1 STD3 STD5 SPL1 SPL2 SPL3 SPL4 SPL5 SPL6
0 50 12.5 100 100 100 100 100 100
D BLK STD1 STD3 STD5 SPL1 SPL2 SPL3 SPL4 SPL5 SPL6
0 50 12.5 100 100 100 100 100 100
E BLK STD2 STD4 STD6 SPL1 SPL2 SPL3 SPL4 SPL5 SPL6
100 25 6.25 50 50 50 50 50 50
F BLK STD2 STD4 STD6 SPL1 SPL2 SPL3 SPL4 SPL5 SPL6
100 25 6.25 50 50 50 50 50 50

40
Table 15 (cont’d)
Table 16 The Hunter Color CIE data of apple pomace after drying methods
Drying Method
Tempera-ture ºC
L* Average
L* a*
Average a*
b* Average
b* △E*
Average △E
Freeze Dried
20 52.6 51
53.9
52.5 ± 1.4525
14.2 11.3 11.6
12.36 ± 1.59
30.9 28.6 30.5
30 ± 1.22
28.77
23.9
22.42
25.03 ± 3.32
Drum Dried
140 38.8 47
39.9
41.9 ± 4.45
12.4 12.5 12.5
12.45 ± 0.05
26.4 29.7 26.7
27.6 ± 1.82
15.98
21.4
13.33
16.9 ± 4.11
Cabinet Dried
60 43.7 45
45.4
44.7 ± 0.88
14.8 14.3 15.6
14.9 ± 0.65
28.6 27.5 28.4
28.16 ± 0.58
20.77
18.32
16.26
18.45 ± 2.25
80 47.8 49.9 48.1
48.6 ± 1.13
14.7 12.9 12.5
13.36 ± 1.17
30 25.8 26
27.26 ± 2.36
24.6
21.26
15.28
20.38 ± 4.72
100 44.1 42.4 46.7
44.4 ± 2.16
15.1 15.7 15.5
15.43 ± 0.30
30.8 28.9 31.5
30.4 ± 1.34
22.74
17.66
19.59
19.99 ± 2.56
G BLK
STD2 100
STD4
25
STD6 6.25
SPL1
50
SPL2
50
SPL3
50
SPL4
50
SPL5
50
SPL6
50
H

41
Table 17 Effects drying methods on the antioxidant in apple pomace before drying
ORAC (µmol TE/g apple pomace) Average ORAC (µmol TE/g apple Pomace)
1059.2 1488.7 1498.2 2060.5 1706.2 790.6 700.4 949.2 817.3
1511.4 1869.1 707.2 321.5 913.8 666.3
1089.7 1166.7 1059.2 1488.7 1498.2 2060.5
1136.2 ± 480

42
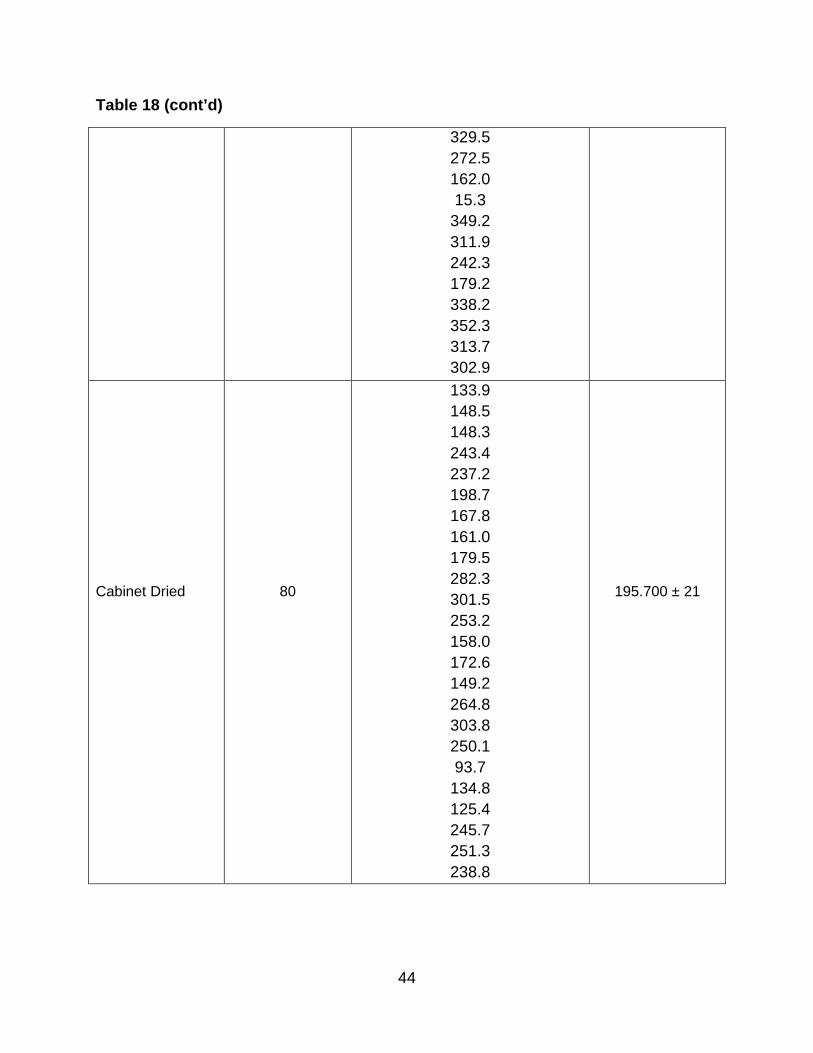
Table 18 Effects drying methods on the antioxidant in apple pomace after drying
Drying Method Air Temperature (°C) ORAC (µmol TE/g apple Pomace)
Average ORAC (µmol
TE/g apple Pomace)
Freeze Dried
20
378.8 425.8 388.8 305.9 263.6 190.1 363.2 373.4 370.3 336.5 292.6 211.2 406.1 463.5 413.8 324.1 318.2 145.2 405.1 453.4 420.5 360.4 378.8
350.275 ± 21

43
Table 18 (cont’d)
Drum Dried
140
152.7 159.2 154.8 168.4 143.1 115.7 126.8 139.2 153.8 160.4 164.7 125.1 210.1 285.9 280.7 154.0 136.6 102.3
158.066 ± 26.9
Cabinet Dried
60
224.7 256.1 296.3 292.4 299.4 278.6 201.5 222.6 238.1 291.1
244.450 ± 48.9
44
Table 18 (cont’d)
329.5 272.5 162.0 15.3
349.2 311.9 242.3 179.2 338.2 352.3 313.7 302.9
Cabinet Dried
80
133.9 148.5 148.3 243.4 237.2 198.7 167.8 161.0 179.5 282.3 301.5 253.2 158.0 172.6 149.2 264.8 303.8 250.1 93.7
134.8 125.4 245.7 251.3 238.8
195.700 ± 21
45
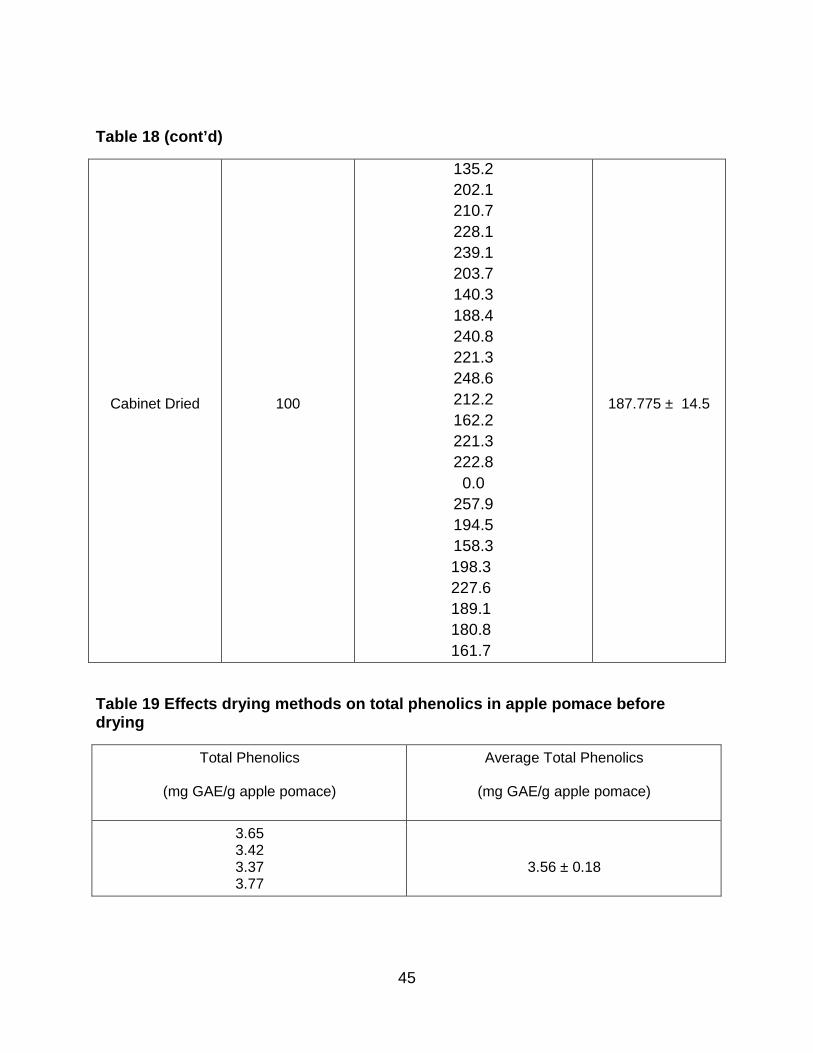
Table 18 (cont’d)
Cabinet Dried
100
135.2 202.1 210.7 228.1 239.1 203.7 140.3 188.4 240.8 221.3 248.6 212.2 162.2 221.3 222.8
0.0 257.9 194.5 158.3 198.3 227.6 189.1 180.8 161.7
187.775 ± 14.5
Table 19 Effects drying methods on total phenolics in apple pomace before drying
Total Phenolics
(mg GAE/g apple pomace)
Average Total Phenolics
(mg GAE/g apple pomace)
3.65 3.42 3.37 3.77
3.56 ± 0.18

46
Table 20 Effects drying methods on the total phenol ics in apple pomace after drying
Drying Method
Air
Temperature
(°C)
Total Phenolics
(mg GAE/g apple pomace)
Average Total Phenolic
(mg GAE/g apple pomace)
Freeze Dried 20 2.84 2.99 3.18 3.17
3.05 ± 0.16
Drum Dried 140 1.70 2.10 1.90 1.72
1.85 ± 0.18
Cabinet Dried 60 2.58 2.55 2.40 2.51
2.51 ± 0.07
80 2.20 1.95 1.99 2.41
2.14 ± 0.20
100 2.01 2.09 2.18 2.07
2.09 ± 0.07
Table 21 Effects drying methods on DPPH in apple po mace before drying
DPPH µmol TE/g Average DPPH µmol TE/g
286.502 297.618 294.442 300.793
294.839 ± 6.132

47
Table 22 Effects drying methods on DPPH in apple po mace after drying
Drying Method Air Temperature
(°C) DPPH µmol TE/g Average DPPH µmol TE/g
Freeze Dried 20 278.326 279.526 277.125 280.327
278.826 ± 1.400
Drum Dried 140 214.891 219.593 217.634 213.716
216.459 ± 2.657
Cabinet Dried 60 245.459 244.674 245.851 243.104
244.772 ± 1.214
80 237.700 237.308 236.132 236.916
237.013 ± 0.669
100 229.303 227.344 230.086 232.436
229.792 ± 2.106

48
REFERENCES

49
REFERENCES ggggggggggggggggggggggggggggggggggggggggggggggggggg gggggggggggggggggggggggggggggggggggggggggggggggggggggggggg ggggggg
gggggggggg Abulude F, Ndamitso M, Yusuf A, Santhi K, Vijayakumar TP, Sofi FR, Nissar KS, Nayak
PC, Amin A, Phadke G. 2013. ADVANCES IN FOOD SCIENCE AND NUTRITION: SCIENCE AND EDUCATION DEVELOPMENT INSTITUTE, NIGERIA. mmmmmmmmmmmmmmmmmmmmmmmmmmmmmmmmmmmmmmmmmmmmmmmmmmmmmmmmmmmmmmmmmmmmmmmmmmmmmmmmmmmmmm
Antolovich M, Prenzler PD, Patsalides E, McDonald S, Robards K. 2002. Methods for testing antioxidant activity. Analyst 127(1):183-98. mmmmmmmmmmmmmmmmmmmmmmmmmmmmmmmmmmmmmmmmmmmmmmmmmmmmmmmmmmmmmmmmmmmmmmmmmmmmmmmmmmmmmm
Arnous A, Makris DP, Kefalas P. 2001. Effect of principal polyphenolic components in relation to antioxidant characteristics of aged red wines. Journal of agricultural and food chemistry 49(12):5736-42. m
Askar A. 1998. Importance and characteristics of tropical fruits. Fruit Processing, 8, 273–276. mmmmmmmmmmmmmmmmmmmmmmmmmmmmmmmmmmmmmmmmmmm
Beereboom J, Glicksman M. 1979. Low calorie bulking agents. Critical Reviews in Food Science & Nutrition 11(4):401-13. m
Belshaw F. 1978. Citrus flour--a new fiber, nutrient source. Food Product Development 12. m
Bhushan S, Kalia K, Sharma M, Singh B, Ahuja P. 2008. Processing of apple pomace for bioactive molecules. Critical reviews in biotechnology 28(4):285-96. m
Bondet V, Brand-Williams W, Berset C. 1997. Kinetics and Mechanisms of Antioxidant Activity using the DPPH< sup>.</sup> Free Radical Method. LWT-Food Science and Technology 30(6):609-15. mmmmmmmmmmmmmmmmmmmmmmmmmmmmmmmmmmmmmmmmmmmmmmmmmmmm
Borek C. 1997. Antioxidants and cancer. Sci. Med 4:51-62. Carson K, Collins J, Penfield M. 1994. Unrefined, dried apple pomace as a potential
food ingredient. Journal of Food Science 59(6):1213-5. Drying agricultural products. 1985. mmmmmmmmmmmmmmmmmmmmmmmmmmmmmmmmmmmmmmmmmmmmmmmmmmmmmmm
Fellows PJ. 2000. Food processing technology: principles and practice: CRC Press.

50
Feng H, Tang J, Cavalieri R. 2002. Dielectric properties of dehydrated apples as affected by moisture and temperature. Transactions-American Society of Agricultural Engineers 45(1):129-36. mmmmmmmmmmmmmmmmmmmmmmmmmmmmmmmmmmmmmmmmmmmmmmmmmmmmmm
Frankel EN, Meyer AS. 2000. The problems of using one‐dimensional methods to evaluate multifunctional food and biological antioxidants. Journal of the Science of Food and Agriculture 80(13):1925-41. mmmmmmmmmmmmmmmmmmmmmmmmmmmmmmmmmmmmmmmmmmmmmmmmmmmmm
Ganske F, Dell E. 2006. ORAC assay on the FLUOstar OPTIMA to Determine Antioxidant Capacity–BMG LABTECH. Application note 148. mmmmmmmmmmmmmmmmmmmmmmmmmmmmmmmmmmmmmmmmmmmmmmmmmmmm
Gavrielidou M, Vallous N, Karapantsios T, Raphaelides S. 2002. Heat transport to a starch slurry gelatinizing between the drums of a double drum dryer. Journal of Food Engineering 54(1):45-58. mmmmmmmmmmmmmmmmmmmmmmmmmmmmmmmmmmmmmmmmmmmmmmmmmmmm
Gil MI, Tomás-Barberán FA, Hess-Pierce B, Kader AA. 2002. Antioxidant capacities, phenolic compounds, carotenoids, and vitamin C contents of nectarine, peach, and plum cultivars from California. Journal of Agricultural and Food Chemistry 50(17):4976-82. mmmmmmmmmmmmmmmmmmmmmmmmmmmmmmmmmmmmmmmmmmmmmmmmmmm
Glazer AN. 1990. [14] Phycoerythrin fluorescence-based assay for reactive oxygen species. Methods in enzymology 186:161-8. mmmmmmmmmmmmmmmmmmmmmmmmmmmmmmmmmmmmmmmmmmmmmmmmmmmmm
Halliwell B. 1997. Antioxidants and human disease: a general introduction. Nutrition reviews 55(1):S44-S9. mmmmmmmmmmmmmmmmmmmmmmmmmmmmmmmmmmmmmmmmmmmmmmmmmmm
Halliwell BG, J.M.C. 1989. Free radicals in biology and medicine. Clarendon Press, Oxford. mmmmmmmmmmmmmmmmmmmmmmmmmmmmmmmmmmmmmmmmmmmmmmmmmmmm
Hang Y. 1987. Production of fuels and chemicals from apple pomace. Food Technol.;(United States) 41(3). mmmmmmmmmmmmmmmmmmmmmmmmmmmmmmmmmmmmmmmmmmmmmmmmmmmmmm
Hess D. 1975. Phenols. In Plant Physiology (pp. 117-137). Springer Berlin Heidelberg. m

51
Hsu C-L, Chen W, Weng Y-M, Tseng C-Y. 2003. Chemical composition, physical properties, and antioxidant activities of yam flours as affected by different drying methods. Food Chemistry 83(1):85-92. m
Ingredients M. 2012. Versatile Pomace Powders Food Product Design: Marshall Ingredients p. 77. mmmmmmmmmmmmmmmmmmmmmmmmmmmmmmmmmmmmmmmmmmmmmmmmmmm
Larson RA. 1988. The antioxidants of higher plants. Phytochemistry 27(4):969-78. mmmmmmmmmmmmmmmmmmmmmmmmmmmmmmmmmmmmmmmmmmmmmmmmmmmmmm
Matsumoto T, Nakagawa H, Tanigawa M. 2000. Drum type drying/washing machine. Google Patents. mmmmmmmmmmmmmmmmmmmmmmmmmmmmmmmmmmmmmmmmmmmmmmmmmm
Mejia-Meza E. 2008. Polyphenol content and antioxidant activity in dehydrated berries and apple juice. Washington State University, Ph.D. Dissertation. mmmmmmmmmmmmmmmmmmmmmmmmmmmmmmmmmmmmmmmmmmmmmmmmmmmmmm
Moore JGNYM, Dekker. 1995. Drum Dryers. In A. S. Mujumdar (Ed.) Handbook of industrial drying. New York: Marcel. mmmmmmmmmmmmmmmmmmmmmmmmmmmmmmmmmmmmmmmmmmmmmmmmmmmm
Moure A, Cruz JM, Franco D, Domı�nguez JM, Sineiro J, Domı�nguez H, José Núñez Ma, Parajó JC. 2001. Natural antioxidants from residual sources. Food Chemistry 72(2):145-71. mmmmmmmmmmmmmmmmmmmmmmmmmmmmmmmmmmmmmmmmmmmmmmmmmmmmmmm
Oetjen. 2004. Freeze-drying. 2nd completely rev. and extended ed. Weinheim [Cambridge]: Wiley-VCH. xii,. 395 p. p. mmmmmmmmmmmmmmmmmmmmmmmmmmmmmmmmmmmmmmmmmmmmmmmmmmmm
Okubo SR, Kanawati A, Richards MW, Childressd S. 1998. Evaluation of visual and instrument shade matching. The Journal of prosthetic dentistry 80(6):642-8. mmmmmmmmmmmmmmmmmmmmmmmmmmmmmmmmmmmmmmmmmmmmmmmmmmmmmm
Ou B, Hampsch-Woodill M, Prior RL. 2001. Development and validation of an improved oxygen radical absorbance capacity assay using fluorescein as the fluorescent probe. Journal of agricultural and food chemistry 49(10):4619-26. mmmmmmmmmmmmmmmmmmmmmmmmmmmmmmmmmmmmmmmmmmmmmmmmmmmmm
Ozcelik B, Lee J, Min D. 2003. Effects of Light, Oxygen, and pH on the Absorbance of 2, 2‐Diphenyl‐1‐picrylhydrazyl. Journal of Food Science 68(2):487-90. mmmmmmmmmmmmmmmmmmmmmmmmmmmmmmmmmmmmmmmmmmmmmmmmmmmm

52
Prior RL, Wu X, Schaich K. 2005. Standardized methods for the determination of antioxidant capacity and phenolics in foods and dietary supplements. Journal of agricultural and food chemistry 53(10):4290-302. mmmmmmmmmmmmmmmmmmmmmmmmmmmmmmmmmmmmmmmmmmmmmmmmmmmm
Protas JFdS, and Valdebenito-Sanhueza, R. M. 2003. Produ¸c˜ao Integrada de frutasProdu¸c˜ao Integrada de frutas. O caso da ma¸c˜a no Brasil, Bento Gon¸calves, Embrapa Uva e Vinho. mmmmmmmmmmmmmmmmmmmmmmmmmmmmmmmmmmmmmmmmmmmmmmmmmmmm
Rice-Evans C, Miller N, Paganga G. 1997. Antioxidant properties of phenolic compounds. Trends in plant science 2(4):152-9. mmmmmmmmmmmmmmmmmmmmmmmmmmmmmmmmmmmmmmmmmmmmmmmmmmm
Schwannecke MK. 2009. Physico-chemical Characteristics and Antioxidant Activity of Tart Cherry Powder Dried by Various Drying Methods. Michigan State University, MS. mmmmmmmmmmmmmmmmmmmmmmmmmmmmmmmmmmmmmmmmmmmmmmmmmmm
Sharma OP, Bhat TK. 2009. DPPH antioxidant assay revisited. Food Chemistry 113(4):1202-5. mmmmmmmmmmmmmmmmmmmmmmmmmmmmmmmmmmmmmmmmmmmmmmmmmmmm
Singleton V, Rossi JA. 1965. Colorimetry of total phenolics with phosphomolybdic-phosphotungstic acid reagents. American journal of Enology and Viticulture 16(3):144-58. mmmmmmmmmmmmmmmmmmmmmmmmmmmmmmmmmmmmmmmmmmmmmmmmmmmm
Sogi DS, Siddiq M, Greiby I, Dolan KD. 2013. Total phenolics, antioxidant activity, and functional properties of ‘Tommy Atkins’ mango peel and kernel as affected by drying methods. Food chemistry 141(3):2649-55. mmmmmmmmmmmmmmmmmmmmmmmmmmmmmmmmmmmmmmmmmmmmmmmmm
Somers T, Ziemelis G. 1972. Interpretations of ultraviolet absorption in white wines. Journal of the Science of Food and Agriculture 23(4):441-53. mmmmmmmmmmmmmmmmmmmmmmmmmmmmmmmmmmmmmmmmmmmmmmmmmmmm
Tang J, Yang T. 2003. Dehydrated vegetables: principles and systems. Handbook of vegetable preservation and processing:335-72. mmmmmmmmmmmmmmmmmmmmmmmmmmmmmmmmmmmmmmmmmmmmmmmmmmm
Thaipong K, Boonprakob U, Crosby K, Cisneros-Zevallos L, Hawkins Byrne D. 2006. Comparison of ABTS, DPPH, FRAP, and ORAC assays for estimating antioxidant activity from guava fruit extracts. Journal of Food Composition and Analysis 19(6):669-75.

53
mmmmmmmmmmmmmmmmmmmmmmmmmmmmmmmmmmmmmmmmmmmmmmmmmmmmm
Vendruscolo F, Albuquerque PM, Streit F, Esposito E, Ninow JL. 2008. Apple pomace: a versatile substrate for biotechnological applications. Critical Reviews in Biotechnology 28(1):1-12. mmmmmmmmmmmmmmmmmmmmmmmmmmmmmmmmmmmmmmmmmmmmmmmmmmm
Walter R, Rao M, Sherman R, Cooley H. 1985. Edible fibers from apple pomace. Journal of Food Science 50(3):747-9. mmmmmmmmmmmmmmmmmmmmmmmmmmmmmmmmmmmmmmmmmmmmmmmmm
Xu G, Ye X, Chen J, Liu D. 2007. Effect of heat treatment on the phenolic compounds and antioxidant capacity of citrus peel extract. Journal of Agricultural and Food chemistry 55(2):330-5. mmmmmmmmmmmmmmmmmmmmmmmmmmmmmmmmmmmmmmmmmmmmmmmmmm
Yam KL, Papadakis SE. 2004. A simple digital imaging method for measuring and analyzing color of food surfaces. Journal of Food Engineering 61(1):137-42. mmmmmmmmmmmmmmmmmmmmmmmmmmmmmmmmmmmmmmmmmmmmm
Yan H, Kerr WL. 2013. Total phenolics content, anthocyanins, and dietary fiber content of apple pomace powders produced by vacuum‐belt drying. Journal of the Science of Food and Agriculture 93(6):1499-504. mmmmmmmmmmmmmmmmmmmmmmmmmmmmmmmmmmmmmmmmmmmmmmmmmmm
Zhang L. 1999. Microwave drying food technique. Food Industry 45–7. mmmmmmmmmmmmmmmmmmmmmmmmmmmmmmmmmmmmmmmmmmmmmmmmmmm
Zhao L. 2000. Current situation and development trend of dehydratedvegetables in our country. Chinese Food and Nutrition:21–2. mmmmmmmmmmmmmmmmmmmmmmmmmmmmmmmmmmmmmmmmmmmmmmm
Zulueta A, Esteve MJ, Frígola A. 2009. ORAC and TEAC assays comparison to measure the antioxidant capacity of food products. Food Chemistry 114(1):310-6.
Related Documents