EFFECTS OF DIESEL—WATER EMULSION COMBUSTION ON DIESEL ENGINE NO x EMISSIONS By C. ALAN CANFIELD A THESIS PRESENTED TO THE GRADUATE SCHOOL OF THE UNIVERSITY OF FLORIDA IN PARTIAL FULFILLMENT OF THE REQUIREMENTS FOR THE DEGREE OF MASTER OF SCIENCE UNIVERSITY OF FLORIDA 1999

Welcome message from author
This document is posted to help you gain knowledge. Please leave a comment to let me know what you think about it! Share it to your friends and learn new things together.
Transcript
EFFECTS OF DIESEL—WATER EMULSION COMBUSTION ONDIESEL ENGINE NOx EMISSIONS
By
C. ALAN CANFIELD
A THESIS PRESENTED TO THE GRADUATE SCHOOL OF THEUNIVERSITY OF FLORIDA IN PARTIAL FULFILLMENT
OF THE REQUIREMENTS FOR THE DEGREE OFMASTER OF SCIENCE
UNIVERSITY OF FLORIDA
1999
ii
ACKNOWLEDGEMENTS
I owe thanks to many individuals for supporting me in my graduate studies at the University
of Florida (UF) while working full-time. I extend special and sincere thanks to my advisor and
committee chair, Dr. Zhuomin Zhang, for providing valuable advice in the thesis preparation and
graduate studies. Additional thanks go to Dr. Charles Proctor, III, for guidance in establishing the
thesis proposal and background review, and Drs. William Lear and Alex Green for serving on my
committee.
All graduate coursework was conducted through the distance learning program facilitated by
the Florida Engineering Education and Delivery System (FEEDS) offices at UF and the Florida
State University Panama City Campus (FSU/PCC). I sincerely appreciate the dedication and
patience of Professors Hsieh, Zhang, Mittal, and Kurzweg for accommodating off-campus
students in their courses. Ms. Becky Hoover of the UF Mechanical Engineering Graduate Office,
Ms. Joyce Phillips of the UF FEEDS office, and Ms. Pat Lawson of the FSU/PCC FEEDS office
were invaluable in course administration. Mr. Oliver Canaday of the Tyndall AFB Education
Center and Ms. Sheila Ray of the Tyndall AFB Library supported the receipt and viewing of my
course videotapes. Without the support of these individuals, I would not have been able to pursue
or complete this program.
I gratefully acknowledge and value the long-term support and friendship of Dr. Joe Wander
of the Air Force Research Lab, Airbase & Environmental Technology Division. Dr. Aly Shaaban
of Applied Research Associates graciously provided testing data for evaluation. Finally, I
dedicate this thesis to my parents, Charles and Katherine Canfield.
iii
PREFACE
This thesis is the result of graduate studies and research toward a Master of Science in
mechanical engineering at the University of Florida. The coursework and research was
conducted while working full-time for Applied Research Associates, Inc. at Tyndall Air Force
Base, Florida, supporting the Air Force Research Laboratory (AFRL) Airbase & Environmental
Technology Division. Dr. Joseph D. Wander was the Air Force Project Officer.
Most of the test data evaluated in this thesis was collected by Dr. Aly Shaaban in 1996, with
the remainder collected in late 1998 by the author. A project to implement the alternative fuel
described herein for a six-month test is planned for early 1999. A patent application is under
review for the additive package used for maintaining a stable fuel—water mixture, preventing
detailed description of the additive components.
iv
TABLE OF CONTENTS
page
ACKNOWLEDGEMENTS.........................................................................................................ii
PREFACE .................................................................................................................................iii
ABBREVIATIONS...................................................................................................................vi
ABSTRACT .............................................................................................................................vii
CHAPTERS
1. INTRODUCTION...............................................................................................................1
Background..................................................................................................................1Objective.....................................................................................................................3Outline.........................................................................................................................4
2. REVIEW OF INTERNAL COMBUSTION ENGINE FUNDAMENTALS..........................5
History of Internal Combustion Engines.......................................................................5Physical Engine Characteristics....................................................................................6ICE Thermodynamic Cycles.........................................................................................8ICE Mechanical Cycles..............................................................................................12Fuel/Air Mixtures.......................................................................................................15First Law of Thermodynamics Analysis .....................................................................17Heat Transfer Effects in ICEs.....................................................................................19
3. INTERNAL COMBUSTION ENGINE EMISSIONS........................................................26
Pollutant Formation....................................................................................................26Control Technologies.................................................................................................31
4. EXPERIMENTAL METHODS AND PROCEDURES......................................................39
A/M32A-86 Parameters .............................................................................................39Fuel Properties...........................................................................................................41Sampling Procedure...................................................................................................43Data Collection..........................................................................................................45
5. RESULTS AND DISCUSSION ........................................................................................48
Experimental Results .................................................................................................48First Law of Thermodynamics Calculation.................................................................60Equilibrium Code Calculation ....................................................................................64NOx Formation Rate Calculation................................................................................69Effects of Water Injection...........................................................................................72
page
v
6. CONCLUSIONS AND RECOMMENDATIONS..............................................................74
Results.......................................................................................................................74Conclusions...............................................................................................................75Recommendations for Further Study ..........................................................................75
APPENDIX
NOMENCLATURE..........................................................................................................77
REFERENCES.........................................................................................................................79
BIOGRAPHICAL SKETCH.....................................................................................................85
vi
ABBREVIATIONS
AFB Air Force Base
AGE aerospace ground equipment
ARB Air Reserve Base
BDC bottom dead center
BSFC brake specific fuel consumption
CI compression ignition
CN cetane number
CO carbon monoxide
CR compression ratio
EPA Environmental Protection Agency
HC hydrocarbon
ICE internal combustion engine
MIL-SPEC military specification
NOx nitrogen oxides
NO nitric oxide
NO2 nitrogen dioxide
SI spark ignition
SVOC semi-volatile organic compound
TDC top dead center
UHC unburned hydrocarbons
USAF United States Air Force
VOC volatile organic compound
vii
Abstract of Thesis Presented to the Graduate Schoolof the University of Florida in Partial Fulfillment of the
Requirements for the Degree of Master of Science
EFFECTS OF DIESEL—WATER EMULSION COMBUSTION ON DIESEL ENGINENOx EMISSIONS
By
C. Alan Canfield
May 1999
Chairman: Zhuomin ZhangMajor Department: Mechanical Engineering
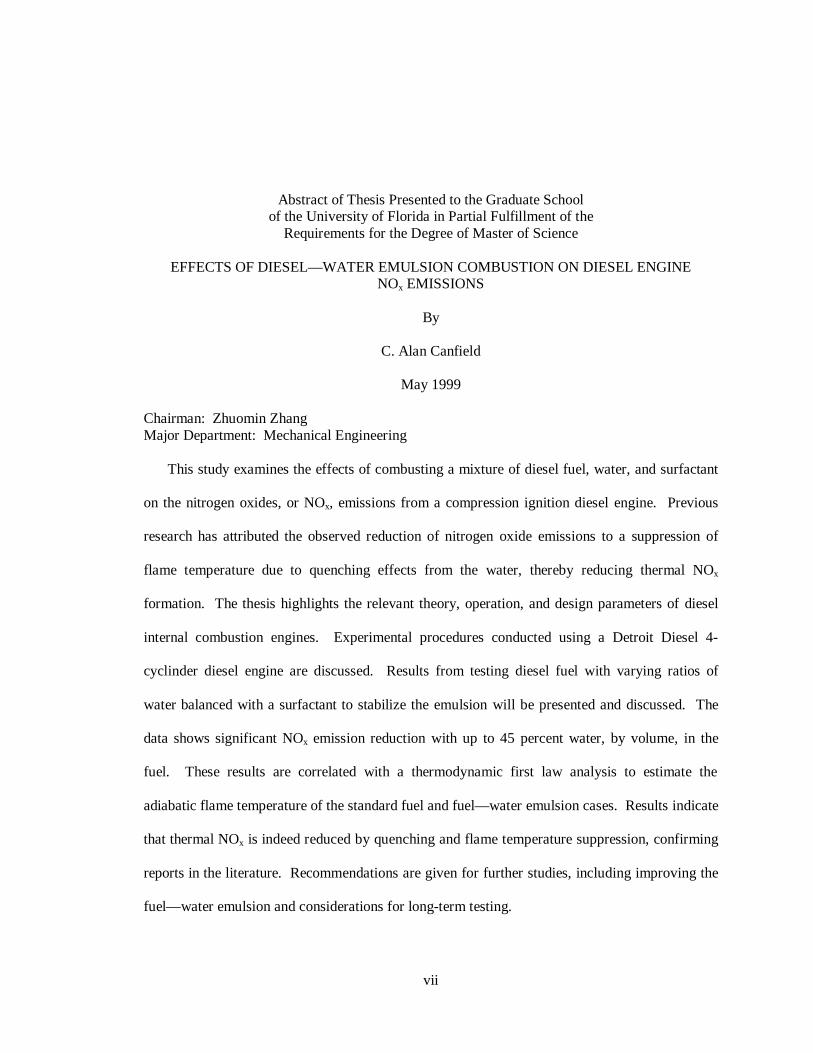
This study examines the effects of combusting a mixture of diesel fuel, water, and surfactant
on the nitrogen oxides, or NOx, emissions from a compression ignition diesel engine. Previous
research has attributed the observed reduction of nitrogen oxide emissions to a suppression of
flame temperature due to quenching effects from the water, thereby reducing thermal NOx
formation. The thesis highlights the relevant theory, operation, and design parameters of diesel
internal combustion engines. Experimental procedures conducted using a Detroit Diesel 4-
cyclinder diesel engine are discussed. Results from testing diesel fuel with varying ratios of
water balanced with a surfactant to stabilize the emulsion will be presented and discussed. The
data shows significant NOx emission reduction with up to 45 percent water, by volume, in the
fuel. These results are correlated with a thermodynamic first law analysis to estimate the
adiabatic flame temperature of the standard fuel and fuel—water emulsion cases. Results indicate
that thermal NOx is indeed reduced by quenching and flame temperature suppression, confirming
reports in the literature. Recommendations are given for further studies, including improving the
fuel—water emulsion and considerations for long-term testing.
1
CHAPTER 1
INTRODUCTION
Background
McClellan Air Force Base (AFB), California, identified mobile diesel engines as contributing
nearly as much total NOx emissions as aircraft and stationary sources combined. Hourly-rated
diesel engines contributed 75 percent of this NOx, with the remainder emitting from gasoline and
diesel engines rated in miles (Canfield et al., 1997). Hourly-rated diesel engines include non-road
mobile equipment such as forklifts, bulldozers, air-conditioning units, and generators. McClellan
AFB is located in Sacramento, California, classified as Extreme for ozone attainment status. This
classification recognizes ozone pre-cursors, NOx and VOCs, as immediately dangerous to human
and environmental health, and places the highest restrictions on emissions and fines for exceeding
these limits.
In addition to air quality compliance concerns at McClellan AFB, March Air Reserve Base
(ARB) in southern California faced immediate reduction in training and operational use of AGE
generators due to South Coast Air Quality Management District (SCAQMD) Rule 1110.2. This
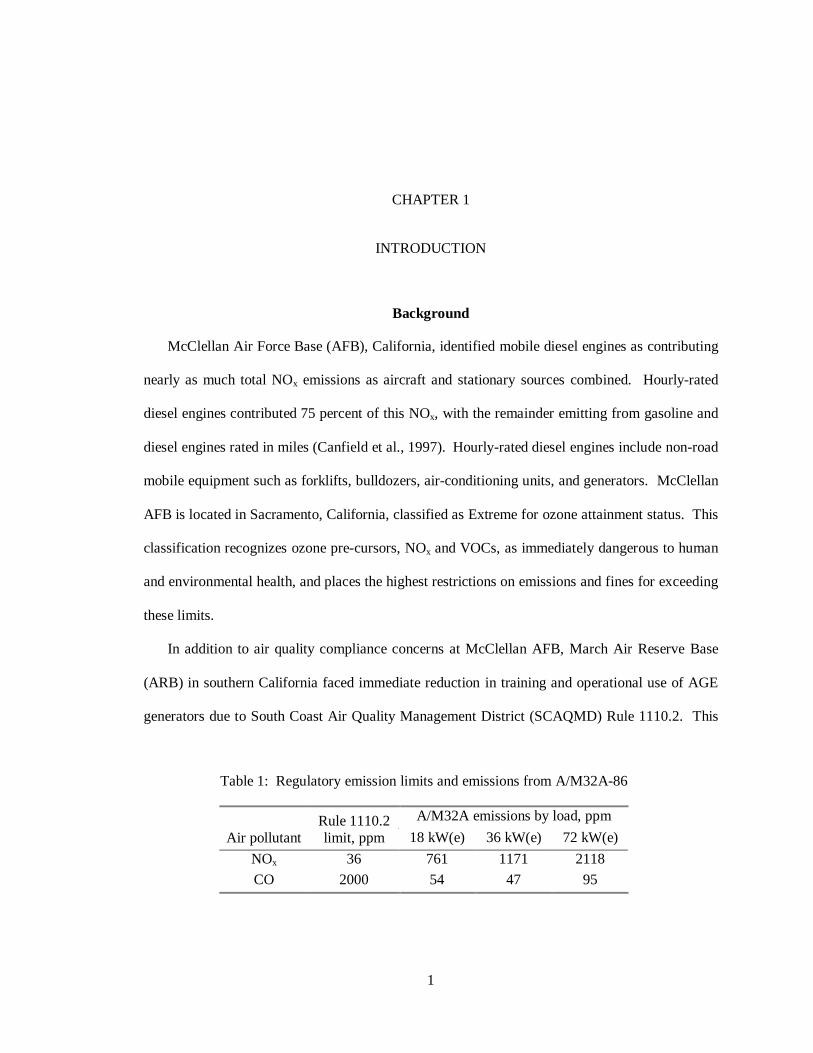
Table 1: Regulatory emission limits and emissions from A/M32A-86
A/M32A emissions by load, ppm
Air pollutantRule 1110.2limit, ppm 18 kW(e) 36 kW(e) 72 kW(e)
NOx 36 761 1171 2118
CO 2000 54 47 95
2
rule placed regulatory limits on emissions from non-road mobile sources over 37 kW. These
limits, and the corresponding emissions from an A/M32A-86 diesel generator at varying electric
generator loads, are listed in Table 1. The A/M32A-86 generator, the subject of the present study,
is described in detail in Chapter 4. Please note in Table 1 the limit of 36 ppm for NOx emissions,
while the A/M32A-86 emits over 20 times this at 18 kW, only 25 percent of full load.
AGE does not currently meet these emission limitations and will not without emission
controls and/or combustion system or fuel modifications. All AGE units over 50 hp were
required to comply with Rule 1110.2 emission limits by 31 Dec 94 or the facility would: 1)
remove the AGE units from service, 2) pay daily fines, 3) or submit a proposal for complete
electrification by Dec 1999.
AGE at March ARB fell under three general categories:
1. Gasoline-fueled internal combustion engines (ICEs)
2. Diesel-fueled ICEs
3. JP-8-fueled turbine engines
There were 81 total pieces of AGE over 37 kW, excluding turbine-powered AGE, at March ARB
in 1996. The 168 units of AGE under 37 kW are not presently regulated by Rule 1110.2.
The Air Force surveyed its laboratories for potential solutions to air pollutant emissions from
AGE. A team was formed to investigate commercial off-the-shelf (COTS) products or
developing technologies for emission controls or alternate power sources applicable to AGE.
Laboratories with promising technologies were tasked to prepare preliminary and final proposals
for demonstration, validation, and implementation of their technologies. A request for
information was also posted in the Commerce Business Daily to survey COTS for AGE emission
controls.
Several technologies proposed by the Air Force laboratories to control NOx emissions from
AGE included selective catalytic reduction, increasing O2 in the intake air, a mobile filter cart, a
3
nonthermal plasma reactor control system, and water injection with the fuel, described in this
thesis.
Dryer (1976) reports a reference to water injection in a combustion system dating back to
1791, in which water was used to cool the blades in early gas turbines. In the last 20 years water
has received varying levels of interest as a means to improve combustion efficiency and reduce
air pollutant emissions from ICEs. These reports in the literature will be discussed and compared
with the current research.
Early work demonstrated that with fuel:water volumetric ratios from 1:1 to 9:1, the addition
of 1-2 volume percent surfactant allowed a stable emulsion to be maintained with the diesel and
water mixture. Using this formula and testing varying ratios of fuel and water for combustion
properties developed the data sets that will be evaluated in this thesis. Various injector timing
setting were also evaluated. For a given injector timing setting, data will be presented for the
baseline case of the generator operating on standard military diesel, and for various fuel mixtures
of different water volume ratios.
Objective
The purpose of this research is to investigate the use of a stabilized diesel—water fuel
mixture as a drop-in replacement in U.S. Air Force (USAF) mobile aerospace ground equipment
(AGE). The USAF is interested in lowering the emissions of nitrogen oxides (NOx) and other
emissions from AGE during training and non-warfighting missions to comply with air quality
regulations governing facilities in the continental United States.
The tasks involved in this research involved (1) evaluating the performance and behavior of
the fuel—water mixtures and (2) measuring the effect of the fuel—water mixture on AGE power
and air pollutant emissions. Previous unpublished work at the author’s laboratory determined the
optimal diesel—water emulsion preparation techniques and mixture ratios. Research reported
4
herein focused on evaluating varying ratios of water in the fuel and the resultant effect on air
pollutant emissions, especially NOx.
This study was conducted as part of an Air Force initiative to reduce emissions from
aerospace ground equipment (Akridge et al., 1997, and Canfield et al., 1997). Of six technologies
evaluated for AGE NOx reduction, the fuel—water emulsion promises the easiest “drop-in”
solution. NOx emissions can be lowered with little or no modifications required to the diesel
engines.
Outline
This thesis begins with a review internal combustion engines in Chapter 2, including history,
physical components and geometry, and mass and heat transfer aspects. Chapter 3 will discuss
internal combustion engine air pollutant formation pathways and existing control technology
options. The test engine, experimental procedures, fuel properties and variables, and data
collection will be described in Chapter 4. Chapter 5 will present the experimental data and
results, with a comparison to first law of thermodynamics and equilibrium products code
predictions. NOx formation rate equations will be presented in Chapter 5, and the potential
effects of water injection on combustion will be described. Chapter 6 will discuss the findings,
conclusions, and recommendations from the research, including confirmation of research
published in the literature.
5
CHAPTER 2
REVIEW OF INTERNAL COMBUSTION ENGINE FUNDAMENTALS
History of Internal Combustion Engines
From the first application of open fire to provide heating, lighting, and cooking, combustion
science has evolved to providing distributed electricity generation and mechanical energy for
most modes of transportation. Combustion is described as either external or internal. External
combustion is defined as combustion in which the process fluid is external to, or different from,
the mechanical energy-producing fluid. For example, coal-fired power plants operate as external
combustion because the coal is combusted to generate steam, and the steam then turns a turbine to
generate electricity. If the fluid undergoing combustion also generates mechanical energy in the
system, the process is defined as internal combustion. For example, in reciprocating internal
combustion engines the gas expansion from combustion of the air and fuel mixture moves a
piston, which turns a crankshaft, generating mechanical power for propulsion, electricity
generation, etc. Gas turbines and rocket engines are also defined as internal combustion, since, in
both cases, the air and fuel mixtures after combustion and compression provide mechanical power
through thrust.
Advances in the understanding of the thermodynamic cycles of combustion have improved
the design of combustion engines. Improvements in materials science also support improvements
in engine performance and durability. For example, advances in materials and design have
improved the compressor ratio of gas turbines from 3:1 to 30:1, and increased the efficiencies
from 3.5% to 30%. Similarly, computer modeling and simulation has supported advanced intake,
6
combustion cylinder, and exhaust systems design on modern automobiles resulting in higher
thermal and mechanical efficiencies with reduced air pollutant emissions.
Physical Engine Characteristics
Before discussing the operation, design, and analysis of internal combustion engines (ICEs),
it is worthwhile to review the specific engine components involved in and affecting the
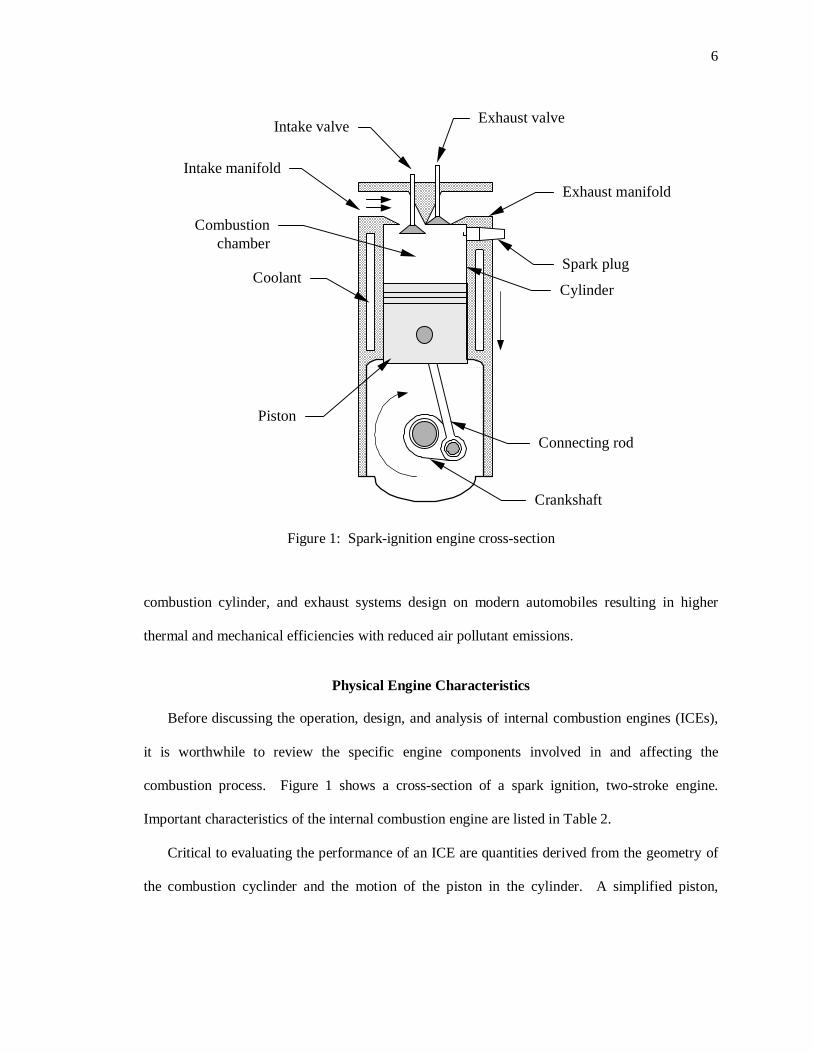
combustion process. Figure 1 shows a cross-section of a spark ignition, two-stroke engine.
Important characteristics of the internal combustion engine are listed in Table 2.
Critical to evaluating the performance of an ICE are quantities derived from the geometry of
the combustion cyclinder and the motion of the piston in the cylinder. A simplified piston,
Intake valve
Intake manifold
Coolant
Combustionchamber
Piston
Crankshaft
Connecting rod
Spark plug
Exhaust valve
Exhaust manifold
Cylinder
Figure 1: Spark-ignition engine cross-section
7
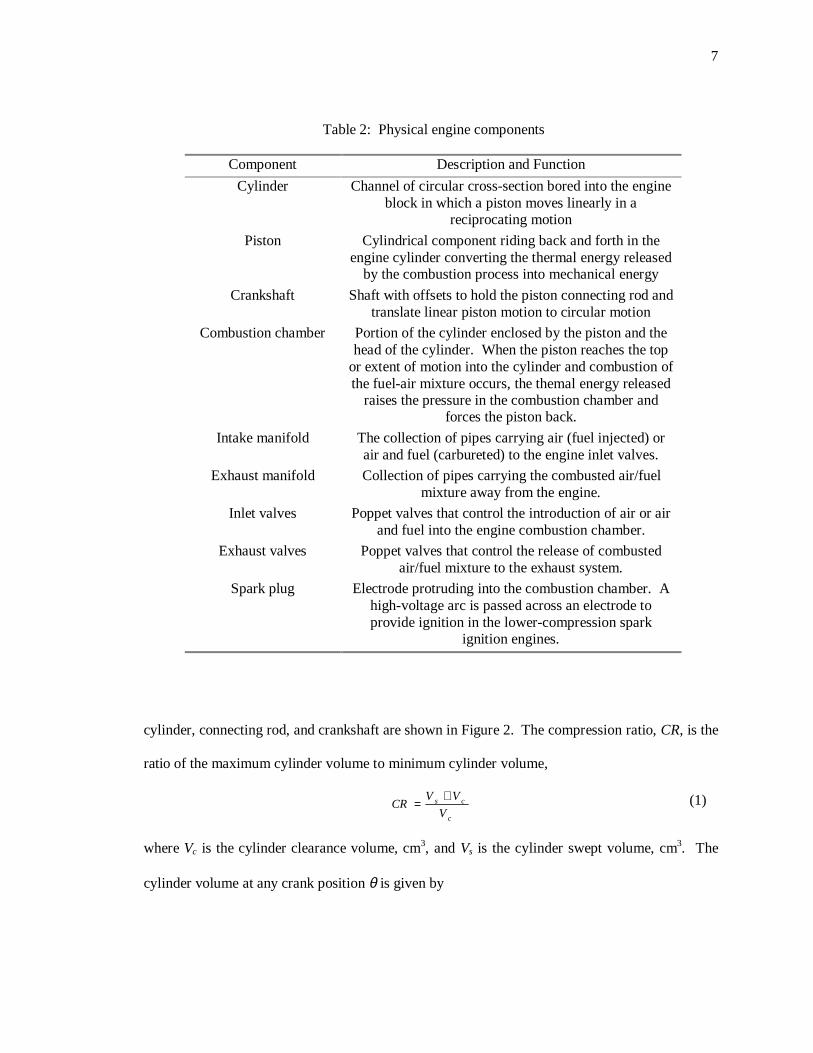
cylinder, connecting rod, and crankshaft are shown in Figure 2. The compression ratio, CR, is the
ratio of the maximum cylinder volume to minimum cylinder volume,
c
cs
V
VVCR
+= (1)
where Vc is the cylinder clearance volume, cm3, and Vs is the cylinder swept volume, cm3. The
cylinder volume at any crank position θ is given by
Table 2: Physical engine components
Component Description and Function
Cylinder Channel of circular cross-section bored into the engineblock in which a piston moves linearly in a
reciprocating motion
Piston Cylindrical component riding back and forth in theengine cylinder converting the thermal energy released
by the combustion process into mechanical energy
Crankshaft Shaft with offsets to hold the piston connecting rod andtranslate linear piston motion to circular motion
Combustion chamber Portion of the cylinder enclosed by the piston and thehead of the cylinder. When the piston reaches the top
or extent of motion into the cylinder and combustion ofthe fuel-air mixture occurs, the themal energy released
raises the pressure in the combustion chamber andforces the piston back.
Intake manifold The collection of pipes carrying air (fuel injected) orair and fuel (carbureted) to the engine inlet valves.
Exhaust manifold Collection of pipes carrying the combusted air/fuelmixture away from the engine.
Inlet valves Poppet valves that control the introduction of air or airand fuel into the engine combustion chamber.
Exhaust valves Poppet valves that control the release of combustedair/fuel mixture to the exhaust system.
Spark plug Electrode protruding into the combustion chamber. Ahigh-voltage arc is passed across an electrode toprovide ignition in the lower-compression spark
ignition engines.
8
( )pcrcs drlb
VV -4
2
++=: . (2)
Please refer to Figure 2 for additional ICE geometry nomenclature. The stroke length, ls, and
the cylinder bore, b, are critical in determining the power output of the combustion process.
ICE Thermodynamic Cycles
Combustion in reciprocating piston ICEs is commonly assumed to operate either as a constant
volume or constant pressure process. The Otto cycle, a constant volume heat addition
thermodynamic process, closely models combustion in spark ignition (SI) ICEs. The diesel cycle
is a constant pressure, slower-speed cycle depicting combustion in compression ignition, or
diesel, cycle engines. A combination of the Otto and diesel cycles is referred to as the mixed,
lr
θ
dp
rc
TDC
BDC
lsVs
Vc
b
b = cylinder bore, cmVc = clearance volume, cm3
Vs = swept volume, cm3
ls = stroke length, cmTDC = top dead centerBDC = bottom dead center
dp = distance from piston pivotaxis to crank axis, cm
lr = connecting rod length, cmθ = crank angle, radrc = crankshaft radius, cm
Figure 2: Reciprocating ICE geometry (not to scale)
9
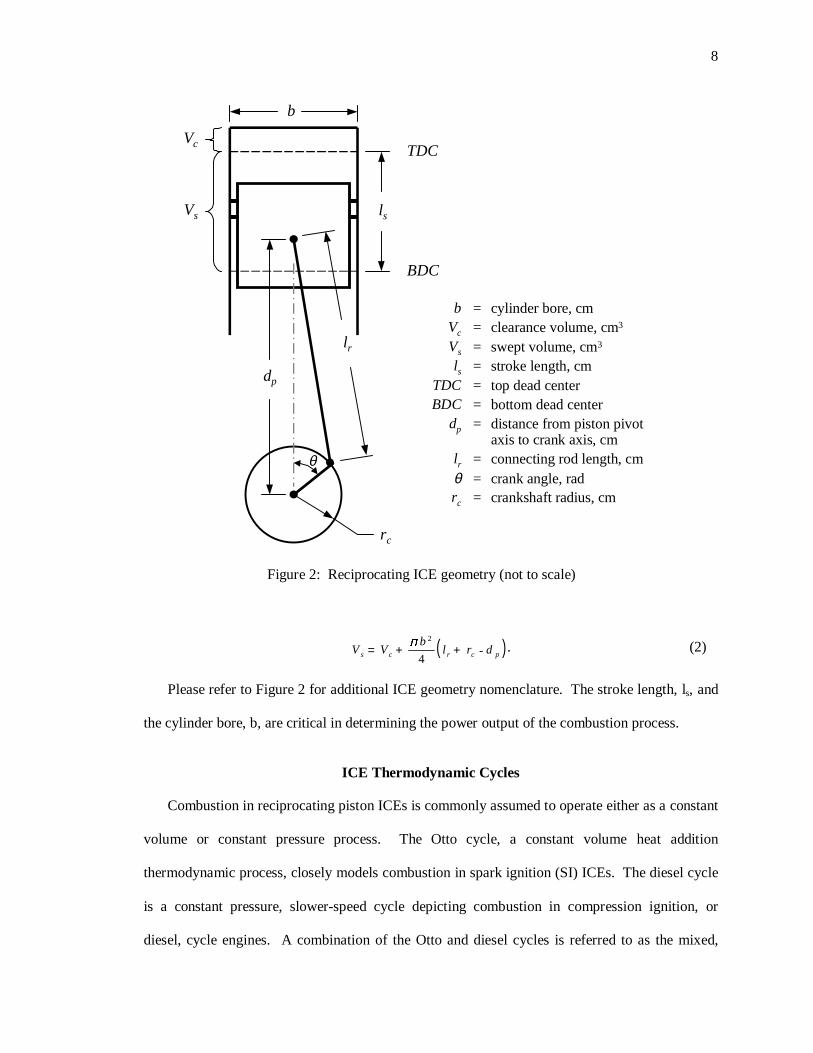
limited pressure, or combination cycle. The Otto and diesel cycles are shown in Figure 3 to
demonstrate the differences. As mentioned, the constant volume heat addition of the Otto cycle
and the constant pressure heat addition of the diesel cycle are shown in step 2 → 3 of the
respective set of graphs. The primed points (i.e., 2’ and 3’) depict the non-isentropic expansion
points attained due to irreversibility. The label s = c and v = c refer to the ideal constant specific
entropy and specific volume for the respective step.
The graphs shown in Figure 3 depict the theoretical, adiabatic compression and expansion of
the Otto and diesel cycles. Actual combustion processes vary from theoretical due to various
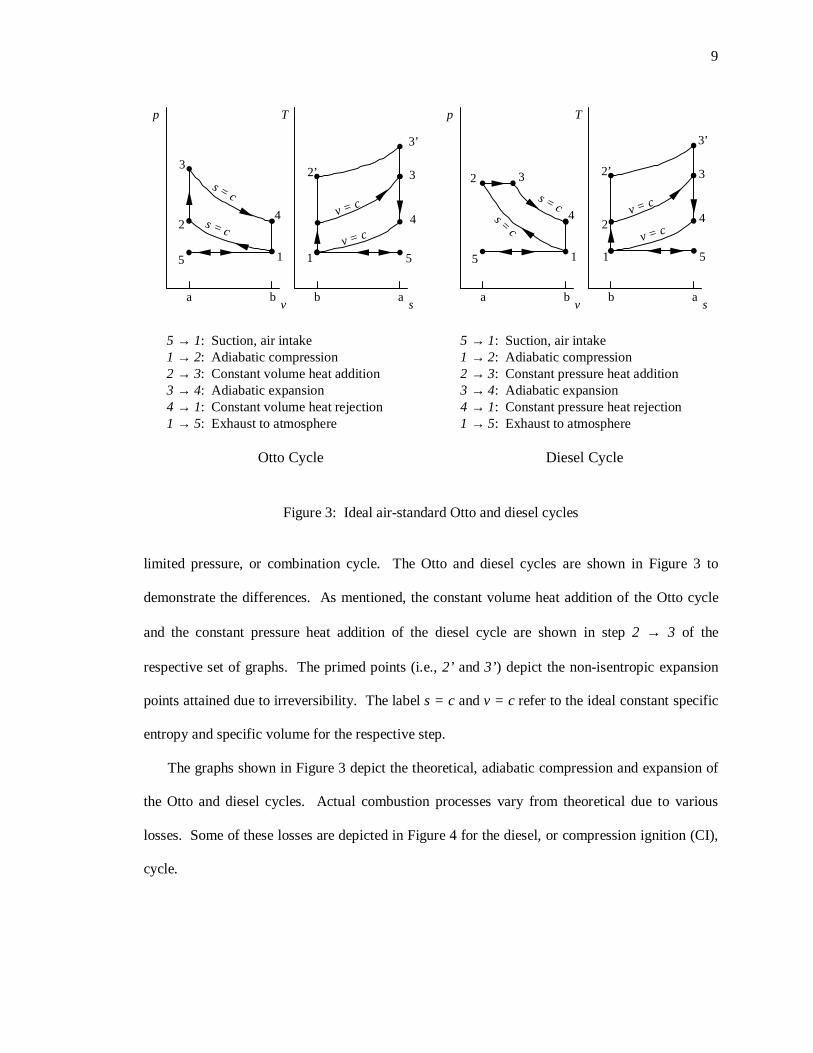
losses. Some of these losses are depicted in Figure 4 for the diesel, or compression ignition (CI),
cycle.
1
2
3
4s = c
s = c
p
va b
T
sb a
5 → 1: Suction, air intake1 → 2: Adiabatic compression2 → 3: Constant volume heat addition3 → 4: Adiabatic expansion4 → 1: Constant volume heat rejection1 → 5: Exhaust to atmosphere
Otto Cycle
1
2 3
4s = c
s = c
p
va b
1
2
2’
4
v = c
v = c
T
sb a
3
3’
5 → 1: Suction, air intake1 → 2: Adiabatic compression2 → 3: Constant pressure heat addition3 → 4: Adiabatic expansion4 → 1: Constant pressure heat rejection1 → 5: Exhaust to atmosphere
Diesel Cycle
1
2’
4
v = c
v = c
3
3’
5 5 5 5
Figure 3: Ideal air-standard Otto and diesel cycles
10
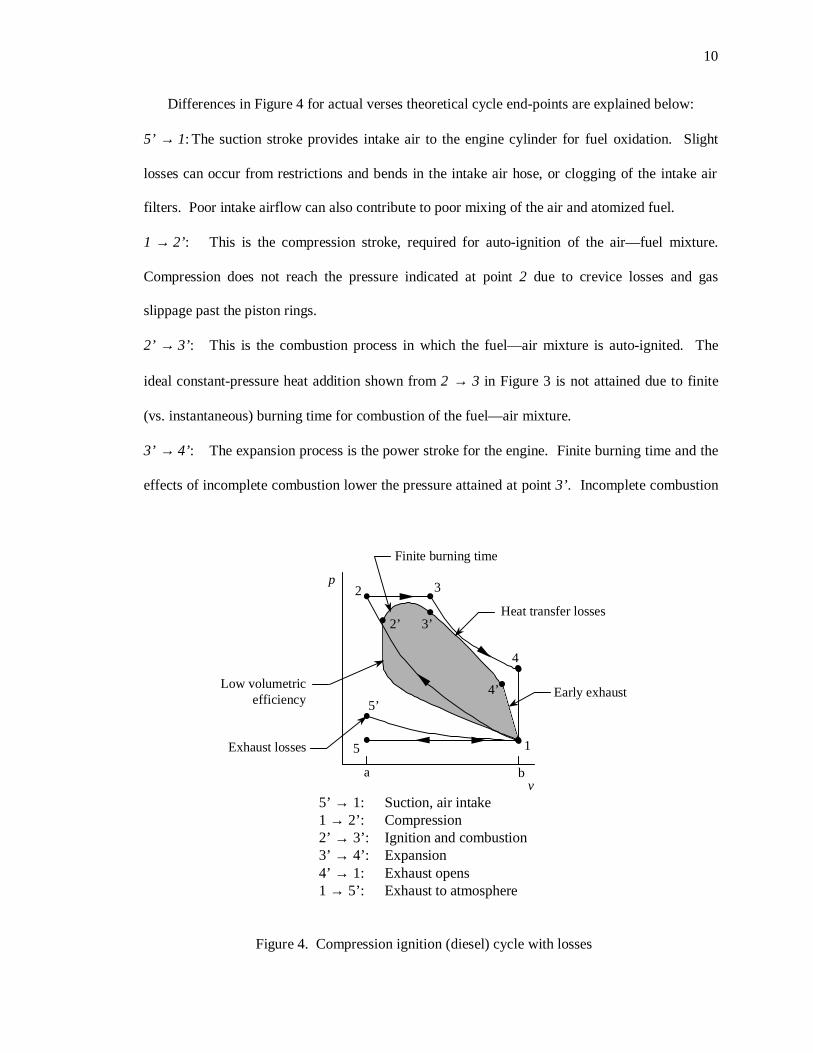
Differences in Figure 4 for actual verses theoretical cycle end-points are explained below:
5’ → 1: The suction stroke provides intake air to the engine cylinder for fuel oxidation. Slight
losses can occur from restrictions and bends in the intake air hose, or clogging of the intake air
filters. Poor intake airflow can also contribute to poor mixing of the air and atomized fuel.
1 → 2’: This is the compression stroke, required for auto-ignition of the air—fuel mixture.
Compression does not reach the pressure indicated at point 2 due to crevice losses and gas
slippage past the piston rings.
2’ → 3’: This is the combustion process in which the fuel—air mixture is auto-ignited. The
ideal constant-pressure heat addition shown from 2 → 3 in Figure 3 is not attained due to finite
(vs. instantaneous) burning time for combustion of the fuel—air mixture.
3’ → 4’: The expansion process is the power stroke for the engine. Finite burning time and the
effects of incomplete combustion lower the pressure attained at point 3’. Incomplete combustion
1
2 3
4
p
va b
5
5’ → 1: Suction, air intake1 → 2’: Compression2’ → 3’: Ignition and combustion3’ → 4’: Expansion4’ → 1: Exhaust opens1 → 5’: Exhaust to atmosphere
Heat transfer losses
Low volumetricefficiency
Finite burning time
Early exhaust
2’ 3’
4’5’
Exhaust losses
Figure 4. Compression ignition (diesel) cycle with losses
11
is a large source of losses in a CI engine, since combustion often continues during up to half of
the expansion stroke . Heat transfer to the cylinder wall removes heat from the combustion gases,
lowering the thermal efficiency.
4’ → 1: The exhaust valves are required to open slightly before bottom-dead center (BDC) to
allow sufficient time to remove all combustion by-products from the cylinder. Due to this early
opening of the exhaust valves, the power stroke is complete at a lower pressure of point 4’ than
ideal, shown by point 4.
1→ 5’ : Exhaust system back-pressure is the primary source of losses during exhaust. Engine
power is consumed to overcome the pressure drop in the exhaust system to expel combustion
products from the engine cylinder.
Spark Ignition Engines
SI automobile engines use higher-volatile gasoline as fuel and operate with compression
ratios of 6:1 to 12:1, limited on the upper end by the tendency for the volatile fuels to cause
“knocking.” An ignition source such as a spark plug is required to initiate combustion.
Compression pressures range from approximately 1000 kPa to 2000 kPa. Load and speed of the
engine are controlled by throttling the fuel charge added. Several advantages include a low cost
and relative weight, low starter cranking energy required, large range of speed and load, relatively
high mechanical efficiency, and low specific fuel consumption. The primary disadvantages
include a lower thermodynamic efficiency and high levels of air pollutant emissions across all
load levels.
Compression Ignition Engines
CI engines use fuels of lower volatility, with compression ratios from 11:1 to 22:1 and
compression pressures between approximately 2700 and 4800 kPa. As the name implies, the high
compression pressures of the CI engine ignite the fuel/air mixture, so no ignition source (e.g.,
spark plug) is required. Advantages of the CI engine over the SI engine include a lower specific
12
fuel consumption, slightly higher thermal efficiency, relatively cheaper fuel costs, lower CO and
hydrocarbon emissions at low and medium loads, lower capital costs, and higher durability.
Disadvantages include higher noise of operation, higher engine weight required to withstand the
higher pressures, and excess oxygen in the exhaust preventing use of standard catalysts for air
pollutant control.
CI engines can be characterized by the injection type—either direct injection (DI) or indirect
ignition (IDI). The Detroit Diesel 4-71N test engine is DI, implying that the fuel is injected
directly into the combustion cylinder to mix with the intake air. IDI engines mix the fuel and air
prior to entering the combustion cylinder in an attempt to improve mixing and therefore
combustion. CI engines can additionally be characterized by the number of strokes required per
power cycle, discussed below.
ICE Mechanical Cycles
Reciprocating internal combustion engines (both spark ignition and compression ignition) can
be broadly characterized as four-stroke or two-stroke, depending on the number of piston strokes
required for one power cycle. While the subject engine is a two-stroke compression ignition
engine, it is worthwhile to describe both cycles and the inherent differences.
Four-Stroke Engine Cycle
The four-stroke engine cycle requires four piston strokes for one power cycle, which occurs
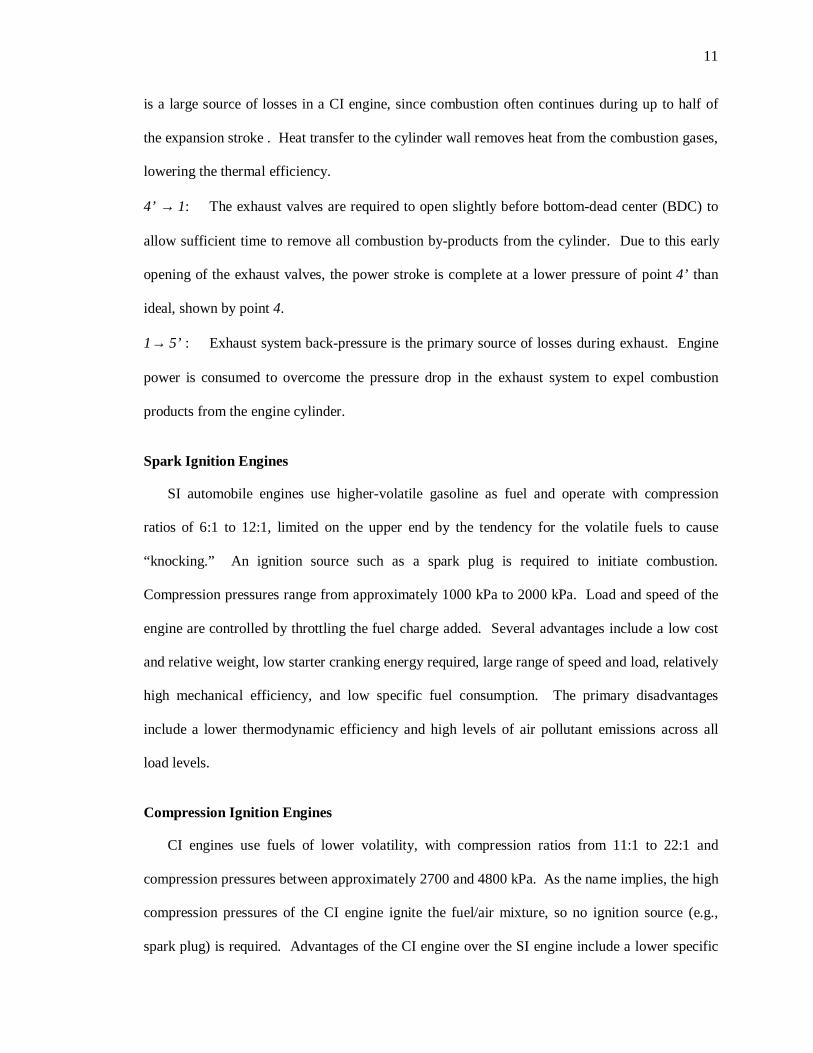
with every two revolutions of the crankshaft. The step-by-step power cycle for a four-stroke ICE
is shown in Figure 5. The power cycle shown is divided into intake, compression, expansion, and
exhaust cycles, corresponding to steps 5 → 1, 1 → 2, 3→ 4, and 5 → 1, respectively, from the
Otto cycle in Figure 3.
The inlet valve opens, allowing intake air in to the cylinder, to begin the four-stroke power
cycle. The piston is moving down in the cylinder and the exhaust valve is closed. As the piston
passes BDC, the inlet valve closes and the compression stroke begins. Please note Figure 5
13
depicts a spark ignition four-stroke cycle. A spark plug is shown applying a spark in the cylinder
near the completion of the compression stroke at TDC. As mentioned earlier, spark-ignition
engines require an ignition source to initiate combustion of the fuel—air mixture. A four-stroke
compression ignition engine is fundamentally identical except for the lack of a spark plug, and
more robust to withstand higher compression ratios.
The expansion stroke produces mechanical power from the expanding combustion gas. The
inlet and exhaust valves remain closed during the compression and expansion strokes. After the
piston passes BDC, the exhaust valve opens and the piston is used to drive out the combustion
gas byproducts from the cylinder. This piston clearing of exhaust gases is the fundamental
difference between four-stroke and two-stoke engine cycles, which are discussed next.
Two-Stroke Engine Cycle
The two-stroke engine power cycle only requires two piston strokes, or one revolution of the
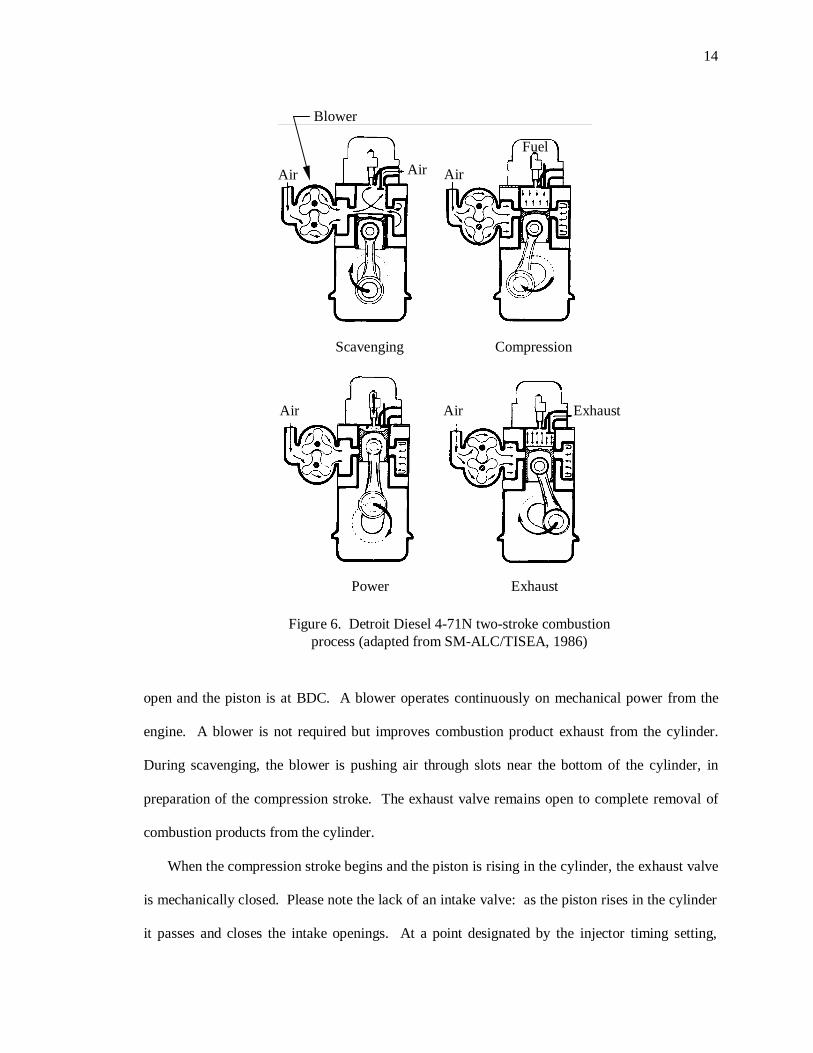
crankshaft. The two-stroke combustion process for the Detroit Diesel 4-71N engine, used in this
study, is shown in Figure 6. During the scavenging process shown Figure 6, the exhaust valve is
Intake Compression Expansion (Power) Exhaust
Open Open
Intakeair
Exhaustgases
Closed
Spark
ClosedClosedClosed ClosedClosed
Figure 5: Four-stroke spark-ignition ICE cycle
14
open and the piston is at BDC. A blower operates continuously on mechanical power from the
engine. A blower is not required but improves combustion product exhaust from the cylinder.
During scavenging, the blower is pushing air through slots near the bottom of the cylinder, in
preparation of the compression stroke. The exhaust valve remains open to complete removal of
combustion products from the cylinder.
When the compression stroke begins and the piston is rising in the cylinder, the exhaust valve
is mechanically closed. Please note the lack of an intake valve: as the piston rises in the cylinder
it passes and closes the intake openings. At a point designated by the injector timing setting,
Scavenging Compression
Power Exhaust
Air Air Air
Air Air Exhaust
Blower
Fuel
Figure 6. Detroit Diesel 4-71N two-stroke combustionprocess (adapted from SM-ALC/TISEA, 1986)
15
atomized fuel is added to the compressing air by the fuel injector. The process is approaching the
thermodynamic point 2’ in Figure 4.
When the piston reaches TDC, the fuel—air mixture is fully compressed and the mixture is
auto-ignited, corresponding to step 2’ → 3’ in Figure 4. The expansion (power) stroke begins, in
which the expanding gas is pushing the piston down the cylinder, generating mechanical energy
that is transferred to the crankshaft. The expansion (power) stroke occurs in step 2’ → 3’ in
Figure 4.
As the piston approaches BDC, it passes the intake slots in the bottom of the cylinder,
opening the cylinder to intake air. The exhaust valve is also mechanically opened. Burned bas
by-products are displaced through the exhaust valve by blower-forced intake air. The piston
passes BDC and the scavenging process begins, repeating the power cycle. Note in Figure 6that
the crankshaft makes only one revolution per power cycle. Recall Figure 5 depicted two
revolutions and four strokes of the piston for a single power cycle.
Fuel/Air Mixtures
For practical applications combustion air can be approximated as 21% oxygen (O2) and 79%
atmospheric nitrogen (N2). Thus, for each mole of O2 in air there are 76.321.0
79.0 = moles of N2.
The fuel/air equivalence ratio, φ, is defined as the ratio of actual fuel/air mass ratio, (F/A)actual, to
the stoichiometric fuel/air ratio, (F/A)s:
s
actual
AF
AF
)/(
)/(=φ (3)
For φ = 1, combustion is stoichiometric, for φ < 1, combustion is fuel-lean (excess air is used in
combustion), and for φ > 1, combustion is fuel-rich. Diesel engines operate significantly fuel-
lean, with typical values of φ = 0.8. F/A is usually expressed on a mass basis as kg fuel per kg
16
air, but a molar basis can also by used, kmol fuel per kmol air. The simplified combustion
equation for a hydrocarbon fuel CxHy can be represented as
2222222 76.3)()3.76( aNfOeHgOdHcCObCONOaHC yx +++++→++ . (4)
For stoichiometric and fuel-lean conditions, φ ≤ 1, Equation (4) becomes
222222 76.3)()3.76( aNfOgOdHbCONOaHC yx +++→++ , (5)
while for fuel-rich conditions, φ > 1, Equation (4) becomes
222222 76.3)()3.76( aNeHgOdHcCObCONOaHC yx ++++→++ , (6)
where
φ4y
xa
+= (7)
Equations (4) through (6) are expressed for 1 kmol of fuel. Examining Equation (5) we see
the coefficients for CO and H2, products of incomplete combustion, are zero, since the equation
represents the fuel-lean combustion case with excess air present to ensure complete combustion.
The presence of O2 as a product in Equation (5) further represents the excess air present in
combustion of the fuel. Additionally, for the case of φ = 1, Equation (5) simplifies to
stoichiometric combustion without O2 present as a product. Similarly, the inclusion of CO and H2
as products of incomplete combustion in Equation (6) demonstrates that fuel-rich combustion is
represented, in which insufficient oxygen is present to drive the reaction to completion.
Since compression ignition engines, the subject of our study, operate with typical equivalence
ratios of 0.8 (φ = 0.8), we will evaluate Equation (5). For φ ≤ 1, C, H, and O-atom balances on
Equation (5) yield:
xb = (8)
0=c (9)
2
yd = (10)
17
0=e (11)
( )ayxf φ
φφ −=
+
−= 14
1(12)
These coefficients are used to balance the combustion equation for a first law of thermodynamics
analysis of the reacting combustion system.
First Law of Thermodynamics Analysis
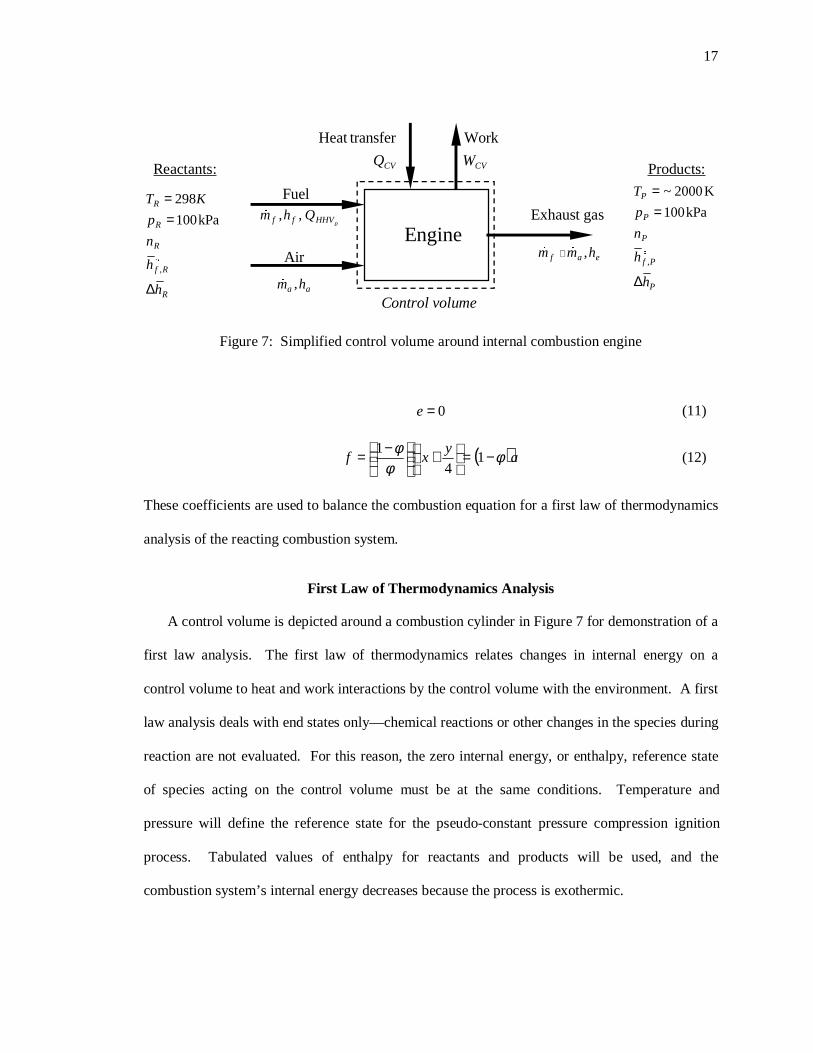
A control volume is depicted around a combustion cylinder in Figure 7 for demonstration of a
first law analysis. The first law of thermodynamics relates changes in internal energy on a
control volume to heat and work interactions by the control volume with the environment. A first
law analysis deals with end states only—chemical reactions or other changes in the species during
reaction are not evaluated. For this reason, the zero internal energy, or enthalpy, reference state
of species acting on the control volume must be at the same conditions. Temperature and
pressure will define the reference state for the pseudo-constant pressure compression ignition
process. Tabulated values of enthalpy for reactants and products will be used, and the
combustion system’s internal energy decreases because the process is exothermic.
Control volume
Engine
Fuel
Air
Exhaust gaspHHVff Qhm ,,�
aa hm ,�
Products:Reactants:
P
Pf
P
P
P
h
h
n
p
T
∆
==
$
,
kPa100
K2000~
eaf hmm ,�� +
R
Rf
R
R
R
h
h
n
p
KT
∆
==
$
,
kPa100
298
CVQ
transferHeat
CVW
Work
Figure 7: Simplified control volume around internal combustion engine
18
Figure 7 shows fuel and air entering the control volume with enthalpies of hf and ha, and mass
flow rates of fm� and am� , respectively. Exhaust gas leaves the control volume with enthalpy he
and mass flow rate of af mm �� + . Enthalpies of formation for reactants are balanced with the
change in enthalpy of products in the form
∑∑ +=+P
jjCVR
iiCV hnWhnQ (13)
where QCV is heat transfer from the control volume, WCV is shaft or other work done by the
control volume, and summations are of n moles and h enthalpies of reactants and products.
Enthalpies are evaluated at reactant and product temperatures, TR and TP. Moles of reactant and
product species, nR and nP, are described by the governing combustion equation, such as Equation
(5). Equation (13) can be used to find the heat transfer from the control volume given the flame
temperature, or the flame temperature can be estimated using an iterative process demonstrated in
Chapter 5.
Engine
Fuel
Coolingwater
Exhaust
Coolingwater
AirShaft work
Lubricatingoil
Lubricatingoil
Wallradiation
Control volume
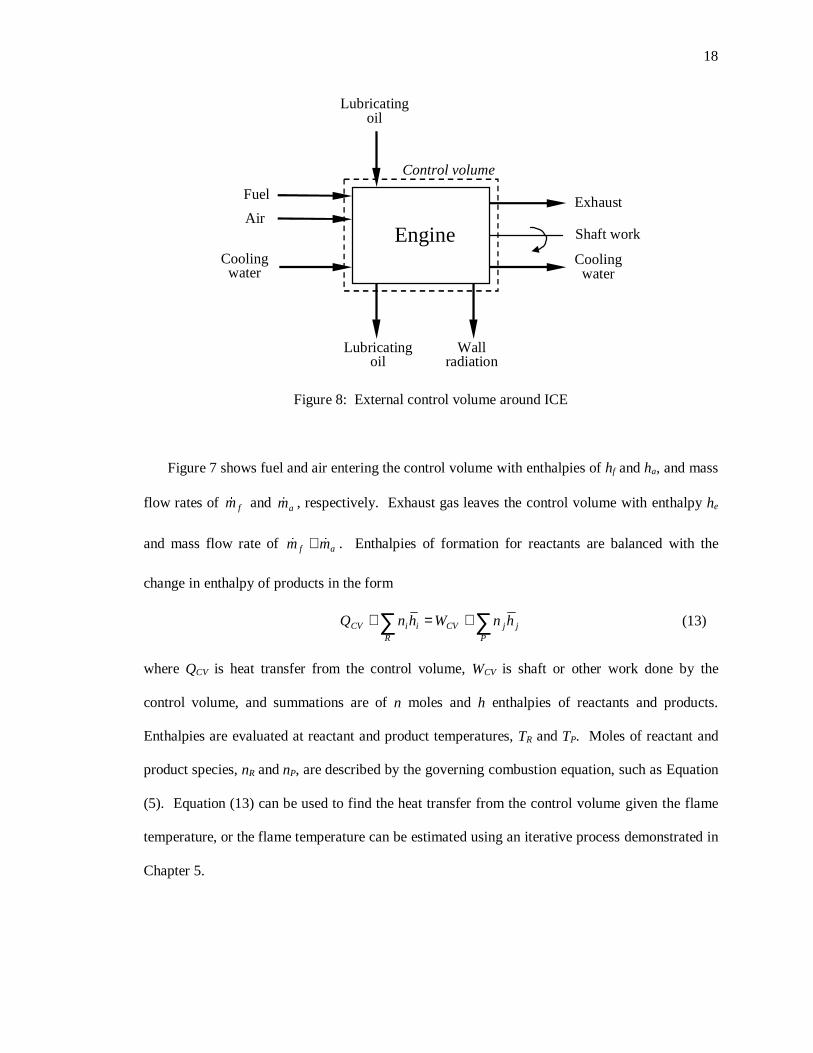
Figure 8: External control volume around ICE
19
The control volume can be expanded to include losses from the internal combustion engine.
Figure 8 depicts a control volume around an ICE including heat inputs and losses, and shaft work.
The heat input to an ICE comes from the heat value of the fuel combusted, cooling water inlet
temperature, and lubricating oil inlet temperature. Energy leaves the control volume of the ICE
in the form of heated lubricating oil and cooling water, shaft work, exhaust gases, and radiative
heat transfer to the crankcase and cylinder. Other losses can include incomplete combustion,
blowdown, and pumping. Blowdown occurs during the heat addition process: as the fuel—air
mixture ignites and begins expanding, gases can slip past the cylinder rings into the crankcase.
Pumping losses are incurred through power used to pump the lubricating oil and cooling water.
Heat transfer modes and effects in ICEs are discussed in the following sections.
Heat Transfer Effects in ICEs
Conduction, convection, and radiant heat transfer are significant to the design, operation, and
T
Cyl
inde
r ce
nte
rlin
e
RADCONV qq ′′+′′
Gas Coolant
CONDq′′
2
b x
CONVq ′′Tcool
Tw, cool
Tw, gas
tw
Tgas
0
ε ,hc, gas
hc, cool
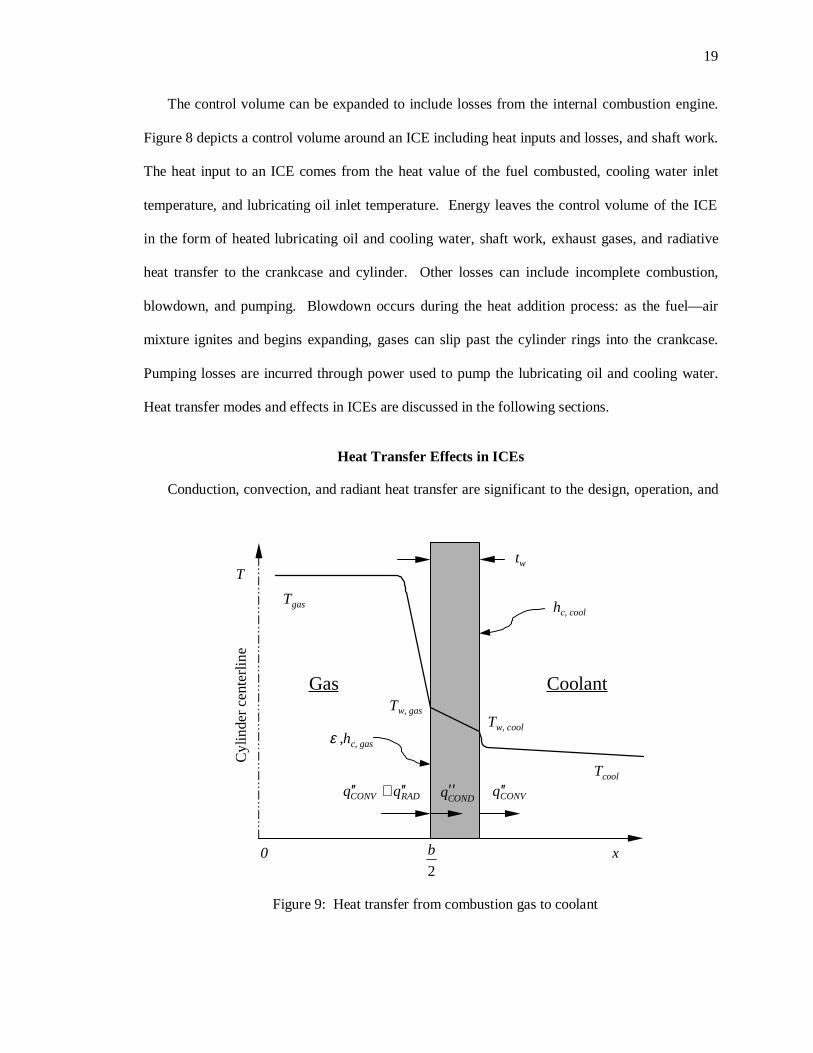
Figure 9: Heat transfer from combustion gas to coolant
20
evaluation of internal combustion engines. Figure 9 depicts the gas and coolant temperature
versus distance from the combustion cylinder centerline in an ICE. Temperature, T, is plotted on
the y-axis, which corresponds with the combustion cylinder centerline at x = 0. The temperature
of the gas in the cylinder falls as it approaches the inner wall of the cylinder, at 2
b, where b is the
cylinder bore. Both convective heat flux, CONVq ′′ , and radiative heat flux, RADq ′′ , occur between
the combustion products and the inner cylinder wall. The gas-side convective heat transfer
coefficient, hc,gas, and the emissivity, ε, at the inner cylinder wall are needed to calculate CONVq ′′
and RADq ′′ . Heat is then conducted through the cylinder wall, shown as CONDq ′′ , with cylinder wall
thickness tw. Temperature through the cylinder wall is reduced from Tw,gas on the gas side to Tw,cool
on the coolant side. Temperature drops through the thermal boundary layer on the coolant side
near the cylinder wall, as governed by the convective heat transfer coefficient, hc,cool, between the
coolant and outer cylinder wall. The individual modes of heat transfer, governing equations, and
relevant effects on ICEs are discussed below.
Conduction
Conduction heat transfer refers to the transfer of heat by molecular motion and interaction in
solids and non-moving fluids. Heat flux )(q ′′ is governed by the well-known Fourier’s Law for
steady heat conduction,
TkqCOND ∇−=′′ (14)
where k is the thermal conductivity, W/m⋅K, and ∇T is the gradient of temperature, defined as
222
222
z
T
y
T
x
T
∂∂+
∂∂+
∂∂ . In addition to conduction heat transfer through the cylinder wall, as shown
in Figure 9, heat is also immediately conducted from the combustion gases through the piston,
valves, and cylinder head.
21
Convection
Heat transfer by convection occurs between a fluid in motion relative to a fluid or solid
surface. For steady flow-forced convection, or convection driven by forces other than gravity, the
convective heat flux from a fluid at temperature T to a solid surface at Tw is given by
)( wcCONV TThq −=′′ (15)
where hc is the convective heat transfer coefficient, W/m2⋅K. Actual flows in the combustion
cylinder are turbulent and unsteady, and detailed analyses require the use of the conservation,
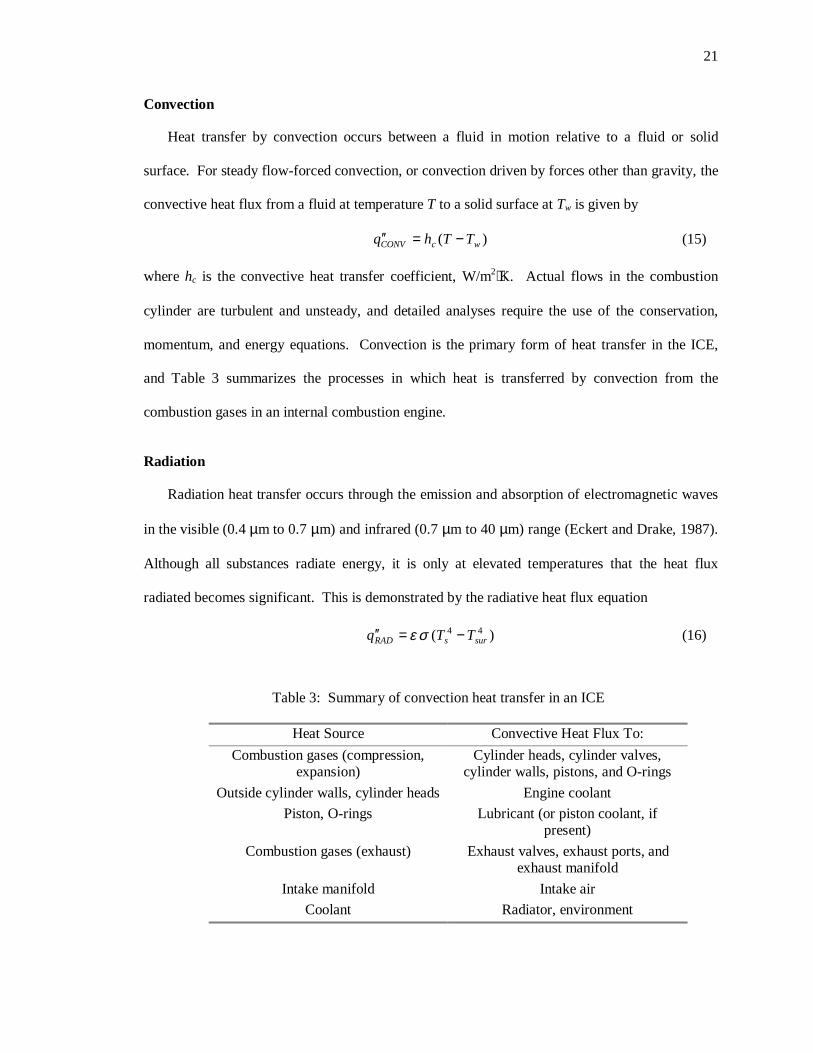
momentum, and energy equations. Convection is the primary form of heat transfer in the ICE,
and Table 3 summarizes the processes in which heat is transferred by convection from the
combustion gases in an internal combustion engine.
Radiation
Radiation heat transfer occurs through the emission and absorption of electromagnetic waves
in the visible (0.4 µm to 0.7 µm) and infrared (0.7 µm to 40 µm) range (Eckert and Drake, 1987).
Although all substances radiate energy, it is only at elevated temperatures that the heat flux
radiated becomes significant. This is demonstrated by the radiative heat flux equation
)( 44sursRAD TTq −=′′ σε (16)
Table 3: Summary of convection heat transfer in an ICE
Heat Source Convective Heat Flux To:
Combustion gases (compression,expansion)
Cylinder heads, cylinder valves,cylinder walls, pistons, and O-rings
Outside cylinder walls, cylinder heads Engine coolant
Piston, O-rings Lubricant (or piston coolant, ifpresent)
Combustion gases (exhaust) Exhaust valves, exhaust ports, andexhaust manifold
Intake manifold Intake air
Coolant Radiator, environment
22
where ε is the emissivity of the surface, σ is the Stefan-Boltzmann constant, Ts is the maximum
blackbody temperature of the surface, and Tsur is the temperature of the surrounding environment.
Shape factors are applied to account for fractions of radiation from a source interacting with the
recipient surface. In combustion engines the radiant heat sources are primarily particulate (soot),
water vapor, and CO2 (Zhou et al., 1987). This radiant heat falls on the cylinder walls, piston
surface, and valve body.
ICE radiant heat transfer is difficult to estimate and measure. Radiant heat transfer is also
more significant in diesel engines than spark ignition engines, due to higher soot content of the
diesel combustion products. High-temperature intermediate soot particles and high flame
temperatures are the source of radiant heat to the cylinder walls, piston, and combustion gases.
The radiant heat transfer due to soot depends on the particle size distribution, number density,
flame geometry, and, as shown in Equation (16), the soot temperature. Emissivity reportedly
ranges from 0.8 to 0.9 during periods of peak radiation. The average radiant heat flux reportedly
ranges from 5 to 50 percent of total heat flux, rising with increases in engine load (Kays, 1989).
The discussion here has focused on the heat transfer and thermodynamic effects of the
combustion process, but engine materials require cooling, and the design of this cooling system is
a significant aspect of overall ICE design. Kays (1989) evaluated the design of air and liquid
cooling systems for ICEs according to fundamental heat exchanger principles. He demonstrated
that engine head design, radiator manufacturing methods and costs, and coolant pumping losses
often control radiator design, verses optimal waste heat exchange from the cylinder to the coolant.
Engine Variable Effects
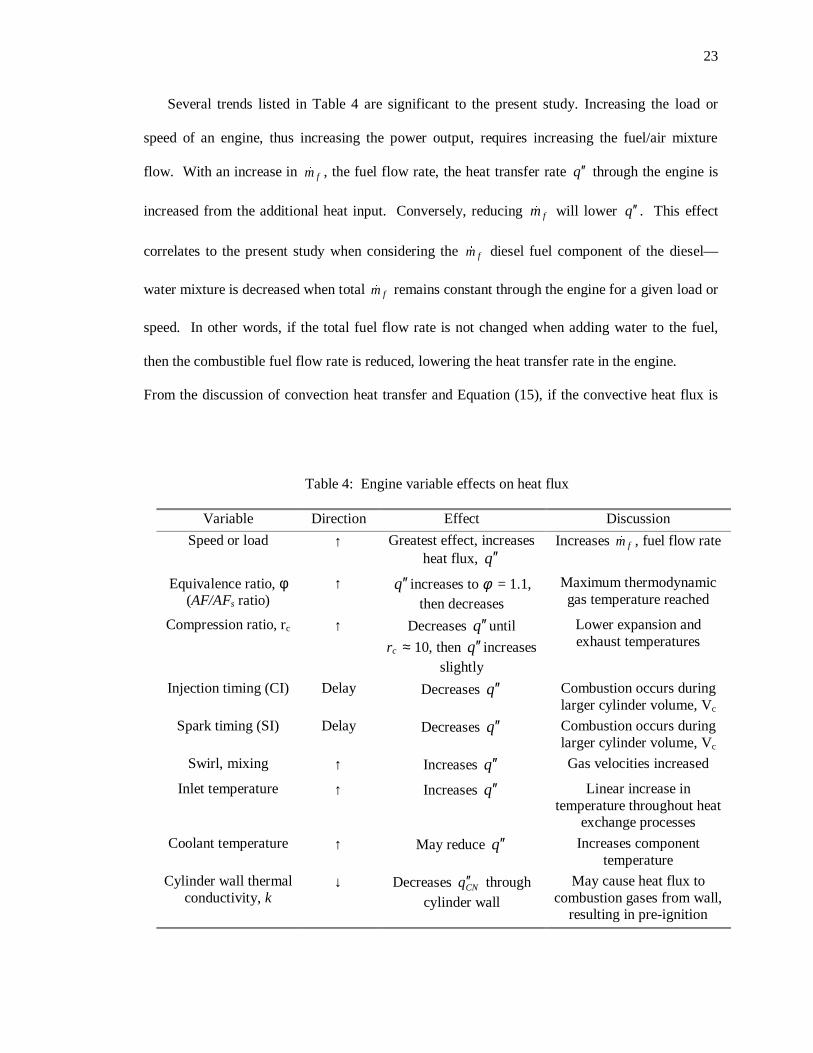
The ICE is a thermodynamic heat engine, so any changes to components, parameters, or work
per unit time will affect the heat flux through the engine to the environment. Table 4 summarizes
how changes in important engine variables affect heat flux from the combustion gases.
23
Several trends listed in Table 4 are significant to the present study. Increasing the load or
speed of an engine, thus increasing the power output, requires increasing the fuel/air mixture
flow. With an increase in fm� , the fuel flow rate, the heat transfer rate q ′′ through the engine is
increased from the additional heat input. Conversely, reducing fm� will lower q ′′ . This effect
correlates to the present study when considering the fm� diesel fuel component of the diesel—
water mixture is decreased when total fm� remains constant through the engine for a given load or
speed. In other words, if the total fuel flow rate is not changed when adding water to the fuel,
then the combustible fuel flow rate is reduced, lowering the heat transfer rate in the engine.
From the discussion of convection heat transfer and Equation (15), if the convective heat flux is
Table 4: Engine variable effects on heat flux
Variable Direction Effect Discussion
Speed or load ↑ Greatest effect, increasesheat flux, q ′′
Increases fm� , fuel flow rate
Equivalence ratio, φ(AF/AFs ratio)
↑ q ′′ increases to φ = 1.1,then decreases
Maximum thermodynamicgas temperature reached
Compression ratio, rc ↑ Decreases q ′′ until
rc ≈ 10, then q ′′ increasesslightly
Lower expansion andexhaust temperatures
Injection timing (CI) Delay Decreases q ′′ Combustion occurs duringlarger cylinder volume, Vc
Spark timing (SI) Delay Decreases q ′′ Combustion occurs duringlarger cylinder volume, Vc
Swirl, mixing ↑ Increases q ′′ Gas velocities increased
Inlet temperature ↑ Increases q ′′ Linear increase intemperature throughout heat
exchange processes
Coolant temperature ↑ May reduce q ′′ Increases componenttemperature
Cylinder wall thermalconductivity, k
↓ Decreases CNq ′′ throughcylinder wall
May cause heat flux tocombustion gases from wall,
resulting in pre-ignition
24
lowered, then the temperature difference between the combustion gases and the cylinder wall will
also be lowered. Given a constant convective heat transfer coefficient and constant coolant
temperature, we can theorize that the flame temperature will be lower to result in this lower heat
flux.
Reducing cylinder wall thermal conductivity k decreases the conductive heat transfer through
the wall. This can result in a higher inner cylinder wall temperature and lead to pre-ignition of
the fuel—air mixture. The effect is similar that of insulating the cylinder, which can improve
compression ignition engine performance when properly designed (Heywood, 1988).
Efficiency and performance gains in ICEs have been significant, and combustion
modifications and control devices have substantially reduced air pollutant emission rates.
Modeling and experimental analysis of fuel spray, atomization, and vaporization has improved
the understanding of the onset and progression of diffusion combustion in the diesel engine.
Spray formation is increasingly important as advanced swirl designs are incorporated into the
combustion chamber to improve mixing.
Researchers are also improving numerical flow simulation methods for internal combustion
processes. Some models have been under development and refinement for nearly 30 years.
Boundary value solutions to the differential equations using finite difference methods are
valuable for general solutions. Finite element analysis offers a solution to correlate predicted and
experimental results, because the three-dimensional physical constraints can be used as
boundaries for the heat transfer and momentum equation solutions (Campbell, 1979).
Fuel ignition and resultant flame quenching is another area of focus in internal combustion
engines. Research includes modeling and understanding the rates and patterns of fuel ignition,
including the spray pattern effects, and the passive or active quenching of the flame. Active
quenching of the flame is often accomplished by introducing water, alcohols, or other lower
heating value additives to the fuel, which is the premise of the present research. Passive flame
25
quenching occurs at the engine combustion chamber walls. Flame quenching causes incomplete
combustion and thus results in higher emissions of unburned hydrocarbons.
Improvements in measurement techniques are important to all aspects of ICE analysis. An
experimental study of ICEs involves temperature measurements somewhere in the combustion
process. As shown in the convective and radiant heat equations, Equations (15) and (16), the
cylinder wall temperature, Tw, is fundamental to ICE heat transfer analysis. The high combustion
temperatures can interfere with thermocouple signals, and the unsteady nature of the combustion
field makes direct measurement of radiant flame temperature difficult. Spectroscopic techniques
using optical fibers to transfer a flame image from the combustion chamber to a photoelectric
transducer can be used to measure the spectral illuminance, which is then correlated to the flame
temperature (Nagese and Funatsu, 1990).
26
CHAPTER 3
INTERNAL COMBUSTION ENGINE EMISSIONS
The review thus far has focused on the physical and thermodynamic properties of internal
combustion engines. The chemical pathways of formation, mitigation methods, and engine
factors affecting air pollutant emissions from ICEs are discussed in the present chapter. This
review is important in predicting and evaluating how the ICE air pollutant emission levels
respond to the alternative fuel.
Pollutant Formation
The air pollutant emissions from internal combustion engines vary with the operational and
design parameters discussed earlier in Chapter 2. Other factors affecting air pollutant emissions
include ignition and valve timing, fuel types and additives combusted, lubricants employed in the
engine, and exhaust gas treatments employed (Abdel-Rahman, 1998). These air pollutant
emissions can be broadly characterized as gaseous and non-gaseous emissions.
Gaseous Emissions
The major gaseous pollutants emitted include oxides of nitrogen (NOx,) and carbon monoxide
(CO). NOx refers to mixtures of nitric oxide (NO) and nitrogen dioxide (NO2). Small amounts of
sulfur dioxide (SO2), also a criteria pollutant regulated under the CAAA, are emitted. SO2
emissions from ICEs are solely a result of fuel-bound sulfur and are readily reduced by limiting
sulfur in the fuel.
27
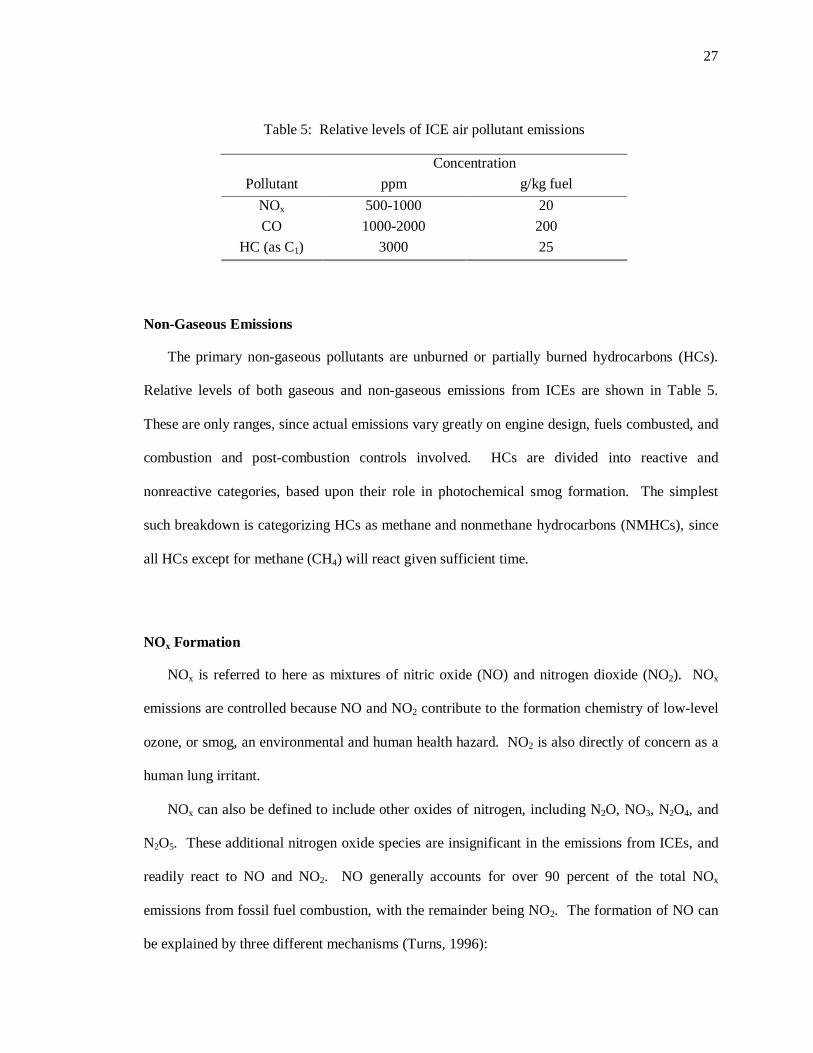
Non-Gaseous Emissions
The primary non-gaseous pollutants are unburned or partially burned hydrocarbons (HCs).
Relative levels of both gaseous and non-gaseous emissions from ICEs are shown in Table 5.
These are only ranges, since actual emissions vary greatly on engine design, fuels combusted, and
combustion and post-combustion controls involved. HCs are divided into reactive and
nonreactive categories, based upon their role in photochemical smog formation. The simplest
such breakdown is categorizing HCs as methane and nonmethane hydrocarbons (NMHCs), since
all HCs except for methane (CH4) will react given sufficient time.
NOx Formation
NOx is referred to here as mixtures of nitric oxide (NO) and nitrogen dioxide (NO2). NOx
emissions are controlled because NO and NO2 contribute to the formation chemistry of low-level
ozone, or smog, an environmental and human health hazard. NO2 is also directly of concern as a
human lung irritant.
NOx can also be defined to include other oxides of nitrogen, including N2O, NO3, N2O4, and
N2O5. These additional nitrogen oxide species are insignificant in the emissions from ICEs, and
readily react to NO and NO2. NO generally accounts for over 90 percent of the total NOx
emissions from fossil fuel combustion, with the remainder being NO2. The formation of NO can
be explained by three different mechanisms (Turns, 1996):
Table 5: Relative levels of ICE air pollutant emissions
Concentration
Pollutant ppm g/kg fuel
NOx 500-1000 20
CO 1000-2000 200
HC (as C1) 3000 25
28
1. The Extended Zeldovich mechanism, or thermal NO, in which O, OH, and N2 are in
equilibrium concentrations
2. Other mechanisms with NO formation rates above that predicted by the Extended
Zeldovich mechanism, including
a. Fenimore CN and HCN pathways
b. N2O-intermediate route
c. “Super-equilibrium” concentrations of O and OH in combination with the Extended
Zeldovich mechanism
3. Fuel nitrogen mechanism, in which fuel-bound nitrogen is oxidized to NO.
The primary pathway for NO formation is oxidation of atmospheric molecular nitrogen (N2)
through the thermal or Zeldovich mechanism:
NNONO 2 +⇔+ (17)
ONOON 2 +⇔+ (18)
Extending the thermal NO formation mechanism to include the hydroxyl radical reaction with
nitrogen was proposed by Lavoie et al (1970):
HNOOHN +⇔+ (19)
Thermal NO formation rate is slow relative to combustion and is considered unimportant below
1800 K. Thermal NO formation attributed to Equations (17) through (19) is considered formed
in the post-combustion exhaust gases.
Prompt NO, also referred to as the Fenimore mechanism, is NO that is quickly formed in the
premixed laminar flame before thermal NO has formed. Hydrocarbon radicals react with
molecular nitrogen to create hydrogen cyanide as an intermediate to NO formation in the
following steps:
NHCNNCH 2 +⇔+ (20)
HNCOOHCN +⇔+ (21)
29
CONHHNCO +⇔+ (22)
2HNHNH +⇔+ (23)
HNOOHN +⇔+ (24)
Prompt NO formation is also considered insignificant in internal combustion engines due to the
thin flame fronts, short residence times, and high pressures in the combustion chamber.
The formation of NO through an N2O intermediate mechanism is important in fuel-lean (φ <
0.8), lower temperature conditions (T < 1800 K). The three steps are:
MONMNO 22 +⇔++ (25)
NHNOONH 2 +⇔+ (26)
NO2ONO 2 ⇔+ (27)
The M in Equation (25) represents a third body collision molecule. The significance of the N2O
intermediate mechanism can be seen in Equation (27) where two moles of NO are formed per
mole of N2O. While our subject engine operates at φ = 0.8, the flame temperature is slightly
higher than 1800 K, so N2O intermediate pathway formation of NO is probably not significant.
Fuel-bound nitrogen is another source of combustion NO emissions. This process is
significant in coal combustion, where bituminous coal contains up to 2% by mass bound nitrogen.
Nitrogen in the fuel is quickly reacted to HCN or ammonia, NH3, and follows the reaction steps
beginning with Equation (21) for prompt NO formation. Kerosene and gasoline fuels contain
trace to zero quantities of nitrogen, so fuel-bound nitrogen contribution to NO formation is not
considered significant in internal combustion engines.
The final reaction mechanism considered here for NOx formation is production of NO2.
Reactions contributing to the formation and destruction of NO2 are as follows:
)(formationOH NOHONO 22 +⇔+ (28)
on)(destructiOH NOHNO2 +⇔+ (29)
on)(destructi ONOONO 22 +⇔+ (30)
30
The HO2 radicals form in low-temperature regions, leading to NO2 formation through Equation
(28). NO2 destruction via reaction with the H and O radicals are active at high temperatures
[Equations (29) and (30)]. Thus NO formation from NO2 would be preferred at high
temperatures and NO2 would only survive during low-temperature cooling of exhaust gases. This
validates the previous statement that most of the NOx emitted from internal combustion engines is
NO.
Heywood (1988) reports the following relationship for NO formation rate based upon
empirical data and the assumption of equilibrium concentrations of O, O2, OH, H, and N2, by
decoupling the NO formation from combustion (i.e., assuming NO formation in post-combustion
gases always dominates NO produced in the flame):
e2e2
-69,09016
][O][Ne106[NO]
×= T
Tdt
d(31)
where [ ]e denotes equilibrium concentrations. The significant dependence of temperature on NO
formation rate in Equation (31) is evident. Equation (31) will be used later in Chapter 5 to
calculate the relative NO formation rate from estimated flame temperature changes for
comparison with measured percent NO reductions.
CO Formation
Carbon monoxide (CO) emissions from ICEs are a concern from toxicological effects on
humans.. The formation of CO from the combustion of the hydrocarbon radical, R, is as follows:
CORCORCHORO2RRH →→→→→ (32)
Once formed, CO is slow to oxidize to CO2, with water providing the primary oxidant source
through the following steps:
OCOOCO 22 +→+ (33)
2OHOHO 2 →+ (34)
HCOOHCO 2 +→+ (35)
31
OOHOH 2 +→+ (36)
The reaction in Equation (33) is slow, with primary oxidation of CO occurring through Equation
(35), with Equation (36) producing OH radicals feeding back to Equation (35). Diatomic
hydrogen (H2) can also provide oxidation of CO through formation of HO2, but H2 is not formed
in sufficient quantities in ICE combustion to contribute to CO oxidation.
Control Technologies
Technologies to control air pollutant emissions from ICEs can be categorized as process or
post-combustion controls. Process controls include changes and improvements to the combustion
chamber, fuel/air delivery, and engine components aimed at reducing air pollutant emissions. For
example, CFD analysis and design has been used to improve and air intake valve ports to enhance
fuel—air mixing. Post-combustion controls include catalytic converters and other technologies
applied to react with combustion exhaust constituents including NOx, CO, HCs, and particulate.
Combustion Modifications
Exhaust gas recirculation (EGR) is commonly employed to reburn combustion by-products,
especially CO and particulate. EGR also dilutes the intake air oxygen concentration, increasing
the heat capacity of the combustion products per unit of heat release, lowering the combustion
flame temperature (Turns, 1996). Larsen et al. (1996) reported 50% NOx reduction at 20% EGR,
but CO emissions doubled and fuel economy decreased 8%. Exhaust gas recirculated on diesel
engines must be well-filtered to prevent fuel sulfur and exhaust particulate from eroding and
corroding engine intake valves, cylinders, and pistons.
Adjusting fuel injection timing is an effective method for decreasing NOx emissions.
Traditional practice is to delay fuel injection into the combustion chamber to lower the final
flame temperature, but this generally results in higher unburned hydrocarbon emissions.
Yanagihara (1997) demonstrated reduced NOx production by shortening the injection duration
32
while advancing the fuel injection. His results are attributed to improved fuel—air mixing prior
to combustion, which both improves combustion efficiency and reduces unburned hydrocarbons.
Selective and Non-Selective Catalytic Reduction
Selective catalytic reduction (SCR) involves the use of a catalyst generally requiring an
additive, such as ammonia, to initiate NOx reduction chemistry. A common application of SCR
in internal combustion engines is the Pt, Rh, and Pd three-way catalytic converters used on spark
ignition engines combusting gasoline. Unburned hydrocarbons act as the selective reducing agent
for the catalysts. Non-selective catalytic reduction (NSCR) also involves the use of a catalyst but
without the need for an additive to reduce NOx. The application of SCR or NSCR catalysts in a
diesel exhaust is severely complicated (1) primarily by the higher excess oxygen content of diesel
exhaust, resulting in a net oxidizing environment, and (2) by the presence of sulfur in diesel fuel
and resulting catalyst poisoning by sulfur dioxide in the exhaust gases. Significant research is
ongoing using secondary injection of small quantities of fuel in the exhaust stream to act as the
reducing agent, with demonstrated NOx reductions of approximately 45 percent at reasonable
space velocities and high fuel metering rates (Nakatsuji et al., 1998).
Water Injection
Four major approaches for introducing water into the combustion zone have been reported in
the literature:
1. Fumigating the water into the engine intake air
2. Direct injection into the engine through separate injectors
3. In-line mixing of water and fuel prior to injection (unstabilized emulsion)
4. Mixtures of stabilized emulsions treatable as a single-phase drop-in replacement fuel
Urbach et al. (1997) demonstrates water mist injection into the bell housing of diesel-fueled
turbine engines with promising results. Water mist introduced to the intake of reciprocating
compression ignition ICEs, particularly two-stroke engines with the intake air passing through the
33
crankcase, poses significant corrosion potential. Separate water injecting valves in the engine
avoids intake system contact with the mist (Yoshihara et al., 1996). Several authors have
evaluated all or most of the options for introducing water into the combustion process and have
primarily determined that water-in-fuel emulsions, stabilized or unstabilized, are most effective in
reducing NOx, BSFC, and result in lower increases of CO and UHC emissions (O’Neal et al.,
1981; Greeves et al., 1976).
An emulsion is defined as a mixture of two or more generally insoluble liquids. A permanent
emulsion exists when sufficient droplet sizes have been reached to prevent the separation of the
insoluble materials. Unstabilized emulsions are generated through the high-speed, high-shearing
of particles and solids in a liquid. A limiting concern with emulsions is the high capital costs of
emulsification mixers and pumps, which are used extensively in the food and agriculture
industries.
Unstabilized emulsions require high shear to suspend small droplets of water in the fuel
(Greeves et al., 1976). An advantage of unstabilized emulsions are reduced fuel costs, due to lack
of additives needed, and reduced emissions from not combusting surfactants or other emulsifying
agents (De Vita, 1989). Ulrich and Kessler (1992) propose a complex fueling system including a
vortex chamber to provide in-line mixing of water and diesel fuel without requiring the addition
of an emulsifying agent. Diesel fuel pumps, including the unit on our Detroit Diesel 4-71 engine,
operate at high volume and high pressure, with a recirculation loop back to the fuel tank. This
serves several purposes:
1. A high-volume pump can create the high-pressure needed for the fuel injectors at less
expense
2. Recirculating warms the fuel and helps resist gelling at low temperatures
3. The warmed fuel improves combustion
All of these factors contribute to the effectiveness of an in-line fuel—water emulsifying system,
assuming that retrofitting the fuel system is acceptable.
34
Stabilized emulsions use an emulsifying agent to suspend the water in the fuel and reduce the
energy required for a permanent emulsion. The Air Force preferred a drop-in replacement fuel,
without the requirement for modifying the engines or fueling system. The current research thus
uses a surfactant to create a permanent, stabilized emulsion that can be treated as a single-phase
fuel.
A drawback to water—fuel emulsions is the amount of air bubbles reportedly contained in the
emulsion mixture. Sawa and Kajitani (1992) evaluated the effect of water—fuel emulsions on
diesel engine performance and emissions under transient conditions. They conclude that air
bubbles in the fuel and its variability contributes to fluctuation in the injection timing and a
poorer performance under transient conditions. They recommend removal of bubbles from the
water—fuel emulsion.
Research has also been conducted extensively on the use of additives to improve the
lubrication, reduce the corrosive effect of water in the fuel, and improve the emulsion stability.
Nitrate-containing ignition improvers are recommended to reduce exhaust emissions (Schwab,
1997). Lubricity additives composed of dimer or trimer acides, phosphate esters, sulfurized
castor oils are recommended by Peter-Hoblyn et al. (1998), and catalysts can also be used in situ
in the fuel to reduce NOx (Peter-Hoblyn et al., 1996). In addition to providing lubrication
improvement, additives to water—fuel emulsions can be employed for antifreeze characteristics
(Marelli, 1995), obviously important when significant volume percents of water are present in a
fueling system in freezing climates. Montagne et al. (1987) demonstrated that surfactants added
to diesel fuels can both clean up fuel injectors and prevent further injector deposits. They also
reported a slight increase in NOx from the combustion of the surfactants, as we will experience
without also adding water to the fuel.
Crookes et al. (1990) attributes water—fuel emulsions with improved combustion and lower
particulate and NOx emissions to the secondary atomization of the water, often designated as
microexplosions. Yoshimoto et al. (1989) extensively examined the microexplosions of
35
emulsified fuels and determined that there is a minimum percent water content in the emulsion
required for microexplosions to occur, and that the percent increases with the kinematic viscosity
of the fuel.
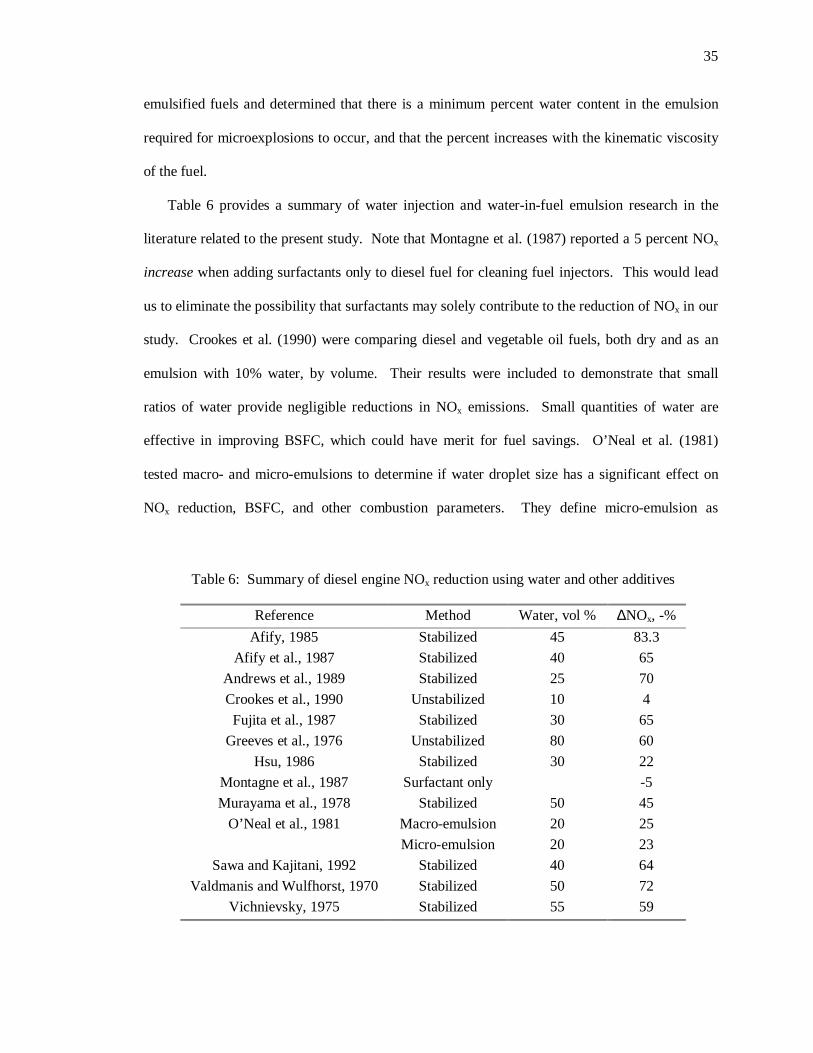
Table 6 provides a summary of water injection and water-in-fuel emulsion research in the
literature related to the present study. Note that Montagne et al. (1987) reported a 5 percent NOx
increase when adding surfactants only to diesel fuel for cleaning fuel injectors. This would lead
us to eliminate the possibility that surfactants may solely contribute to the reduction of NOx in our
study. Crookes et al. (1990) were comparing diesel and vegetable oil fuels, both dry and as an
emulsion with 10% water, by volume. Their results were included to demonstrate that small
ratios of water provide negligible reductions in NOx emissions. Small quantities of water are
effective in improving BSFC, which could have merit for fuel savings. O’Neal et al. (1981)
tested macro- and micro-emulsions to determine if water droplet size has a significant effect on
NOx reduction, BSFC, and other combustion parameters. They define micro-emulsion as
Table 6: Summary of diesel engine NOx reduction using water and other additives
Reference Method Water, vol % ∆NOx, -%
Afify, 1985 Stabilized 45 83.3
Afify et al., 1987 Stabilized 40 65
Andrews et al., 1989 Stabilized 25 70
Crookes et al., 1990 Unstabilized 10 4
Fujita et al., 1987 Stabilized 30 65
Greeves et al., 1976 Unstabilized 80 60
Hsu, 1986 Stabilized 30 22
Montagne et al., 1987 Surfactant only -5
Murayama et al., 1978 Stabilized 50 45
O’Neal et al., 1981 Macro-emulsion 20 25
Micro-emulsion 20 23
Sawa and Kajitani, 1992 Stabilized 40 64
Valdmanis and Wulfhorst, 1970 Stabilized 50 72
Vichnievsky, 1975 Stabilized 55 59
36
emulsions with water droplet sizes smaller than the wavelength of visible light, approximately
555 nm, whereas macro-emulsions are characterized with water droplet sizes larger than the
wavelength of visible light. Thus, micro-emulsions are reported to visually appear clear, while
macro-emulsions appear cloudy. Our fuel mixture would be characterized in this manner as a
macro-emulsion. As shown in Table 6, the reported NOx reductions were 25 and 23 percent for
macro- and micro-emulsions, respectively. They reported significantly-higher (unspecified)
ratios of surfactant were required to establish a micro-emulsion, although they reported longer
stability lifetime for the micro-emulsion. From our experience and the reports of O’Neal et al.
(1981) we feel justified in using the minimum surfactant required to establish a stable macro-
emulsion.
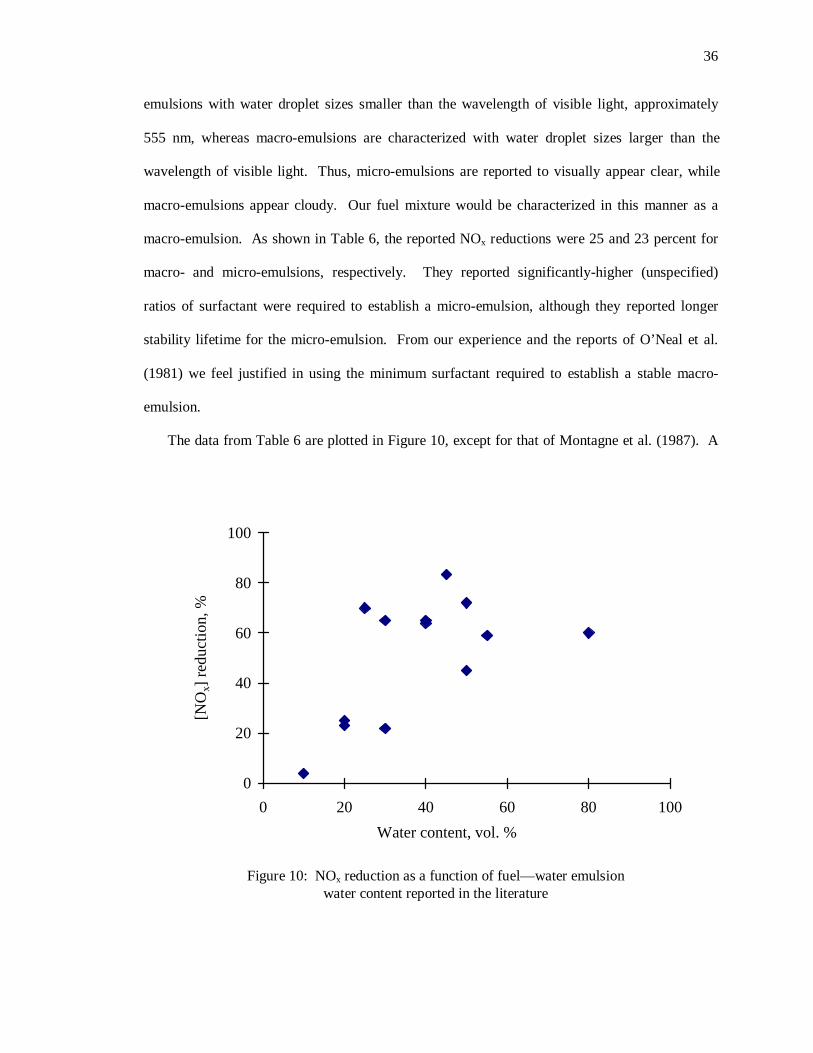
The data from Table 6 are plotted in Figure 10, except for that of Montagne et al. (1987). A
0
20
40
60
80
100
0 20 40 60 80 100
Water content, vol. %
[NO
x] r
ed
uct
ion
, %
Figure 10: NOx reduction as a function of fuel—water emulsionwater content reported in the literature
37
trend is visible for reduced NOx emissions with increased water content in the fuel. As shown in
Table 6, this data represents 11 independent research programs conducted across a span of 22
years.
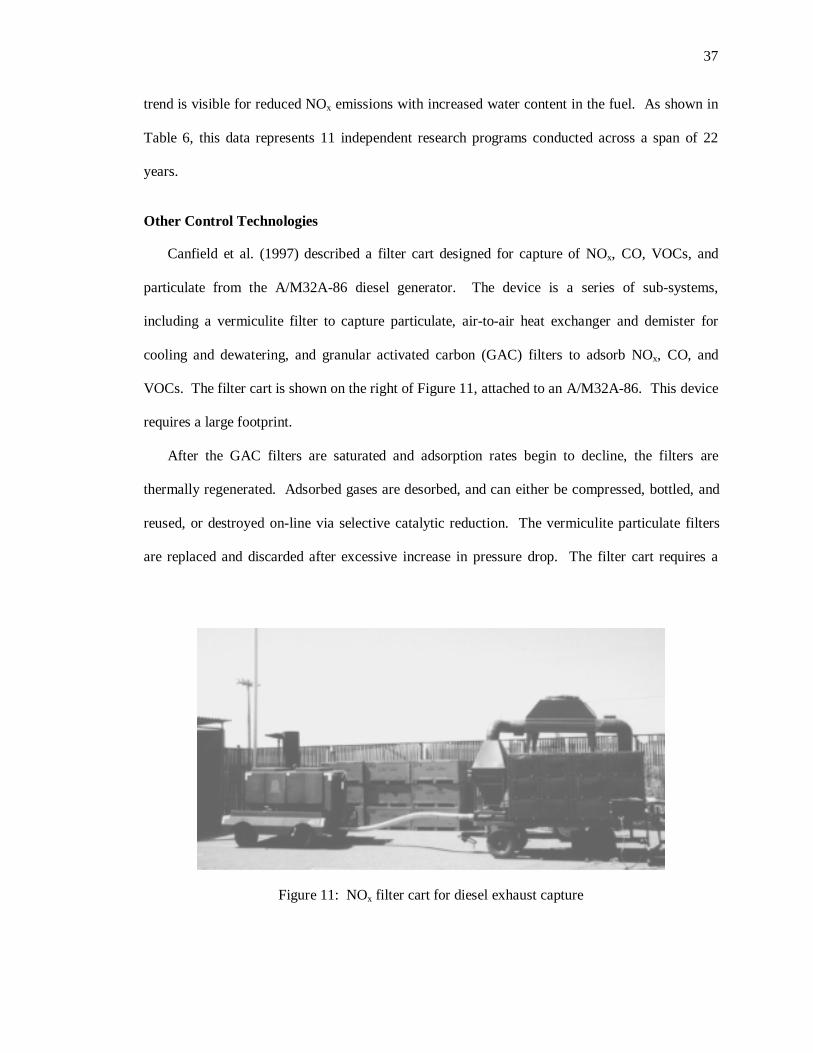
Other Control Technologies
Canfield et al. (1997) described a filter cart designed for capture of NOx, CO, VOCs, and
particulate from the A/M32A-86 diesel generator. The device is a series of sub-systems,
including a vermiculite filter to capture particulate, air-to-air heat exchanger and demister for
cooling and dewatering, and granular activated carbon (GAC) filters to adsorb NOx, CO, and
VOCs. The filter cart is shown on the right of Figure 11, attached to an A/M32A-86. This device
requires a large footprint.
After the GAC filters are saturated and adsorption rates begin to decline, the filters are
thermally regenerated. Adsorbed gases are desorbed, and can either be compressed, bottled, and
reused, or destroyed on-line via selective catalytic reduction. The vermiculite particulate filters
are replaced and discarded after excessive increase in pressure drop. The filter cart requires a
Figure 11: NOx filter cart for diesel exhaust capture
38
large footprint and would not be feasible to mobilize to a war-fighting theatre. Advantages
include that one filter cart can service multiple generators, depending on the capacity of the filter
cart, and it can be used to control emissions from other combustion sources.
Nonthermal plasmas have also been applied to diesel exhaust, and specifically applied to
reduce NOx emissions from the A/M32A-86 (Ackridge et al., 1997; Rolader et al., 1997; Federle
et al., 1998). This application also required the use of a series of subsystems, including a ceramic
particulate filter, nonthermal plasma discharge (NTPD) reactor tube with alcohol injection, and a
wet gas scrubber. The particulate filter captures particulate and would be cleaned in-line using
the hot exhaust gases. The NTPD essentially uses high-voltage, low amperage, high-pulse rate
electrical discharges to generate reactive, oxidative species in the exhaust gases. The addition of
alcohols is reported to increase the reaction efficiency, lowering electron volts required to oxidize
NO to NO2. The wet scrubber is then used to adsorb and react the NO2 with water to form nitric
acid, HNO3, and then with sodium hydroxide, NaOH, to form sodium nitrate, NaNO3, useful as a
fertilizer. This system would also require a large footprint.
39
CHAPTER 4
EXPERIMENTAL METHODS AND PROCEDURES
A/M32A-86 Parameters
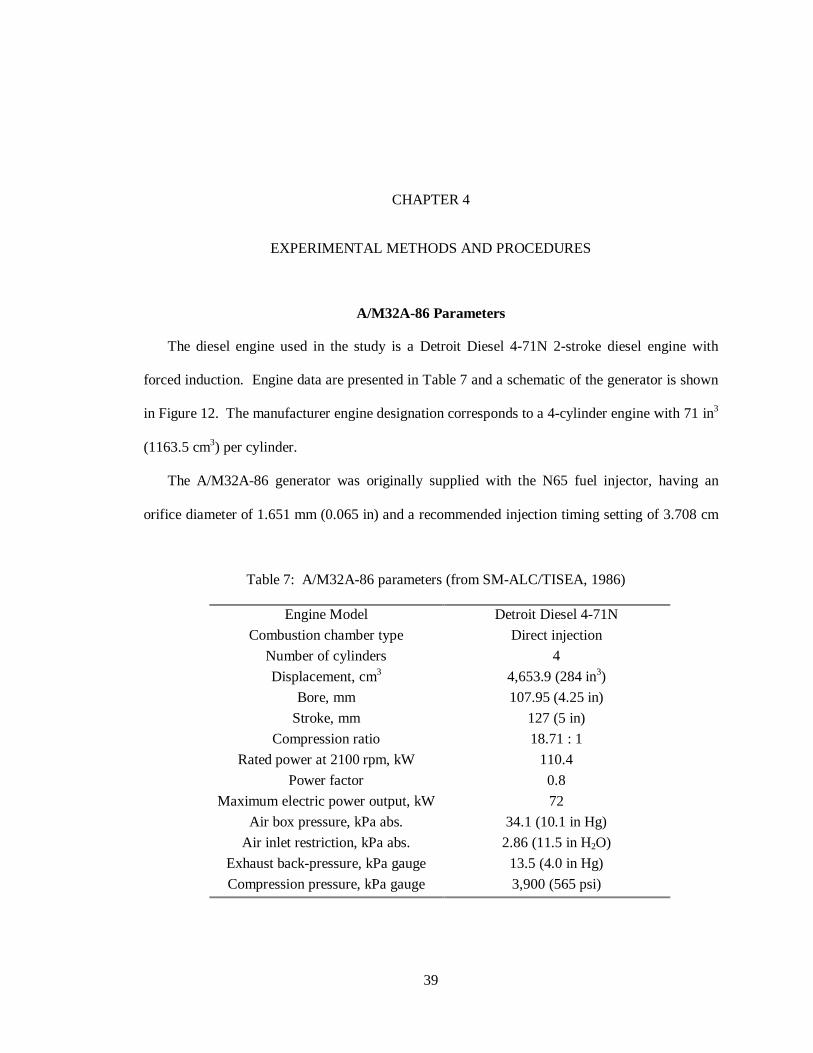
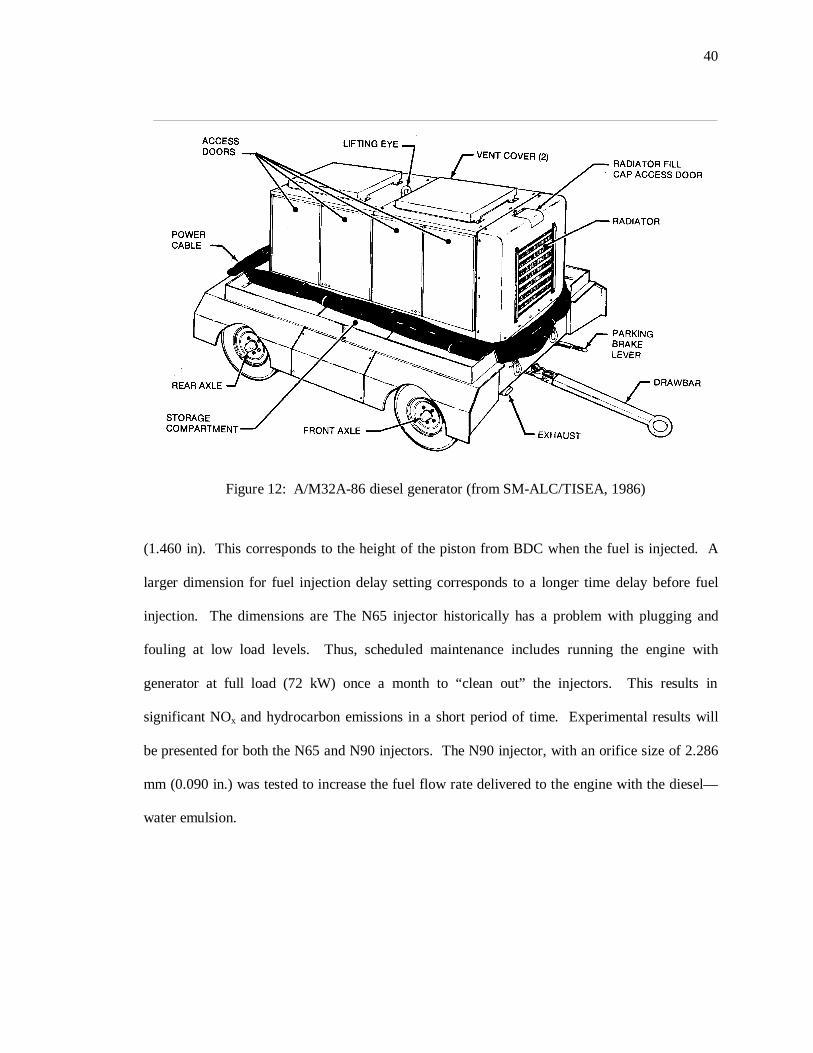
The diesel engine used in the study is a Detroit Diesel 4-71N 2-stroke diesel engine with
forced induction. Engine data are presented in Table 7 and a schematic of the generator is shown
in Figure 12. The manufacturer engine designation corresponds to a 4-cylinder engine with 71 in3
(1163.5 cm3) per cylinder.
The A/M32A-86 generator was originally supplied with the N65 fuel injector, having an
orifice diameter of 1.651 mm (0.065 in) and a recommended injection timing setting of 3.708 cm
Table 7: A/M32A-86 parameters (from SM-ALC/TISEA, 1986)
Engine Model Detroit Diesel 4-71N
Combustion chamber type Direct injection
Number of cylinders 4
Displacement, cm3 4,653.9 (284 in3)
Bore, mm 107.95 (4.25 in)
Stroke, mm 127 (5 in)
Compression ratio 18.71 : 1
Rated power at 2100 rpm, kW 110.4
Power factor 0.8
Maximum electric power output, kW 72
Air box pressure, kPa abs. 34.1 (10.1 in Hg)
Air inlet restriction, kPa abs. 2.86 (11.5 in H2O)
Exhaust back-pressure, kPa gauge 13.5 (4.0 in Hg)
Compression pressure, kPa gauge 3,900 (565 psi)
40
(1.460 in). This corresponds to the height of the piston from BDC when the fuel is injected. A
larger dimension for fuel injection delay setting corresponds to a longer time delay before fuel
injection. The dimensions are The N65 injector historically has a problem with plugging and
fouling at low load levels. Thus, scheduled maintenance includes running the engine with
generator at full load (72 kW) once a month to “clean out” the injectors. This results in
significant NOx and hydrocarbon emissions in a short period of time. Experimental results will
be presented for both the N65 and N90 injectors. The N90 injector, with an orifice size of 2.286
mm (0.090 in.) was tested to increase the fuel flow rate delivered to the engine with the diesel—
water emulsion.
Figure 12: A/M32A-86 diesel generator (from SM-ALC/TISEA, 1986)
41
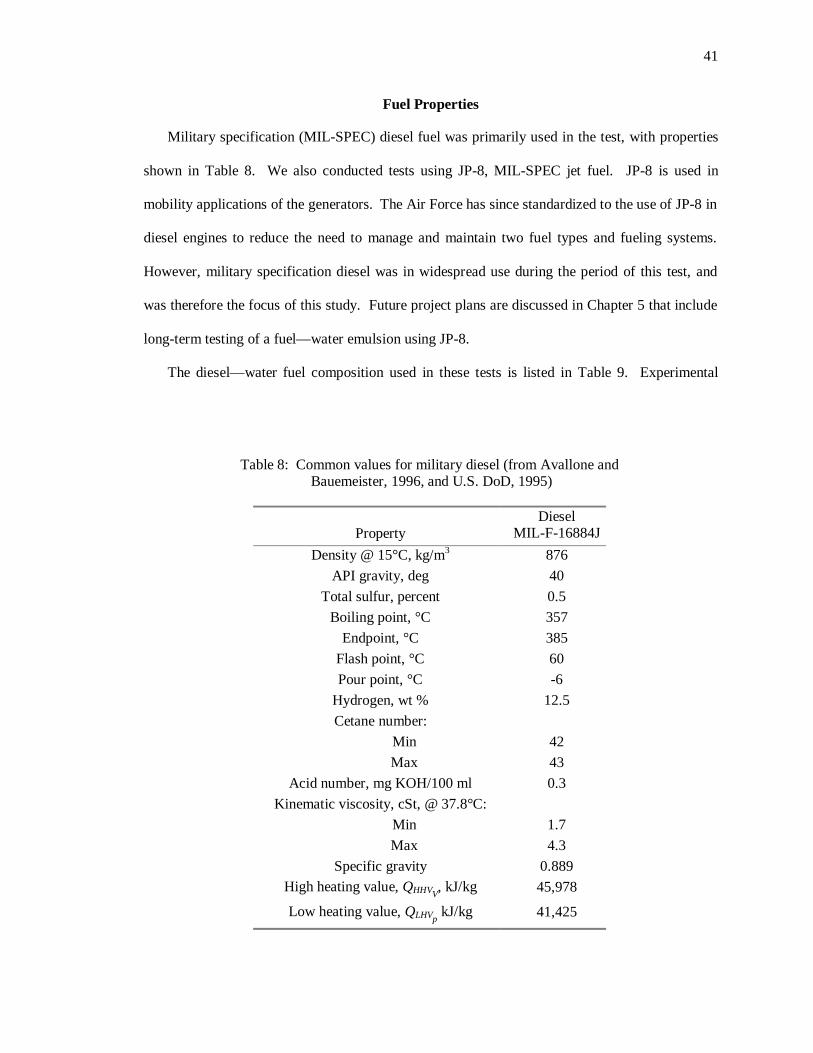
Fuel Properties
Military specification (MIL-SPEC) diesel fuel was primarily used in the test, with properties
shown in Table 8. We also conducted tests using JP-8, MIL-SPEC jet fuel. JP-8 is used in
mobility applications of the generators. The Air Force has since standardized to the use of JP-8 in
diesel engines to reduce the need to manage and maintain two fuel types and fueling systems.
However, military specification diesel was in widespread use during the period of this test, and
was therefore the focus of this study. Future project plans are discussed in Chapter 5 that include
long-term testing of a fuel—water emulsion using JP-8.
The diesel—water fuel composition used in these tests is listed in Table 9. Experimental
Table 8: Common values for military diesel (from Avallone and Bauemeister, 1996, and U.S. DoD, 1995)
PropertyDiesel
MIL-F-16884J
Density @ 15°C, kg/m3 876
API gravity, deg 40
Total sulfur, percent 0.5
Boiling point, °C 357
Endpoint, °C 385
Flash point, °C 60
Pour point, °C -6
Hydrogen, wt % 12.5
Cetane number:
Min 42
Max 43
Acid number, mg KOH/100 ml 0.3
Kinematic viscosity, cSt, @ 37.8°C:
Min 1.7
Max 4.3
Specific gravity 0.889High heating value, QHHVV
, kJ/kg 45,978
Low heating value, QLHVp kJ/kg 41,425
42
results shown later indicating baseline exhaust temperature, [NOx], and [CO] correspond to the
standard fuel (diesel or JP-8) without water or additives. A corrosion inhibitor was selected to
help offset potential corrosive effects of the water in the fuel during idle storage in the fuel tank.
Lebedev and Nosov (1980) reported reduced wear on the upper area of the cylinder and piston
(near TDC) in a Caterpillar 3304 engine with fuel—water emulsions, but also reported increased
wear in the lower regions of the cylinder liner. They attribute the increased wear to sulfur in the
diesel fuel blends. MIL-SPEC diesel and JP-8 traditionally contain little to no fuel-bound sulfur.
For this study we were concerned with the perception of water in fuel as “corrosive,” particularly
to the fueling system, and included the corrosion inhibitor as a precaution. As discussed in
Chapter 3, the emulsion improver allows a permanent emulsion to be stabilized more readily.
Both additives are expected to reduce injector plugging, engine wear, and corrosion (Herbstman
and Virk, 1989, Estefan and Brown, 1990, and Liu et al., 1993). Post-testing materials
evaluations of the effect of the fuel—water emulsion on engine components would be valuable in
determining and quantifying the necessity for a corrosion inhibitor. Eliminating the corrosion
inhibitor would obviously lower the cost of the alternative fuel mixture. Intensive exhaust
characterization using GC/MS would also be important to demonstrate that components of the
corrosion inhibitor are not emitted from the engine. The corrosion inhibitor contains xylene and
ethylbenzene, both targeted as potential carcinogens and targeted for extremely strict controls on
their release from diesel and gasoline engines.
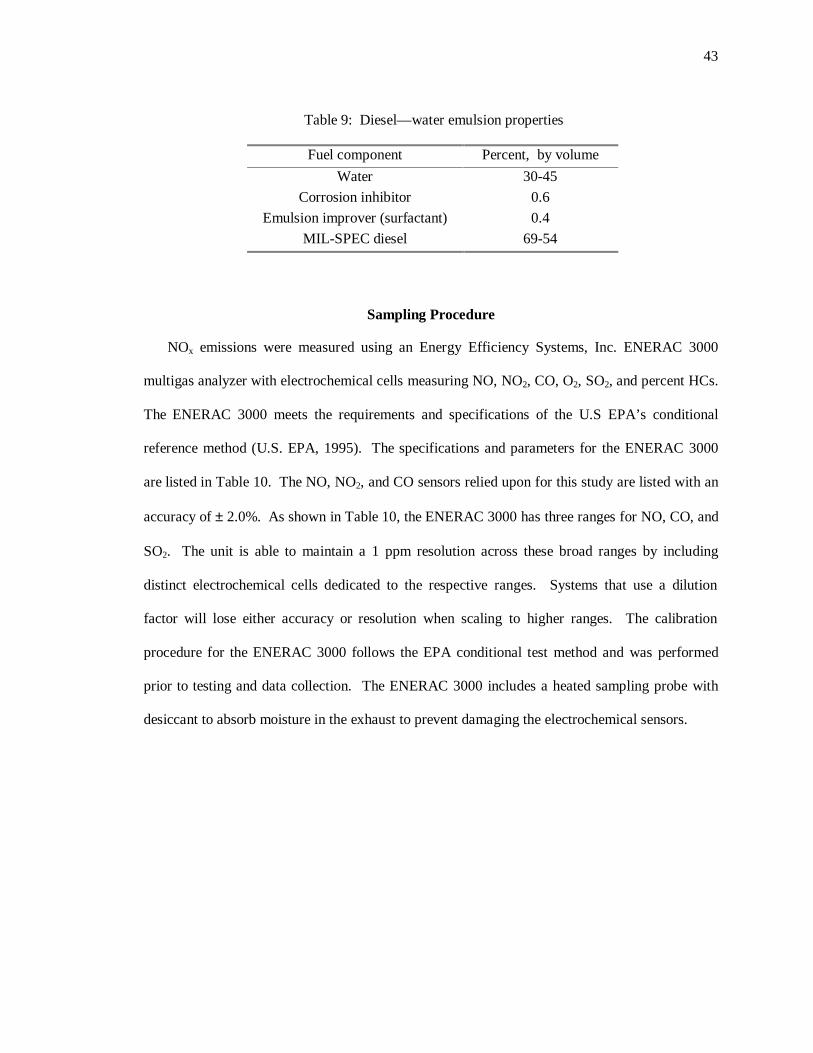
43
Sampling Procedure
NOx emissions were measured using an Energy Efficiency Systems, Inc. ENERAC 3000
multigas analyzer with electrochemical cells measuring NO, NO2, CO, O2, SO2, and percent HCs.
The ENERAC 3000 meets the requirements and specifications of the U.S EPA’s conditional
reference method (U.S. EPA, 1995). The specifications and parameters for the ENERAC 3000
are listed in Table 10. The NO, NO2, and CO sensors relied upon for this study are listed with an
accuracy of ± 2.0%. As shown in Table 10, the ENERAC 3000 has three ranges for NO, CO, and
SO2. The unit is able to maintain a 1 ppm resolution across these broad ranges by including
distinct electrochemical cells dedicated to the respective ranges. Systems that use a dilution
factor will lose either accuracy or resolution when scaling to higher ranges. The calibration
procedure for the ENERAC 3000 follows the EPA conditional test method and was performed
prior to testing and data collection. The ENERAC 3000 includes a heated sampling probe with
desiccant to absorb moisture in the exhaust to prevent damaging the electrochemical sensors.
Table 9: Diesel—water emulsion properties
Fuel component Percent, by volume
Water 30-45
Corrosion inhibitor 0.6
Emulsion improver (surfactant) 0.4
MIL-SPEC diesel 69-54
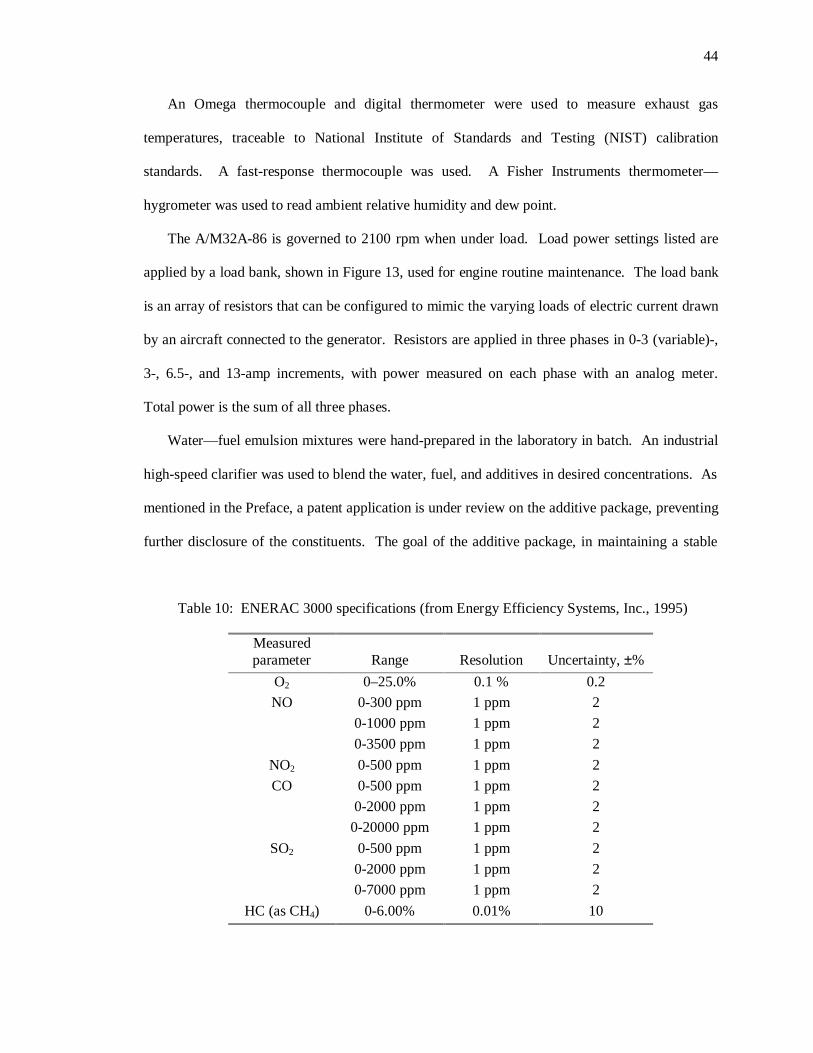
44
An Omega thermocouple and digital thermometer were used to measure exhaust gas
temperatures, traceable to National Institute of Standards and Testing (NIST) calibration
standards. A fast-response thermocouple was used. A Fisher Instruments thermometer—
hygrometer was used to read ambient relative humidity and dew point.
The A/M32A-86 is governed to 2100 rpm when under load. Load power settings listed are
applied by a load bank, shown in Figure 13, used for engine routine maintenance. The load bank
is an array of resistors that can be configured to mimic the varying loads of electric current drawn
by an aircraft connected to the generator. Resistors are applied in three phases in 0-3 (variable)-,
3-, 6.5-, and 13-amp increments, with power measured on each phase with an analog meter.
Total power is the sum of all three phases.
Water—fuel emulsion mixtures were hand-prepared in the laboratory in batch. An industrial
high-speed clarifier was used to blend the water, fuel, and additives in desired concentrations. As
mentioned in the Preface, a patent application is under review on the additive package, preventing
further disclosure of the constituents. The goal of the additive package, in maintaining a stable
Table 10: ENERAC 3000 specifications (from Energy Efficiency Systems, Inc., 1995)
Measuredparameter Range Resolution Uncertainty, ±%
O2 0–25.0% 0.1 % 0.2
NO 0-300 ppm
0-1000 ppm
0-3500 ppm
1 ppm
1 ppm
1 ppm
2
2
2
NO2 0-500 ppm 1 ppm 2
CO 0-500 ppm
0-2000 ppm
0-20000 ppm
1 ppm
1 ppm
1 ppm
2
2
2
SO2 0-500 ppm
0-2000 ppm
0-7000 ppm
1 ppm
1 ppm
1 ppm
2
2
2
HC (as CH4) 0-6.00% 0.01% 10
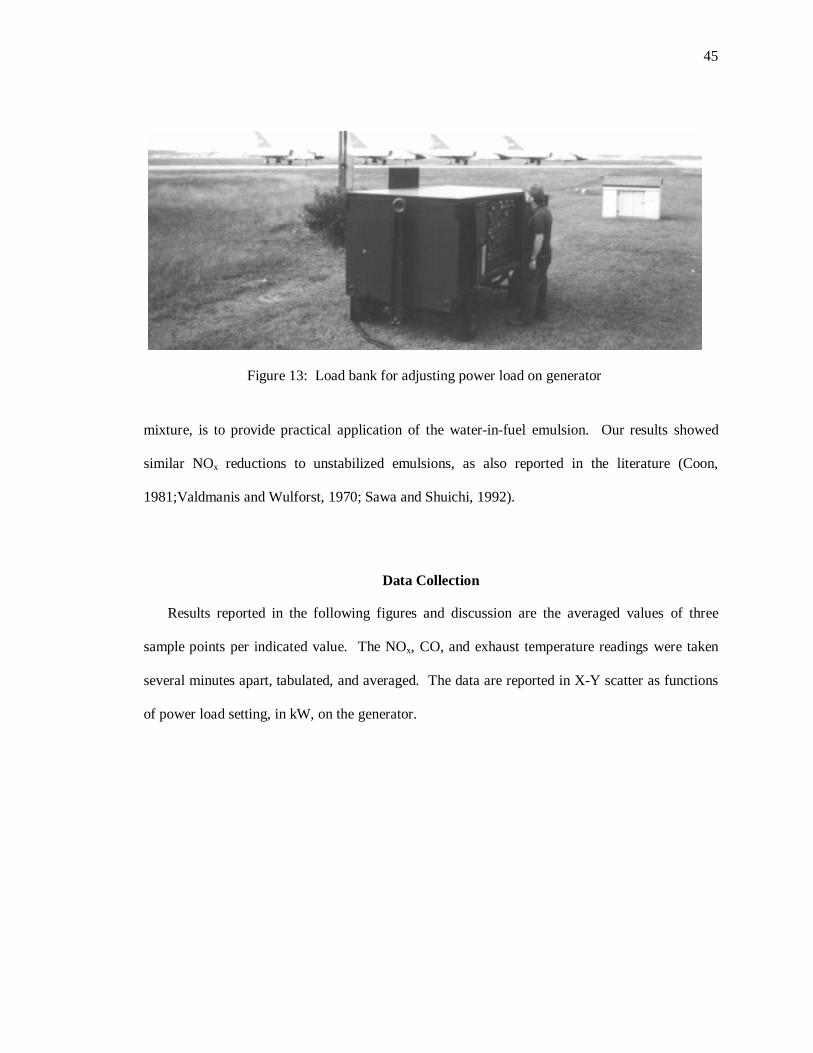
45
mixture, is to provide practical application of the water-in-fuel emulsion. Our results showed
similar NOx reductions to unstabilized emulsions, as also reported in the literature (Coon,
1981;Valdmanis and Wulforst, 1970; Sawa and Shuichi, 1992).
Data Collection
Results reported in the following figures and discussion are the averaged values of three
sample points per indicated value. The NOx, CO, and exhaust temperature readings were taken
several minutes apart, tabulated, and averaged. The data are reported in X-Y scatter as functions
of power load setting, in kW, on the generator.
Figure 13: Load bank for adjusting power load on generator
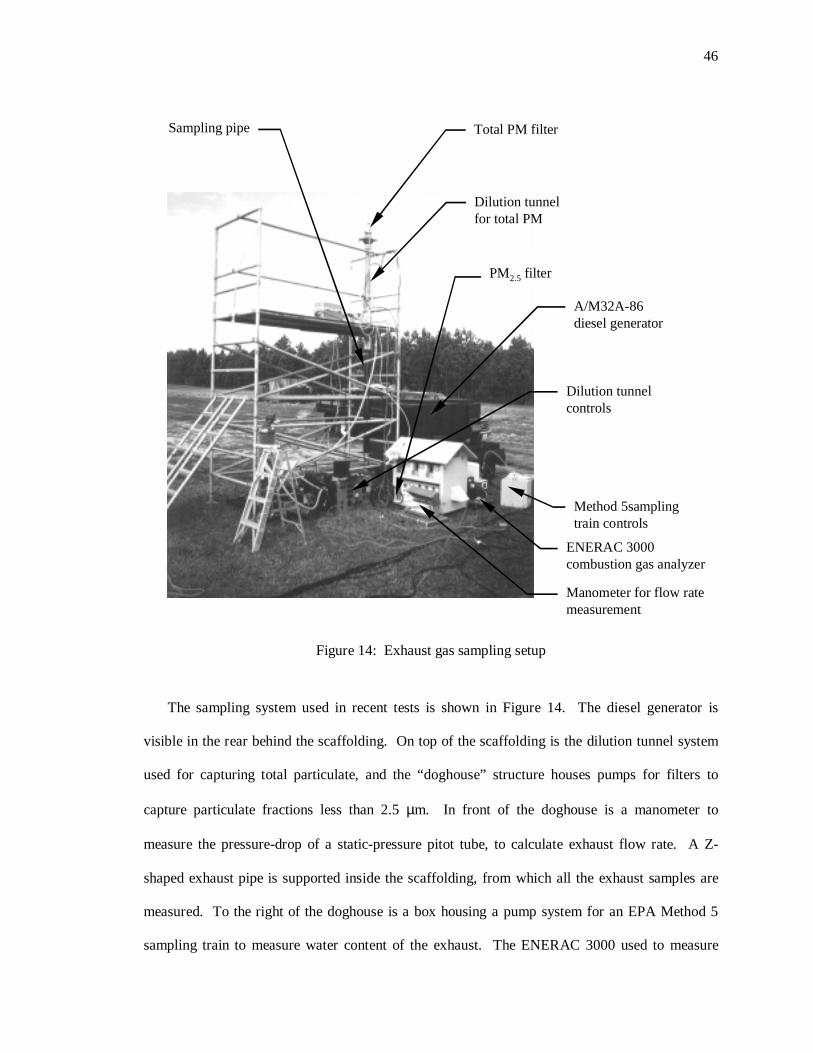
46
The sampling system used in recent tests is shown in Figure 14. The diesel generator is
visible in the rear behind the scaffolding. On top of the scaffolding is the dilution tunnel system
used for capturing total particulate, and the “doghouse” structure houses pumps for filters to
capture particulate fractions less than 2.5 µm. In front of the doghouse is a manometer to
measure the pressure-drop of a static-pressure pitot tube, to calculate exhaust flow rate. A Z-
shaped exhaust pipe is supported inside the scaffolding, from which all the exhaust samples are
measured. To the right of the doghouse is a box housing a pump system for an EPA Method 5
sampling train to measure water content of the exhaust. The ENERAC 3000 used to measure
Total PM filter
Dilution tunnelfor total PM
PM2.5 filter
A/M32A-86diesel generator
Dilution tunnelcontrols
Method 5samplingtrain controls
ENERAC 3000combustion gas analyzer
Manometer for flow ratemeasurement
Sampling pipe
Figure 14: Exhaust gas sampling setup
47
NOx and CO is slightly visible to the immediate right of the doghouse. Attached to the left of the
scaffolding is a helium tank for a portable GC/MS (Viking Instruments) used to characterize
VOCs and SVOCs (not shown in the picture).
The ENERAC 3000 and Omega thermocouple were inserted through holes in the Z-shaped
exhaust pipe immediately after the diesel generator exhaust pipe. The dilution tunnel sampling
system requires a straight vertical run with 8 diameters of pipe length after the bend, which in
turn required the construction of the Z-shaped exhaust extension and scaffolding support. The
PM2.5 filters feed off the flow through the dilution tunnel, which captures total particulate.
Finally, the pitot tube for calculating exhaust gas flow rate is inserted in the upper horizontal run
after the dilution tunnel.
48
CHAPTER 5
RESULTS AND DISCUSSION
Experimental Results
Experimental results are given in Figure 15 through Figure 21, where data are graphed for the
NOx and CO concentrations and exhaust temperature, Te, as functions of power load on the
generator. Power load is graphed, with the exception of Figure 19, from idle to 80 kW. Recall
full electric load on the generator is 72 kW with diesel or JP-8 fuel. The idle condition is given
an arbitrary value left of zero. Latter graphs are interpretations of the experimental data used to
demonstrate the correlation between exhaust gas temperature, power setting, injector size, fuel
water content, and exhaust gas composition.
Baseline Emissions
Figure 15 shows the NOx, CO, and exhaust temperature for the diesel engine combusting
diesel fuel, with the N65 and N90 injectors at various injection timing delay settings. Significant
reductions in NOx emissions are shown simply delaying the fuel injection for both injectors, with
the N90 injector displaying significantly lower NOx emissions. In fact, the Air Force is
considering replacing the N65 stock injector with newer swirl injectors, based upon these and
similar emission testing results elsewhere.
Comparing the NOx and CO graphs in Figure 15, we see the customary tradeoff of higher CO
emissions when NOx is reduced. Note the N90 injector at 3.861 cm displays both the lowest NOx
and highest CO emissions. This is due primarily to the effect of fuel quenching causing
49
incomplete combustion and increased HC emissions, including CO. These results are consistent
with trends described in the literature (Borman and Brown, 1992).
N65 Injectors
Figure 16 presents results with the N65 injector at 3.769 cm using the diesel—water
emulsion. Note in Figure 16 the significant reductions in NOx emissions using 30 and 43% water.
Data for 30 and 43% water are not shown out to 72 kW because the generator could not develop
that power output with the corresponding levels of water in the fuel. Exhaust temperature is a
factor of 1.088 lower at 50 kW for the 30% diesel—water blend versus the standard diesel. This
may be significant because the NOx emissions were 1.75 times lower for the same range. From
this, we can hypothesize that the relationship between NOx and flame temperature is either
nonlinear or chemical kinetic effects are responsible for the greater reduction in NOx. Recalling
the equilibrium NO formation rate, Equation (31), we would expect a nonlinear relationship
between NO and temperature. Substituting K2000 T1 = and K18381.088
2000 T2 == into Equation
(31), one obtainsdt
d
dt
d 21 ]NO[01.2
]NO[= , or that the rate of NO production should double with
only a 1.088 factor increase in flame temperature, assuming exhaust gas composition is in
equilibrium. Our data deviates from this estimate, since the slope
dP
d ]NO[ of the baseline NOx
curve is only 1.53 times the slope of the 30% water curve. A likely source of the discrepancy is
our use of exhaust temperature, versus in-cylinder flame temperature measurements. The excess
water may continue to cool down the exhaust gases, giving a greater temperature difference
between the baseline and 30% water than the NOx levels would suggest. In other words, the
flame temperature change is likely to be less than the exhaust temperature change.
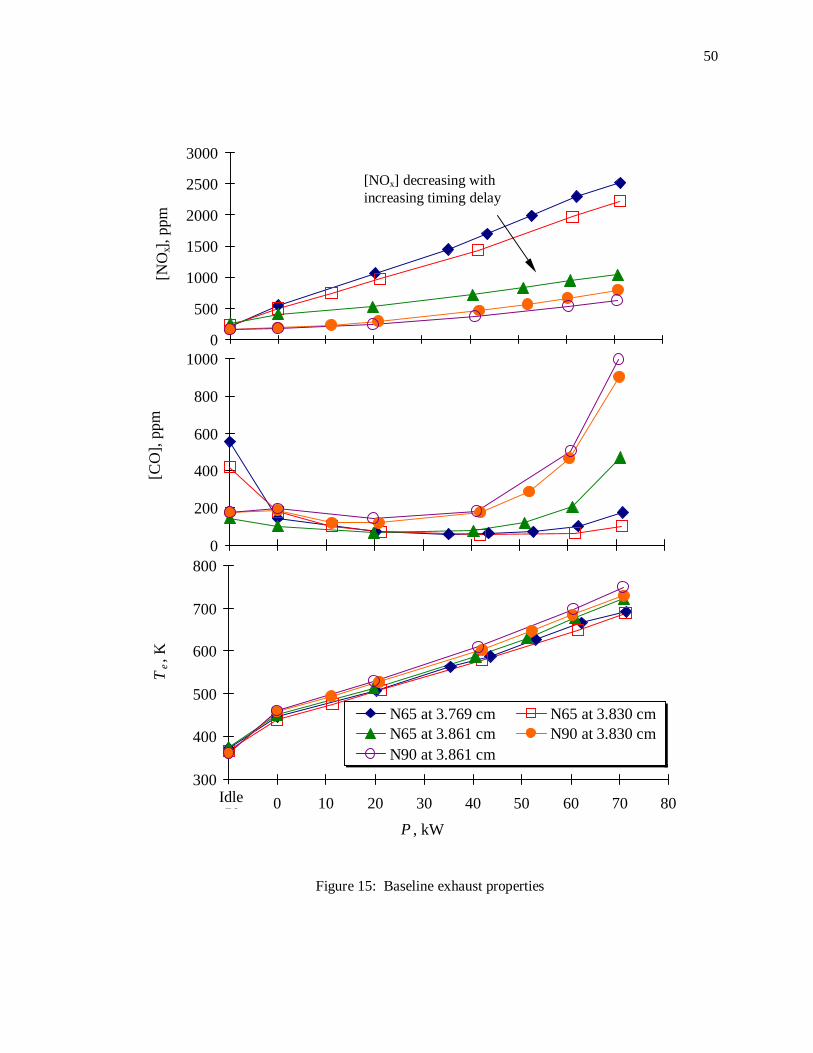
50
Figure 15: Baseline exhaust properties
0
500
1000
1500
2000
2500
3000[N
Ox],
ppm
300
400
500
600
700
800
-10 0 10 20 30 40 50 60 70 80
P , kW
Te, K
N65 at 3.769 cm N65 at 3.830 cmN65 at 3.861 cm N90 at 3.830 cmN90 at 3.861 cm
Idle
0
200
400
600
800
1000
[CO
], pp
m
[NOx] decreasing withincreasing timing delay
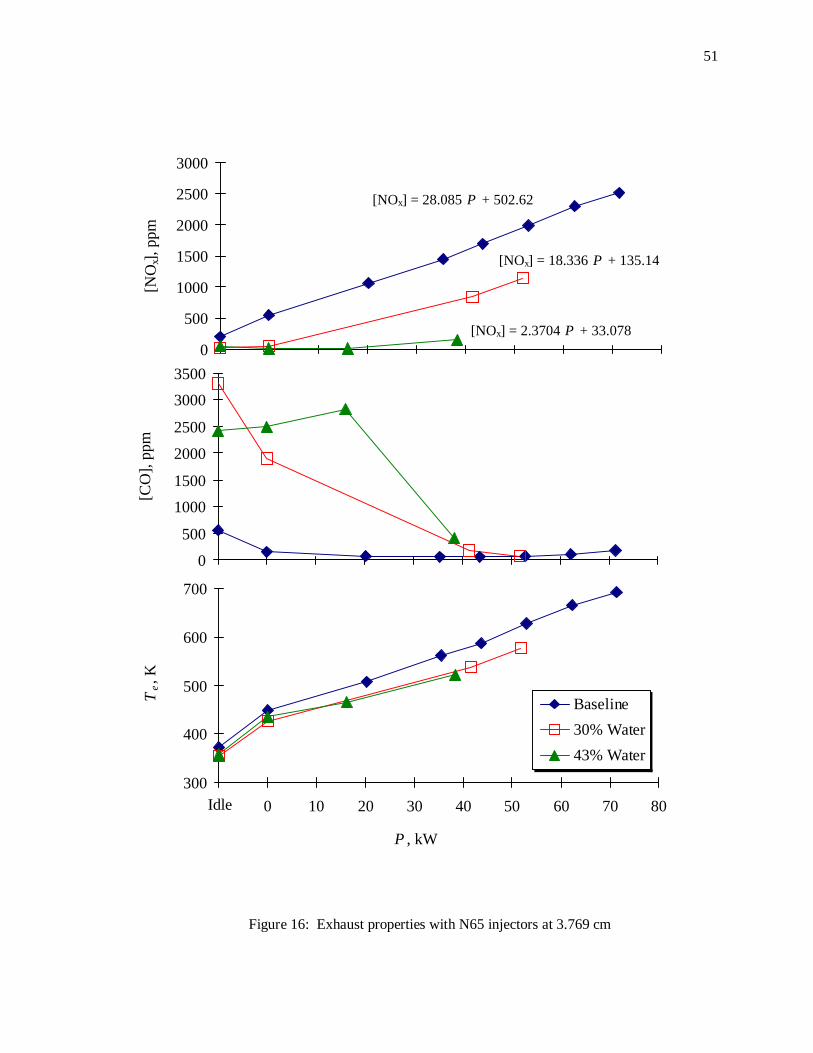
51
Figure 16: Exhaust properties with N65 injectors at 3.769 cm
0
500
1000
1500
2000
2500
3000[N
Ox],
ppm
[NOx] = 28.085 P + 502.62
[NOx] = 18.336 P + 135.14
[NOx] = 2.3704 P + 33.078
300
400
500
600
700
-10 0 10 20 30 40 50 60 70 80
P , kW
Te, K
Baseline
30% Water
43% Water
Idle
0
500
1000
1500
2000
2500
3000
3500
[CO
], pp
m
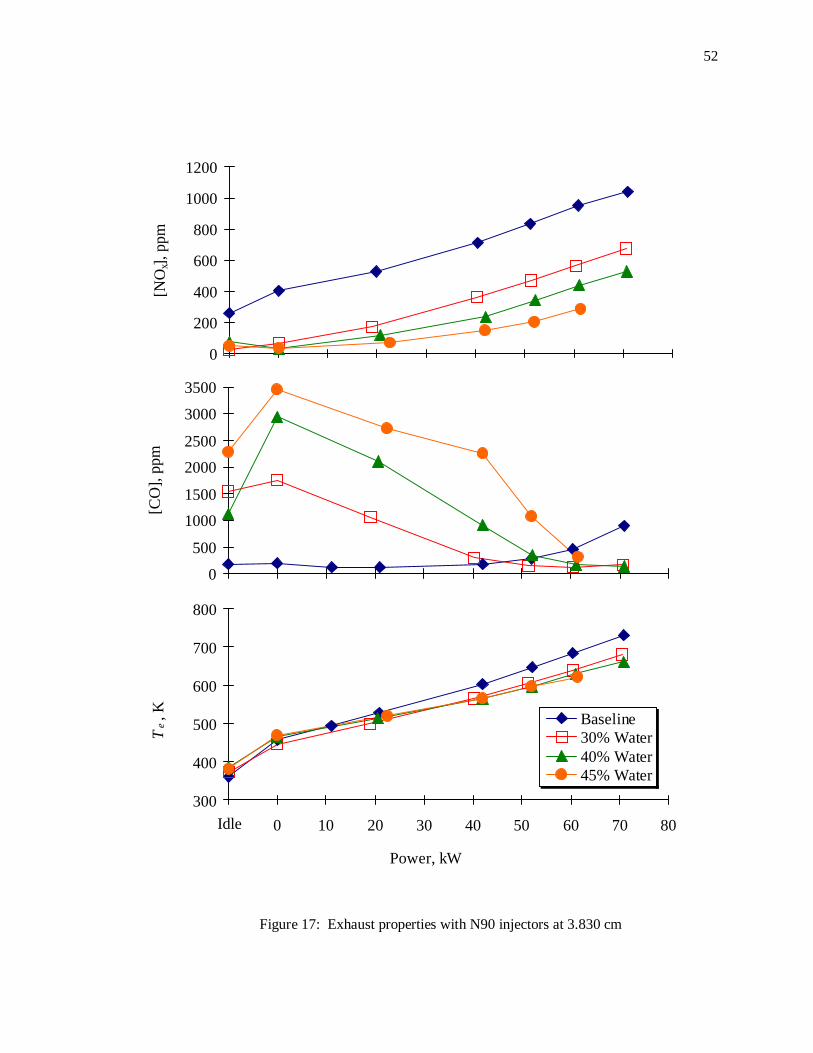
52
Figure 17: Exhaust properties with N90 injectors at 3.830 cm
0
200
400
600
800
1000
1200[N
Ox],
ppm
300
400
500
600
700
800
-10 0 10 20 30 40 50 60 70 80
Power, kW
Te, K Baseline
30% Water40% Water45% Water
Idle
0
500
1000
1500
2000
2500
3000
3500
[CO
], pp
m
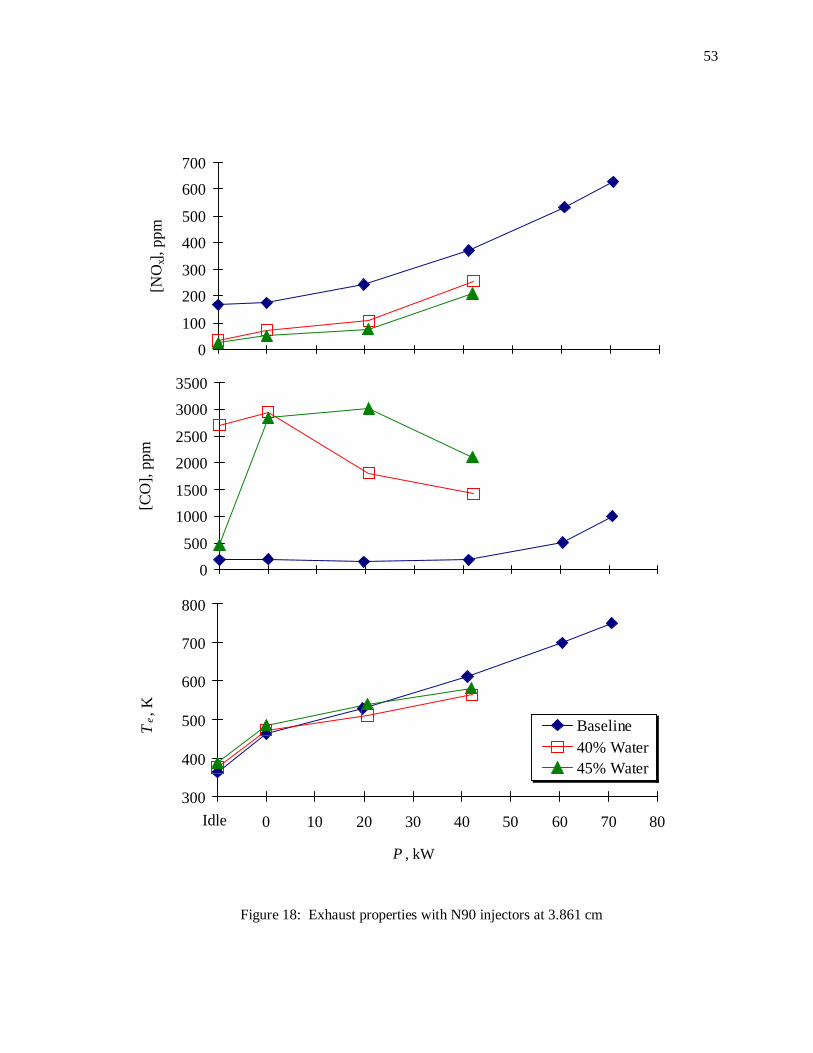
53
Figure 18: Exhaust properties with N90 injectors at 3.861 cm
0
100
200
300
400
500
600
700[N
Ox],
ppm
300
400
500
600
700
800
-10 0 10 20 30 40 50 60 70 80
P , kW
Te, K
Baseline40% Water45% Water
Idle
0
500
1000
1500
2000
2500
3000
3500
[CO
], pp
m
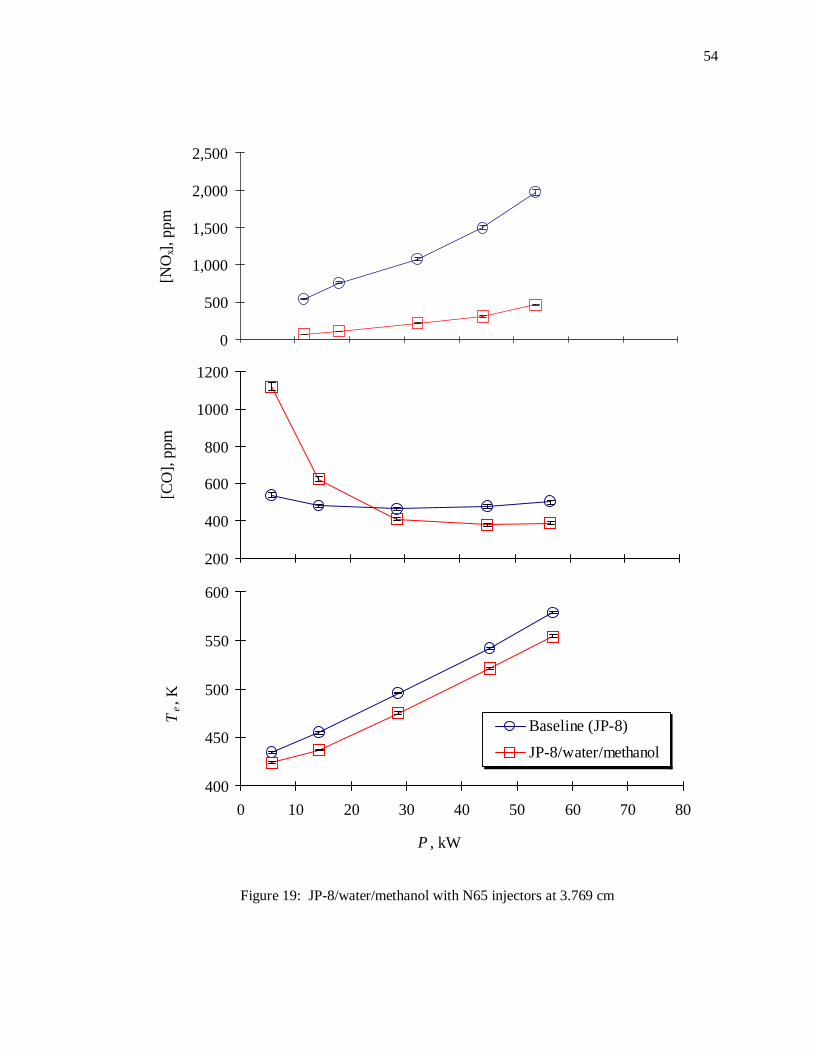
54
Figure 19: JP-8/water/methanol with N65 injectors at 3.769 cm
0
500
1,000
1,500
2,000
2,500[N
Ox],
ppm
400
450
500
550
600
0 10 20 30 40 50 60 70 80
P , kW
Te, K
Baseline (JP-8)
JP-8/water/methanol
200
400
600
800
1000
1200
[CO
], pp
m
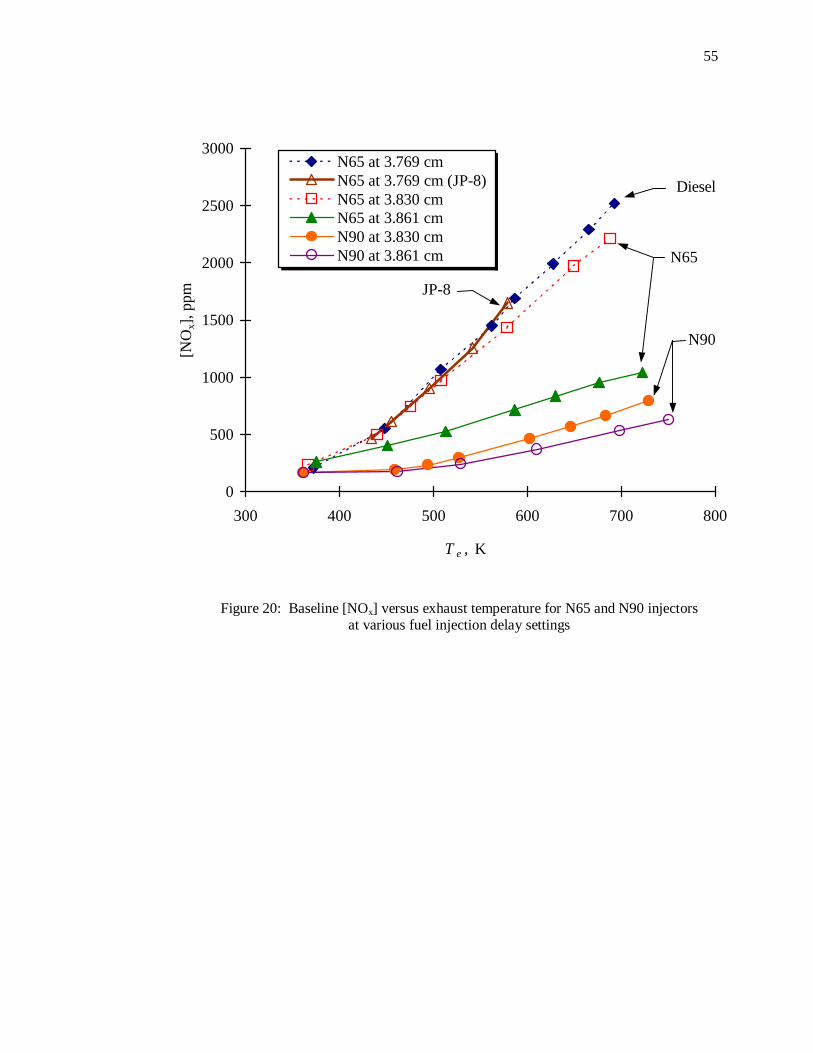
55
0
500
1000
1500
2000
2500
3000
300 400 500 600 700 800
T e, K
[NO
x], p
pm
N65 at 3.769 cmN65 at 3.769 cm (JP-8)N65 at 3.830 cmN65 at 3.861 cmN90 at 3.830 cmN90 at 3.861 cm
JP-8
Diesel
N90
N65
Figure 20: Baseline [NOx] versus exhaust temperature for N65 and N90 injectorsat various fuel injection delay settings
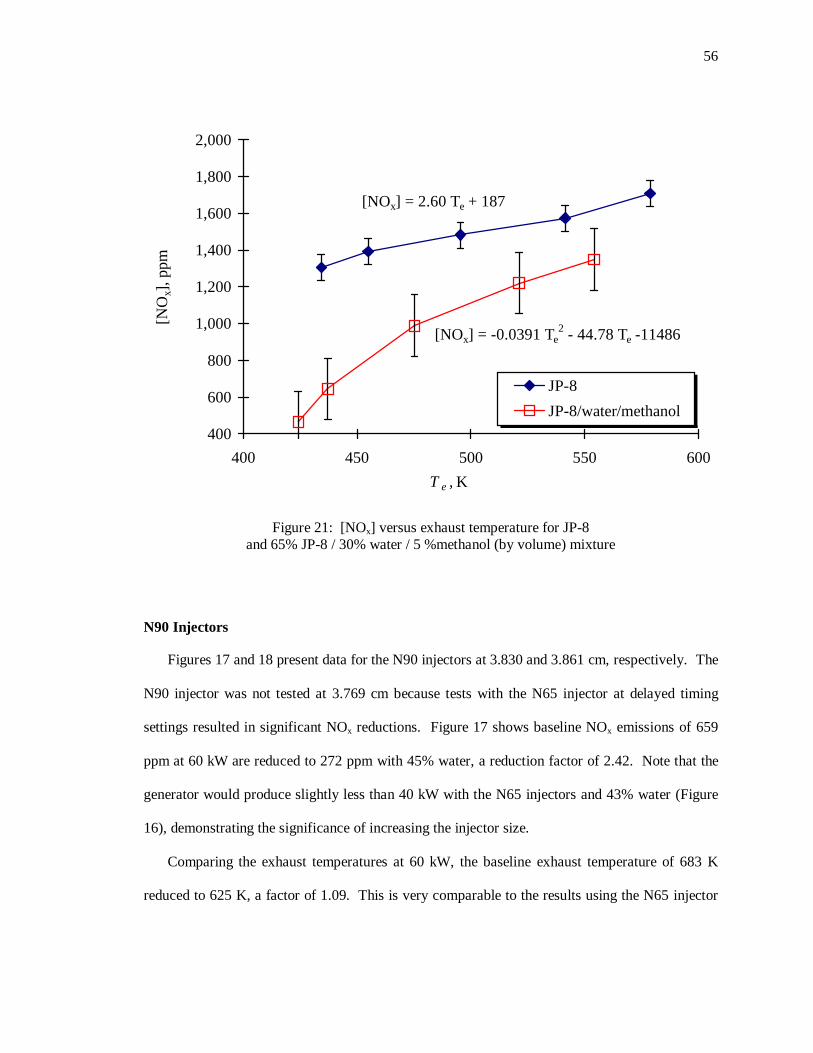
56
N90 Injectors
Figures 17 and 18 present data for the N90 injectors at 3.830 and 3.861 cm, respectively. The
N90 injector was not tested at 3.769 cm because tests with the N65 injector at delayed timing
settings resulted in significant NOx reductions. Figure 17 shows baseline NOx emissions of 659
ppm at 60 kW are reduced to 272 ppm with 45% water, a reduction factor of 2.42. Note that the
generator would produce slightly less than 40 kW with the N65 injectors and 43% water (Figure
16), demonstrating the significance of increasing the injector size.
Comparing the exhaust temperatures at 60 kW, the baseline exhaust temperature of 683 K
reduced to 625 K, a factor of 1.09. This is very comparable to the results using the N65 injector
400
600
800
1,000
1,200
1,400
1,600
1,800
2,000
400 450 500 550 600
T e, K
[NO
x], p
pm
JP-8
JP-8/water/methanol
[NOx] = 2.60 Te + 187
[NOx] = -0.0391 Te2 - 44.78 Te -11486
Figure 21: [NOx] versus exhaust temperature for JP-8and 65% JP-8 / 30% water / 5 %methanol (by volume) mixture
57
(Figure 16), except we were able to attain 1.5 times the power output (60 kW versus 40 kW) with
1.05 times more water in the fuel (43 to 45%) using the N90 injector.
Figure 18 shows similar reductions in NOx and exhaust temperature, although intermediate
data were not taken at 30% water, only 40 and 45%. The exhaust temperature for the 45% water
case is 1.028 times higher than the 40% water case, although lower NOx, was measured. The
significantly-lower CO for 40% water suggests that a variability between fuels, other than water
content, may have occurred between the 40 and 45% mixtures reported. For example, a poorly-
mixed 45% emulsion, in which the water ratio decreased with time, would account for the slightly
higher exhaust temperature.
JP-8/Water/Methanol Tests
Data shown in Figure 19 was taken using a blend of 64% JP-8, 30% water, 5% methanol, and
1% additives, by volume. A new testing protocol was followed, in compliance with the
International Organization for Standardization (ISO) testing procedures for compression ignition
2-stroke engines. The test cycle called for testing at load settings of 10, 25, 50, 75, and 100% full
load. Based upon experience and preliminary testing, we established 56 kW as full load and then
tested at the prescribed percentages. Please note that the injector and timing setting for data
reported in Figure 19, N65 at 3.769 cm, corresponds to the diesel/water mixture injector and
timing settings reported in Figure 16.
The NOx reduction of 78% at 50 kW is substantially higher than the 44% reduction reported
in previous tests (Figure 19). The CO emissions at low loads are also significantly lower in
Figure 19 versus Figure 16. For example, CO emissions at 15 kW were 623 ppm for the JP-
8/water/methanol mixture in Figure 19, versus 2826 ppm for the diesel/water mixture in Figure
16, a factor of 4.53. Possible explanations for this high variation in CO emissions include engine
variabilities, differences in JP-8 versus diesel combustion, testing condition variables, and CO
58
monitoring equipment calibration. The most likely cause, demonstrated in recent studies, is the
variability of NOx and CO emissions across these diesel generator units. Data in Figure 16 were
taken in late 1996 using a diesel generator no longer in service, whereas data in Figure 19 were
recorded in late 1998 from a diesel generator fresh out of six-month maintenance. Several other
engines tested in late 1998 also displayed high CO emissions and slightly higher NOx emissions
and were suspected to have poor cylinder compression. Testing conditions also varied: data in
Figure 19 were recorded in mild Florida winter ambient temperature of 289 K, whereas data in
Figure 16 were recorded in humid Florida summer with ambient temperatures of 308 K. Higher
intake temperatures affect the volumetric efficiency and ignition delay of the compression
ignition engine cycle.
NOx reductions at lower loads are slightly higher. Exhaust temperatures for this fuel and
engine test were 4.25% lower with the JP-8—water fuel. Measurable discrepancies exist across
engines and future test programs will require the use of multiple engines.
Shown in Figure 20 are NOx emissions versus temperature for the baseline case of all
injector/timing settings tested. We must be careful interpreting results like those in Figure 20. As
shown earlier, both NOx and exhaust temperature increase with load setting on the generator. We
have demonstrated through practice that thermal NOx formation is significant in the subject diesel
engine, but further correlation is required to prove the hypothesis that diesel—water emulsions
lower the combustion flame temperature and suppress thermal NOx formation.
Uncertainties
Error bars are plotted in Figure 19 to demonstrate the low level of instrument error in our
tests. The [CO] and [NOx] data accuracy is ±2 percent of indicated value, plotted in Figure 19 as
positive and negative errors. The Omega thermocouples used to measure exhaust temperature, Te,
are accurate to ±1.0 K. These errors are also plotted in Figure 19.
59
NOx Versus Exhaust Temperature
Combustion products and exhaust temperature to this point have been presented as a function
of power load on the generator. Baseline NOx emissions are plotted against the corresponding
exhaust temperature in Figure 20. A strong trend exists for increased NOx with increased exhaust
temperature as fuel injector size increases and timing is delayed. Note the higher values and
slope for N65 injectors versus N90 injectors at timing setting of 3.830 cm. Please also note the
overlap for N65 injectors at 3.769 cm, with both diesel and JP-8 fuels, demonstrating the
similarity between the fuels. The line labeled “JP-8” is repeated in Figure 21.
Figure 21 presents [NOx] as a function of exhaust temperature for the recent investigations
using JP-8 and the JP-8/methanol/water mixture with 30% water and 5% methanol, by volume.
Trend line “JP-8” is repeated from Figure 20, along with data for the mixture, to compare how the
NOx formation as a function of temperature varies with the addition of water (and in this case
methanol). Figures comparing each of the baseline trends in Figure 20 with its corresponding
NOx versus exhaust temperature trend have been not been included for the sake of brevity. Error
bars are plotted in Figure 21 depicting the positive and negative standard error for each data
series. The standard error for the JP-8 data set is lower due to smaller differences between data
points. A clear trend is shown for increased NOx emissions with increased exhaust temperature,
both for the baseline case of JP-8 fuel and the JP-8/water/methanol mixture.
The linear curve-fit equations were plotted in Figure 21. It is interesting to note that while
the y-intercept for the mixture is significantly lower, at –2280 ppm, than that for JP-8, 187 ppm,
the slope for the mixture is 2.56 times that of the JP-8. The slope of the line can be interpreted as
an empirical NOx formation rate based upon exhaust temperature, with units of ppm/K.
60
First Law of Thermodynamics Calculation
The stoichiometry for fuel-lean combustion (φ ≤ 1) was described by Equation (5) in Chapter
2:
222222 76.3)()3.76( aNfOgOdHbCONOaHC yx +++→++ (5)
We will apply Equation (5) first to determine the adiabatic flame temperature of the baseline case
for diesel fuel combustion:
Case 1: Diesel combustion
Given: Diesel fuel
Equivalence ratio, φ = 0.8
Temperature of reactants, TR = 298 K
Pressure of reactants, pR = 100 kPa
Find: Temperature of products (adiabatic flame temperature), TP
Assumptions: Steady-state steady-flow process
Pressure of products, pR = 100 kPa
Model diesel fuel as C14.4H24.9 (Sonntag et al.,1998)
Solution:
Please refer to first-law control volume around the combustion engine in Figure 7. Modeling
diesel fuel as C14.4H24.9 and solving for the coefficients of Equation (5) per Equations (7) through
(12) yields the following:
8.258.0
4
9.244.14
4 =+
=+
=φ
yx
a (37)
4.14== xb (38)
61
45.122
9.24
2=== y
d (39)
16.5)8.25)(8.01()1( =−=−= af φ (40)
Inserting these coefficients into Equation (5) yields:
2222
229.244.14
9.9616.5)(45.124.14
)3.76(8.25)(
NOgOHCO
NOHC
+++→++"
(41)
Using Equation (13), with QCV = 0 and WCV = 0, gives the following equality for the enthalpies of
reactants and products:
∑∑ =P
jjR
ii hnhn (42)
The total reactant enthalpies can be evaluated according to the sum of the respective species’
enthalpies of formation, $fh , and the species’ enthalpies, h∆ , at the reactant temperature and
pressure:
∑ ∆+=R
ifiR hhnH )( $ (43)
Evaluating Equation (43) for reactant molar balances in Equation (41), with enthalpies evaluated
at TR = 298K, pR = 100 kPa, and enthalpies of formation from Sonntag et al. (1998), Table A.8,
yields:
kJ/kmol000,17400000,174
9.968.25229.244.14 ,,,
−=++−=
++= $$$
NfOfHCfR hhhH(44)
Please note that the respective ih∆ from Equation (43) are zero because we chose the reactant
temperature and pressure equal to the reference state for enthalpy of formation.
Similarly, the equation for product enthalpy, substituting enthalpies of formation from
Sonntag et al. (1998), Table A.8, is
( )( )
222
2
9.9616.5826,24145.12
522,3934.14)(
)( NOgOH
COP
jfjP
hhh
hhhnH
∆+∆+∆+−+
∆+−=∆+= ∑ $
(45)
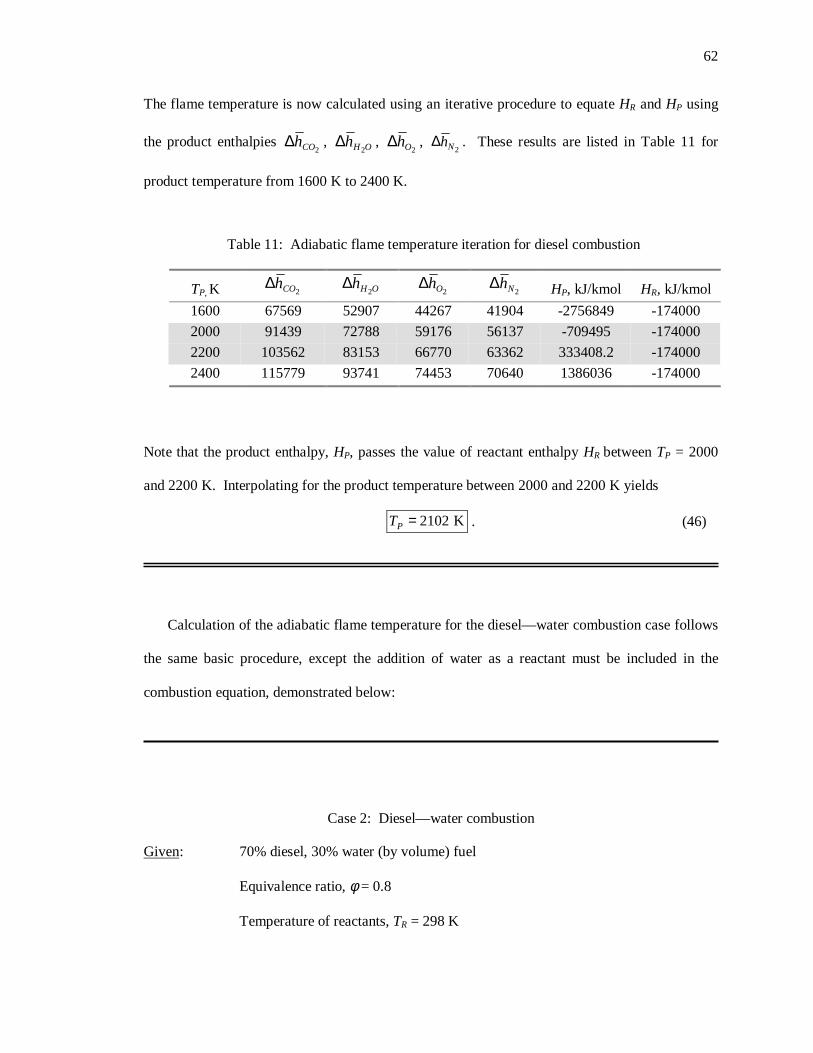
62
The flame temperature is now calculated using an iterative procedure to equate HR and HP using
the product enthalpies 2COh∆ , OHh
2∆ ,
2Oh∆ , 2Nh∆ . These results are listed in Table 11 for
product temperature from 1600 K to 2400 K.
Note that the product enthalpy, HP, passes the value of reactant enthalpy HR between TP = 2000
and 2200 K. Interpolating for the product temperature between 2000 and 2200 K yields
K2102=PT . (46)
Calculation of the adiabatic flame temperature for the diesel—water combustion case follows
the same basic procedure, except the addition of water as a reactant must be included in the
combustion equation, demonstrated below:
Case 2: Diesel—water combustion
Given: 70% diesel, 30% water (by volume) fuel
Equivalence ratio, φ = 0.8
Temperature of reactants, TR = 298 K
Table 11: Adiabatic flame temperature iteration for diesel combustion
TP, K 2COh∆ OHh2
∆2Oh∆
2Nh∆ HP, kJ/kmol HR, kJ/kmol
1600 67569 52907 44267 41904 -2756849 -174000
2000 91439 72788 59176 56137 -709495 -174000
2200 103562 83153 66770 63362 333408.2 -174000
2400 115779 93741 74453 70640 1386036 -174000
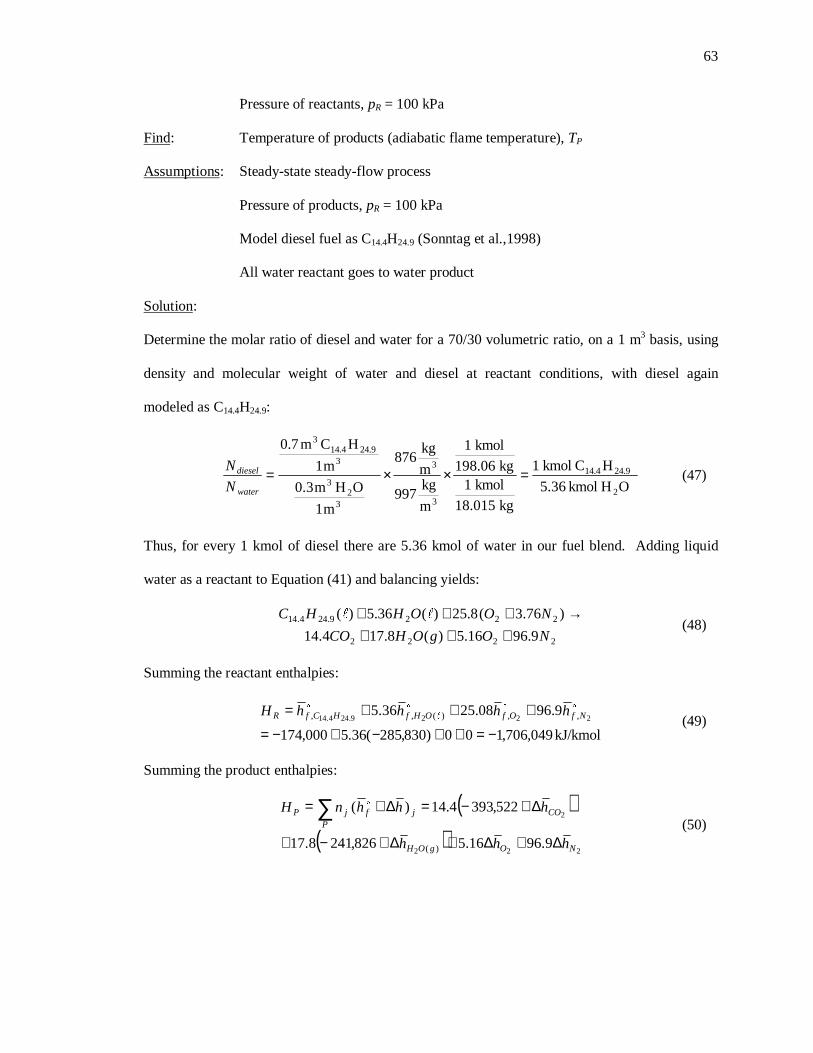
63
Pressure of reactants, pR = 100 kPa
Find: Temperature of products (adiabatic flame temperature), TP
Assumptions: Steady-state steady-flow process
Pressure of products, pR = 100 kPa
Model diesel fuel as C14.4H24.9 (Sonntag et al.,1998)
All water reactant goes to water product
Solution:
Determine the molar ratio of diesel and water for a 70/30 volumetric ratio, on a 1 m3 basis, using
density and molecular weight of water and diesel at reactant conditions, with diesel again
modeled as C14.4H24.9:
O Hkmol 5.36
HC kmol1
kg18.015
kmol1kg198.06
kmol1
m
kg997
m
kg876
m1
OHm3.0
m1
HCm7.0
2
24.914.4
3
3
32
3
324.914.4
3
=××=water
diesel
N
N(47)
Thus, for every 1 kmol of diesel there are 5.36 kmol of water in our fuel blend. Adding liquid
water as a reactant to Equation (41) and balancing yields:
2222
2229.244.14
9.9616.5)(8.174.14
)3.76(8.25)(36.5)(
NOgOHCO
NOOHHC
+++→+++ ""
(48)
Summing the reactant enthalpies:
kJ/kmol049,706,100)830,285(36.5000,174
9.9608.2536.52229.244.14 ,,)(,,
−=++−+−=
+++= $$$
"
$
NfOfOHfHCfR hhhhH(49)
Summing the product enthalpies:
( )( )
222
2
9.9616.5826,2418.17
522,3934.14)(
)( NOgOH
COP
jfjP
hhh
hhhnH
∆+∆+∆+−+
∆+−=∆+= ∑ $
(50)
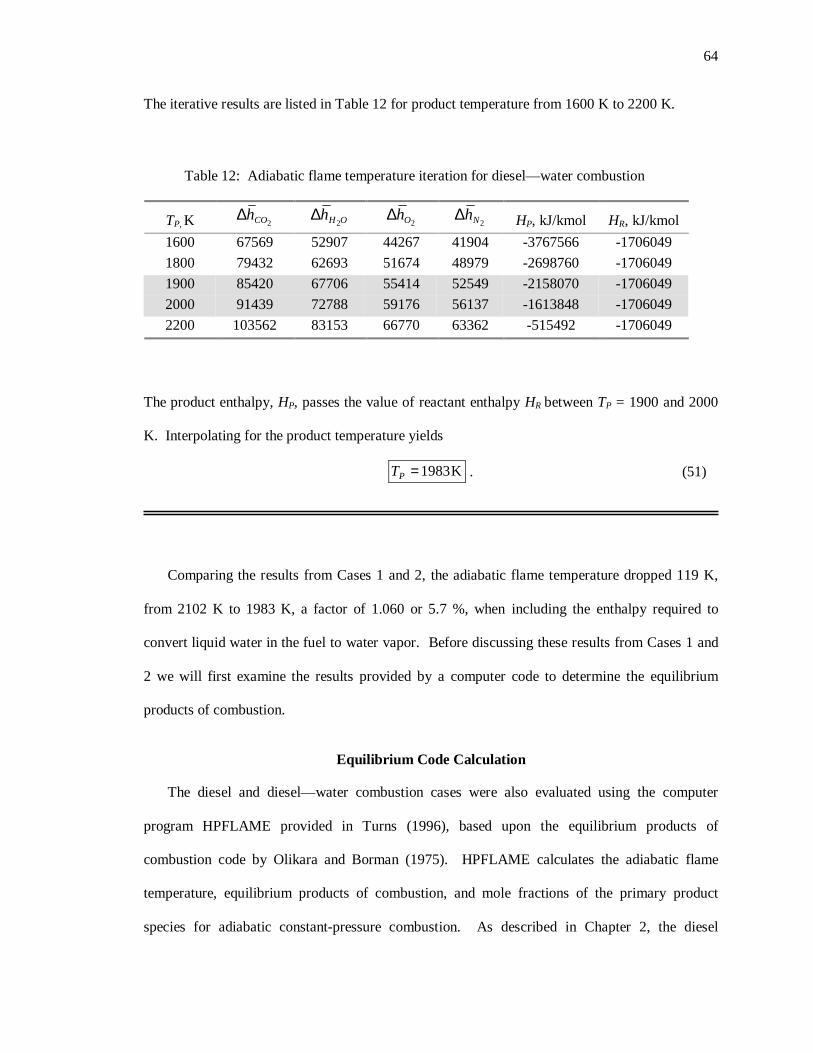
64
The iterative results are listed in Table 12 for product temperature from 1600 K to 2200 K.
The product enthalpy, HP, passes the value of reactant enthalpy HR between TP = 1900 and 2000
K. Interpolating for the product temperature yields
K1983=PT . (51)
Comparing the results from Cases 1 and 2, the adiabatic flame temperature dropped 119 K,
from 2102 K to 1983 K, a factor of 1.060 or 5.7 %, when including the enthalpy required to
convert liquid water in the fuel to water vapor. Before discussing these results from Cases 1 and
2 we will first examine the results provided by a computer code to determine the equilibrium
products of combustion.
Equilibrium Code Calculation
The diesel and diesel—water combustion cases were also evaluated using the computer
program HPFLAME provided in Turns (1996), based upon the equilibrium products of
combustion code by Olikara and Borman (1975). HPFLAME calculates the adiabatic flame
temperature, equilibrium products of combustion, and mole fractions of the primary product
species for adiabatic constant-pressure combustion. As described in Chapter 2, the diesel
Table 12: Adiabatic flame temperature iteration for diesel—water combustion
TP, K 2COh∆ OHh2
∆2Oh∆
2Nh∆ HP, kJ/kmol HR, kJ/kmol
1600 67569 52907 44267 41904 -3767566 -1706049
1800 79432 62693 51674 48979 -2698760 -1706049
1900 85420 67706 55414 52549 -2158070 -1706049
2000 91439 72788 59176 56137 -1613848 -1706049
2200 103562 83153 66770 63362 -515492 -1706049
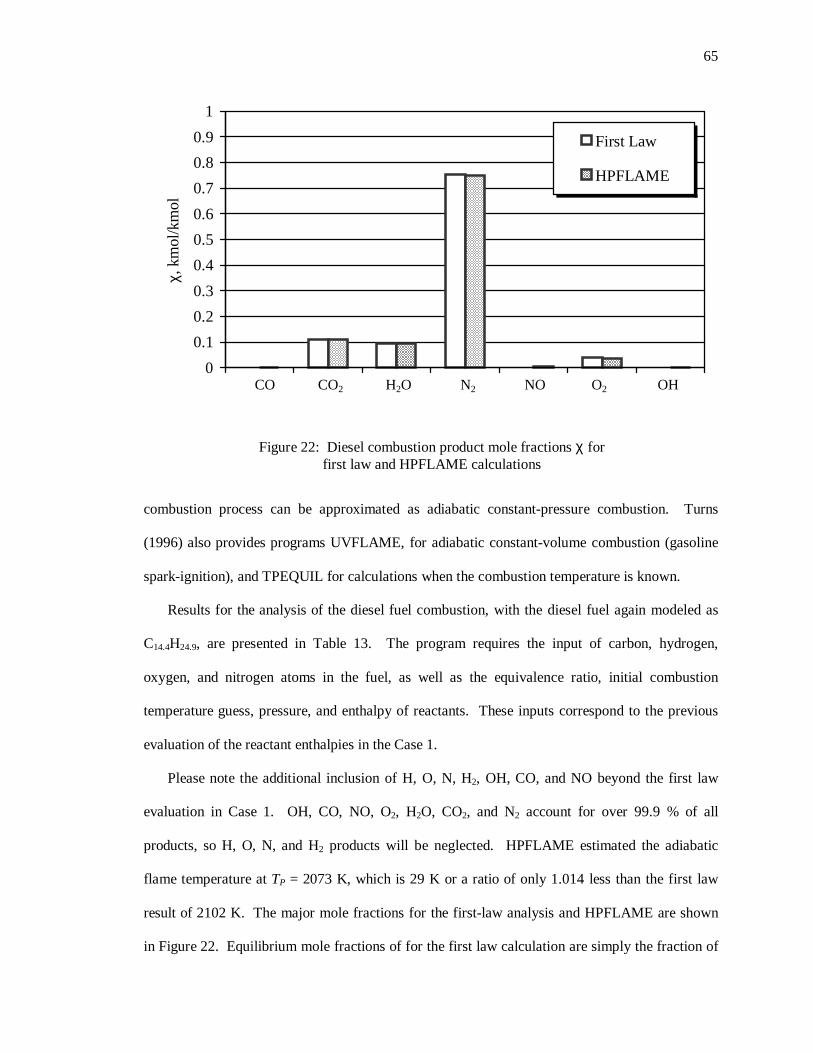
65
combustion process can be approximated as adiabatic constant-pressure combustion. Turns
(1996) also provides programs UVFLAME, for adiabatic constant-volume combustion (gasoline
spark-ignition), and TPEQUIL for calculations when the combustion temperature is known.
Results for the analysis of the diesel fuel combustion, with the diesel fuel again modeled as
C14.4H24.9, are presented in Table 13. The program requires the input of carbon, hydrogen,
oxygen, and nitrogen atoms in the fuel, as well as the equivalence ratio, initial combustion
temperature guess, pressure, and enthalpy of reactants. These inputs correspond to the previous
evaluation of the reactant enthalpies in the Case 1.
Please note the additional inclusion of H, O, N, H2, OH, CO, and NO beyond the first law
evaluation in Case 1. OH, CO, NO, O2, H2O, CO2, and N2 account for over 99.9 % of all
products, so H, O, N, and H2 products will be neglected. HPFLAME estimated the adiabatic
flame temperature at TP = 2073 K, which is 29 K or a ratio of only 1.014 less than the first law
result of 2102 K. The major mole fractions for the first-law analysis and HPFLAME are shown
in Figure 22. Equilibrium mole fractions of for the first law calculation are simply the fraction of
0
0.1
0.2
0.3
0.4
0.5
0.6
0.7
0.8
0.9
1
χ, k
mol
/km
ol
First Law
HPFLAME
CO2 H2OCO N2 NO O2 OH
Figure 22: Diesel combustion product mole fractions χ forfirst law and HPFLAME calculations
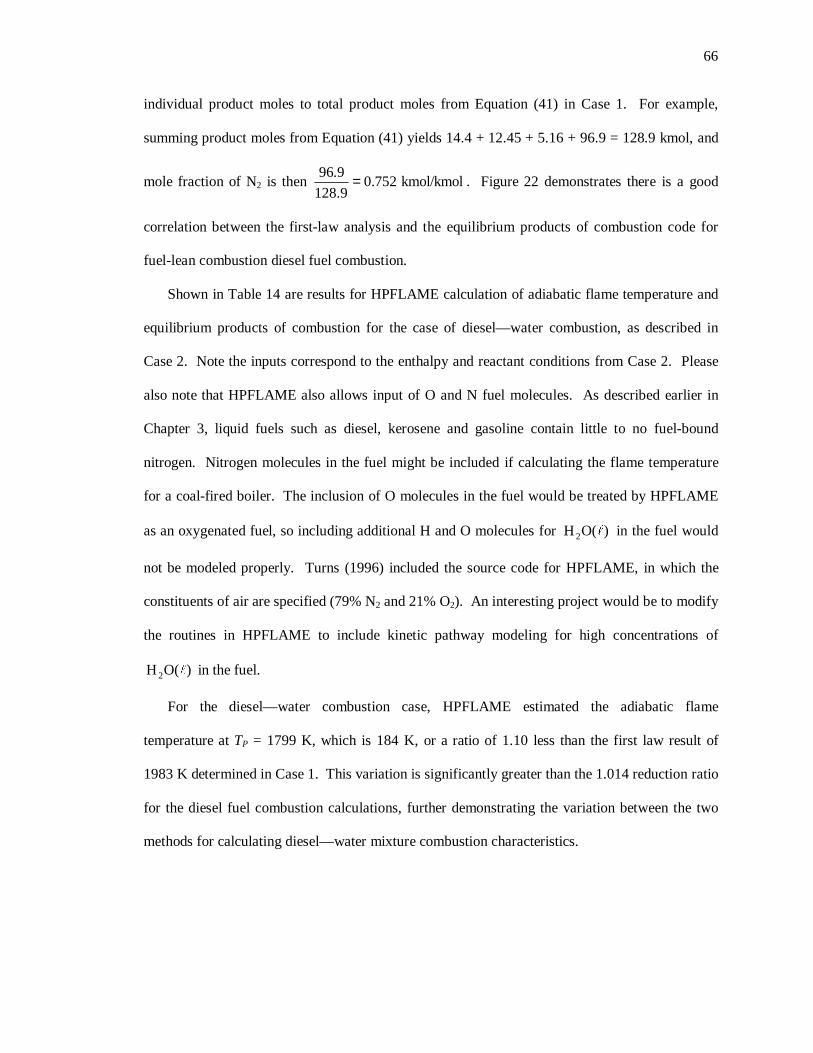
66
individual product moles to total product moles from Equation (41) in Case 1. For example,
summing product moles from Equation (41) yields 14.4 + 12.45 + 5.16 + 96.9 = 128.9 kmol, and
mole fraction of N2 is then kmol/kmol752.09.128
9.96 = . Figure 22 demonstrates there is a good
correlation between the first-law analysis and the equilibrium products of combustion code for
fuel-lean combustion diesel fuel combustion.
Shown in Table 14 are results for HPFLAME calculation of adiabatic flame temperature and
equilibrium products of combustion for the case of diesel—water combustion, as described in
Case 2. Note the inputs correspond to the enthalpy and reactant conditions from Case 2. Please
also note that HPFLAME also allows input of O and N fuel molecules. As described earlier in
Chapter 3, liquid fuels such as diesel, kerosene and gasoline contain little to no fuel-bound
nitrogen. Nitrogen molecules in the fuel might be included if calculating the flame temperature
for a coal-fired boiler. The inclusion of O molecules in the fuel would be treated by HPFLAME
as an oxygenated fuel, so including additional H and O molecules for )O(H2 " in the fuel would
not be modeled properly. Turns (1996) included the source code for HPFLAME, in which the
constituents of air are specified (79% N2 and 21% O2). An interesting project would be to modify
the routines in HPFLAME to include kinetic pathway modeling for high concentrations of
)O(H2 " in the fuel.
For the diesel—water combustion case, HPFLAME estimated the adiabatic flame
temperature at TP = 1799 K, which is 184 K, or a ratio of 1.10 less than the first law result of
1983 K determined in Case 1. This variation is significantly greater than the 1.014 reduction ratio
for the diesel fuel combustion calculations, further demonstrating the variation between the two
methods for calculating diesel—water mixture combustion characteristics.
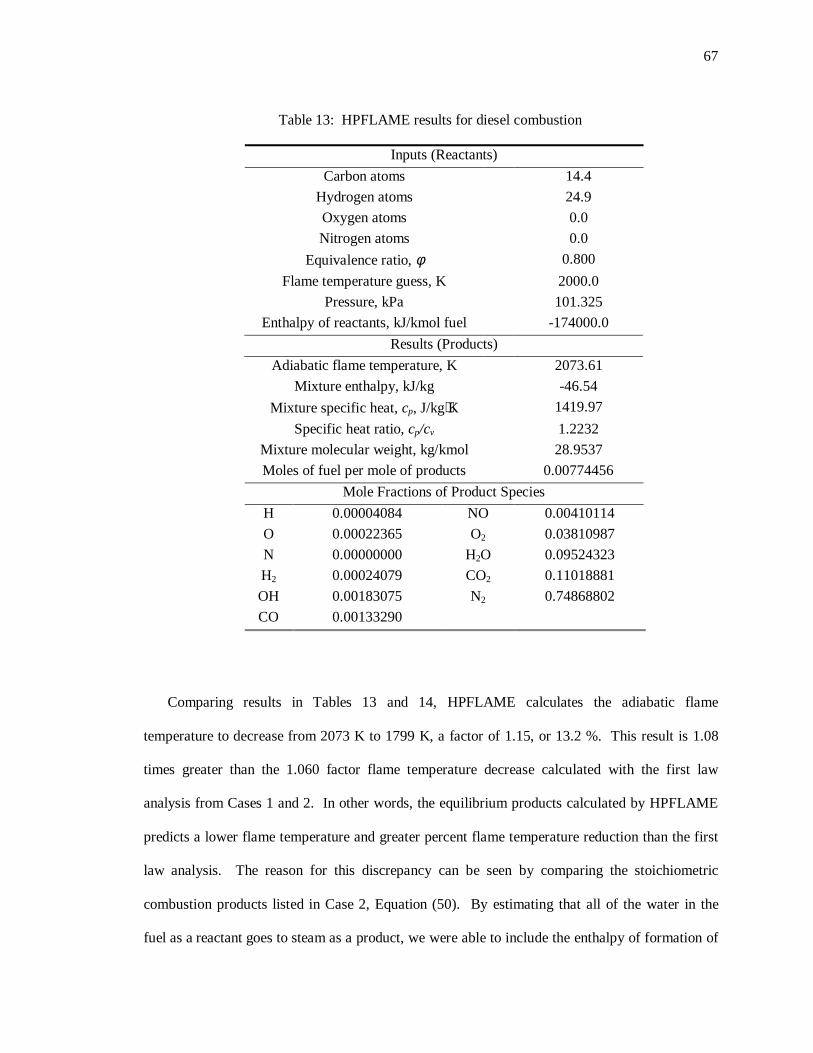
67
Comparing results in Tables 13 and 14, HPFLAME calculates the adiabatic flame
temperature to decrease from 2073 K to 1799 K, a factor of 1.15, or 13.2 %. This result is 1.08
times greater than the 1.060 factor flame temperature decrease calculated with the first law
analysis from Cases 1 and 2. In other words, the equilibrium products calculated by HPFLAME
predicts a lower flame temperature and greater percent flame temperature reduction than the first
law analysis. The reason for this discrepancy can be seen by comparing the stoichiometric
combustion products listed in Case 2, Equation (50). By estimating that all of the water in the
fuel as a reactant goes to steam as a product, we were able to include the enthalpy of formation of
Table 13: HPFLAME results for diesel combustion
Inputs (Reactants)
Carbon atoms 14.4
Hydrogen atoms 24.9
Oxygen atoms 0.0
Nitrogen atoms 0.0
Equivalence ratio, φ 0.800
Flame temperature guess, K 2000.0
Pressure, kPa 101.325
Enthalpy of reactants, kJ/kmol fuel -174000.0
Results (Products)
Adiabatic flame temperature, K 2073.61
Mixture enthalpy, kJ/kg -46.54
Mixture specific heat, cp, J/kg⋅K 1419.97
Specific heat ratio, cp/cv 1.2232
Mixture molecular weight, kg/kmol 28.9537
Moles of fuel per mole of products 0.00774456
Mole Fractions of Product Species
H 0.00004084 NO 0.00410114
O 0.00022365 O2 0.03810987
N 0.00000000 H2O 0.09524323
H2 0.00024079 CO2 0.11018881
OH 0.00183075 N2 0.74868802
CO 0.00133290
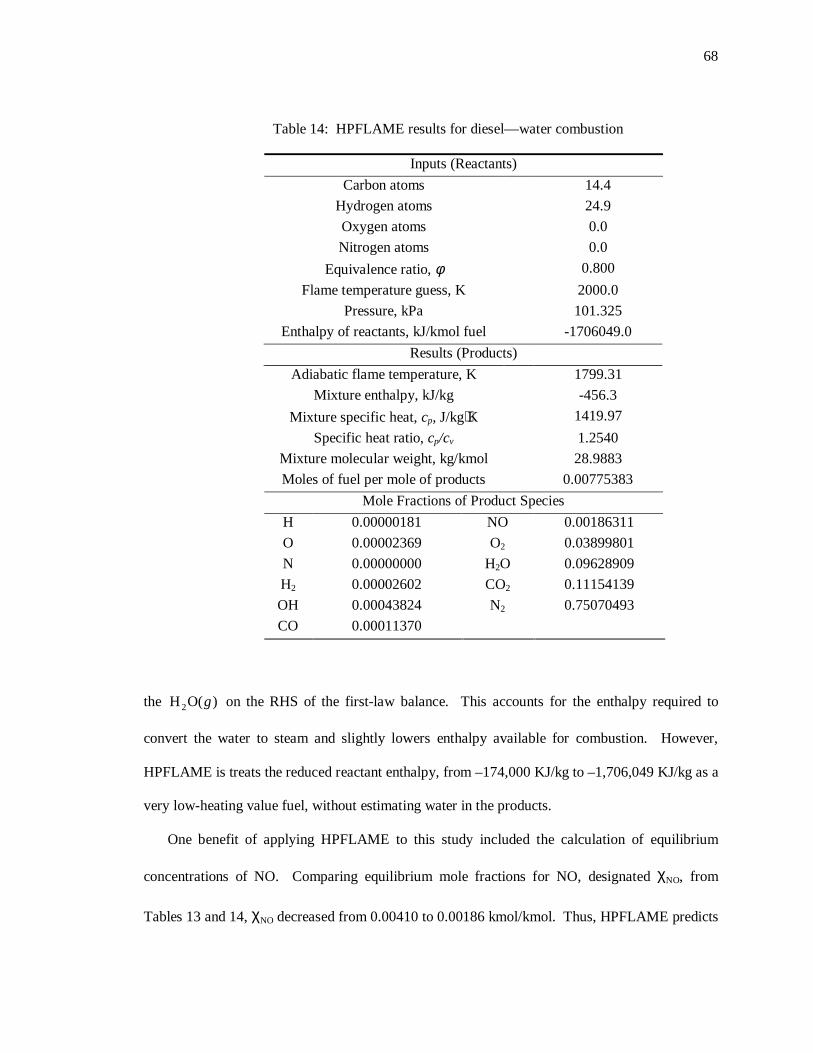
68
the )O(H2 g on the RHS of the first-law balance. This accounts for the enthalpy required to
convert the water to steam and slightly lowers enthalpy available for combustion. However,
HPFLAME is treats the reduced reactant enthalpy, from –174,000 KJ/kg to –1,706,049 KJ/kg as a
very low-heating value fuel, without estimating water in the products.
One benefit of applying HPFLAME to this study included the calculation of equilibrium
concentrations of NO. Comparing equilibrium mole fractions for NO, designated χNO, from
Tables 13 and 14, χNO decreased from 0.00410 to 0.00186 kmol/kmol. Thus, HPFLAME predicts
Table 14: HPFLAME results for diesel—water combustion
Inputs (Reactants)
Carbon atoms 14.4
Hydrogen atoms 24.9
Oxygen atoms 0.0
Nitrogen atoms 0.0
Equivalence ratio, φ 0.800
Flame temperature guess, K 2000.0
Pressure, kPa 101.325
Enthalpy of reactants, kJ/kmol fuel -1706049.0
Results (Products)
Adiabatic flame temperature, K 1799.31
Mixture enthalpy, kJ/kg -456.3
Mixture specific heat, cp, J/kg⋅K 1419.97
Specific heat ratio, cp/cv 1.2540
Mixture molecular weight, kg/kmol 28.9883
Moles of fuel per mole of products 0.00775383
Mole Fractions of Product Species
H 0.00000181 NO 0.00186311
O 0.00002369 O2 0.03899801
N 0.00000000 H2O 0.09628909
H2 0.00002602 CO2 0.11154139
OH 0.00043824 N2 0.75070493
CO 0.00011370
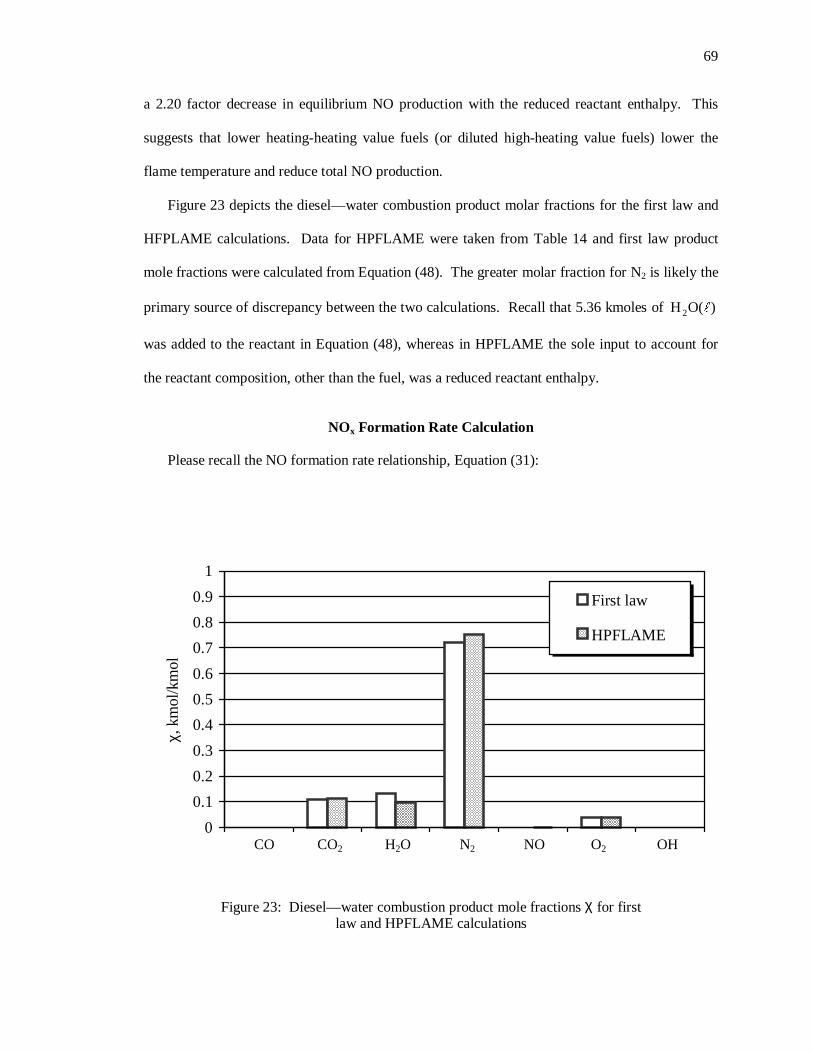
69
a 2.20 factor decrease in equilibrium NO production with the reduced reactant enthalpy. This
suggests that lower heating-heating value fuels (or diluted high-heating value fuels) lower the
flame temperature and reduce total NO production.
Figure 23 depicts the diesel—water combustion product molar fractions for the first law and
HFPLAME calculations. Data for HPFLAME were taken from Table 14 and first law product
mole fractions were calculated from Equation (48). The greater molar fraction for N2 is likely the
primary source of discrepancy between the two calculations. Recall that 5.36 kmoles of )O(H2 "
was added to the reactant in Equation (48), whereas in HPFLAME the sole input to account for
the reactant composition, other than the fuel, was a reduced reactant enthalpy.
NOx Formation Rate Calculation
Please recall the NO formation rate relationship, Equation (31):
0
0.1
0.2
0.3
0.4
0.5
0.6
0.7
0.8
0.9
1
χ, k
mol
/km
ol
First law
HPFLAME
CO2 H2OCO N2 NO O2 OH
Figure 23: Diesel—water combustion product mole fractions χ for firstlaw and HPFLAME calculations
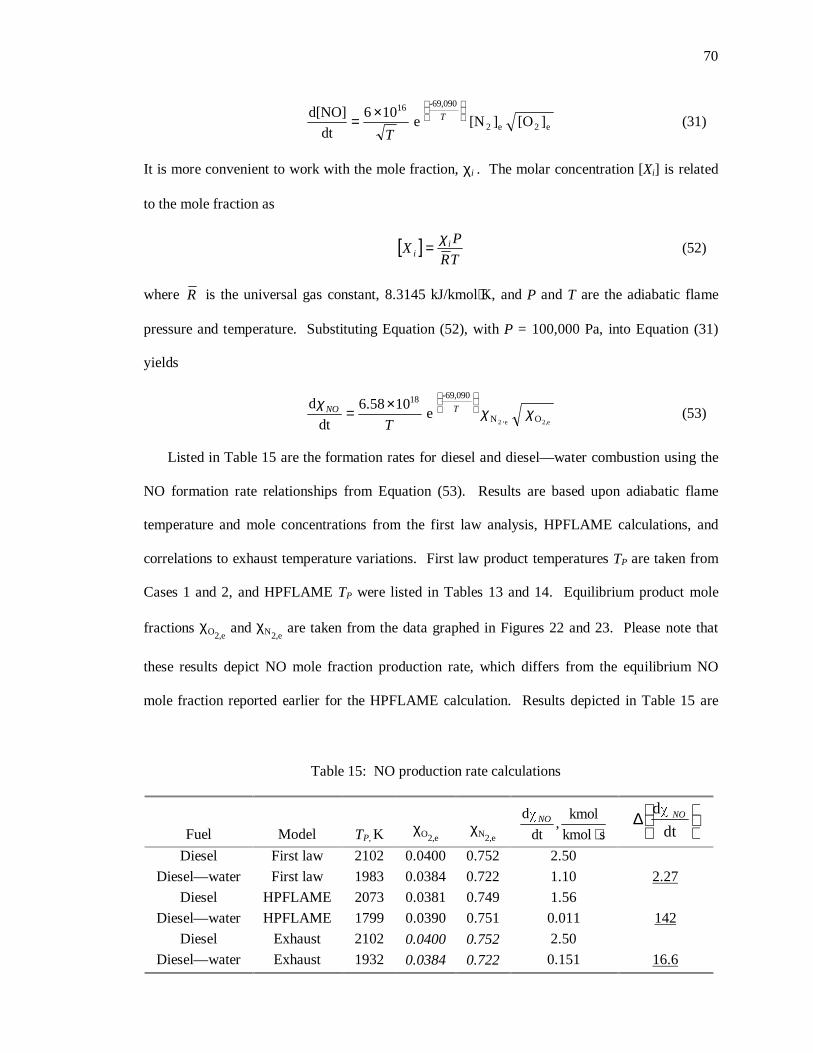
70
e2e2
-69,09016
][O][Ne106
dt
d[NO]
×= T
T(31)
It is more convenient to work with the mole fraction, χi . The molar concentration [Xi] is related
to the mole fraction as
[ ]TR
PX i
i
χ= (52)
where R is the universal gas constant, 8.3145 kJ/kmol⋅K, and P and T are the adiabatic flame
pressure and temperature. Substituting Equation (52), with P = 100,000 Pa, into Equation (31)
yields
e2,e,2 ON
-69,09018
e1058.6
dt
dχχχ
×= TNO
T(53)
Listed in Table 15 are the formation rates for diesel and diesel—water combustion using the
NO formation rate relationships from Equation (53). Results are based upon adiabatic flame
temperature and mole concentrations from the first law analysis, HPFLAME calculations, and
correlations to exhaust temperature variations. First law product temperatures TP are taken from
Cases 1 and 2, and HPFLAME TP were listed in Tables 13 and 14. Equilibrium product mole
fractions χO2,e and χN2,e
are taken from the data graphed in Figures 22 and 23. Please note that
these results depict NO mole fraction production rate, which differs from the equilibrium NO
mole fraction reported earlier for the HPFLAME calculation. Results depicted in Table 15 are
Table 15: NO production rate calculations
Fuel Model TP, K χO2,eχN2,e skmol
kmol,
dt
·d
⋅NO
∆
dt
·d NO
Diesel First law 2102 0.0400 0.752 2.50
Diesel—water First law 1983 0.0384 0.722 1.10 2.27
Diesel HPFLAME 2073 0.0381 0.749 1.56
Diesel—water HPFLAME 1799 0.0390 0.751 0.011 142
Diesel Exhaust 2102 0.0400 0.752 2.50
Diesel—water Exhaust 1932 0.0384 0.722 0.151 16.6
71
based upon flame temperature and equilibrium.
In summary, Equation (53) predicts NO mole fraction formation rate reduces 2.27, 142, and
16.6 times for diesel—water fuels, based upon data from the first law analysis, HPFLAME, and
exhaust temperature calculations, respectively. The HPFLAME NO mole production rate is
effectively zero for the diesel—water mixture. The greater reduction based upon HPFLAME data
is a result of the calculated 274 K flame temperature reduction, versus 119 K and 170 K for the
first law and exhaust temperature analyses, respectively. Additionally, the HPFLAME NO mole
fraction formation rate for diesel combustion (1.56 kmol/kmol⋅s) is initially 1.6 times less than
the first-law NO mole fraction formation rate (2.50 kmol/kmol⋅s). This is a result of the lower
diesel combustion flame temperature and equilibrium O2 and N2 mole fractions for HPFLAME.
Correlating these results to our experimental data could be conducted by either correlating
flame temperature to the exhaust temperature, or using relative exhaust temperature reductions, to
evaluate NO production rate reductions via Equation (53). Taking the latter approach, we refer
again to Figure 16 to compare the baseline diesel exhaust temperature to the diesel—water
mixture exhaust temperature. At 50 kW, the exhaust temperature decreases from 620 K to 570 K,
a -8.06% or 1.088 factor decrease. Applying this ratio to the adiabatic flame temperature
calculated in Case 1 for diesel combustion, 2102 K, yields an estimated flame temperature for the
diesel—water mixture of 1931 K. This result is also tabulated in Table 15. Please note in Table
15 that the first law and HPFLAME flame temperature reduction factors were 1.060 and 1.152,
respectively. Again, our first law analysis appears to be more accurate, correlating to our
experimental factor of 1.088 very closely. Equilibrium product mole fractions for oxygen and
nitrogen, χO2,e and χN2,e , are of secondary effect to temperature in Equation (53). Thus , χO2,e
and
χN2,e from the first law calculation were used for the exhaust temperature calculation. As shown
in Table 15, using the experimentally observed exhaust temperature reduction, correlating it to an
72
equivalent flame temperature reduction, and applying the empirical relationship in Equation (53)
yields a 16.6 factor decrease in NO mole fraction production rate.
Effects of Water Injection
Thermodynamic, physical, and chemical effects of water injection on the combustion process
discussed here and in the literature can be summarized as follows:
1. Microexplosions accelerate the diffusion of combustion through the cylinder, decreasing
the time required for combustion and increasing combustion efficiency
2. Water in the fuel decreases the heat content of the fuel, decreasing the energy output per
mass of total fuel.
3. The partial pressure of water may accelerate the water—gas reaction (Sawa and Kajitani,
1992).
The effect of microexplosions of liquid water present in fuel is considered in the literature to
be the primary mechanism for increasing combustion efficiency (Tsenev, 1983). Hsu (1986)
conclusively measured slight ignition delay resulting from water added to diesel fuel, and
attributed improved combustion to the delayed ignition improving the evaporation and mixing of
the fuel.
The high heat of vaporization of water in the fuel has been demonstrated here to lower the
adiabatic flame temperature. For individual engines and fuels there is a practical upper limit for
percent by volume water in the fuel, after which combustion would be sufficiently slowed to
significantly reduce the combustion efficiency. De Vita (1989) recommended an upper limit of
20 mass percent water in diesel, which corresponds to 45.5 volume percent water, to prevent
increasing the brake specific fuel consumption (BSFC) of the engine. If slight increases in BSFC
can be accepted, higher water ratios could be used.
Consideration is given in the literature to the extent that water added to the fuel modifies the
chemistry of combustion, possibly through increasing OH, H, and O radical formation and
73
oxidation chemistry. Combustion chemistry is undoubtedly affected by the contribution of water
to more-complete combustion, thus reducing the amount of unburned hydrocarbons and reducing
eventual soot formation. Greeves et al. (1976) and others theorize that water vapor is generally
present during combustion and that kinetic effects are distantly secondary to thermodynamic
effects in reducing NOx and soot formation. Following this line of reasoning can lead us to
conclude that the theoretical results calculated from a first law of thermodynamics combustion
balance and extended equilibrium products of combustion (HPFLAME) are representative of
actual results, and that chemical effects can be neglected for global approximations.
74
CHAPTER 6
CONCLUSIONS AND RECOMMENDATIONS
Results
The summary in Table 15 shows a lower flame temperature and resulting lower production
rate of NO is estimated by theory and was demonstrated by our experimental data. Our results
confirm the reports in the literature by many other researchers (Table 6), that water addition to
fuel lowers the flame temperature and suppresses thermal NOx formation. using a four-stroke
diesel-powered generator in common use by the U.S. Air Force,
A First Law of Thermodynamics calculation estimated a 1.06 factor decrease in adiabatic
flame temperature from the baseline case of diesel only and a diesel—water mixture of 30 percent
water, by volume. Equation (53) predicts a resultant 2.27 factor decrease in NO formation rate
for the diesel—water mixture. An equilibrium products of combustion code corroborated the
trend demonstrated by the first law calculation, with a 1.15 factor decrease in adiabatic flame
temperature and a corresponding 142 factor decrease in NO formation rate. Experimental data
shown in Figure 16 demonstrates this trend to decreased temperature, with exhaust temperature
decreasing a factor of 1.09 at 50 kW with 30 percent water in the fuel.
Figure 16 and Figure 19 demonstrated similar results for diesel—water and JP-8—water
mixtures, and Figures 17 and 18 demonstrated lower exhaust temperatures and NOx emissions
when delaying the fuel injection to the cylinder.
75
Conclusions
Our primary conclusion, which confirms the findings of researchers listed in Table 6 and the
References, is that water added to fuel lowers the flame temperature and suppresses the formation
of thermal NOx in internal combustion engines. Our calculations estimated factor decreases of
flame temperature of 1.06 and 1.15, with a corresponding NO formation rate decreases of 2.27
and 142, when adding water to fuel.
Our results also lead us to conclude that NOx reduction from fuel injection timing delay and
improved injector design, as demonstrated in Figure 15 and Figure 20, is also probably due to a
reduced flame temperature. Figure 20 shows a trend to lower exhaust temperature and lower NOx
emissions with increased timing delay, which corresponds to the trend for water added to the fuel.
In general, we can conclude from the reported data that fuel—water mixtures are an effective
option to reducing NOx emissions from diesel engines without requiring modifications to the
engine, if a lower full load is acceptable. By installing larger fuel injectors, the diesel engine can
attain the original load level, as shown by Figure 17.
Recommendations for Further Study
Planned research includes further testing and refinement of the fuel emulsification additives.
As shown by Montagne et al. (1987), adding surfactants to fuel can increase emissions of NOx.
To minimize both increased emissions and fuel costs due to surfactants, one should use the
minimum level of surfactant necessary to stabilize the fuel—water mixture. A factorial analysis
should be conducted varying fuel, water, surfactant, and other additive concentrations to
determine first- and second-order effects.
The mixing time required to develop a stable emulsion is best determined empirically.
Again, a factorial analysis varying the water and fuel ratios versus mixing power and time should
be conducted to establish a matrix of mixing times required to guarantee a stable emulsion.
76
The need for a corrosion inhibitor should be quantified through visual and wear-metal testing
on engine components after extended use of fuel—water blends both with and without a corrosion
inhibitor. The added cost of the corrosion inhibitor should be firmly established and
demonstrated as a necessity to protect the engine and components, not simply a precaution to
subdue suspicions of corrosion potential. If a corrosion inhibitor is demonstrated as necessary,
GC/MS analysis of exhaust emissions across all load ranges should be conducted to determine if
corrosion inhibitor components are emitted from the engine. Worker safety concerns require
monitoring to demonstrate that the xylene and ethylbenzene components common in corrosion
inhibitors are fully combusted.
Ongoing investigations indicate difficulties in cold-start with the fuel mixtures containing
water. Several factors likely contribute to this problem, including the lower heating value of the
fuel when combined with water. When cooled, the water in the fuel raises the auto-ignition
temperature of the fuel mixture. Initial tests indicate pre-warming the fuel is an effective option
to enhance auto-ignition of the diesel—water emulsions. We recommend a test program to
evaluate the temperature relationship, model the thermodynamic effects, and design and install a
fuel tank heating unit on a diesel engine to improve cold-start.
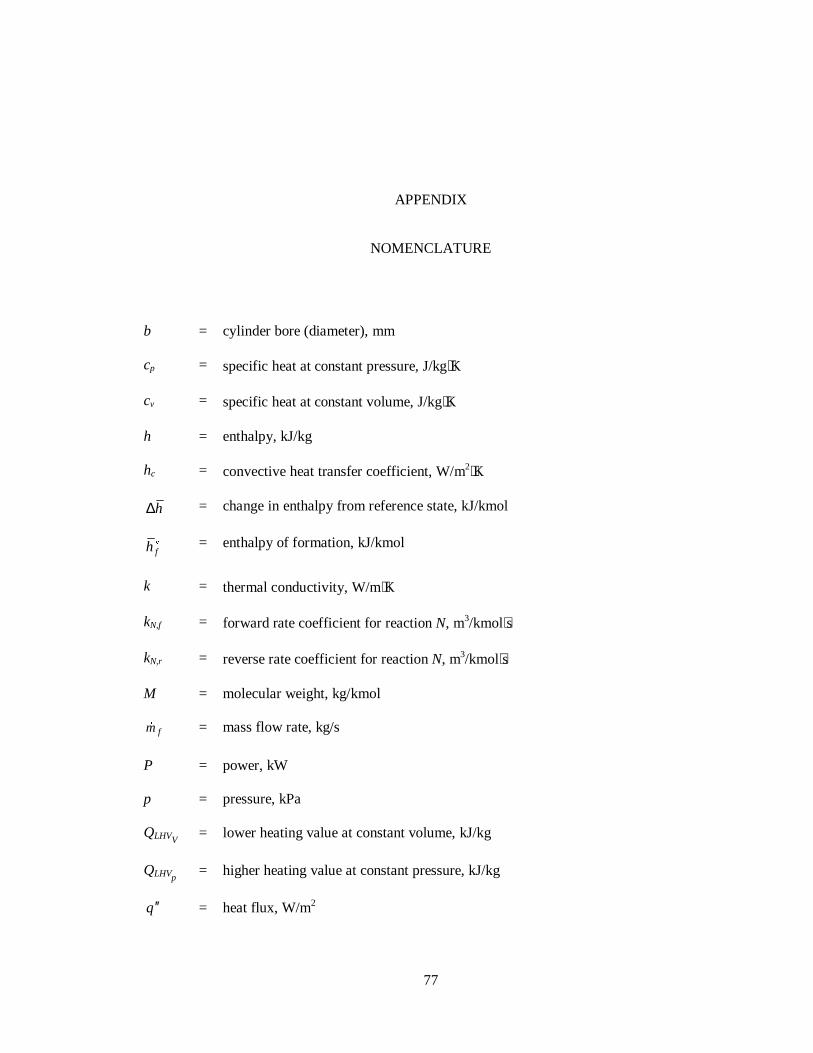
77
APPENDIX
NOMENCLATURE
b = cylinder bore (diameter), mm
cp = specific heat at constant pressure, J/kg⋅K
cv = specific heat at constant volume, J/kg⋅K
h = enthalpy, kJ/kg
hc = convective heat transfer coefficient, W/m2⋅K
h∆ = change in enthalpy from reference state, kJ/kmol
$
fh = enthalpy of formation, kJ/kmol
k = thermal conductivity, W/m⋅K
kN,f = forward rate coefficient for reaction N, m3/kmol⋅s
kN,r = reverse rate coefficient for reaction N, m3/kmol⋅s
M = molecular weight, kg/kmol
fm� = mass flow rate, kg/s
P = power, kW
p = pressure, kPa
QLHVV= lower heating value at constant volume, kJ/kg
QLHVp= higher heating value at constant pressure, kJ/kg
q ′′ = heat flux, W/m2
78
CONDq ′′ = conductive heat flux, W/m2
CONVq ′′ = convective heat flux, W/m2
RADq ′′ = radiative heat flux, W/m2
R = universal gas constant, 8.3145 kJ/kmol⋅K
rc = compression ratio, m3/m3
s = specific entropy, kJ/kg⋅K
T = temperature, K
Te = exhaust temperature, K
WCV = work done on control volume, kJ
Greek Symbols
ε = emissivity, 0 ≤ ε ≤ 1
ρ = density, kg/m3
σ = Stefan-Boltzman constant, 5.67 x 10⁻⁸ W/m2⋅K4
v = specific volume, m3/kg
[Xi] = molar concentration, ppm
χi = mole fraction
dt
·d i = mole fraction production rate, kmol⋅s-1/kmol
79
REFERENCES
Abdel-Rahman, A.A., 1998, “On the Emissions from Internal-Combustion Engines: A Review,”Int. J. Energy Res., Vol. 22, pp. 483-513.
Afify, E.M., 1985, “Performance Combustion Characteristics and Exhaust Emission of a DirectInjection Diesel Engine Using Water/Oil Emulsions as a Fuel,” DTIC No. ADA-161-652, U.S.Army Research Office, Research Triangle Park, NC.
Afify, E.M., Korah, N.S., and Dickey, D.W., 1987, “The Effect of Air Charge Temperature onPerformance, Ignition Delay and Exhaust Emissions of Diesel Engines Using W/O Emulsions asFuel,” SAE Paper 870555.
Akridge, R.J., Donegan, B.M., Rolader, G.E., Bienvenue, D.R., Verge, R.E., and Elliot,D., 1997,“Reduction of Nitrogen Oxides Emitted by Aerospace Ground Equipment at March ARB,” PaperNo. 97-TA36A.01, Proceedings of the Air & Waste Management Association’s 90th AnnualMeeting & Exhibition, June 8-13, 1997, Toronto, Ontario, Canada.
Andrews, G.E., Bartle, S. W., Pang. S.W., Nurein, A.M., and Williams, P.T., 1989, “Diesel/WaterEmuslions: Influence on Ignition Delay and Emissions,” Spalding, D. Brian and Afgan, N.H., ed.Heat and Mass Transfer in Gasoline and Diesel Engines, Proceedings of the International Centrefor Heat and Mass Transfer, No. 26, Hemisphere Publishing Corp., New York, NY, pp. 613-625.
Antonov, V.N., 1983, “Features of Preparation of Water-Fuel Emulsions for Diesel Engines,”Chemistry and Technology of Fuels and Oils, Vol. 19, No. 11-12, pp. 606-609.
Avallone, E.A. and Baumeister III, T, 1996 Marks’ Standard Handbook for MechanicalEngineers, 10th Ed., McGraw-Hill, Inc., New York, NY.
Borman, G.L. and Ragland, K.W, 1998, Combustion Engineering, McGraw-Hill, Inc., New York,NY.
Campbell, A.S, 1979, Thermodynamic Analysis of Combustion Engines, John Wiley & Sons,New York, NY.
Canfield, C.A, 1996, “NOx Control for Aircraft and Aircraft Support Operations,” Proceedings ofthe Second Annual Strategic Environmental Research and Development Program (SERDP)Symposium, December 1996, Tyson’s Corner, VA.
Canfield, C.A. and Wander, J.D, 1996, “Applications of Non-Thermal Plasmas for Control ofNOx and VOCs from U.S. Air Force Operations,” Proceedings of the International Workshop onPlasma Technologies for Pollution Control and Waste Treatment, Beijing China, May 1996,Beijing Institute of Technology.
80
Canfield, C.A., Babyak, R.A., and Wander, J.D., 1997, “Demonstration of a Filter Cart for NOxRemoval from Ground Support Equipment,” Technical Report No. AL/EQ-TP-1997-0001, U.S.Air Force Research Laboratory, Tyndall AFB, FL.
Coon, C.W., Jr., 1981, “Multi-Cylinder Diesel Engine Tests with Unstabilized Water-in-FuelEmulsions,” SAE Technical Paper 810250.
Corbitt, R.A., 1990, Standard Handbook of Environmental Engineering, McGraw-Hill, Inc., NewYork, NY.
Crookes, R.J., Nazha, M.A.A., and Kiannajad, F., 1990, “A Comparison of Ignition andEmissions Characteristics for Alternative Diesel Fuels and Emulsions,” I. Mech. E. Seminar, pp.47-52.
De Vita, A., 1989, “Multi-Cylinder D.I. Diesel Engine Tests with Unstabilized Emulsion ofWater and Ethanol in Diesel Fuel,” SAE Paper 890450.
Dryer, F.L., 1975, “Fundamental Concepts on the Use of Emulsions as Fuels,” West and CentralStates Sect, Joint Spring Meeting, San Antonio TX, Apr 1975, Combustion Institute.
Dryer, F.L., 1976, ”Water Addition to Practical Combustion Systems –Concepts andApplications,” 16th Symposium (Intl.) on Combustion, Cambridge MA, Aug 1976, CombustionInstitute.
Durand, G.P. and Montgomery, J.D., 1995, “Source Test Report: Development of EmissionFactors for Nitrogen Oxides, Sulfur Dioxide, Carbon Monoxide, Nonmethane Hydrocarbons, andParticulate Matter for Selected Aircraft Ground Equipment at March Air Force Base, California,”U.S. Air Force Armstrong Laboratory, AL/OEBE, Brooks AFB TX.
Ekert, E.R.G. and Drake, Jr., Robert M, 1987, Analysis of Heat and Mass Transfer, HemispherePublishing Corp., New York, NY.
Energy Efficiency Systems, Inc., 1995, “ENERAC Integrated Emissions System Model 3000Instruction Manual,” Revision 6, December 1995, Westbury, NY.
Estefan, R.M., and Brown, J.G., 1990, “Evaluation of Possible Methanol Fuel Additives forReducing Engine Wear and/or Corrosion,” SAE Paper 902153, Methanol Fuel Formulations andIn-Use Experiences, SP-840, pp. 17-39.
Federle, S.P., Wander, J., Rogers, J., Nejezchleb, A., and Canfield, A., 1998, “A Non-ThermalPlasma Discharge Based Exhaust Gas Treatment System for the A/M32A-86 Diesel PoweredGenerator,” Technical Report No. AFRL-MN-EG-TR-1998-7085, AFRL/MNMW, Eglin AFB,FL.
Fujita, N., Nagahura, K., and Tsunokake, S., 1987, “The Effect of Gas Oil-Water-MethanolEmulsified Fuel on Diesel Engine Performance,” Trans. of the Japan Society of MechanicalEngineers, Vol. 53, No. 486, pp. 654-658.
Ganesan, V, 1996, Internal Combustion Engines, McGraw-Hill, Inc., New York, NY.
81
Greeves, G., Khan, I.M., and Onion, G., 1976, “Effects of Water Introduction on Diesel EngineCombustion and Emissions,” Proceedings, 16th Annual Symposium (Int.) on Combustion,Williams & Wilkins Co., pp. 321-336.
Herbstman, S. and Virk, K., 1989, “Effect of Diesel Fuel Composition and Additives on theBuildup of Injector Deposits,” SAE Technical Paper 892119, Proceedings, International Fuelsand Lubricants Meeting and Exposition, pp. 25-40.
Heywood, J.B., 1988, Internal Combustion Engine Fundamentals, McGraw-Hill, Inc., New York,NY.
Hsu, B.D., 1986, “Combustion of Water-in-Diesel Emulsion in an Experimental Medium SpeedDiesel Engine,” SAE Paper 860300
Johnson, R.T. and Stoffer, J.O., 1983, “Single Cylinder Engine Evaluations of Stabilized DieselFuels Containing Alcohols,” SAE Paper 830559, Alternate Fuels for Spark Ignition and DieselEngines, SP-542, pp. 105-121.
Kays, W.M., 1989, “Heat Transmission from the Engine to the Atmosphere,” Spalding, D. Brianand Afgan, N.H., ed. Heat and Mass Transfer in Gasoline and Diesel Engines, Proceedings ofthe International Centre for Heat and Mass Transfer, No. 26, Hemisphere Publishing Corp., NewYork, NY.
Larsen, C., Oey, F., and Levendis, Y.A., 1996, “An Optimization Study of the Control of NOxand Particulate Emissions from Diesel Engines,” SAE Paper 960473.
Lavoie, G.A., Heywood, J.B., and Keck, J.C., 1970, “Experimental and Theoretical Investigationof Nitric Oxide Formation in Internal Combustion Engines,” Combustion Science Technology,Vol. 1, pp. 313-326.
Lebedev, O.N., and Nosov, V.P., 1980, “Efficiency of Use of Water-Fuel Emulsions in Medium-Speed Marine Diesels,” Chem. Tech. Fuels Oils, Vol 16, No. 11-12, pp. 738-740.
Liu, Z., Xu, S., and Deng, B, 1993, “A Study of Methanol-Gasoline Corrosivity and itsAnticorrosive Agent,” Proceedings, 10th International Symposium on Alcohol Fuels, Nov. 1993,Colorado Springs, CO.
Marelli, E., 1995, “Diesel Fuel Emulsion,” U.S. Patent 5,445,656, United States Patent andTrademark Office.
Montagne, X., Herrier, D., and Guibet, J.-C., 1987, “Fouling of Automotive Diesel Injectors—Test Procedure, Influence of Composition of Diesel Oil and Additives,” SAE Paper 872118.
Moran, M.J. and Shapiro, H.N, 1988, Fundamentals of Engineering Thermodynamics, JohnWiley & Sons, Inc., New York, NY.
Murayama, T., Morishama, Y., Tsukahara, M., and Miyamoto, N., 1978, “ExperimentalReduction of NOx, Smoke, and BSFC in a Diesel Engine Using Uniquely Produced Water (0-80%) to Fuel Emulsion,” SAE Paper 780224.
82
Nagese, K. and Funatsu, K., 1990, “A Study of NOx Generation Mechanism in Diesel ExhaustGases,” SAE Paper 901615.
Nakatsuji, T., Yasukawa, K., Tabata, K., Ueda, K., and Niwa, M., 1998, “Catalytic ReductionSystem of NOx in Exhaust Gases from Diesel Engines with Secondary Fuel Injection,” AppliedCatalysis B: Environmental, Vol. 17, pp. 333-345.
Obert, E.F., 1973, Internal Combustion Engines and Air Pollution, Harper & Row Publishers,Inc., New York, NY.
Olikara, C. and Borman, G.L., 1975, “A Computer Program for Calculating Properties ofEquilibrium Combustion Products with Some Applications to I.C. Engines,” SAE Paper 750468.
O’Neal, G.B., Storment, J.O., and Waytulonis, R.W., 1981, “Control of Diesel Exhaust Emissionsin Underground Coal Mines—Single Cylinder Engine Experiments with Modified and Non-Conventional Fuels,” SAE SP-495, Diesel Combustion and Emission Part 3, Int. Off-HighwayMeeting & Exposition, Milwaukee, WI, pp. 13-23.
Peter-Hoblyn, J.D., and Valentine, J.M., 1996, “Reduction of Nitrogen Oxides Emissions fromVehicular Diesel Engines,” U.S. Patent 5,584,894, United States Patent and Trademark Office.
Peter-Hoblyn, J.D., Valentine, J.M., and Dubin, L., 1998, “Enhanced Lubricity Diesel FuelEmulsions for Reduction of Nitrogen Oxides,” U.S. Patent 5,743,922, United States Patent andTrademark Office.
Pischinger, R., 1987, “The Importance of Heat Transfer to IC Engine Design and Operation,”Spalding, D.B., editor, Heat and Mass Transfer in Gasoline and Diesel Engines, Proceedings ofthe International Centre for Heat and Mass Transfer, No. 26, Hemisphere Publishing Corp., NewYork, NY.
Ramos, J.I., 1989, “Mathematical Models of Diesel Engines,” Markatos, N.C., ed, ComputerSimulations for Fluid Flow, Heat and Mass Transfer, and Combustion in Reciprocating Engines,Proceedings of the International Centre for Heat and Mass Transfer, No. 27, HemispherePublishing Corp., New York, NY.
Rolader, G.E., Rogers, J.W., Nejezchlab, A.J., Federle, S.P., Littrell, D.M., Wander, J., andCanfield, C.A, 1997, “Non-Thermal Plasma Discharge Based NOx Removal System for DieselEngine Exhaust,” Paper No. 97-MP5.07, Proceedings of the Air & Waste ManagementAssociation’s 90th Annual Meeting & Exhibition, June 8-13, Toronto, Ontario, Canada.
Sawa, N., and Kajitani, S., 1992, “Physical Properties of Emulsion Fuels (Water/Oil-Type) andIts Effect on Engine Performance under Transient Operation,” SAE Paper 920198, InternationalCongress & Exposition, Detroit MI.
Schwab, S.D., 1997, “Emulsion Diesel Fuel Composition with Reduced Emissions,” U.S. Patent5,669,938, United States Patent and Trademark Office.
SM-ALC/TISEA, 1986, “Technical Manual, Operator/Crew Organizational Maintenance Manual:Generator Set, Diesel Engine Driven, Wheel Mtd., 72kW 3 Phase, 4 Wire, 115/200 Volts,”Technical Order No. 35C2-3-469-1, McClellan AFB, CA.
83
Smith, E.J. and Jordan, D.R., 1983, “The Use of Surfactants in Preventing Phase Separation ofAlcohol Petroleum Fuel Mixtures,” SAE Paper 830385, Alternate Fuels for Spark Ignition andDiesel Engines, SP-542, pp. 37-42.
Tsenev, V.A., 1983, “Features of Diesel Operation on Water—Fuel Emulsions,” Translated fromKhimiya I Tekhnologiya Topliv I Masel, No. 12, pp. 12-14.
Turns, S.R., 1996, An Introduction to Combustion: Concepts and Applications, McGraw-Hill,Inc., New York, NY.
Ulrich, A. and Kessler, A., 1992, “Method and Apparatus for Producing a Water-in-Fuel-Emulsion and Emulsifier-Free Water-in-Fuel-Emulsion,” U.S. Patent 5,125,367, United StatesPatent and Trademark Office.
Urbach, H.B., Knauss, D.T., Emory, J., Wallace, B.L, Wasser, J.A., Sexton, M.R., and Frese, J.,1997, “The Reduction of NOx Emissions from Marine Power Plants,” Paper No. 97-MP5.08,Proceedings of the Air & Waste Management Association’s 90th Annual Meeting & Exhibition,June 8-13, 1997, Toronto, Ontario, Canada.
U.S. Department of Defense, 1995, “Military Specification Fuel, Naval Distillate”, Naval SeaSystems Command, Washington D.C., Specification No. MIL-F-16884J.
U.S. EPA, 1995, “Determination of Nitric Oxide, Nitrogen Dioxide and NOx Emissions fromStationary Sources by Electrochemical Analyzer,” Emission Measurement Center (EMTIC),Technical Support Division, Office of Air Quality Planning and Standards, Research TrianglePark, NC.
Valdmanis, E. and Wulforst, D.E., 1970, “The Effect of Emulsified Fuels and Water Induction onDiesel Combustion,” SAE Paper 700736.
Vichnievsky, R., 1975, “Use of Water-Fuel Emulsions in Diesel Engines,” 11th Congress (Int) onCombustion, Barcelona Spain, May 1975.
Westbrook, C.K., and Dryer, F.L., 1981, “Chemical Kinetics and Modeling of CombustionProcesses,” 18th Symposium (Int.) on Combustion, Waterloo, Ontario, Canada, pp. 749-767: TheCombustion Institute.
Yanagihara, H., 1997, “Simultaneous Reduction of NOx and Soot in Diesel Engines Using a NewMixture Preparation Method,” JSME International Journal, Series B, Vol. 40, No. 4, pp. 592-598.
Yoshihara, S., Okabe, M., and Nakamaura, T., 1996, “Water Injecting Type Diesel Engine,” U.S.Patent 5,522,349, United States Patent Office.

84
Yoshimoto, Yasufumi, Tsukarhara, Minoru, Muryama, and Tadashi, 1989, “Studies on theMicroexplosion of Emulsified Fuels,” Nippon Kikai Gakkai Ronbunshun B Hen, Vol. 55, No.519, pp. 3538-3543.
Zhou, Q.-B., Wei, X.-Y., Zhu, T.-Z., 1987, “Radiation Heat Transfer in DI Diesel Engines,”Spalding, D.B., editor, Heat and Mass Transfer in Gasoline and Diesel Engines, Proceedings ofthe International Centre for Heat and Mass Transfer, No. 26, Hemisphere Publishing Corp., NewYork, NY.
85
BIOGRAPHICAL SKETCH
Charles Alan Canfield was born at Chanute AFB, Illinois, and raised in Independence,
Missouri. While attending the University of Missouri-Columbia, he was active in the Engineer’s
Club, Pi Kappa Alpha fraternity, and held an engineering internship with the 3M Corporation.
Mr. Canfield received his Bachelor of Science in mechanical engineering in December 1991.
Mr. Canfield has been employed by Applied Research Associates, Inc. at Tyndall AFB,
Florida, since 1993, supporting research programs for the Air Force Research Laboratory Airbase
& Environmental Technologies Division. He is presently conducting catalytic studies with an
advanced plug-flow annular reactor system. Currently the President of the Gulf Coast Chapter of
the Florida Engineering Society, a state society of the National Society of Professional Engineers,
he is a registered Professional Engineer in Florida. He is also a member of the Board of Advisors
of the Gulf Coast Community College Civil Engineering Technologies Department, the Board of
Directors of Girls Inc., and active in the Bay County Chamber of Commerce.
Upon completion of the Master of Science degree, Mr. Canfield will pursue studies in
coordination with his in-house catalytic reaction engineering research. The research reported
herein will be continued if sufficient funding and time is appropriated. Additional courses in
chemistry and kinetic modeling will be pursued to enhance the understanding of the combustion
process.
Mr. Canfield’s past-times include road cycling and distance running, beach volleyball,
working on his house and yard, keeping his old truck running, and collecting engineering
references and textbooks.
Related Documents