Effects of climate variability on carbon sequestration among adjacent wet sedge tundra and moist tussock tundra ecosystems Hyo-Jung Kwon, 1,2 Walter C. Oechel, 1 Rommel C. Zulueta, 1 and Steven J. Hastings 1 Received 16 March 2005; revised 20 February 2006; accepted 7 April 2006; published 28 September 2006. [1] Temporal and spatial variability in the Arctic introduces considerable uncertainty in the estimation of the current carbon budget and Arctic ecosystem response to climate change. Few representative measurements are available for land-surface parameterization of the Arctic tundra in regional and global climate models. In this study, the eddy covariance technique was used to measure net ecosystem CO 2 exchange (NEE) of Alaskan wet sedge tundra and moist tussock tundra ecosystems during the summer (i.e., 1 June to 31 August) from 1999 to 2003 in order to quantify the seasonal and spatial variability in NEE and to determine controlling factors on NEE in these tundra ecosystems. Warmer and drier conditions prevailed for the moist tussock tundra compared with that of the wet sedge tundra. Over the 5-year period, the wet sedge tundra was a sink for carbon of 46.4 to 70.0 gC m 2 season 1 , while the moist tussock tundra either lost carbon of up to 60.8 gC m 2 season 1 or was in balance. The contrasting patterns of carbon balance at the two sites demonstrate that ecosystem difference can be more important in determining landscape NEE than intraseasonal and interseasonal variability due to environmental factors with respect to NEE. The wet sedge tundra showed an acclimation (e.g., over days) to temperature, while the moist tussock tundra illustrated a strong temperature dependence. Warming and drying accentuated ecosystem respiration in the moist tussock tundra, causing a net loss of carbon. Better characterization of spatial variability in NEE and associated environmental controls is required to improve current and future estimates of the Arctic terrestrial carbon balance. Citation: Kwon, H.-J., W. C. Oechel, R. C. Zulueta, and S. J. Hastings (2006), Effects of climate variability on carbon sequestration among adjacent wet sedge tundra and moist tussock tundra ecosystems, J. Geophys. Res., 111, G03014, doi:10.1029/2005JG000036. 1. Introduction [2] A better understanding of the carbon budget in the Arctic region is essential for accurate assessment and prediction of regional responses and associated feedbacks on climate change [Chapin et al., 2005]. The Arctic has an important role in the global carbon budget due to the presence of up to 190 Gt of carbon currently stored in cold tundra soils [Post et al., 1982; Schlesinger, 1991; Hobbie et al., 2000] and the potential for substantial positive feed- backs to global climate change through enhanced soil respiration and carbon release to the atmosphere under a projected warmer and drier climate [Maxwell, 1992; Oechel et al., 1993; Oechel and Vourlitis, 1994; Ping et al., 1997; Vourlitis and Oechel, 1997; Grogan and Chapin, 2000]. Recent observations report that thermal profiles of perma- frost and northern latitude temperature records have risen 2° –4°C across northern Alaska and Canada during the last few decades [Lachenbruch and Marshall, 1986; Oechel et al., 1993; Osterkamp and Romanovsky , 1999]. This change in temperature will eventually affect the hydrology and thermal regime as well as feedback processes of Arctic tundra ecosystems which will ultimately influence the direction and magnitude of the carbon budget of the Arctic tundra region [Tieszen et al., 1980; Kane et al., 1991; Chapin and Shaver, 1996; Johnson et al., 1996, 2000; Oechel et al., 2000b; Chapin et al., 2005]. [3] Modeling efforts have been conducted in an attempt to understand the regional carbon balance over the Arctic [Clein et al., 2000; McGuire et al., 2000; Oechel et al., 2000a; Vourlitis et al. , 2003]. Owing to the lack of representative measurements, a single land-surface param- eterization for the Arctic tundra is used in regional and global climate models [McGuire et al., 1992; Bonan, 1995; Lynch et al., 1995; Clein et al., 2000]. Model simulation studies of terrestrial carbon dynamics give a wide range of predictions ranging from small to large carbon sinks and sources for high latitude regions [Wang and Polglase, 1995; King et al., 1997; Xiao et al., 1998; Clein et al., 2000]. These differing carbon flux estimates arise in part from a lack of information and understanding regarding the spatial and temporal variability of Arctic carbon dynamics and associated physical and environmental controls on these processes [Walker et al., 1989; McFadden et al., 1998; Vourlitis et al., 2000b]. JOURNAL OF GEOPHYSICAL RESEARCH, VOL. 111, G03014, doi:10.1029/2005JG000036, 2006 Click Here for Full Articl e 1 Global Change Research Group, Department of Biology, San Diego State University, San Diego, California, USA. 2 Now at Department of Botany, University of Wyoming, Laramie, Wyoming, USA. Copyright 2006 by the American Geophysical Union. 0148-0227/06/2005JG000036$09.00 G03014 1 of 18

Welcome message from author
This document is posted to help you gain knowledge. Please leave a comment to let me know what you think about it! Share it to your friends and learn new things together.
Transcript
Effects of climate variability on carbon sequestration among adjacent
wet sedge tundra and moist tussock tundra ecosystems
Hyo-Jung Kwon,1,2 Walter C. Oechel,1 Rommel C. Zulueta,1 and Steven J. Hastings1
Received 16 March 2005; revised 20 February 2006; accepted 7 April 2006; published 28 September 2006.
[1] Temporal and spatial variability in the Arctic introduces considerable uncertainty inthe estimation of the current carbon budget and Arctic ecosystem response to climatechange. Few representative measurements are available for land-surface parameterizationof the Arctic tundra in regional and global climate models. In this study, the eddycovariance technique was used to measure net ecosystem CO2 exchange (NEE) of Alaskanwet sedge tundra and moist tussock tundra ecosystems during the summer (i.e., 1 June to31 August) from 1999 to 2003 in order to quantify the seasonal and spatial variabilityin NEE and to determine controlling factors on NEE in these tundra ecosystems. Warmerand drier conditions prevailed for the moist tussock tundra compared with that of thewet sedge tundra. Over the 5-year period, the wet sedge tundra was a sink for carbon of46.4 to 70.0 gC m�2 season�1, while the moist tussock tundra either lost carbon of up to60.8 gC m�2 season�1 or was in balance. The contrasting patterns of carbon balance at thetwo sites demonstrate that ecosystem difference can be more important in determininglandscape NEE than intraseasonal and interseasonal variability due to environmentalfactors with respect to NEE. The wet sedge tundra showed an acclimation (e.g., over days)to temperature, while the moist tussock tundra illustrated a strong temperaturedependence. Warming and drying accentuated ecosystem respiration in the moist tussocktundra, causing a net loss of carbon. Better characterization of spatial variability in NEEand associated environmental controls is required to improve current and future estimatesof the Arctic terrestrial carbon balance.
Citation: Kwon, H.-J., W. C. Oechel, R. C. Zulueta, and S. J. Hastings (2006), Effects of climate variability on carbon sequestration
among adjacent wet sedge tundra and moist tussock tundra ecosystems, J. Geophys. Res., 111, G03014, doi:10.1029/2005JG000036.
1. Introduction
[2] A better understanding of the carbon budget in theArctic region is essential for accurate assessment andprediction of regional responses and associated feedbackson climate change [Chapin et al., 2005]. The Arctic has animportant role in the global carbon budget due to thepresence of up to 190 Gt of carbon currently stored in coldtundra soils [Post et al., 1982; Schlesinger, 1991; Hobbie etal., 2000] and the potential for substantial positive feed-backs to global climate change through enhanced soilrespiration and carbon release to the atmosphere under aprojected warmer and drier climate [Maxwell, 1992; Oechelet al., 1993; Oechel and Vourlitis, 1994; Ping et al., 1997;Vourlitis and Oechel, 1997; Grogan and Chapin, 2000].Recent observations report that thermal profiles of perma-frost and northern latitude temperature records have risen2�–4�C across northern Alaska and Canada during the lastfew decades [Lachenbruch and Marshall, 1986; Oechel et
al., 1993; Osterkamp and Romanovsky, 1999]. This changein temperature will eventually affect the hydrology andthermal regime as well as feedback processes of Arctictundra ecosystems which will ultimately influence thedirection and magnitude of the carbon budget of the Arctictundra region [Tieszen et al., 1980; Kane et al., 1991;Chapin and Shaver, 1996; Johnson et al., 1996, 2000;Oechel et al., 2000b; Chapin et al., 2005].[3] Modeling efforts have been conducted in an attempt
to understand the regional carbon balance over the Arctic[Clein et al., 2000; McGuire et al., 2000; Oechel et al.,2000a; Vourlitis et al., 2003]. Owing to the lack ofrepresentative measurements, a single land-surface param-eterization for the Arctic tundra is used in regional andglobal climate models [McGuire et al., 1992; Bonan, 1995;Lynch et al., 1995; Clein et al., 2000]. Model simulationstudies of terrestrial carbon dynamics give a wide range ofpredictions ranging from small to large carbon sinks andsources for high latitude regions [Wang and Polglase, 1995;King et al., 1997; Xiao et al., 1998; Clein et al., 2000].These differing carbon flux estimates arise in part from alack of information and understanding regarding the spatialand temporal variability of Arctic carbon dynamics andassociated physical and environmental controls on theseprocesses [Walker et al., 1989; McFadden et al., 1998;Vourlitis et al., 2000b].
JOURNAL OF GEOPHYSICAL RESEARCH, VOL. 111, G03014, doi:10.1029/2005JG000036, 2006ClickHere
for
FullArticle
1Global Change Research Group, Department of Biology, San DiegoState University, San Diego, California, USA.
2Now at Department of Botany, University of Wyoming, Laramie,Wyoming, USA.
Copyright 2006 by the American Geophysical Union.0148-0227/06/2005JG000036$09.00
G03014 1 of 18
[4] Synthesis studies on factors controlling net ecosystemCO2 exchange (NEE) of a diversity of ecosystems havebeen published as part of the FLUXNET effort [Janssens etal., 2001; Law et al., 2002; Baldocchi, 2003]. Desertecosystems are primarily limited by water with the timingand frequency of precipitation events a critical factor indetermining seasonal and annual productivity [Hastings etal., 2005]. Grasslands are typically found in areas ofmoderate summer rainfall along with cold winters and oftenfound to be in balance with respect to NEE on an annualbasis [Frank and Dugas, 2001; Suyker and Verma, 2001].Temperate hardwood and deciduous forests have some ofthe highest annual NEE values (often equal to tropicalforests) limited by summer temperatures [Barford et al.,2001; Curtis et al., 2002]. Tropical forests NEE values areoften found to have little seasonal variation but largeinterannual differences ranging from a slight source duringan El Nino event changing to a strong annual sink as thewarm phase dissipates [Loescher et al., 2003].[5] Measurements of NEE have been conducted in the
Alaskan Arctic using chamber (e.g., leaf, soil, and ecosys-tem level) and eddy covariance methods [Chapin et al.,1980; Oberbauer et al., 1991; Oechel et al., 1993; Chapinand Shaver, 1996; Vourlitis and Oechel, 1997; Oechel et al.,2000b; Harazono et al., 2003]. Although these studies haveprovided a quantitative understanding of the carbon budgetand a mechanistic understanding of how tundra ecosystemsrespond to direct and indirect environmental changes, alimitation of most of the previous studies conducted overthe short term (e.g., one or two seasons) is they mayoverlook responses (e.g., homeostatic adjustment and inter-action among environmental factors) that are essential indetermining carbon balance over the long term [Oechel andStrain, 1985; Leadley and Reynolds, 1992]. Measurementsfrom plot and local scale cannot be representative of theArctic region owing to spatial heterogeneity [McFadden etal., 1998, 2003; Vourlitis et al., 2003] and make it difficultto extrapolate results from instantaneous measurements ofcarbon and nutrient gain to long-term ecosystem responsesto climatic change [Chapin and Shaver, 1996] owing tospecies interactions in a community which may mediateecosystem processes, and different time lags between phys-iological, demographic, and ecosystem processes.[6] One of the characteristics of the Arctic landscape is
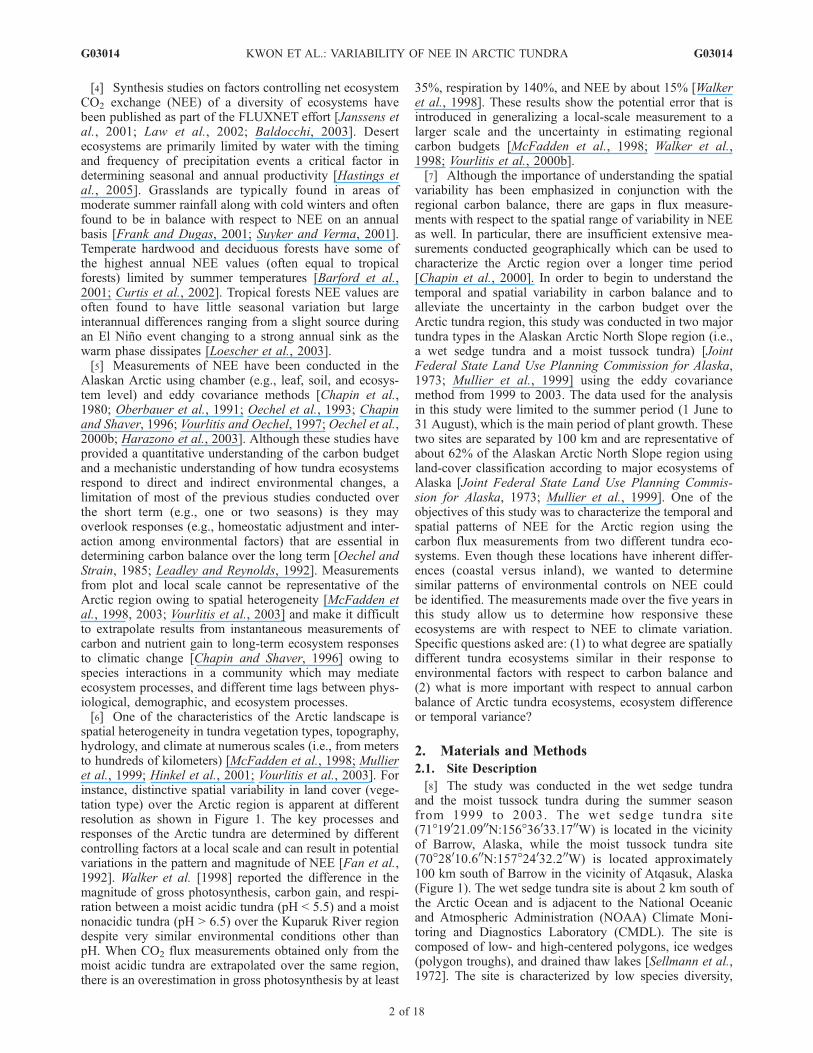
spatial heterogeneity in tundra vegetation types, topography,hydrology, and climate at numerous scales (i.e., from metersto hundreds of kilometers) [McFadden et al., 1998; Mullieret al., 1999; Hinkel et al., 2001; Vourlitis et al., 2003]. Forinstance, distinctive spatial variability in land cover (vege-tation type) over the Arctic region is apparent at differentresolution as shown in Figure 1. The key processes andresponses of the Arctic tundra are determined by differentcontrolling factors at a local scale and can result in potentialvariations in the pattern and magnitude of NEE [Fan et al.,1992]. Walker et al. [1998] reported the difference in themagnitude of gross photosynthesis, carbon gain, and respi-ration between a moist acidic tundra (pH < 5.5) and a moistnonacidic tundra (pH > 6.5) over the Kuparuk River regiondespite very similar environmental conditions other thanpH. When CO2 flux measurements obtained only from themoist acidic tundra are extrapolated over the same region,there is an overestimation in gross photosynthesis by at least
35%, respiration by 140%, and NEE by about 15% [Walkeret al., 1998]. These results show the potential error that isintroduced in generalizing a local-scale measurement to alarger scale and the uncertainty in estimating regionalcarbon budgets [McFadden et al., 1998; Walker et al.,1998; Vourlitis et al., 2000b].[7] Although the importance of understanding the spatial
variability has been emphasized in conjunction with theregional carbon balance, there are gaps in flux measure-ments with respect to the spatial range of variability in NEEas well. In particular, there are insufficient extensive mea-surements conducted geographically which can be used tocharacterize the Arctic region over a longer time period[Chapin et al., 2000]. In order to begin to understand thetemporal and spatial variability in carbon balance and toalleviate the uncertainty in the carbon budget over theArctic tundra region, this study was conducted in two majortundra types in the Alaskan Arctic North Slope region (i.e.,a wet sedge tundra and a moist tussock tundra) [JointFederal State Land Use Planning Commission for Alaska,1973; Mullier et al., 1999] using the eddy covariancemethod from 1999 to 2003. The data used for the analysisin this study were limited to the summer period (1 June to31 August), which is the main period of plant growth. Thesetwo sites are separated by 100 km and are representative ofabout 62% of the Alaskan Arctic North Slope region usingland-cover classification according to major ecosystems ofAlaska [Joint Federal State Land Use Planning Commis-sion for Alaska, 1973; Mullier et al., 1999]. One of theobjectives of this study was to characterize the temporal andspatial patterns of NEE for the Arctic region using thecarbon flux measurements from two different tundra eco-systems. Even though these locations have inherent differ-ences (coastal versus inland), we wanted to determinesimilar patterns of environmental controls on NEE couldbe identified. The measurements made over the five years inthis study allow us to determine how responsive theseecosystems are with respect to NEE to climate variation.Specific questions asked are: (1) to what degree are spatiallydifferent tundra ecosystems similar in their response toenvironmental factors with respect to carbon balance and(2) what is more important with respect to annual carbonbalance of Arctic tundra ecosystems, ecosystem differenceor temporal variance?
2. Materials and Methods
2.1. Site Description
[8] The study was conducted in the wet sedge tundraand the moist tussock tundra during the summer seasonfrom 1999 to 2003. The wet sedge tundra site(71�19021.0900N:156�36033.1700W) is located in the vicinityof Barrow, Alaska, while the moist tussock tundra site(70�28010.600N:157�24032.200W) is located approximately100 km south of Barrow in the vicinity of Atqasuk, Alaska(Figure 1). The wet sedge tundra site is about 2 km south ofthe Arctic Ocean and is adjacent to the National Oceanicand Atmospheric Administration (NOAA) Climate Moni-toring and Diagnostics Laboratory (CMDL). The site iscomposed of low- and high-centered polygons, ice wedges(polygon troughs), and drained thaw lakes [Sellmann et al.,1972]. The site is characterized by low species diversity,
G03014 KWON ET AL.: VARIABILITY OF NEE IN ARCTIC TUNDRA
2 of 18
G03014
dominance of grasses and sedges, rare occurrences oftussock tundra, and an absence of shrubs [Brown et al.,1980]. About 80% of plant vegetation is dominated byherbaceous sedges including Carex aquatilis, Eriophorumrusseolum, and Eriophorum angustifolium, and the shrubSalix rotundifolia [Webber, 1978]. Mosses (e.g., Calliergonrichardsonii and Cinclidium subrotundum) and lichens
(e.g., Peltigera sp.) are also abundant. A moss layer underthe vascular plants provides almost 100% cover. The wetsedge tundra is dominated by wet, acidic soils (soil pH 5.2)[Walker et al., 2003]. Owing to the presence of permafrost,soil drainage is poor throughout the summer season. Soils atthe measurement site have a tripartite morphology: anorganic-rich surface horizon, a horizon of silty clays to siltloam textured mineral material, and an underlying perenni-ally frozen organic-rich horizon [Brown et al., 1980]. Thedepth of the soil organic matter (SOM) from the top surfacevaries from 0 to 10 cm. The mineral substratum consists ofsilty clays, which are generally layered from about 10 to30 cm in depth. Total SOM content is 29 kg C m�3 down toa depth of 1 m (C. L. Ping and G. J. Michaelson, personalcommunication, 2001).[9] The moist tussock tundra site near Atqasuk is com-
posed of a variety of moist-wet coastal sedge tundra withmoist-tussock vegetation predominating in well-drainedupland areas [Batzli, 1980] and is characterized as acidictundra (soil pH 4.8) [Walker et al., 2003]. Vegetation isdominated by the tussock forming sedge, Eriophorumvaginatum as well as other evergreen and deciduous forbsand shrubs [Komarkova and Webber, 1980; Walker et al.,1989]. Soils are developed on aeolian sands of Quaternaryage [Everett, 1980] and consist of approximately 95% sandand 5% clay and silt to a depth of 1 m [Walker et al., 2003].The depth of SOM ranges from 0 to 18 cm. Total organiccarbon content to a depth of 1 m is 38 kg C m�3,approximately 1.3 times greater than the wet sedge tundra(C. L. Ping and G. J. Michaelson, personal communication,2001).
2.2. Eddy Covariance and EnvironmentalMeasurements
[10] Measurements of NEE were made using the eddycovariance technique [Baldocchi et al., 1988] from a towerheight of 5 m for the wet sedge tundra and 3 m for the moisttussock tundra. Wind velocity (i.e., vertical, streamwise, andcrosswind speed) and temperature were measured with athree-dimensional sonic anemometer (Model R3, GillInstruments, Lymington, UK) at 10 Hz for both sites. Tomeasure CO2 and water vapor fluctuations, an open-pathinfrared gas analyzer (IRGA) designed by NOAA Atmo-spheric Turbulence and Diffusion Division (ATDD) wasused in 1999 [Auble and Meyers, 1992] and an open-pathIRGA (Model LI-7500, LI-COR, Inc., Lincoln, Nebraska)from 2000 to 2003 at the wet sedge tundra site, while a
Figure 1. Land cover maps with three different resolutionsover the location of the measurements sites. (a) Land covermap with the resolution of 0.03 � 0.03 km obtained from asatellite image (Landsat and SPOT) over the Barrow region.(b) NDVI map with the resolution of 1 � 1 km obtainedfrom a satellite image (NOAA 14) over the same region inFigure 1a. (c) NDVI map with the same resolution asFigure 1b over a larger regional scale including the twomeasurements sites. Figures 1a and 1b are enlarged views ofthe square area in Figure 1c. (d) Land cover map with theresolution of 40 � 60 km. Each color represents differentland cover types. Barrow represents the wet coastal sedgetundra, while Atqasuk represents the moist tussock tundra.
G03014 KWON ET AL.: VARIABILITY OF NEE IN ARCTIC TUNDRA
3 of 18
G03014
NOAA/ATDD IRGAwas used from 1999 to 2000 and a LI-7500 IRGA from 2001 to 2003 at the moist tussock tundrasite. Half-hour eddy covariances and associated statisticswere calculated online from 10-Hz raw data and stored on apersonal computer. Fluctuating components for the fluxcalculations were obtained using a 400-s running meanand digital recursive filter [McMillen, 1986, 1988]. Nolinear detrending was used in the flux calculations in thisstudy. The sonic anemometer data set was rotated to forcethe mean crosswind and vertical wind speeds to zero and toalign the streamwise wind with the mean wind vector[McMillen, 1986]. The CO2 and water vapor fluxes werecorrected for the variation in air density due to simultaneoustransfers of water vapor and sensible heat according toWebbet al. [1980].[11] Environmental measurements were sampled every
minute, averaged over 30 min, and logged using a datalogger (Model 21X, Campbell Scientific Inc., Logan, Utah).Net radiation (Rn) and photosynthetically active radiation(PAR) were measured with a net radiometer (Model Q7,REBS, Seattle, Washington) and a quantum sensor (ModelLI-190SB, LI-COR, Inc.) respectively at a height of ap-proximately 1.2 m for both sites. Air temperature (Tair) andrelative humidity (RH) were measured using a PRT (plat-inum resistance thermometers) and capacitive polymer RHchip (Model HMP45C-L, Vaisala Inc., Helsinki, Finland) ata height of 3.0 m for the wet sedge tundra and at a height of1.5 m for the moist tussock tundra. Soil temperature (Tsoil)was measured using type-T thermocouples at 0, 5, and10 cm below the ground at the wet sedge tundra site and0 and 5 cm at the moist tussock tundra site. Ground heatflux (G) was measured using two soil heat flux plates(Model HFT-1, REBS) at the wet sedge tundra and foursoil heat flux plates at the moist tussock tundra. The soilheat flux plates were buried 2 cm below the moss surfaceat both sites. Soil moisture content was measured at differ-ent depths (e.g., 5 cm, 10 cm, 20 cm, and 30 cm fromthe surface) using time domain reflectometery (TDR)(Model CS610, Campbell Scientific) at both sites. Soilmoisture content was calculated using an empirical equationfor the organic soil [Roth et al., 1992] and a different empiri-cal equation for the mineral soil [Topp et al., 1980].[12] Active layer depth (the depth of thaw), defined as the
vertical distance between the surface and the point where asteel rod meets resistance, was measured every week frommid June (following seasonal snowmelt) to late August forboth sites. There were seven 400-m transects, which werelaid out every 45� from true north (excluding 315� owing tothe presence of a building), with 27 flags marking locationsof measurements at the wet sedge tundra site, while therewere eight 200-m transects laid out every 45� from truenorth with 20 flags at the moist tussock tundra site. Threemeasurements of the active layer depth were conductedaround each flag.
2.3. Energy Balance Closure
[13] The closure of the energy balance was examined by alinear regression between the sum of latent heat (LE) andsensible heat (H) fluxes (H + LE) and the available energy(Rn � G) for both sites. Using half-hourly data collectedduring the five summer seasons, the energy balance closureat thewet sedge tundra showed 76%agreement (i.e., H +LE=
0.76 � (Rn � G), r2 = 0.90), while that at the moist tussocktundra was slightly better, showingH +LE = 0.81� (Rn�G)with r2 = 0.94. Previous studies report that energy balanceclosure was improved when daily average fluxes are used forthe assessment of the energy closure [Blanken et al., 1997;Scott et al., 2004].However, the analysis of the energy closureusing the daily average values showed no improvement of theenergy closure in this study.[14] A possible cause for the lack of energy closure may
arise from measurement errors in Rn (associated withcalibration factor of net radiometer) [Halldn and Lindroth,1992; Twine et al., 2000]. Replacing domes without cali-bration and harsh winter conditions may result in a changein the calibration factor and generate a bias in Rn. Errors anduncertainties in the spatial characterization of Rn and G maybe another reason for the energy imbalance [McFadden etal., 1998; Anthoni et al., 1999]. Source areas of Rn and Gare relatively small compared to that of LE and H [Schmid,1997]. The Arctic tundra ecosystem is heterogeneous onscales of meters in microtophography, hydrology, andmicroclimate from hummocks and frost action [Weller andHolmgren, 1974; McFadden et al., 1998]. Therefore, withinthe scale of the source areas, albedo, soil temperature, soilmoisture content, and heat capacity may differ [McFaddenet al., 1998]. Although the two sites are flat and have longfetches (>500 m), heterogeneity in scales may cause tem-perature and water vapor gradient along the fetches andgenerate horizontal advection of H and LE, another reasonfor the observed energy imbalance.
2.4. Gap-Filling Methods
[15] The percentage of data collection during the fivesummer measurement periods was 74% at the wet sedgetundra site and 68% at the moist tussock tundra site. Thegaps in data collection were primarily due to power failures,instrument errors, and data rejection following qualityassessments. In order to calculate daily and seasonal carbonbalance, a look-up table method was used to fill thesemissing data [Falge et al., 2001]. The look-up tables werecreated to represent changing environmental conditions andplant physiology based on monthly periods. The interval ofthe look-up table was 50 �mol m�2 s�1 with a range of 0 to100 �mol m�2 s�1 and 100 �mol m�2 s�1 with a range of100 to 1600 �mol m�2 s�1 for PAR and 2�C with a range of�8.0 to 28.0�C for Tair. Values not present in the look-uptable were linearly interpolated from the measured values[Falge et al., 2001].
3. Results
3.1. General Environmental Condition
[16] General climate conditions during the measurementperiods are presented in Table 1. Both sites are locatedabove the Arctic Circle (66�340); thus the Sun remainsabove the horizon from 10 May to 2 August, resulting in24 hours of daylight. We refer to early morning and lateevening during this period; however, there is always mea-surable incoming light radiation. There was relatively littledifference in the 5-year summer average PAR between thesites, while the 5-year summer average Tair and Tsoil at thewet sedge tundra were significantly lower by 4.4�C in Tairand 5.5�C in Tsoil. The 5-year summer average VPD at the
G03014 KWON ET AL.: VARIABILITY OF NEE IN ARCTIC TUNDRA
4 of 18
G03014
wet sedge tundra was much lower owing to the influence ofthe Arctic Ocean, which brings higher humidity air to thecoastal inland [Harazono et al., 1998]. Rain events occurredmainly in July and August for both sites with slightly lessprecipitation at the wet sedge tundra. In general, the climateconditions at the moist tussock tundra were noticeablywarmer and drier than at the wet sedge tundra over the fivesummers.[17] The timing of the snow-free period, determined from
surface albedo, at the wet sedge tundra varied considerablyduring the measurement years: day of year (DOY) 164 in1999, DOY 165 in 2000, DOY 162 in 2001, DOY 144 in2002, and DOY 155 in 2003 [Stone et al., 2002; R. Stone,personal communication, 2004]. The occurrence of snow-melt at the moist tussock tundra was determined usingupwelling solar irradiance and was DOY 154 in 2001,DOY 137 in 2002, and DOY 151 in 2003 (source of data:Atmospheric Radiation Measurement (ARM) program,http://www.archive.arm.gov/). The earliest snowmelt duringthe measurement periods occurred in 2002 and was due tounusually warm temperatures in May. The early snowmelt
caused by warmer temperature at the moist tussock tundrainitiated plant growth 4–8 days earlier than the wet sedgetundra during the measurement years.
3.2. Seasonal Trend of Net Ecosystem CO2
Exchange and Environmental Factors
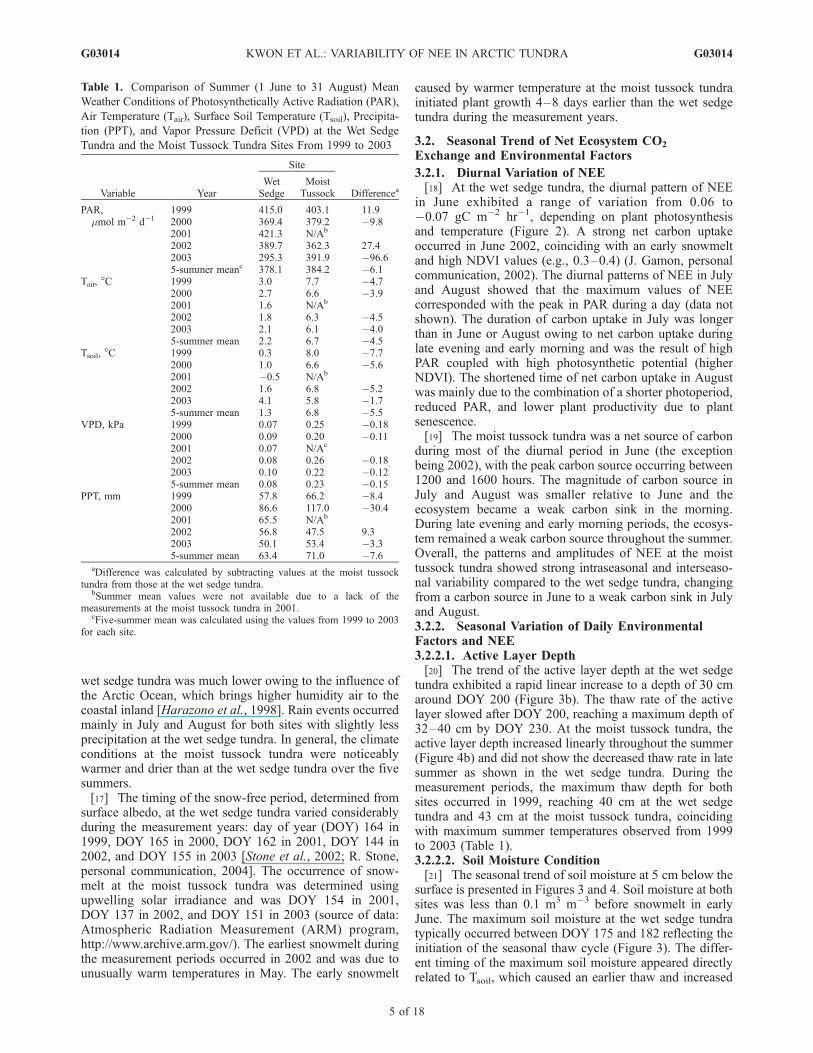
3.2.1. Diurnal Variation of NEE[18] At the wet sedge tundra, the diurnal pattern of NEE
in June exhibited a range of variation from 0.06 to�0.07 gC m�2 hr�1, depending on plant photosynthesisand temperature (Figure 2). A strong net carbon uptakeoccurred in June 2002, coinciding with an early snowmeltand high NDVI values (e.g., 0.3–0.4) (J. Gamon, personalcommunication, 2002). The diurnal patterns of NEE in Julyand August showed that the maximum values of NEEcorresponded with the peak in PAR during a day (data notshown). The duration of carbon uptake in July was longerthan in June or August owing to net carbon uptake duringlate evening and early morning and was the result of highPAR coupled with high photosynthetic potential (higherNDVI). The shortened time of net carbon uptake in Augustwas mainly due to the combination of a shorter photoperiod,reduced PAR, and lower plant productivity due to plantsenescence.[19] The moist tussock tundra was a net source of carbon
during most of the diurnal period in June (the exceptionbeing 2002), with the peak carbon source occurring between1200 and 1600 hours. The magnitude of carbon source inJuly and August was smaller relative to June and theecosystem became a weak carbon sink in the morning.During late evening and early morning periods, the ecosys-tem remained a weak carbon source throughout the summer.Overall, the patterns and amplitudes of NEE at the moisttussock tundra showed strong intraseasonal and interseaso-nal variability compared to the wet sedge tundra, changingfrom a carbon source in June to a weak carbon sink in Julyand August.3.2.2. Seasonal Variation of Daily EnvironmentalFactors and NEE3.2.2.1. Active Layer Depth[20] The trend of the active layer depth at the wet sedge
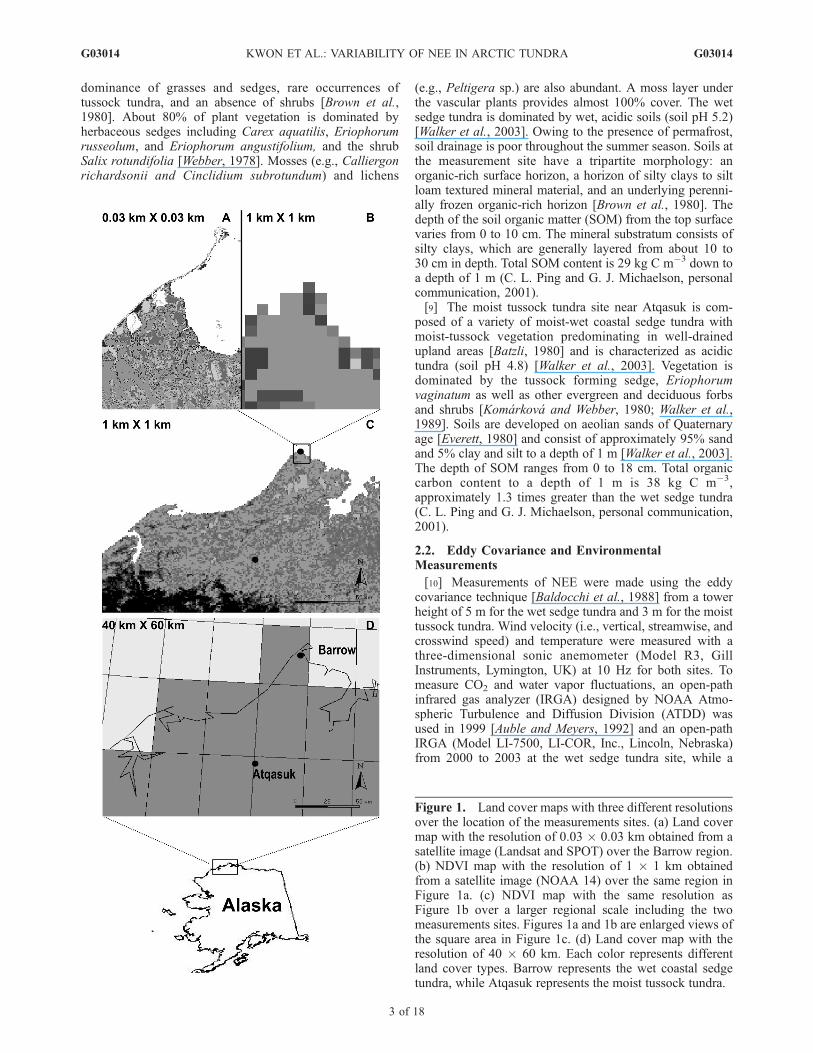
tundra exhibited a rapid linear increase to a depth of 30 cmaround DOY 200 (Figure 3b). The thaw rate of the activelayer slowed after DOY 200, reaching a maximum depth of32–40 cm by DOY 230. At the moist tussock tundra, theactive layer depth increased linearly throughout the summer(Figure 4b) and did not show the decreased thaw rate in latesummer as shown in the wet sedge tundra. During themeasurement periods, the maximum thaw depth for bothsites occurred in 1999, reaching 40 cm at the wet sedgetundra and 43 cm at the moist tussock tundra, coincidingwith maximum summer temperatures observed from 1999to 2003 (Table 1).3.2.2.2. Soil Moisture Condition[21] The seasonal trend of soil moisture at 5 cm below the
surface is presented in Figures 3 and 4. Soil moisture at bothsites was less than 0.1 m3 m�3 before snowmelt in earlyJune. The maximum soil moisture at the wet sedge tundratypically occurred between DOY 175 and 182 reflecting theinitiation of the seasonal thaw cycle (Figure 3). The differ-ent timing of the maximum soil moisture appeared directlyrelated to Tsoil, which caused an earlier thaw and increased
Table 1. Comparison of Summer (1 June to 31 August) Mean
Weather Conditions of Photosynthetically Active Radiation (PAR),
Air Temperature (Tair), Surface Soil Temperature (Tsoil), Precipita-
tion (PPT), and Vapor Pressure Deficit (VPD) at the Wet Sedge
Tundra and the Moist Tussock Tundra Sites From 1999 to 2003
Variable Year
Site
DifferenceaWetSedge
MoistTussock
PAR,�mol m�2 d�1
1999 415.0 403.1 11.92000 369.4 379.2 �9.82001 421.3 N/Ab
2002 389.7 362.3 27.42003 295.3 391.9 �96.65-summer meanc 378.1 384.2 �6.1
Tair, �C 1999 3.0 7.7 �4.72000 2.7 6.6 �3.92001 1.6 N/Ab
2002 1.8 6.3 �4.52003 2.1 6.1 �4.05-summer mean 2.2 6.7 �4.5
Tsoil, �C 1999 0.3 8.0 �7.72000 1.0 6.6 �5.62001 �0.5 N/Ab
2002 1.6 6.8 �5.22003 4.1 5.8 �1.75-summer mean 1.3 6.8 �5.5
VPD, kPa 1999 0.07 0.25 �0.182000 0.09 0.20 �0.112001 0.07 N/Ac
2002 0.08 0.26 �0.182003 0.10 0.22 �0.125-summer mean 0.08 0.23 �0.15
PPT, mm 1999 57.8 66.2 �8.42000 86.6 117.0 �30.42001 65.5 N/Ab
2002 56.8 47.5 9.32003 50.1 53.4 �3.35-summer mean 63.4 71.0 �7.6
aDifference was calculated by subtracting values at the moist tussocktundra from those at the wet sedge tundra.
bSummer mean values were not available due to a lack of themeasurements at the moist tussock tundra in 2001.
cFive-summer mean was calculated using the values from 1999 to 2003for each site.
G03014 KWON ET AL.: VARIABILITY OF NEE IN ARCTIC TUNDRA
5 of 18
G03014
soil permeability and infiltration of snowmelt water into thesoil. For example, relatively warm Tsoil (around 4.0�C) inlate June of 2000 resulted in the earliest thaw, whilerelatively cold Tsoil ranging from 0� to 2�C in late Junefor the other years slowed thaw activity. After the peak inthe soil moisture each summer, the soil moisture contentshowed small increases coinciding with precipitation eventsbut remained relatively constant until the end of the sum-mer. The low variability in soil moisture was due toconsistently waterlogged soils resulting from poor drainage.The highest soil moisture was observed in 2000 and was a
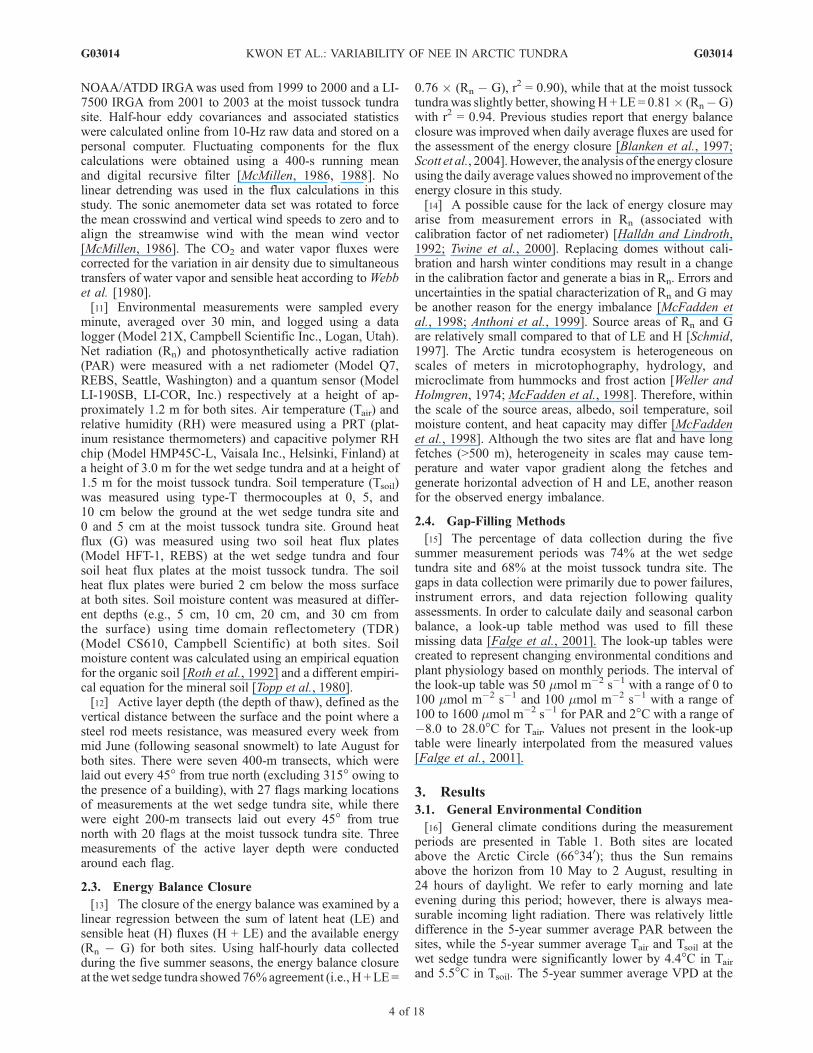
result of increased summer precipitation in the Barrowregion (Table 1).[22] At the moist tussock tundra, the soil moisture sharply
increased and reached an initial peak at around 0.53 m3 m�3
near DOY 165 (Figure 4). The earlier thaw at the moisttussock tundra was primarily due to warmer Tsoil. There wasconsiderable variation in the soil moisture throughout thesummer and increases in the soil moisture coincided withrainfall (e.g., DOY 183 to 190 in 2000 and DOY 210 to 216in 2001). Precipitation, rapid drainage, and a higher evapo-transpiration (e.g., five-summer average daily evapotrans-
Figure 2. Average diurnal trends for each half-hourly datum by month of NEE for the summer seasonsfrom 1999 to 2003. Each point represents a half-hour average of NEE; open circles indicate the values ofNEE at the wet sedge tundra; solid lines indicate the values of NEE at the moist tussock tundra. Positivesign indicates a carbon source, while negative sign indicates a carbon sink.
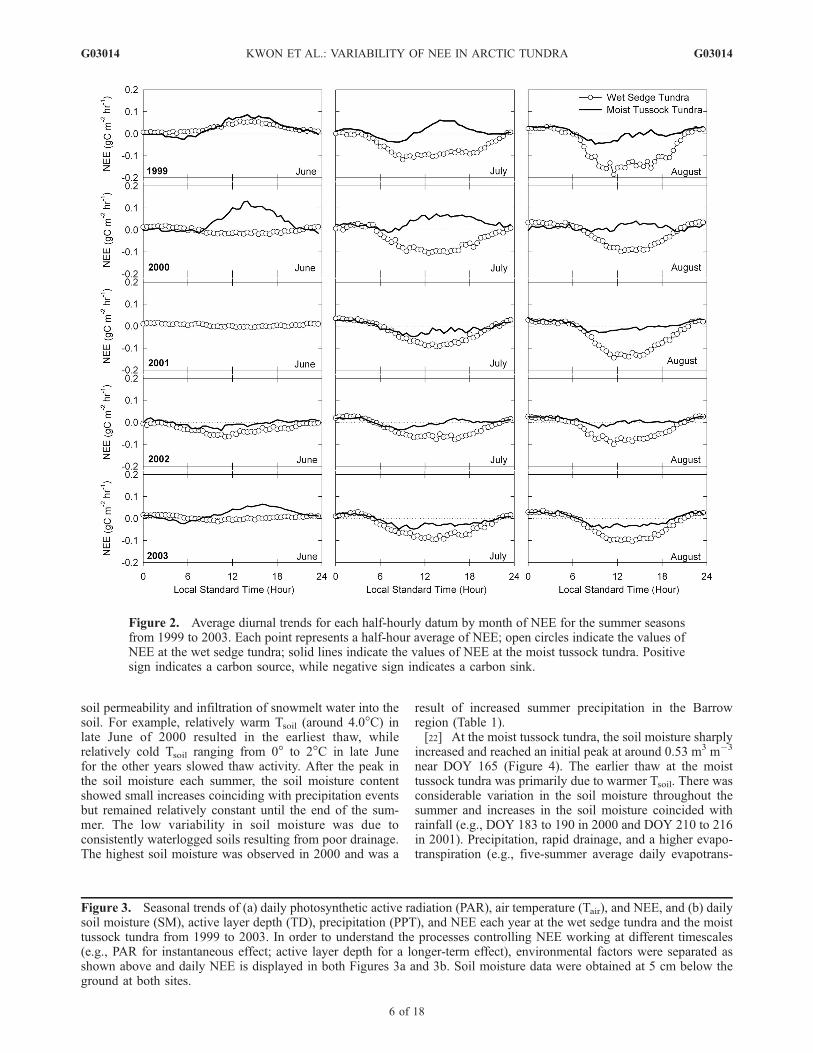
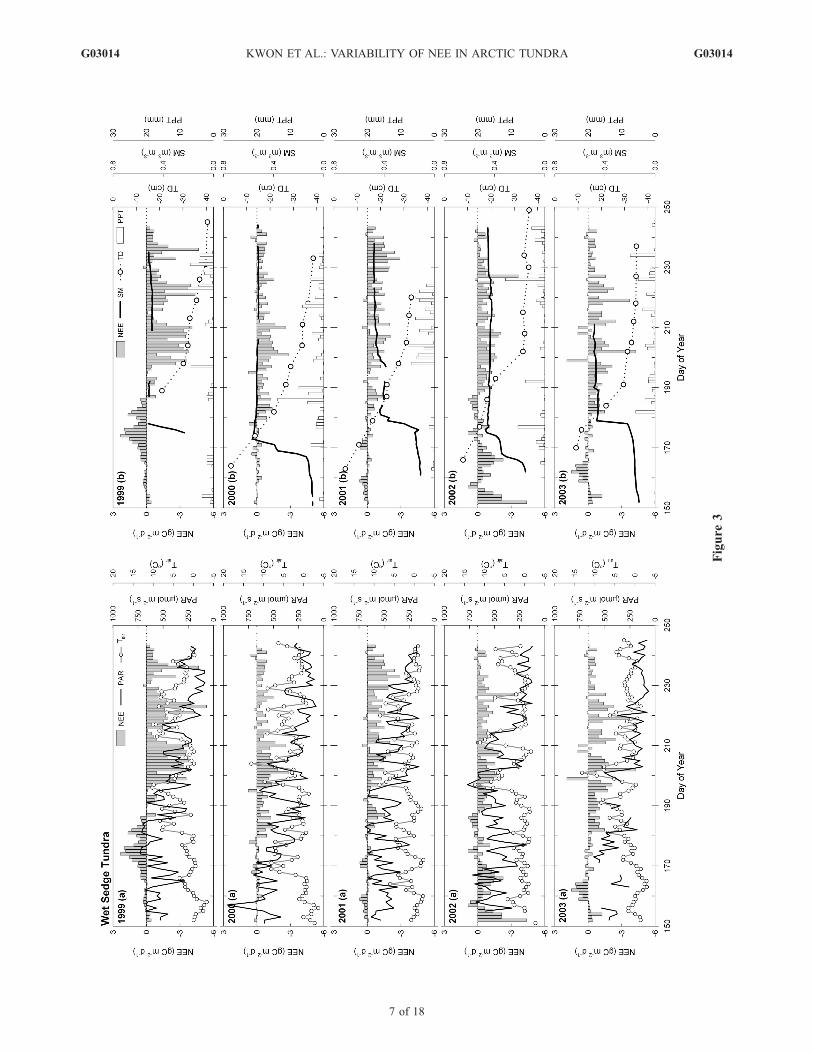
Figure 3. Seasonal trends of (a) daily photosynthetic active radiation (PAR), air temperature (Tair), and NEE, and (b) dailysoil moisture (SM), active layer depth (TD), precipitation (PPT), and NEE each year at the wet sedge tundra and the moisttussock tundra from 1999 to 2003. In order to understand the processes controlling NEE working at different timescales(e.g., PAR for instantaneous effect; active layer depth for a longer-term effect), environmental factors were separated asshown above and daily NEE is displayed in both Figures 3a and 3b. Soil moisture data were obtained at 5 cm below theground at both sites.
G03014 KWON ET AL.: VARIABILITY OF NEE IN ARCTIC TUNDRA
6 of 18
G03014
Figure
3
G03014 KWON ET AL.: VARIABILITY OF NEE IN ARCTIC TUNDRA
7 of 18
G03014
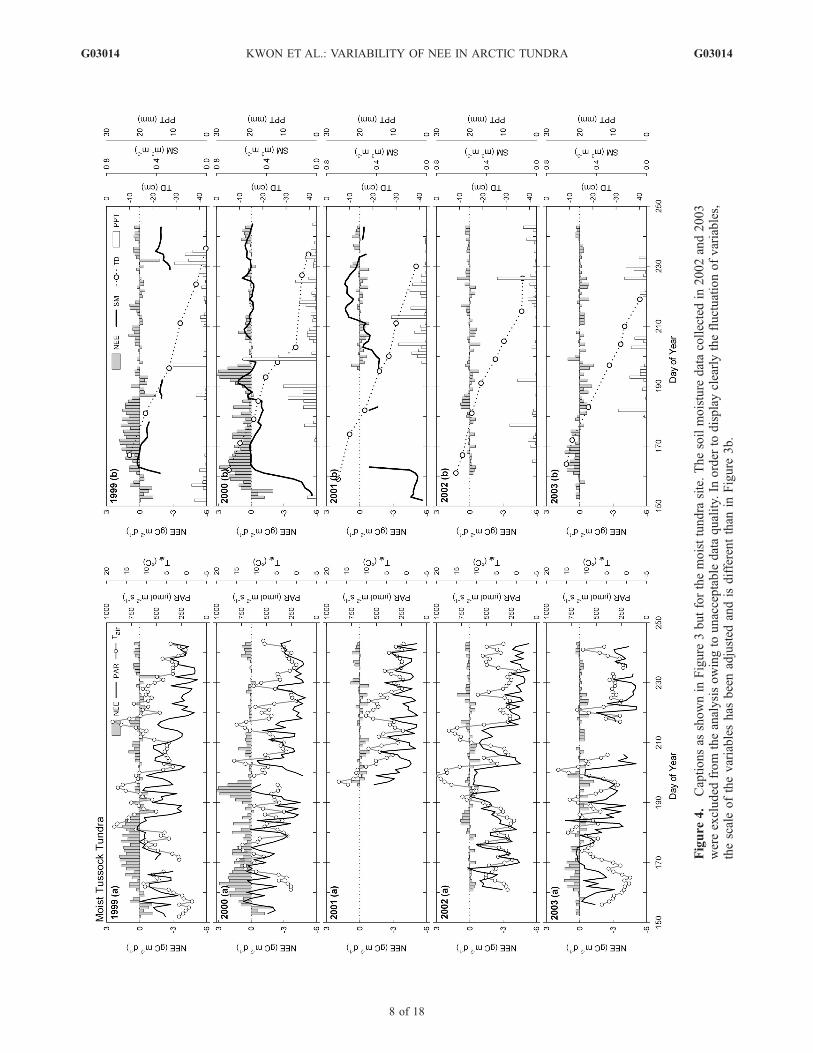
Figure
4.
Captionsas
shownin
Figure
3butforthemoisttundra
site.Thesoilmoisture
datacollectedin
2002and2003
wereexcluded
from
theanalysisowingto
unacceptabledataquality.In
order
todisplayclearlythefluctuationofvariables,
thescaleofthevariableshas
beenadjusted
andisdifferentthan
inFigure
3b.
G03014 KWON ET AL.: VARIABILITY OF NEE IN ARCTIC TUNDRA
8 of 18
G03014
piration of 1.24 mm d�1 at the moist tussock tundra, while0.83 mm d�1 at the wet sedge tundra) (H. J. Kwon,unpublished data, 2005) under warm temperatures stronglyinfluenced soil moisture content of the surface soil layer.3.2.2.3. Daily NEE[23] The trends of daily NEE at the two sites differed
markedly in direction and magnitude during the measure-ment period (Figures 3 and 4). Before the snowmelt (DOY137 to 164), the patterns of daily NEE at the wet sedgetundra was nearly neutral over most of the measurementyears (Figure 3). Substantial increases in carbon lossappeared after the snowmelt. While there was a strongcarbon sink in the early summer of 2002, this may be dueto relatively high rates of photosynthesis and canopydevelopment as a result of the early snowmelt in May.The timing and magnitude of the daily maximum carbonsink or source varied from season to season (Table 2 andFigure 3). The peak daily net carbon uptake generallyoccurred between mid July and mid August, while the peakof daily carbon loss occurred between late June and early
July. As the season progressed, the rate of net carbon uptakegradually decreased and the wet sedge tundra remained inbalance in late August. The daily variation in NEE wasrelatively independent of the environmental factors; dailyaverage PAR, Tair, and soil moisture (the relationshipsbetween daily NEE and these factors showed low R2
(<0.2) each year). The wet sedge tundra did not respondconsistently to similar environmental conditions (e.g.,colder, wetter periods for daily net carbon uptake orwarmer, drier periods for daily carbon loss) with respectto NEE during the measurement period. The active layerdepth, which correlates with longer-term seasonal develop-ment of the ecosystem, was not associated with the seasonalpatterns of daily NEE either.[24] The moist tussock tundra lost carbon from the
ecosystem to the atmosphere in early June (Figure 4). Thesource strength diminished after mid June and the ecosys-tem became a weak carbon sink in early July with theexception of 2000 which showed almost continuous carbonloss throughout the summer. NEE from early July to mid
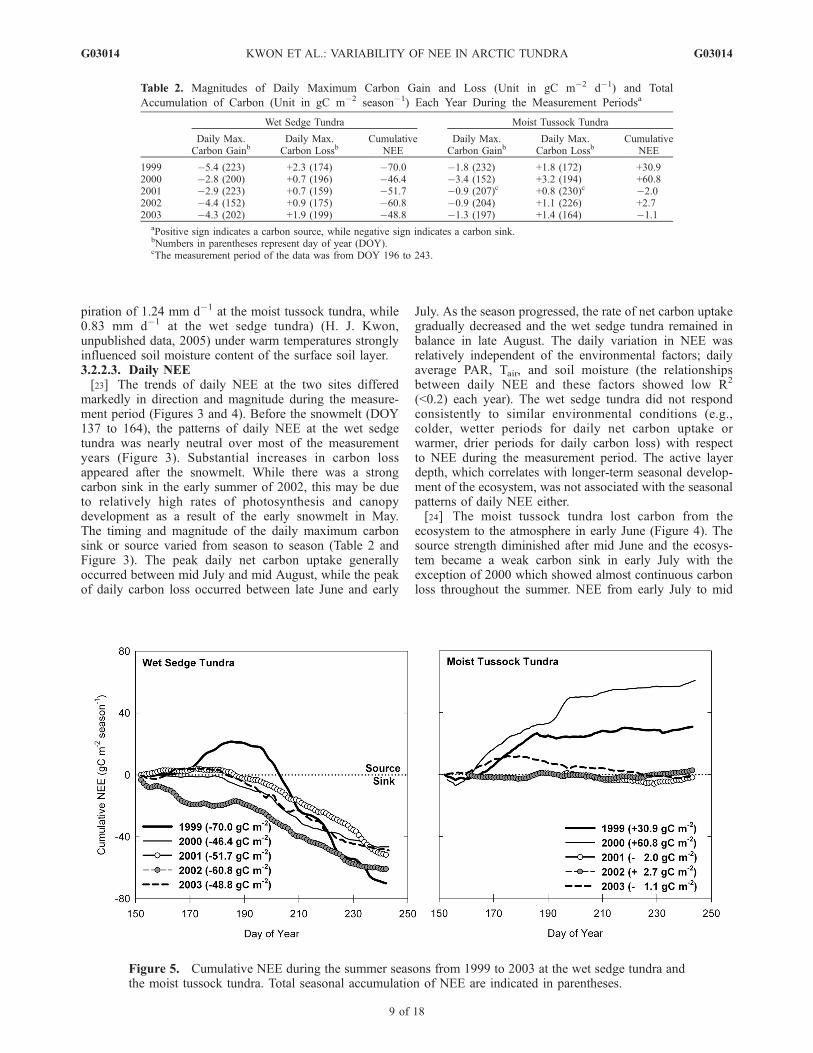
Table 2. Magnitudes of Daily Maximum Carbon Gain and Loss (Unit in gC m�2 d�1) and Total
Accumulation of Carbon (Unit in gC m�2 season�1) Each Year During the Measurement Periodsa
Wet Sedge Tundra Moist Tussock Tundra
Daily Max.Carbon Gainb
Daily Max.Carbon Lossb
CumulativeNEE
Daily Max.Carbon Gainb
Daily Max.Carbon Lossb
CumulativeNEE
1999 �5.4 (223) +2.3 (174) �70.0 �1.8 (232) +1.8 (172) +30.92000 �2.8 (200) +0.7 (196) �46.4 �3.4 (152) +3.2 (194) +60.82001 �2.9 (223) +0.7 (159) �51.7 �0.9 (207)c +0.8 (230)c �2.02002 �4.4 (152) +0.9 (175) �60.8 �0.9 (204) +1.1 (226) +2.72003 �4.3 (202) +1.9 (199) �48.8 �1.3 (197) +1.4 (164) �1.1
aPositive sign indicates a carbon source, while negative sign indicates a carbon sink.bNumbers in parentheses represent day of year (DOY).cThe measurement period of the data was from DOY 196 to 243.
Figure 5. Cumulative NEE during the summer seasons from 1999 to 2003 at the wet sedge tundra andthe moist tussock tundra. Total seasonal accumulation of NEE are indicated in parentheses.
G03014 KWON ET AL.: VARIABILITY OF NEE IN ARCTIC TUNDRA
9 of 18
G03014
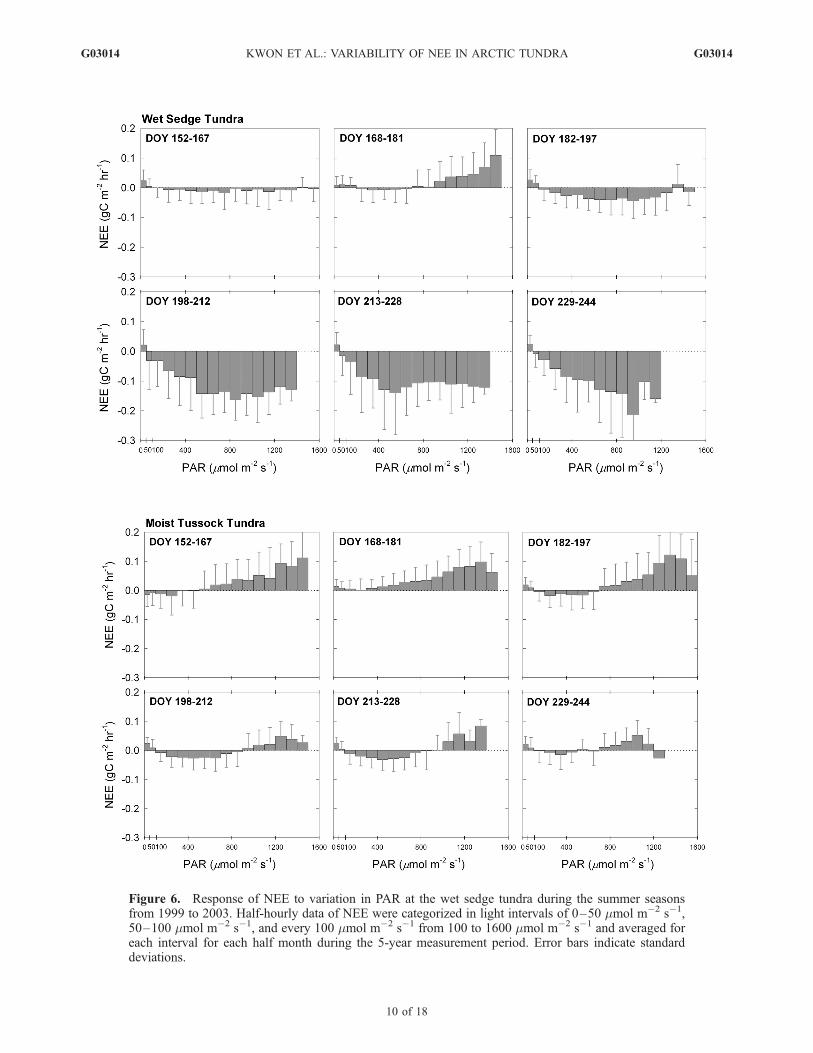
Figure 6. Response of NEE to variation in PAR at the wet sedge tundra during the summer seasonsfrom 1999 to 2003. Half-hourly data of NEE were categorized in light intervals of 0–50 �mol m�2 s�1,50–100 �mol m�2 s�1, and every 100 �mol m�2 s�1 from 100 to 1600 �mol m�2 s�1 and averaged foreach interval for each half month during the 5-year measurement period. Error bars indicate standarddeviations.
G03014 KWON ET AL.: VARIABILITY OF NEE IN ARCTIC TUNDRA
10 of 18
G03014
August was nearly in balance with a seasonal transition to acarbon source occurring around DOY 230 while the wetsedge tundra still remained a carbon sink. In contrast to thewet sedge tundra, the variation of daily NEE was coupledwith changes in environmental factors at the moist tussocktundra. The loss of carbon, in particular, coincided witha reduction in soil moisture resulting from a lack ofrainfall and increasing Tair under high levels of PAR(e.g., DOY 181 to 186 in 1999 and DOY 193 to 196 in2000) (Figure 4).[25] Cumulative NEE over the summer measurement
years differed remarkably between the two study sites(Figure 5). The wet sedge tundra was a relatively strongseasonal carbon sink, while the moist tussock tundra was anequally strong seasonal carbon source (1999 and 2000) ornearly in balance (2001–2003). At the wet sedge tundra,cumulative carbon in 1999 exhibited a strong carbon loss inearly July and a subsequent strong uptake in late July. Theseasonal accumulation of carbon reached �70.0 gC m�2
season�1 in 1999, which was the strongest seasonal carbongain observed in this study (Table 2). The patterns andamount of cumulative carbon in 2000, 2001, and 2003 weresimilar, showing a weak carbon loss from the tundra untilearly July and a gradual increase of net carbon uptake as theseason progressed. In 2002, the early plant growth resultingfrom the early snowmelt caused a strong net carbon uptakein late June (around DOY 170). The magnitude of thecumulative carbon remained at �20.0 gC m�2 season�1
during a cold period between DOY 160 and 190. Thecarbon gain resumed around DOY 190 and the total
cumulative carbon was �60.8 gC m�2 season�1 in 2002.Inter-seasonal variability of the cumulative NEE in themoist tussock tundra was more prominent than that in thewet sedge tundra, showing a dramatic change from a carbonsource to a balanced carbon budget.
3.3. Control of Environmental Factors on NetEcosystem CO2 Exchange
[26] At the wet sedge tundra, ecosystem level lightcompensation intensities approached between 100 to200 �mol m�2 s�1 (Figure 6), which is higher than reportedfor individual leaves of the principal grass species in theBarrow region [Tieszen, 1975]. Light intensity for saturation(i.e., light intensity for maximum net carbon uptake) at theecosystem level differed from month to month, reaching600 �mol m�2 s�1 in late June (DOY 168–181) and1000 �mol m�2 s�1 in late July (DOY 198–212). Themoist tussock tundra in early June (DOY 152–167) illus-trated a weak carbon sink at low light intensity and becamea carbon source at light intensities above 400 �mol m�2
s�1. The ecosystem lost significant amounts of carbon to theatmosphere, reaching a maximum value of 0.11 gC m�2 hr�1
at 1600 �mol m�2 s�1. From DOY 182 to 244,the response of NEE to changing PAR was similar,demonstrating that ecosystem level light compensationoccurred at 100 �mol m�2 s�1, while light saturation wasbetween 600 and 700 �mol m�2 s�1. During these periods,the magnitude of net carbon uptake was significantlylower than the wet sedge tundra over the same 100 to700 �mol m�2 s�1 PAR range. At light levels above the
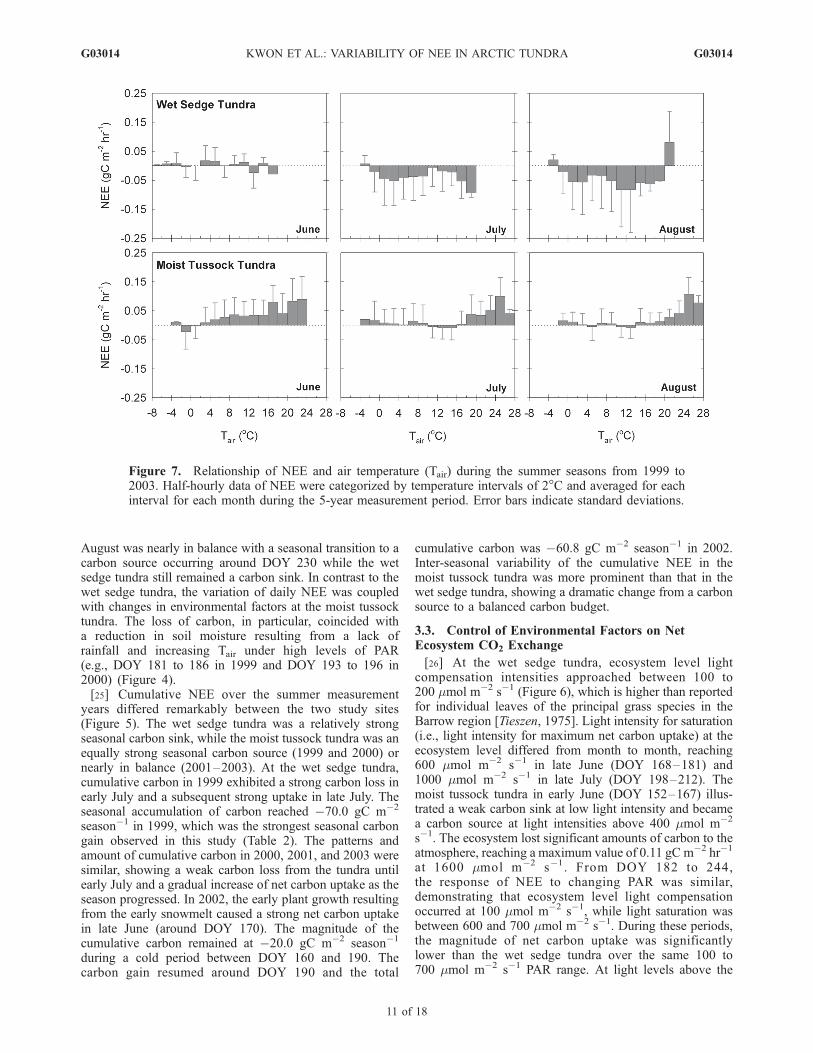
Figure 7. Relationship of NEE and air temperature (Tair) during the summer seasons from 1999 to2003. Half-hourly data of NEE were categorized by temperature intervals of 2�C and averaged for eachinterval for each month during the 5-year measurement period. Error bars indicate standard deviations.
G03014 KWON ET AL.: VARIABILITY OF NEE IN ARCTIC TUNDRA
11 of 18
G03014
saturation point, there was a carbon loss as high as0.12 gC m�2 hr�1. While some uptake of carbon occurredduring the summer, the predominant direction of NEE was anet loss of carbon to the atmosphere. The source activity mayhave resulted from increased rates of ecosystem respiration(ER) with an increase in temperature as PAR increased.[27] The effect of Tair on NEE in June at the wet sedge
tundra was variable, illustrating repeated periods of a sourceand a sink throughout the whole Tair range (Figure 7). InJuly, the magnitude of NEE at lower Tair (e.g., 2� to 4�C)was as high as at higher Tair (e.g., 16� to 18�C). Themagnitude of NEE tended to gradually decrease as Tairincreased from 4� to 16�C. The wet sedge tundra inAugust was a net carbon sink varying from �0.2 to�0.5 gC m�2 hr�1 throughout most of the Tair range. Incontrast, at the moist tussock tundra, there were a fewoccurrences of a small amount of carbon gain at differentTair in different months (e.g., �4� to 0�C in June, 10� to18�C in July, and 10� to 14�C in August). In general, therewas a consistent carbon loss throughout the range of Tairand the degree of carbon loss increased at a higher Tair atthe moist tussock tundra. In order to understand how soiltemperature influences NEE (via ER), the relationship be-tween NEE and soil temperature was examined at both sitesand showed similar results with the relationship betweenNEE and Tair (data not shown).
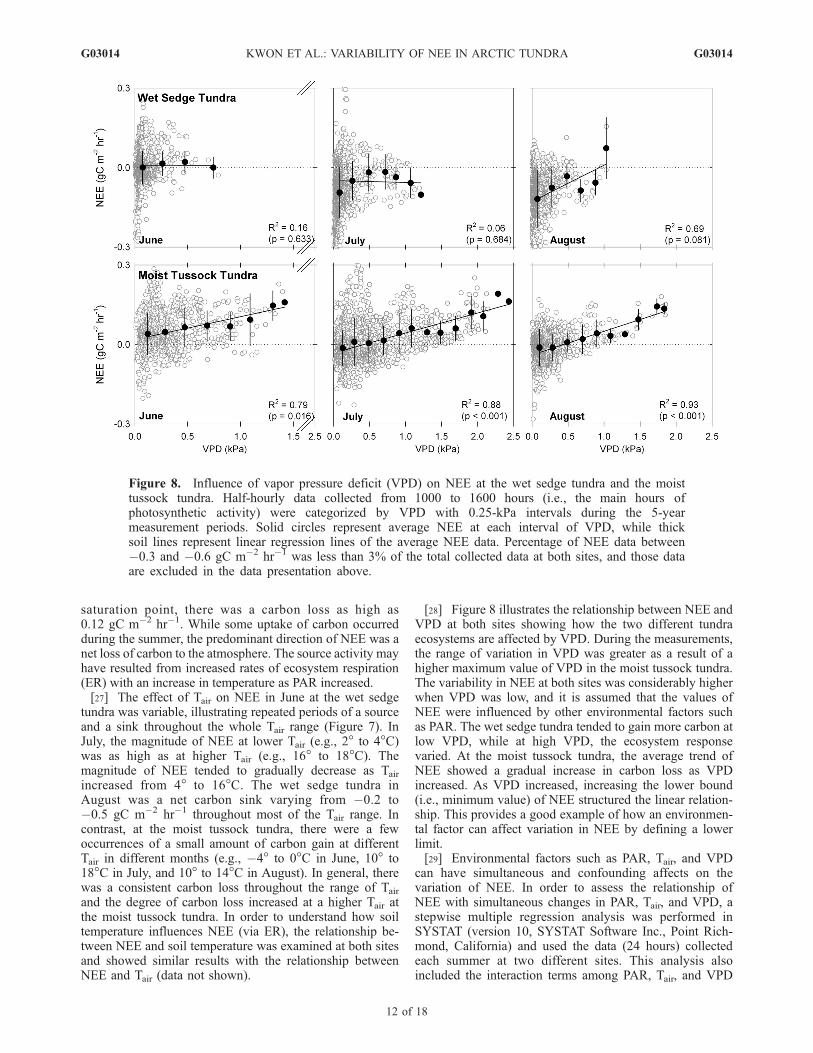
[28] Figure 8 illustrates the relationship between NEE andVPD at both sites showing how the two different tundraecosystems are affected by VPD. During the measurements,the range of variation in VPD was greater as a result of ahigher maximum value of VPD in the moist tussock tundra.The variability in NEE at both sites was considerably higherwhen VPD was low, and it is assumed that the values ofNEE were influenced by other environmental factors suchas PAR. The wet sedge tundra tended to gain more carbon atlow VPD, while at high VPD, the ecosystem responsevaried. At the moist tussock tundra, the average trend ofNEE showed a gradual increase in carbon loss as VPDincreased. As VPD increased, increasing the lower bound(i.e., minimum value) of NEE structured the linear relation-ship. This provides a good example of how an environmen-tal factor can affect variation in NEE by defining a lowerlimit.[29] Environmental factors such as PAR, Tair, and VPD
can have simultaneous and confounding affects on thevariation of NEE. In order to assess the relationship ofNEE with simultaneous changes in PAR, Tair, and VPD, astepwise multiple regression analysis was performed inSYSTAT (version 10, SYSTAT Software Inc., Point Rich-mond, California) and used the data (24 hours) collectedeach summer at two different sites. This analysis alsoincluded the interaction terms among PAR, Tair, and VPD
Figure 8. Influence of vapor pressure deficit (VPD) on NEE at the wet sedge tundra and the moisttussock tundra. Half-hourly data collected from 1000 to 1600 hours (i.e., the main hours ofphotosynthetic activity) were categorized by VPD with 0.25-kPa intervals during the 5-yearmeasurement periods. Solid circles represent average NEE at each interval of VPD, while thicksoil lines represent linear regression lines of the average NEE data. Percentage of NEE data between�0.3 and �0.6 gC m�2 hr�1 was less than 3% of the total collected data at both sites, and those dataare excluded in the data presentation above.
G03014 KWON ET AL.: VARIABILITY OF NEE IN ARCTIC TUNDRA
12 of 18
G03014
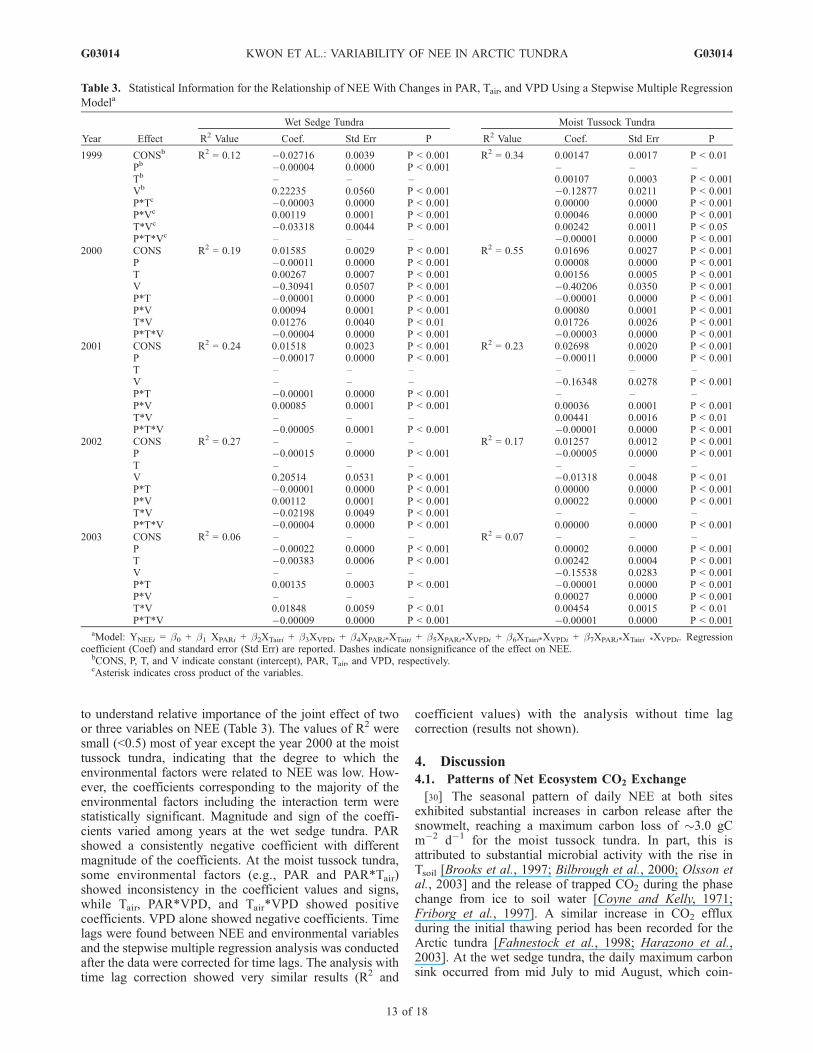
to understand relative importance of the joint effect of twoor three variables on NEE (Table 3). The values of R2 weresmall (<0.5) most of year except the year 2000 at the moisttussock tundra, indicating that the degree to which theenvironmental factors were related to NEE was low. How-ever, the coefficients corresponding to the majority of theenvironmental factors including the interaction term werestatistically significant. Magnitude and sign of the coeffi-cients varied among years at the wet sedge tundra. PARshowed a consistently negative coefficient with differentmagnitude of the coefficients. At the moist tussock tundra,some environmental factors (e.g., PAR and PAR*Tair)showed inconsistency in the coefficient values and signs,while Tair, PAR*VPD, and Tair*VPD showed positivecoefficients. VPD alone showed negative coefficients. Timelags were found between NEE and environmental variablesand the stepwise multiple regression analysis was conductedafter the data were corrected for time lags. The analysis withtime lag correction showed very similar results (R2 and
coefficient values) with the analysis without time lagcorrection (results not shown).
4. Discussion
4.1. Patterns of Net Ecosystem CO2 Exchange
[30] The seasonal pattern of daily NEE at both sitesexhibited substantial increases in carbon release after thesnowmelt, reaching a maximum carbon loss of �3.0 gCm�2 d�1 for the moist tussock tundra. In part, this isattributed to substantial microbial activity with the rise inTsoil [Brooks et al., 1997; Bilbrough et al., 2000; Olsson etal., 2003] and the release of trapped CO2 during the phasechange from ice to soil water [Coyne and Kelly, 1971;Friborg et al., 1997]. A similar increase in CO2 effluxduring the initial thawing period has been recorded for theArctic tundra [Fahnestock et al., 1998; Harazono et al.,2003]. At the wet sedge tundra, the daily maximum carbonsink occurred from mid July to mid August, which coin-
Table 3. Statistical Information for the Relationship of NEE With Changes in PAR, Tair, and VPD Using a Stepwise Multiple Regression
Modela
Year Effect
Wet Sedge Tundra Moist Tussock Tundra
R2 Value Coef. Std Err P R2 Value Coef. Std Err P
1999 CONSb R2 = 0.12 �0.02716 0.0039 P < 0.001 R2 = 0.34 0.00147 0.0017 P < 0.01Pb �0.00004 0.0000 P < 0.001 – – –Tb – – – 0.00107 0.0003 P < 0.001Vb 0.22235 0.0560 P < 0.001 �0.12877 0.0211 P < 0.001P*Tc �0.00003 0.0000 P < 0.001 0.00000 0.0000 P < 0.001P*Vc 0.00119 0.0001 P < 0.001 0.00046 0.0000 P < 0.001T*Vc �0.03318 0.0044 P < 0.001 0.00242 0.0011 P < 0.05P*T*Vc – – – �0.00001 0.0000 P < 0.001
2000 CONS R2 = 0.19 0.01585 0.0029 P < 0.001 R2 = 0.55 0.01696 0.0027 P < 0.001P �0.00011 0.0000 P < 0.001 0.00008 0.0000 P < 0.001T 0.00267 0.0007 P < 0.001 0.00156 0.0005 P < 0.001V �0.30941 0.0507 P < 0.001 �0.40206 0.0350 P < 0.001P*T �0.00001 0.0000 P < 0.001 �0.00001 0.0000 P < 0.001P*V 0.00094 0.0001 P < 0.001 0.00080 0.0001 P < 0.001T*V 0.01276 0.0040 P < 0.01 0.01726 0.0026 P < 0.001P*T*V �0.00004 0.0000 P < 0.001 �0.00003 0.0000 P < 0.001
2001 CONS R2 = 0.24 0.01518 0.0023 P < 0.001 R2 = 0.23 0.02698 0.0020 P < 0.001P �0.00017 0.0000 P < 0.001 �0.00011 0.0000 P < 0.001T – – – – – –V – – – �0.16348 0.0278 P < 0.001P*T �0.00001 0.0000 P < 0.001 – – –P*V 0.00085 0.0001 P < 0.001 0.00036 0.0001 P < 0.001T*V – – – 0.00441 0.0016 P < 0.01P*T*V �0.00005 0.0001 P < 0.001 �0.00001 0.0000 P < 0.001
2002 CONS R2 = 0.27 – – – R2 = 0.17 0.01257 0.0012 P < 0.001P �0.00015 0.0000 P < 0.001 �0.00005 0.0000 P < 0.001T – – – – – –V 0.20514 0.0531 P < 0.001 �0.01318 0.0048 P < 0.01P*T �0.00001 0.0000 P < 0.001 0.00000 0.0000 P < 0.001P*V 0.00112 0.0001 P < 0.001 0.00022 0.0000 P < 0.001T*V �0.02198 0.0049 P < 0.001 – – –P*T*V �0.00004 0.0000 P < 0.001 0.00000 0.0000 P < 0.001
2003 CONS R2 = 0.06 – – – R2 = 0.07 – – –P �0.00022 0.0000 P < 0.001 0.00002 0.0000 P < 0.001T �0.00383 0.0006 P < 0.001 0.00242 0.0004 P < 0.001V – – – �0.15538 0.0283 P < 0.001P*T 0.00135 0.0003 P < 0.001 �0.00001 0.0000 P < 0.001P*V – – – 0.00027 0.0000 P < 0.001T*V 0.01848 0.0059 P < 0.01 0.00454 0.0015 P < 0.01P*T*V �0.00009 0.0000 P < 0.001 �0.00001 0.0000 P < 0.001
aModel: YNEEi = �0 + �1 XPARi + �2XTairi + �3XVPDi + �4XPARi*XTairi + �5XPARi*XVPDi + �6XTairi*XVPDi + �7XPARi*XTairi *XVPDi. Regressioncoefficient (Coef) and standard error (Std Err) are reported. Dashes indicate nonsignificance of the effect on NEE.
bCONS, P, T, and V indicate constant (intercept), PAR, Tair, and VPD, respectively.cAsterisk indicates cross product of the variables.
G03014 KWON ET AL.: VARIABILITY OF NEE IN ARCTIC TUNDRA
13 of 18
G03014
cided with the maximum canopy development as indicatedby ground-based measurements of NDVI ranging from 0.49to 0.58 (data collected from 2000–2002) (J. Gamon, per-sonal communication, 2002). The decreased rates of carbongain in the late summer season resulted from the combina-tion of reduced PAR, and a decrease in plant productivitydue to the onset of plant senescence [Tieszen, 1975, 1978].[31] The moist tussock tundra was frequently a small
source of carbon to the atmosphere or a weak sink. Whilewe were unable to partition the net flux into GPP and ER, itis thought that the relative contribution of ER was tightlylinked with the magnitude of carbon loss at the moist tussocktundra. Warmer and drier conditions at the moist tussocktundra would intensify ER [Johnson et al., 1996] and eitherlessen carbon gain to the ecosystem or enhance carbon lossto the atmosphere. In a study where moist tussock and wetsedge tundra at the same latitude were measured, the latterincorporated 1.5 times more carbon despite a twofold lowerestimated GPP [Vourlitis et al., 2000a]. The higher carbonuptake by the wet sedge was attributed in part to a lower ER.Warmer, drier conditions and a lower water table haveconsistently resulted in less carbon uptake, or a greater lossof carbon in Arctic ecosystems [Oechel et al., 1993, 1998],primarily by an increase in aerobic respiration.[32] The strong carbon gain occurring in early June 2002
(unlike other measurement years) at the wet sedge tundramaybe a result of a relatively high photosynthetic capacity due toan early onset of plant development following the earlierdisappearance of snow [Oechel and Sveinbjornsson, 1978;Tieszen, 1978; Semikhatova et al., 1992] and inhibition of ERfrom low temperatures and the frozen soils at the time [Grantand Rochette, 1994]. This result suggests that early snowmeltin spring, which extends the length of the growing season,will affect seasonal carbon balance by increasing carbonsequestration to the ecosystem [Aurela et al., 2004].
4.2. Environmental Controls on Net EcosystemCO2 Exchange
[33] Previous results from individual leaf studies, photo-synthesis of the Arctic plants show seldom light saturated[Tieszen, 1973, 1978; Grulke et al., 1990]. In this study,however, light saturation at the whole ecosystem level wasobserved between 600 and 1000 �mol m�2 s�1 at both sites.At the wet sedge tundra site, inhibition of carbon gain oreventually carbon loss (only observed early in the summer),after light saturation, may be due to an increase in ER,photo-inhibition or photo-oxidation of the photosyntheticapparatus [Oechel and Collins, 1976] and/or water stress inthe tundra plants [Stoner and Miller, 1975; Caldwell et al.,1978; Miller et al., 1978; Grulke and Bliss, 1988] underhigh radiation and temperature. At the moist tussock tundra,the pattern of an exponential increase in NEE with increas-ing PAR suggests that light was indirectly controlling NEEby increasing temperature and ER resulting in carbon lossfrom the tundra ecosystem. The contrast in the light re-sponse of NEE at the two different sites suggests differencesin physiology and the seasonal development of the ecosys-tems, and in part to difference in response to environmentalconditions. These results suggest that PAR has a direct andimmediate effect on controlling NEE before light saturationoccurs whereas at higher levels of PAR, other factors suchas temperature and water stress may have a greater influence
on increasing ER. ER appeared to play a larger role indetermining NEE at the moist tussock tundra site than thewet sedge tundra site.[34] The wet sedge tundra showed relative independence
from temperature with respect to NEE, while for the moisttussock tundra, a considerable increase in carbon loss wasobserved as temperature increased. On the basis of leaf-level gas exchange studies at Barrow [Tieszen, 1975, 1978;Limbach et al., 1982], the optimal air temperature forphotosynthesis ranges between 10� and 20�C. In this study,the optimum temperature for the whole ecosystem level atthe wet sedge tundra was less distinct, illustrating high ratesof net carbon uptake over a range of temperatures from 0� to24�C. This demonstrates that the wet sedge tundra isadapted to a wide range of air temperature [Tieszen, 1978;Chapin et al., 1995] and that the photosynthetic ability ofthe ecosystem may not be constrained by low air temper-atures [Billings, 1975]. Other possible reasons for the lackof influence of temperature on NEE may be (1) a strongereffect of PAR than temperature on NEE over the short-termperiod (i.e., 30 min), (2) a time lag of the system’s responseto temperature change, and (3) the effect of secondarylimitations such as water stress from increased temperatures.[35] On the other hand, the increase in carbon loss at the
moist tussock tundra site may be due to a greater increase inER than in photosynthesis at high temperature and low soilmoisture conditions [Shaver et al., 1992; Johnson et al., 1996;Sommerkorn et al., 1999] even with adequate radiation.Owing to a lack of stomatal control, mosses and lichens canbe highly responsive to high temperature and low soilmoisture. Desiccation of the moss tissues can enhance therates of respiration [Oechel and Sveinbjornsson, 1978; Skreand Oechel, 1981]. However, above ground respirationincluding vascular plants and mosses is relatively smallcontributing about 10% to the total ER [Green and Lange,1994; Sommerkorn et al., 1999], though it accounts for morethan 83% of total biomass (g m�2) at the moist tussock tundrasite [Walker et al., 2003]. Soil respiration is highly responsiveto temperature changes with increasing rates of microbialrespiration when the soil changes from saturated tomesic condition [Heal et al., 1981; Peterson et al., 1984].Soil respiration consists of about 90% of the total ER[Sommerkorn et al., 1999] and can exceed gains fromgross photosynthesis resulting in the moist tussock tundrabecoming a net carbon source. A higher ER is attributed to thewell-drained soil at the moist tussock tundra resulting in anincrease in soil temperature and better soil aeration, and thusan increase in aerobic microbial activity and decompositionrates [Billings et al., 1983; Johnson et al., 1996].[36] Summer mean soil temperatures were consistently
warmer in the moist tussock than the wet sedge tundra(Table 1). The effect of air temperature on NEE was similarto that of soil temperature, indicating that NEE at the wetsedge tundra was mostly determined by the photosyntheticcapacity, while NEE at the moist tussock tundra wasinfluenced by ER. Therefore the different responses of thetwo ecosystems to temperature change may be that soiltemperature (near freezing except in 2003) was never highenough to have a major influence on NEE (via ER) in thewet sedge tundra, while the moist tussock tundra was moreresponsive to temperature changes under warmer and drierconditions.
G03014 KWON ET AL.: VARIABILITY OF NEE IN ARCTIC TUNDRA
14 of 18
G03014
[37] The wet sedge tundra tended to gain more carbonthan it lost carbon at low VPD suggesting that the ecosys-tem is well adapted to low Tair and high RH conditions.Midday depression of NEE was found when the Tair andVPD were high (H. J. Kwon, unpublished data, 2005). Theeffect of VPD on NEE is associated not only with environ-mental conditions but also different physiological stages ofthe plants during each growing season [Tieszen, 1978]. Thusthe lack of consistency in the pattern of NEE at high VPD,when all 5-year summer data were used in this analysis,may reflect the varying degree of influence of VPD on NEEdepending on the sensitivity of physiological responses,which can change within and between years [Chapin andShaver, 1996].[38] The moist tussock tundra became a strong carbon
source to the atmosphere as VPD increased. These changesin the magnitude and sign of NEE may be attributed toincreased water stress between the atmosphere and theecosystem [Stoner and Miller, 1975; Caldwell et al.,1978; Miller et al., 1978; Grulke and Bliss, 1988; Williamset al., 2000] and/or enhanced ecosystem respiration rates.As the VPD increases, the plant reduces the stomatalaperture restricting water loss [Miller et al., 1978] and limitsthe photosynthetic rate [Stoner and Miller, 1975; Caldwellet al., 1978]. Drier air coupled with lower soil moisturelevels tends to promote increased ER and eventually in-crease CO2 efflux [Caldwell et al., 1978; Oberbauer et al.,1991]. The different degree of influence of water stress onNEE suggests that moist tussock tundra is more responsiveto changes in both Tair and VPD than at the wet sedgetundra [Shaver et al., 1992].[39] In order to understand how the seasonal carbon
budget was affected by interseasonal variation in averageclimate for the summer, the relationship between cumulativeNEE and seasonal average environmental factors wasassessed (data not shown). Seasonal average PAR did nothave an impact on cumulative NEE at either ecosystems.Warmer summers had virtually no influence on carbon lossin the wet sedge tundra, whereas increasing temperature inthe moist tussock tundra had a substantial effect on carbonloss. This result implies that the moist tussock tundra ismore responsive to warmer temperature than the wet sedgetundra. Although the interseasonal comparison can indicatea relationship between seasonal carbon budget and climatevariation and a possible transition of the ecosystems, thereare not sufficient data to report and draw a concreteconclusion in this study.
4.3. Influence of Spatial Variability of Net EcosystemCO2 Exchange on Carbon Budget
[40] The high degree of spatial heterogeneity in Arctictundra ecosystems at a variety of scales complicates theprocess of estimating a regional-scale carbon budget[McFadden et al., 1998; Vourlitis et al., 2003] and intro-duces considerable uncertainty into simulations of theArctic regional response to climate change. Notably, thespatial resolutions used in parameterizations of regional-scale models are often coarse, and the large difference incarbon flux reported for adjacent ecosystems in this study isneglected.[41] Distinctive spatial variability is presented in the
land cover map with the resolution of 0.03 � 0.03 km
(Figure 1a) obtained from digital analysis of Landsat multi-spectral scanner (MSS), Landsat thematic mapper (TM), andthe Satellite Pour l’Observation de La Terre (SPOT) multi-spectral scanner data. Most of the spatial variability inclassification is lost when the resolution of the land cover is1�1 km as obtained fromNOAA14 satellite. This resolution(Figures 1b and 1c) is similar to that used in the globallyapplied MOD17 model estimates of net primary productionusing imagery from the Moderate-Resolution ImagingSpectroradiometer (MODIS) sensor [Turner et al., 2005].Regionally applied carbon balance models such as TerrestrialEcosystem Model (TEM) and General Ecosystem Model(GEM) simulate carbon dynamics over pan-Arctic tundrausing two tundra types, polar desert/alpine tundra and wet/moist tundra, with 0.5� � 0.5� resolution [Clein et al., 2000;McGuire et al., 2000]. Figure 1c shows a land cover mapcreated with a similar resolution used in TEM.[42] Coarse spatial resolutions usually result in a coars-
ening of the land cover classification scheme. Although theMODIS-based carbon flux estimates use a 1 � 1 kmresolution vegetation map, the model algorithm containsbroad vegetation classes and the two sites used in this studyin the Arctic region are treated as open shrublands(F. Heinsch, personal communication, 2004). TEM andGEM also treat the two measurement sites as the samevegetation type (i.e., wet/moist tundra) [Clein et al., 2000].This lack of detailed representation of the spatial heteroge-neity in classification with the regional model applicationscontributes to uncertainty of carbon budget estimates overthe Arctic region. For example, Clein et al. [2000] estimatednet ecosystem productivity (NEP) over the pan-Arctic usingTEM and GEM from 1995 to 2100. The simulationsspanned with actual climate input data from 1921 to 1994and projected climates from 1995 to 2100. The magnitudeof NEP simulated by the models for summer of 2000(June�August) for both of the sites in this study rangedfrom a sink of 53.5 to 60.7 gC m�2 summer�1 (J. S. Cleinand A. D. McGuire, personal communication, 2004). Thecontrasting pattern of carbon exchange from the measure-ments at both sites was not represented in the model results.[43] The discrepancy between the measurements and the
predictions of the models may be associated with a lack ofunderstanding of ecosystem function and environmentalcontrols on different tundra ecosystems as well as problemswith classification. Although there are increasing efforts toincorporate the spatial variability at the regional scale, themodels still cannot capture the finer spatial scale variabilitywhich controls and determines the magnitude and directionof carbon balance. The results in this study suggest thatgeneralization and simplification in the large-scale modelslose important information such as ecosystem function, andecosystem response and sensitivity to a changing climate.The discrepancy between the measurements and the predic-tion of the models highlights the significance of understand-ing and incorporating the spatial variation in climate andvegetation in order to reduce uncertainties in estimatingcarbon budget over the Arctic region.
5. Conclusion
[44] The results in this study show the spatial andtemporal patterns and controls on NEE of two different
G03014 KWON ET AL.: VARIABILITY OF NEE IN ARCTIC TUNDRA
15 of 18
G03014
tundra ecosystems over five summer seasons. The contrast-ing patterns and magnitudes of NEE at the two sitesdemonstrate that spatial variability over fairly short distancescan be more important in landscape NEE than in intra-annualand interannual variability owing to the two ecosystem’sresponse to environmental factors. Wet sedge tundra showsthe potential for substantial carbon gain across awide range oftemperatures, suggesting rapid and effective acclimation(e.g., over days) to temperature. In contrast, the moisttussock tundra illustrates a strong temperature dependenceshowing a strong carbon loss as temperature increases. Thedifference in the ecosystem response to temperature may befrom the result of influence of soil temperature on NEE (viaER). Soil temperatures were consistently warmer in moisttussock tundra than wet sedge tundra, which may be whyNEE was more responsive to temperature in the moisttussock tundra. The relative effects of water stress on moisttussock tundra are stronger than on wet sedge tundra result-ing in greater carbon loss at high temperature and VPD. Theimportance of ecosystem respiration is highlighted by theincrease in carbon loss which exceeded gains from grossphotosynthesis under high temperatures when upper soillayer is relatively dry.[45] Fine-scale variability (i.e., geomorphology, low- and
high-centered polygons, soil type, and hydrology) is acharacteristic of the Arctic tundra region. This variabilitymay be largely missed in current experiments and modelsover the larger spatial scales [Oechel and Vourlitis, 1994;McGuire et al., 2000; Vourlitis et al., 2003]. Although theeddy covariance technique can detect fine-scale variability(�1 km) and provide information on the patterns andprimary controls on carbon exchange, this approach cannotcover larger-scale variability (�100 km) unless multipletower measurements are applied to the regional scale. Thesetwo measurement sites therefore cannot be generalized torepresent the heterogeneous characteristic of the entireArctic region. It is difficult to extrapolate conclusionsattained from one kind of tundra to another tundra region[Billings, 1973]. Extrapolations of the carbon balance fromthe local level to the region will require careful consider-ation. Currently, the regional models present function andstructure of tundra ecosystems in a simpler way comparedwith most measurements and plot-scale ecosystem models[Clein et al., 2000; Williams et al., 2000]. Simplification ofmodel parameters, and differences in spatial and temporalscales between measurements and models, limit the abilityof the models to capture regional-scale dynamics with theaccuracy and precision possible with plot-based measure-ments. For improved model assessment of the Arcticregional carbon balance, better characterization of spatialvariability and associated environmental controls will berequired. This will improve current calculation and predic-tions of the Arctic terrestrial carbon balance.
[46] Acknowledgments. This research was supported by the NationalScience Foundations, Arctic Systems Sciences, the Land-Atmosphere-Ice-Interactions (LAII) Program (OPP-9732105), the Terrestrial EcologicalResearch Initiative (TECO) Program (DEB-973004), and the Study ofEnvironmental Arctic Change (SEARCH) Program (OPP-0119060). Lo-gistical support was provided by personnel from the Barrow Arctic ScienceConsortium (BASC) and VECO Polar Resources (VPR). We also gratefullyacknowledge Faith Ann Heinsch, David Turner, and Fred Huemmrich fortheir constructive comments as well as field assistance provided by Glen
Kinoshita, Kimberly Davis, and Phillip Lambert. We thank reviewers forreviewing and improving this manuscript.
ReferencesAnthoni, P. M., B. E. Law, and M. H. Unsworth (1999), Carbon and watervapor exchange of an open-canopied ponderosa pine ecosystem, Agric.For. Meteorol., 95, 151–168.
Auble, D. L., and T. P. Meyers (1992), An open path, fast response infraredabsorption gas analyzer for H2O and CO2, Boundary Layer Meteorol., 59,243–256.
Aurela, M., T. Laurila, and J. P. Tuovinen (2004), The timing of snow meltcontrols the annual CO2 balance in a subarctic fen, Geophys. Res. Lett.,31, L16119, doi:10.1029/2004GL020315.
Baldocchi, D. D. (2003), Assessing the eddy covariance technique forevaluating carbon dioxide exchange rates of ecosystems: Past, presentand future, Global Change Biol., 9, 479–492.
Baldocchi, D. D., B. B. Hicks, and T. P. Meyers (1988), Measuring bio-sphere-atmosphere exchanges of biologically related gases with micro-meteorological methods, Ecology, 69, 1331–1340.
Barford, C. C., et al. (2001), Factors controlling long- and short-term se-questration of atmospheric CO2 in a mid-latitude forest, Science, 294,1688–1691.
Batzli, G. O. (1980), Patterns of vegetation and herbivory in arctic tundra:Results from the Research on Arctic Tundra Environments (RATE) Pro-gram, Arct. Alp. Res., 12, 401–518.
Bilbrough, C. J., J. M. Welker, and W. D. Bowman (2000), Early springnitrogen uptake by snow-covered plants: A comparison of arctic andalpine plant function under the snowpack, Arct. Antarct. Alp. Res., 32,404–411.
Billings, W. D. (1973), Arctic and alpine vegetations: Similarities, differ-ences, and susceptibility to disturbance, BioScience, 23, 697–704.
Billings, W. D. (1975), Arctic and alpine vegetation: Plants adaptations tocold summer climates, in Arctic and Alpine Environments, edited by J. D.Ives and R. G. Barry, pp. 403–443, Methuen, New York.
Billings, W. D., J. O. Luken, D. A. Mortensen, and K. M. Peterson (1983),Increasing atmospheric carbon dioxide and soil nitrogen on the carbonbalance of tundra microcosms, Oecologia, 65, 26–29.
Blanken, P. D., T. A. Black, P. C. Yang, H. H. Neumann, Z. Nesic,R. Staebler, G. den Hartog, M. D. Novak, and X. Lee (1997), Energybalance and canopy conductance of a boreal aspen forest: Partitioningoverstory and understory components, J. Geophys. Res., 102, 28,915–28,927.
Bonan, G. B. (1995), Land-atmosphere CO2 exchange simulated by a landsurface process model coupled to an atmospheric general circulationmodel, J. Geophys. Res., 100, 2817–2831.
Brooks, P. D., S. K. Schmidt, and M. W. Williams (1997), Winter produc-tion of CO2 and N2O from alpine tundra: Environmental controls andrelationship to inter-system C and N fluxes, Oecologia, 110, 403–413.
Brown, J., K. R. Everett, P. J. Webber, S. F. MacLean Jr., and D. F. Murray(1980), The coastal tundra at Barrow, in An Arctic Ecosystem: The Coast-al Tundra at Barrow, Alaska, edited by J. Brown et al., pp. 1–29, Dow-den, Hutchinson and Ross, Stroudsburg, Pa.
Caldwell, M. M., D. A. Johnson, and M. Fareed (1978), Constraints ontundra productivity: Photosynthetic capacity in relation to solar radiationutilization and water stress in Arctic and Alpine tundras, in Vegetationand Production Ecology of an Alaskan Arctic Tundra, edited by L. L.Tieszen, pp. 324–342, Springer, New York.
Chapin, F. S., III, and G. R. Shaver (1996), Physiological and growthresponses of Arctic plants to a field experiment simulating climaticchange, Ecology, 77, 822–840.
Chapin, F. S., III, P. C. Miller, W. D. Billings, and P. I. Coyne (1980),Carbon and nutrient budgets and their control in coastal tundra, in AnArctic Ecosystem: The Coastal Tundra at Barrow, Alaska, edited by J.Brown et al., pp. 458–482, Dowden, Hutchinson and Ross, Stroudsburg,Pa.
Chapin, F. S., III, G. R. Shaver, A. E. Giblin, K. J. Nadelhoffer, and J. A.Launder (1995), Responses of Arctic tundra to experimental and ob-served changes in climate, Ecology, 76, 694–711.
Chapin, F. S., III, et al. (2000), Arctic and boreal ecosystems of westernNorth America as components of the climate system, Global ChangeBiol., 6, 211–223.
Chapin, F. S., III, et al. (2005), Role of land-surface changes in Arcticsummer warming, Science, 310, 657–660.
Clein, J. S., B. L. Kwiatkowski, A. D. McGuire, J. E. Hobbie, E. B.Rastetter, J. M. Melillo, and D. W. Kicklighter (2000), Modeling carbonresponses of tundra ecosystems to historical and projected climate: Acomparison of a plot-and a global-scale ecosystem model to identifyprocess-based uncertainties, Global Change Biol., 6, 127–140.
Coyne, P. I., and J. J. Kelly (1971), Release of carbon dioxide from frozensoil to the arctic atmosphere, Nature, 234, 407–408.
G03014 KWON ET AL.: VARIABILITY OF NEE IN ARCTIC TUNDRA
16 of 18
G03014
Curtis, P. S., P. J. Hanson, P. Bolstad, C. Barford, J. C. Randolph, H. P.Schmid, and K. B. Wilson (2002), Biometric and eddy-covariance basedestimates of annual carbon storage in five eastern North American decid-uous forests, Agric. For. Meteorol., 113, 3–19.
Everett, K. R. (1980), Distribution and variability of soils near Atkassok,Alaska, Arct. Alp. Res., 12, 433–446.
Fahnestock, J. T., M. H. Jones, P. D. Brooks, D. A. Walker, and J. M.Welker (1998), Winter and early spring CO2 efflux from tundra commu-nities of northern Alaska, J. Geophys. Res., 103, 29,023–29,027.
Falge, E. D., et al. (2001), Gap filling strategies for defensible annual sumsof net ecosystem, Agric. For. Meteorol., 107, 43–69.
Fan, S. M., S. C. Wofsy, P. S. Bakwin, D. J. Jacob, S. M. Anderson, P. L.Kebabian, J. B. McManus, C. E. Kolb, and D. R. Fitzjarrald (1992),Micrometeorological measurements of CH4 and CO2 exchange betweenthe atmosphere and subarctic tundra, J. Geophys. Res., 97, 16,627–16,643.
Frank, A. B., and W. A. Dugas (2001), Carbon dioxide fluxes over a north-ern, semiarid, mixed-grass prairie, Agric. For. Meteorol., 108, 317–326.
Friborg, T., T. R. Christensen, and H. Soegarrd (1997), Rapid response ofgreenhouse gas emission to early spring thaw in a subarctic mire asshown by micro-meteorological techniques, Geophys. Res. Lett.,24(23), 3061–3066.
Grant, R. F., and P. Rochette (1994), Soil microbial respiration at differenttemperatures and water potentials: Theory and mathematical modeling,Soil Sci. Soc. Am. J., 58, 1681–1690.
Green, T. G. A., and O. L. Lange (1994), Photosynthesis in poikilohydricplants: A comparison of lichens and bryophytes, in Ecophysiology ofPhotosynthesis, edited by E. D. Schulze and M. M. Caldwell, pp.391–342, Springer, New York.
Grogan, P., and F. S. Chapin III (2000), Initial effects of experimentalwarming on above- and below-ground components of net ecosystemCO2 exchange in Arctic tundra, Oecologia, 125, 512–520.
Grulke, N. E., and L. C. Bliss (1988), Comparative life history character-istics of two high arctic grasses, northwest territories, Ecology, 69, 484–496.
Grulke, N. E., G. H. Reichers, W. C. Oechel, U. Hjelm, and C. Jaeger(1990), Carbon balance in tussock tundra under ambient and elevatedCO2, Oecologia, 83, 483–494.
Halldn, S., and A. Lindroth (1992), Errors in net radiometry: Comparisonand evaluation of sic radiometer designs, J. Atmos. Oceanic Technol., 9,762–783.
Harazono, Y., M. Yoshimoto, M. Mano, G. L. Vourlitis, and W. C. Oechel(1998), Characteristics of energy and water budgets over wet sedge andtussock tundra ecosystems at North Slope in Alaska, Hydrol. Processes,12, 2163–2183.
Harazono, Y., M. Mano, A. Miyata, R. C. Zulueta, and W. C. Oechel(2003), Inter-annual carbon dioxide uptake of a wet sedge tundra eco-system in the Arctic, Tellus, Ser. B, 55, 215–231.
Hastings, S. J., W. C. Oechel, and A. Muhlia-Melo (2005), Diurnal, seaso-nal and annual variation in the net ecosystem CO2 exchange of a desertshrub community (Sarcocaulescent) in Baja California, Mexico, GlobalChange Biol., 11, 927–936.
Heal, O. W., P. W. Flanagan, D. D. French, and S. F. Maclean (1981),Decomposition and accumulation of organic matter, in Tundra Ecosys-tems, edited by L. C. Bliss, O. W. Heal, and J. J. Moore, pp. 587–633,Cambridge Univ. Press, New York.
Hinkel, K. M., F. Paetzold, F. E. Nelson, and J. G. Bockheim (2001),Patterns of soil temperature and moisture in the active layer and upperpermafrost at Barrow, Alaska: 1993–1999, Global Planet. Change,29(3–4), 293–309.
Hobbie, S. E., J. P. Schimel, S. E. Trumbore, and J. Randerson (2000),Controls over carbon storage and turnover in high latitude soils, GlobalChange Biology, 6, 196–210.
Janssens, I. A., et al. (2001), Productivity overshadows temperature indetermining soil and ecosystem respiration across European forests, Glo-bal Change Biol., 7, 269–278.
Johnson, L. C., G. R. Shaver, A. E. Giblin, K. J. Nadelhoffer, E. R.Rastetter, J. A. Laundre, and G. L. Murray (1996), Effects of drainageand temperature on carbon balance of tussock tundra microcosms,Oecologia, 108, 737–748.
Johnson, L. C., G. R. Shaver, D. H. Cades, E. Rastetter, K. Nadelhoffer,A. Giblin, J. Laundre, and A. Stanley (2000), Plant carbon-nutrientinteractions control CO2 exchange in Alaskan wet sedge tundraecosystems, Ecology, 81, 453–469.
Joint Federal State Land Use Planning Commission for Alaska (1973),Major Ecosystems of Alaska, U.S. Geol. Surv., Fairbanks, Alaska.
Kane, K. D., L. Hinzman, M. Woo, and K. R. Everett (1991), Arctichydrology and climate change, in Arctic Ecosystems in a ChangingClimate, edited by F. S. Chapin III et al., pp. 35–57, Elsevier, NewYork.
King, A. W., W. M. Post, and S. D. Wullschleger (1997), The potentialresponse of terrestrial carbon storage to changes in climate and atmo-spheric CO2, Clim. Change, 35, 199–227.
Komarkova, V., and P. J. Webber (1980), Two low Arctic vegetation mapsnear Atkasook, Alaska, Arct. Alp. Res., 12, 447–472.
Lachenbruch, A. H., and B. V. Marshall (1986), Changing climate:Geothermal evidence from permafrost in the Alaskan Arctic, Science,234, 689–696.
Law, B. E., et al. (2002), Environmental controls over carbon dioxide andwater vapor exchange of terrestrial vegetation, Agric. For. Meteorol., 113,97–120.
Leadley, P. W., and J. F. Reynolds (1992), Long-term response of an Arcticsedge to climate change: A simulation study, Ecol. Appl., 2(4), 323–340.
Limbach, W. E., W. C. Oechel, and W. Lowell (1982), Photosynthetic andrespiratory responses to temperature and light of three Alaskan tundragrowth forms, Holarctic Ecol., 5(2), 150–157.
Loescher, H. W., S. F. Oberbauer, H. L. Gholz, and D. B. Clark (2003),Environmental controls on net ecosystem-level carbon exchange andproductivity in a Central American tropical wet forest, Global ChangeBiol., 9, 396–412.
Lynch, A. H., W. L. Chapman, J. E. Walsh, and G. Weller (1995), Devel-opment of a regional climate model of the western Arctic, J. Clim., 8,1555–1570.
Maxwell, J. B. (1992), Arctic climate: Potential for change under globalwarming, in Arctic Ecosystems in a Changing Climate: An Ecophysiolo-gical Perspective, edited by F. S. Chapin III et al., pp. 11–34, Elsevier,New York.
McFadden, J. P., F. S. Chapin III, and D. Y. Hollinger (1998), Subgrid-scalevariability in the surface energy balance of Arctic tundra, J. Geophys.Res., 103, 28,947–28,961.
McFadden, J. P., W. Eugster, and F. S. Chapin III (2003), A regional studyof the controls on water vapor and CO2 exchange in Arctic tundra,Ecology, 84, 2762–2776.
McGuire, A. D., J. M. Melillo, L. A. Joyce, D. W. Kicklighter, A. L. Grace,B. Moore III, and C. J. Vorosmarty (1992), Interaction between carbon andnitrogen dynamics in estimating net primary productivity for potentialvegetation in North America, Global Biogeochem. Cycles, 6, 101–124.
McGuire, A. D., J. S. Clein, J. M. Melillo, D. W. Kicklighter, R. A. Meier,C. J. Vorosmarty, and M. C. Serreze (2000), Modelling carbon responsesof tundra ecosystems to historical and projected climate: Sensitivity ofpan-Arctic carbon storage to temporal and spatial variation in climate,Global Change Biol., 6, 141–159.
McMillen, R. T. (1986), A BASIC Program for eddy correlation in non-simple terrain, Tech. Memo. ERL ARL-147, 32 pp., NOAA, Silver Spring,Md.
McMillen, R. T. (1988), An eddy correlation technique with extendedapplicability to non-simple terrain, Boundary Layer Meteorol., 43,231–245.
Miller, P. C., W. A. Stoner, and J. R. Ehleringer (1978), Some aspects ofwater relations of arctic and alpine regions, in Vegetation and ProductionEcology of an Alaskan Arctic Tundra, edited by L. L. Tieszen, pp. 343–356, Springer, New York.
Mullier, S. V., A. E. Racoviteanu, and D. A. Walker (1999), Landsat MSS-derived land-cover map of northern Alaska: Extrapolation methods and acomparison with photo-interpreted and AVHRR-derived maps, Int. J.Remote Sens., 20, 2921–2946.
Oberbauer, S. F., J. D. Tenhunen, and J. F. Reynolds (1991), Environmentaleffects on CO2 efflux from water track and tussock tundra in ArcticAlaska, U. S. A., Arct. Alp. Res., 23, 162–169.
Oechel, W. C., and N. J. Collins (1976), Comparative CO2 exchange pat-terns in mosses from two tundra habitats at Barrow, Alaska, Can. J. Bot.,54, 1355–1369.
Oechel, W. C., and B. R. Strain (1985), Native species response to in-creased atmospheric CO2 concentration, in Direct Effects of IncreasingCarbon Dioxide on Vegetation, edited by B. R. Strain and J. C. Cure, pp.117–154, U.S. Dep. of Energy, Natl. Tech. Info. Serv., Springfield, Va.
Oechel, W. C., and B. Sveinbjornsson (1978), Primary production processesin Arctic bryophytes at Barrow, Alaska, in Vegetation and ProductionEcology of an Alaskan Arctic Tundra, edited by L. L. Tieszen, pp. 269–298, Springer, New York.
Oechel, W. C., and G. L. Vourlitis (1994), The effects of climate change onland-atmosphere feedbacks in Arctic tundra regions, Trends Ecol. Evol.,9, 324–329.
Oechel, W. C., S. J. Hastings, G. L. Vourlitis, M. Jenkins, G. Riechers, andN. Grulke (1993), Recent change of Arctic tundra ecosystems from a netcarbon dioxide sink to a source, Nature, 361, 520–523.
Oechel, W. C., G. L. Vourlitis, S. J. Hastings, R. Ault, and P. Bryant (1998),The effects of water table manipulation and elevated temperature on thenet CO2 flux of wet-sedge tundra ecosystems, Global Change Biol., 4,77–90.
G03014 KWON ET AL.: VARIABILITY OF NEE IN ARCTIC TUNDRA
17 of 18
G03014
Oechel, W. C., et al. (2000a), A scaling approach for quantifying the netCO2 flux of the Kuparuk River Basin, Alaska, Global Change Biol., 6,160–173.
Oechel, W. C., G. L. Vourlitis, S. J. Hastings, R. C. Zulueta, L. Hinzman,and D. Kane (2000b), Acclimation of ecosystem CO2 exchange in theAlaskan Arctic in response to decadal climate warming, Nature, 406,978–981.
Olsson, P. Q., M. Sturm, C. H. Racine, V. Romanovsky, and G. E. Liston(2003), Five stages of the Alaskan arctic cold season with ecosystemimplications, Arct. Antarct. Alp. Res., 25, 74–81.
Osterkamp, T. E., and V. E. Romanovsky (1999), Evidence for warmingand thawing of discontinuous permafrost in Alaska, Permafrost Perigla-cial Processes, 10, 17–37.
Peterson, K. M., W. D. Billings, and D. N. Reynolds (1984), Influence ofwater table and atmospheric CO2 concentration on the carbon balance ofArtic tundra, Arct. Alp. Res., 16, 331–335.
Ping, C. L., G. J. Michaelson, and J. M. Kimble (1997), Carbon storagealong a latitudinal transect in Alaska, Nutr. Cycl. Agroecosyst., 49, 235–242.
Post, W. M., W. R. Emanuel, P. J. Zinke, and A. G. Stangenberger (1982),Soil carbon pools and world life zones, Nature, 298, 328–338.
Roth, C. H., M. A. Malicki, and R. Plagge (1992), Empirical evaluation ofthe relationship between soil dielectric constant and volumetric watercontent as the basis for calibrating soil moisture measurements byTDR, J. Soil Sci., 43, 1–13.
Schlesinger, W. H. (1991), Biogeochemistry: An Analysis of GlobalChange, 443 pp., Elsevier, New York.
Schmid, H. P. (1997), Experimental design for flux measurements: Match-ing scales of observations and fluxes, Agric. For. Meteorol., 87, 179–200.
Scott, R. L., E. A. Edwards, W. J. Shuttleworth, T. E. Huxman, C. Watts,and D. C. Goodrich (2004), Interannual and seasonal variation in fluxesof water and carbon dioxide from a riparian woodland ecosystem, Agric.For. Meteorol., 122, 65–84.
Sellmann, P. V., K. L. Carey, C. Keeler, and A. D. Hartwell (1972), Terrainand coastal conditions on the arctic Alaskan coastal plain, ARPA Order1615, 72 pp., Corps of Eng., Hanover, N. H.
Semikhatova, O. A., T. V. Gerasimenko, and T. I. Ivanova (1992), Photo-synthesis, respiration, and growth of plants in the Soviet Arctic, in ArcticEcosystems in a Changing Climate: An Ecophysiological Perspective,edited by S. F. Chapin III et al., pp. 169–192, Elsevier, New York.
Shaver, G. R., W. D. Billings, F. S. Chapin III, A. E. Giblin, K. J. Nadel-hoffer, W. C. Oechel, and E. B. Rastetter (1992), Global change and thecarbon balance of arctic ecosystems, BioScience, 42, 433–441.
Skre, O., and W. C. Oechel (1981), Moss functioning in different taigaecosystems in interior Alaska: I. Seasonal, phenotypic, and drought ef-fects on photosynthesis and response patterns, Oecologia, 48, 50–59.
Sommerkorn, M., M. Bolter, and L. Kappen (1999), Carbon dioxide fluxesof soils and mosses in wet tundra of Taimyr Peninsular, Siberia: Control-ling factors and contribution to net system fluxes, Polar Res., 18(2),253–260.
Stone, R. S., E. G. Dutton, J. M. Harris, and D. Longenecker (2002), Earlierspring snowmelt in northern Alaska as an indicator of climate change,J. Geophys. Res., 107(D10), 4089, doi:10.1029/2000JD000286.
Stoner, W. A., and P. C. Miller (1975), Water relations of plant species inthe wet coastal tundra at Barrow, Alaska, Arct. Alp. Res., 7, 109–124.
Suyker, A. E., and S. B. Verma (2001), Year-round observations of the netecosystem exchange of carbon dioxide in a native tallgrass prairie, GlobalChange Biol., 7, 279–289.
Tieszen, L. L. (1973), Photosynthesis and respiration in Arctic tundragrasses: Filed light intensity and temperature response, Arct. Alp. Res.,5, 239–251.
Tieszen, L. L. (1975), CO2 exchange in the Alaskan arctic tundra: Seasonalchanges in the rate of photosynthesis of four species, Photosynthetica,9(4), 376–390.
Tieszen, L. L. (1978), Photosynthesis in the principal Barrow, Alaska spe-cies: A summary of field and laboratory responses, in Vegetation and
Production Ecology of an Alaskan Arctic Tundra, edited by L. L. Tieszen,pp. 241–266, Springer, New York.
Tieszen, L. L., P. C. Miller, and W. C. Oechel (1980), Photosynthesis, inAn Arctic Ecosystem: The Coastal Tundra at Barrow, Alaska, edited byJ. Brown et al., pp. 102 – 139, Dowden, Hutchinson and Ross,Stroudsburg, Pa.
Topp, G. C., J. L. Davis, and A. P. Annan (1980), Elecromagnetic determi-nation of soil water content: Measurement in coaxial transmission lines,Water Resour. Res., 16, 574–582.
Turner, D. P., et al. (2005), Site-level evaluation of satellite-based globalterrestrial gross primary production and net primary production monitor-ing, Global Change Biol., 11, 666–684.
Twine, T. E., W. P. Kustas, J. M. Norman, D. R. Cook, P. R. Houser, T. P.Meyers, J. H. Prueger, P. J. Starks, and M. L. Wesely (2000), Correctingeddy-covariance flux underestimates over a grassland, Agric. For. Me-teorol., 103, 279–300.
Vourlitis, G. L., and W. C. Oechel (1997), Landscape-scale CO2, H2O vaporand energy flux of moist-wet coastal tundra ecosystems over two growingseasons, J. Ecol., 85, 575–590.
Vourlitis, G. L., W. C. Oechel, A. Hope, D. Stow, B. Boynton, J. VerfaillieJr., R. Zulueta, and S. J. Hastings (2000a), Physiological models forscaling plot measurements of CO2 flux across an Arctic tundra landscape,Ecol. Appl., 10, 60–72.
Vourlitis, G. L., Y. Harazono, W. C. Oechel, M. Yoshimoto, and M. Mano(2000b), Spatial and temporal variations in hectare-scale net CO2 flux,respiration and gross primary production of Arctic tundra ecosystems,Funct. Ecol., 14, 203–214.
Vourlitis, G. L., J. Verfaillie, W. C. Oechel, A. Hope, D. Stow, andR. Engstrom (2003), Spatial variation in regional CO2 exchange forthe Kuparuk River Basin, Alaska over the summer growing season,Global Change Biol., 9, 930–941.
Walker, D. A., E. Binnian, B. M. Evans, N. D. Lederer, E. Nordstrand, andP. J. Webber (1989), Terrain, vegetation, and landscape evolution of theR4D research site, Brooks Range Foothills, Alaska, Holarctic Ecol., 12,238–261.
Walker, D. A., et al. (1998), Energy and trace-gas fluxes across a majorarctic soil pH boundary, Nature, 394, 469–472.
Walker, D. A., et al. (2003), Vegetation-soil-thaw-depth relationships alonga low-Arctic bioclimate gradient, Alaska: Synthesis of information fromthe ATLAS studies, Permafrost Periglacial Processes, 14, 103–123.
Wang, Y. P., and P. J. Polglase (1995), Carbon balance in the tundra, borealforest and humid tropical forest during climate change: Scaling up fromleaf physiology and soil carbon dynamics, Plant Cell Environ., 18,1226–1244.
Webb, E. K., G. I. Pearman, and R. Leuning (1980), Correction of fluxmeasurements for density effects due to heat and water vapor transfer,Q. J. R. Meteorol. Soc., 106, 85–100.
Webber, P. J. (1978), Spatial and temporal variation of the vegetation and itsproduction, Barrow, Alaska, in Vegetation and Production Ecology of anAlaskan Arctic Tundra, edited by L. L. Tieszen, pp. 37–112, Springer,New York.
Weller, G., and B. Holmgren (1974), The microclimates of the Arctictundra, J. Appl. Meteorol., 13, 854–862.
Williams, M., W. Eugster, E. B. Rastetter, J. P. McFadden, and F. S. ChapinIII (2000), The controls on net ecosystem productivity along an Arctictransect: A model comparison with flux measurements, Global ChangeBiol., 6, 116–126.
Xiao, A., J. M. Melillo, and D. W. Kicklighter (1998), Transient climatechange and net ecosystem production of the terrestrial biosphere, GlobalBiogeochem. Cycles, 12, 345–360.
�����������������������S. J. Hastings, W. C. Oechel, and R. C. Zulueta, Global Change Research
Group, Department of Biology, San Diego State University, San Diego, CA92182, USA.H.-J. Kwon, Department of Botany, University of Wyoming, 1000 E.
University Avenue, Laramie, WY 82071, USA. ([email protected])
G03014 KWON ET AL.: VARIABILITY OF NEE IN ARCTIC TUNDRA
18 of 18
G03014
Related Documents