ACCEPTED VERSION Russell, Bayden D. Effects of canopy-mediated abrasion and water flow on the early colonisation of turf-forming algae Marine and Freshwater Research, 2007; 58 (7):657-665 © CSIRO 2007 http://hdl.handle.net/2440/41511 PERMISSIONS http://www.publish.csiro.au/?nid=129&aid=4030 Authors retain the right to: • Use the work for non-commercial purposes within their institution subject to the usual copyright licencing agency arrangements • Use the work for further research and presentations at meetings and conferences • Use the illustrations (line art, photographs, figures, plates) and research data in their own future works • Share print or digital copies of their work with colleagues for personal use or study • Include the work in part or in full in a thesis provided it is not published for commercial gain • Place his/her pre-publication version of the work on a pre-print server • Place his/her pre-publication version of the work on a personal website or institutional repository on condition that there is a link to the definitive version on the CSIRO PUBLISHING web site. 27 th August 2012

Welcome message from author
This document is posted to help you gain knowledge. Please leave a comment to let me know what you think about it! Share it to your friends and learn new things together.
Transcript

ACCEPTED VERSION
Russell, Bayden D. Effects of canopy-mediated abrasion and water flow on the early colonisation of turf-forming algae Marine and Freshwater Research, 2007; 58 (7):657-665
© CSIRO 2007
http://hdl.handle.net/2440/41511
PERMISSIONS
http://www.publish.csiro.au/?nid=129&aid=4030
Authors retain the right to:
• Use the work for non-commercial purposes within their institution subject to the usual copyright licencing agency arrangements
• Use the work for further research and presentations at meetings and conferences • Use the illustrations (line art, photographs, figures, plates) and research data in their
own future works • Share print or digital copies of their work with colleagues for personal use or study • Include the work in part or in full in a thesis provided it is not published for commercial
gain • Place his/her pre-publication version of the work on a pre-print server • Place his/her pre-publication version of the work on a personal website or institutional
repository on condition that there is a link to the definitive version on the CSIRO PUBLISHING web site.
27th August 2012

1
Published in: Marine and Freshwater Research, 2007; 58 (7):657-665 1
2
3
4
Effects of canopy-mediated abrasion and water flow on the early 5
colonisation of turf-forming algae 6
7
8
Bayden D. Russell 9
10
11
Southern Seas Ecology Laboratories, School of Earth and Environmental Sciences, DP418, 12
University of Adelaide, Adelaide, South Australia 5005, Australia 13
(Email: [email protected], Fax: +61 8 8303 4364) 14
15
16
17
18
Extra keywords: algal canopy, water flow, abrasion, kelp, light penetration, shade 19
20
Running head: Canopy abrasion and water flow 21
22

2
Abstract. 23
Canopies in both terrestrial and marine systems modify biotic and abiotic conditions, 24
having a large effect on the understorey. In marine systems, algal canopies form 25
predictable associations with the benthic understorey, and canopy-mediated processes may 26
maintain these associations. Three canopy-mediated processes that are inherently linked 27
are water flow through a canopy, abrasion of the substrate by the canopy, and light 28
penetration. These processes were experimentally reduced to test the hypotheses that turf-29
forming algae would be positively affected by: (1) reduced abrasion by kelp canopies and 30
(2) reduced water flow, and (3) negatively affected by shading. Biomass of turf-forming 31
algae was greater when abrasion was reduced, but less when light was reduced. In contrast 32
to predictions, however, reduced water flow had a negative effect on the percentage cover 33
and biomass of turf-forming algae, rejecting the second hypothesis. It seems, however, that 34
this negative effect was caused by an increase in shading associated with reduced canopy 35
movement, not a reduction of water flow per se. None of the factors accounted for all of 36
the change seen in understorey algae, indicating that it is important to study the interactive 37
effects of physical processes. 38
39
40

3
Introduction 41
One of the most striking and consistent generalisations in ecology is that the presence of a 42
canopy affects the composition of the understorey community, in part through 43
modification of the physical environment (Belyea and Lancaster 1999). However, without 44
understanding the processes by which this modification occurs, generalities cannot be 45
identified, leading to a situation where every new system has to be studied without any 46
prior knowledge (Levin 1992). Therefore, understanding the specific processes by which 47
canopies alter the understorey may provide us with the ability to predict species 48
associations and distributions (Wright and Jones 2004). 49
50
Predictable associations exist between algal canopies and the benthic understorey (Dayton 51
et al. 1984; Kennelly and Underwood 1993; Bertness et al. 1999; Bruno 2000; Irving and 52
Connell 2006b). These associations may be related to the ability of canopies to alter the 53
physical environment, and can be both positive (Bertness et al. 1999; Irving et al. 2004a) 54
and negative (Kennelly 1989; Connell 2003b; Irving and Connell 2006a). Regardless of 55
the nature of this relationship, however, when canopy is removed a different set of taxa 56
tends to dominate space (e.g. Dayton et al. 1992; Edwards 1998; Bulleri et al. 2002; Irving 57
and Connell 2006b). 58
59
Numerous studies have demonstrated the effect of canopies on the understorey, but it is 60
often difficult to separate the contribution of individual physical processes, possibly 61
because many processes are linked (e.g. water movement, abrasion and shading). 62
For example, in areas of greater water movement the canopy moves to a greater extent, 63
subsequently causing both more abrasion of the substrate (Kennelly 1989; Toohey et al. 64
2004) and changes in light conditions. Therefore, it could be expected that in areas of less 65

4
water movement, the effect of canopy abrasion may be less, but shading more, than in 66
areas of greater water movement. Investigating the interactive effects of these factors may 67
provide us with a better understanding of canopy-understorey relationships. 68
69
Algal canopies alter water flow across the benthos by creating a physical barrier to the 70
water (Eckman et al. 1989). In doing so, the canopy itself is moved by the water, sweeping 71
across the substrate and causing surface abrasion. This physical abrasion can alter the 72
species composition of the understorey by directly excluding invertebrates (e.g. Duggins et 73
al. 1990; Connell 2003b) and algae (Velimirov and Griffiths 1979; Kennelly 1989; Irving 74
and Connell 2006a; Irving and Connell 2006b). Light penetration is also reduced under 75
canopies (shading), and may have large effects on the benthic understorey (Reed and 76
Foster 1984; Kennelly 1989; Edwards 1998; Connell 2005). Although the individual 77
effects of these physical factors have been well demonstrated, their interactive effects are 78
currently unknown. 79
80
In southern Australia, filamentous turf-forming algae dominate open space on hard, 81
subtidal substrate in the absence of an algal canopy (Fowler-Walker and Connell 2002; 82
Irving et al. 2004b), but are quickly lost from the benthos with the addition of a canopy 83
(Melville and Connell 2001; Irving and Connell 2006a; Irving and Connell 2006b). I 84
experimentally altered the amount of water flow through canopies, the amount of abrasion 85
by canopies, and light intensity to test the hypotheses that turf-forming algae would be 86
positively affected by: (1) reduced abrasion by kelp canopies and (2) reduced water flow, 87
and (3) negatively affected by shading (reduced light). 88
89

5
Materials and methods 90
Study site 91
The study site (West Island, South Australia, 35°36’ S, 138°35’ E) consists of a sloping 92
boulder reef that terminates in sand at ~ 5 m depth and supports diverse assemblages of 93
algae (Shepherd and Womersley 1970), including the canopy alga Ecklonia radiata (C. 94
Agardh) J. Agardh and the filamentous turf-forming algae Feldmannia lebelli Crouan and 95
Crouan and F. globifera Kuetzig. Experimental units (see below) were attached to 96
boulders on experimental reefs placed on sand at ~ 5 m depth (see Shepherd and Turner 97
1985 for a photograph of the experimental reefs). 98
99
Natural v. artificial abrasion 100
The first experiment had two aims: (1) to assess the extent to which artificial kelp 101
mimicked natural abrasion by E. radiata and (2) assess the effects of abrasion on turf-102
forming algae. The effects of type of kelp (artificial v. natural) was tested in a crossed 103
design with abrasion (present v. absent v. procedural control; n = 4 per treatment). The 104
“abrasion present” treatment was open settlement plates (see below), “abrasion absent” 105
was plates covered with a wire mesh cage (5 cm × 5 cm mesh size), and “procedural 106
control” an incomplete cage that allowed abrasion but controlled for potential artefacts 107
associated with the presence of a cage. Data were analysed using a two-factor Analysis of 108
Variance (ANOVA), with both factors being fixed and orthogonal. 109
110
Each “artificial kelp” was a strip of nylon mesh shade cloth (~ 1 mm mesh, 70 % shade) 111
10 cm wide and 50 cm long, to mimic the laterals of kelp. Because shade cloth is slightly 112
buoyant, each “kelp” blade was weighed down at the tip by a small lead weight (0.3 cm 113
diameter), allowing the blade to scrape across the substrate in a similar manner to natural 114

6
kelp in the presence of water flow. In the absence of water flow, the blades stayed erect, 115
slightly above plates, like natural kelp. In treatments where artificial kelp was present, 116
each settlement plate was surrounded by 12 artificial “kelp”, so that the plate was covered, 117
as they would be with natural E. radiata. 118
119
In all experiments, settlement plates were attached to boulders as a consistent substrate for 120
the colonisation of algae. Plates (11 cm × 11 cm) were made from Hardiflex fibreboard. 121
Plates were attached with the rough surface facing upwards, as filamentous turf-forming 122
algae readily colonise this surface (Irving and Connell 2002). Plates were slightly larger 123
than the sampled area (10 cm × 10 cm; see “Sampling” below) to avoid the possibility of 124
edge effects altering experimental outcomes. 125
126
Effect of water flow and abrasion 127
The effects of canopy abrasion (present v. absent v. procedural control) and water flow 128
(present v. reduced v. procedural control) on percentage cover and biomass of turf-forming 129
algae were tested in a crossed design (n = 4 per treatment). Artificial “kelp” was used to 130
simulate abrasion by natural kelp (as for “Natural v. Artificial abrasion” above), as it was 131
not possible to reduce water flow around natural kelp. 132
133
Frames to limit water flow were cubic wire frames (each side 30 cm) surrounded by clear 134
plastic on four sides, but open at the top and bottom. Frames that were only enclosed with 135
plastic on two sides were used to test for artefacts of the frame (flow procedural control). 136
Cages to limit abrasion were the same design as those used in experiments comparing 137
natural and artificial abrasion (above). Data were analysed using a two-factor ANOVA, 138
with factors of flow and abrasion. Both factors were considered to be fixed and orthogonal. 139

7
140
Effect of shade 141
To estimate the effect of reduced light intensity on turf-forming algae, light was reduced in 142
a concurrent experiment (full sunlight v. shade v. procedural control; n = 6 per treatment). 143
Settlement plates were shaded by attaching black Mylar plastic roofs (20 cm × 20 cm) to 144
wire frames (20 cm × 20 cm × 20 cm) for the “shade” treatment, while clear Mylar roofs 145
were used to test for artefacts of the presence of frames and roofs. Unshaded plates were 146
attached to boulders without frames or roofs. The effect of shading on percentage cover 147
and biomass of turf-forming algae was tested using a single-factor ANOVA. 148
149
Colonisation and removal of turf-forming algae 150
Turf-forming algae at the field site colonise to cover bare substratum outside canopies 151
within 2 weeks (Russell and Connell 2005), but have very low abundance under canopies 152
(< 5 % cover, Irving and Connell 2006a). Although longer periods are required to test 153
hypotheses about the longer-term maintenance of assemblages beneath canopies (e.g. 300 154
days: Connell 2003a; Irving and Connell 2006b), previous experiments have shown that 155
100 % of filamentous turfs can be removed by kelp canopies in < 40 days (Irving and 156
Connell 2002), so I considered 60 days sufficient time to observe the effect of canopies on 157
algal turfs. 158
159
Canopies formed by kelp suppress the colonisation of turf-forming algae, but can also 160
remove algae that have already colonised (e.g. encroaching from surrounding gaps in the 161
canopy). To test the effects of kelp canopy on both the colonisation and removal of turfs, 162
all experiments (Natural v. Artificial, Water Flow v. Abrasion, and Shade) were done 163
twice, once for colonisation of turfs on bare settlement plates and once for the removal of 164

8
algae that had already established on settlement plates. For colonisation experiments, bare 165
plates were placed under experimental treatments and turf-forming algae allowed to grow 166
for 60 days before sampling. Because no algae were present on plates at commencement of 167
these experiments, the final percentage cover and biomass of algae were compared among 168
treatments. 169
170
To test for the removal of algae by canopies, plates were attached to boulders on the 171
natural reef for 45 days to allow turfs to establish prior to being randomly re-assigned to 172
experimental treatments. The change in percentage cover was calculated for each 173
individual plate, and compared among treatments. Change in biomass was calculated by 174
subtracting the mean initial biomass (see “Sampling” below) from the final biomass of 175
algae on each plate. 176
177
Sampling 178
Initial percentage cover of turf-forming algae was quantified for all settlement plates by 179
placing a 10 cm × 10 cm grid containing 25 regularly spaced points over the plate and 180
recording the number of points that had algae directly beneath them (Drummond and 181
Connell 2005). However, initial biomass of individual plates could not be sampled because 182
biomass sampling is destructive. To estimate the amount of biomass removed by canopies, 183
mean initial biomass was calculated by destructively sampling four plates, which were not 184
assigned to experimental treatments, at the start of the experiment. 185
186
At the completion of each experiment, the percentage cover of algae on each settlement 187
plate was quantified (as above). Each plate was then placed in an individual bag and 188
returned to the laboratory. All algae in the central 10 cm × 10 cm area of each plate were 189

9
scraped off and dried in an oven at 70o C for 48 hours, to constant weight, before being 190
weighed to the nearest 0.1 g. 191
192
Tests for differences in light and flow conditions 193
To test for differences in light conditions among experimental treatments, light intensities 194
were recorded for all experiments (n = 3 measurements per treatment). Light 195
measurements were taken using an underwater quantum sensor (LI-192SA, Li-Cor, 196
Lincoln, NE, USA) and surface meter (LI-250), with individual readings being the average 197
of light intensity over 15 seconds. Measurements were taken at midday on a day when no 198
cloud was present, so that light conditions were kept as constant as possible, and the sensor 199
placed slightly above the upper surface of settlement plates. Data are presented as 200
µmoles m-2 s-1 of light. Differences in light intensities in the flow v. abrasion experiment 201
were analysed using a two-factor ANOVA, with the orthogonal factors of flow (three 202
levels: present, reduced, procedural control) and abrasion (three levels: present, absent and 203
procedural control). Single-factor ANOVAs were used to compare light levels between 204
artificial and natural kelp (three levels: artificial kelp flow absent, artificial kelp flow 205
present and natural kelp) and for the shading experiment (three levels: shade, open and 206
procedural control). 207
208
To test for relative differences in flow among treatments, and to enable a relative 209
comparison of water flow under artificial and natural kelp, plaster clods were attached to 210
plates for the full experimental design. Clods were cylinders of casting plaster 4.5 cm 211
diameter × 5 cm high. Before being deployed in the water, all clods were dried at 70o C for 212
two days and weighed to the nearest 0.1 g. For all experiments, clods were collected 7 days 213
after being placed under experimental conditions and dried at 70o C for 2 days before being 214

10
weighed to the nearest 0.1 g. Percentage loss of clods was compared among treatments. All 215
clods were made from a single batch of plaster, so dissolution rate should be consistent 216
among all clods. To test for differences in flow among treatments, a two-factor ANOVA 217
was used for the full flow v. abrasion experimental design. A single-factor ANOVA was 218
also used to test for differences among artificial kelp, natural kelp and open reef (four 219
levels: artificial kelp reduced flow, artificial kelp flow present, natural kelp, open reef). 220
221
Results 222
Natural v. artificial abrasion 223
No difference was detected between natural and artificial abrasion on the colonisation of 224
turf-forming algae for either percentage cover or biomass (Figure 1a & b, Table 1). 225
Abrasion had a significant negative effect on colonisation, reducing percentage cover. 226
However, Student Newman Keuls (SNK) comparison of means showed that percentage 227
covers were the same when abrasion was present or absent (Figure 1a, Table 1). Abrasion 228
had a significant negative effect on the biomass of turf-forming algae (Figure 1b, Table 1). 229
230
For the removal of already established algae, there were no differences between natural 231
and artificial abrasion for percentage cover or biomass of algae (Figure 2a, Table 2). When 232
abrasion was absent, biomass of turf-forming algae continued to increase after being 233
placed in experimental conditions, but decreased when abrasion was present and for the 234
procedural control (Figure 2b, Table 2). 235
236
Effect of water flow and abrasion 237
There was an interactive effect of flow and abrasion on colonisation of algae with a 238
significant negative effect of abrasion only in the absence of flow (Figure 3a, Table 3a 239
& b). There was also a significant effect of the partial cage (abrasion procedural control) 240

11
when flow was absent. In contrast to percentage cover, biomass of turf-forming algae was 241
only affected by abrasion, and was less when abrasion was present than absent (Figure 3b, 242
Table 3a). 243
244
A greater percentage cover of algae was removed from plates when water flow was absent 245
than when flow was present (Figure 4a, Table 4). Both water flow and abrasion affected 246
the removal of algal biomass. Biomass of turf-forming algae was reduced more when flow 247
was absent than present (Figure 4b, Table 4) and reduced more when abrasion was present 248
than absent (Figure 4b, Table 4). 249
250
Effect of shade 251
The percentage cover of algae that colonised settlement plates was not affected by shade 252
(Figure 5a, Table 5). In contrast, shade had a large negative effect on biomass (Figure 5a, 253
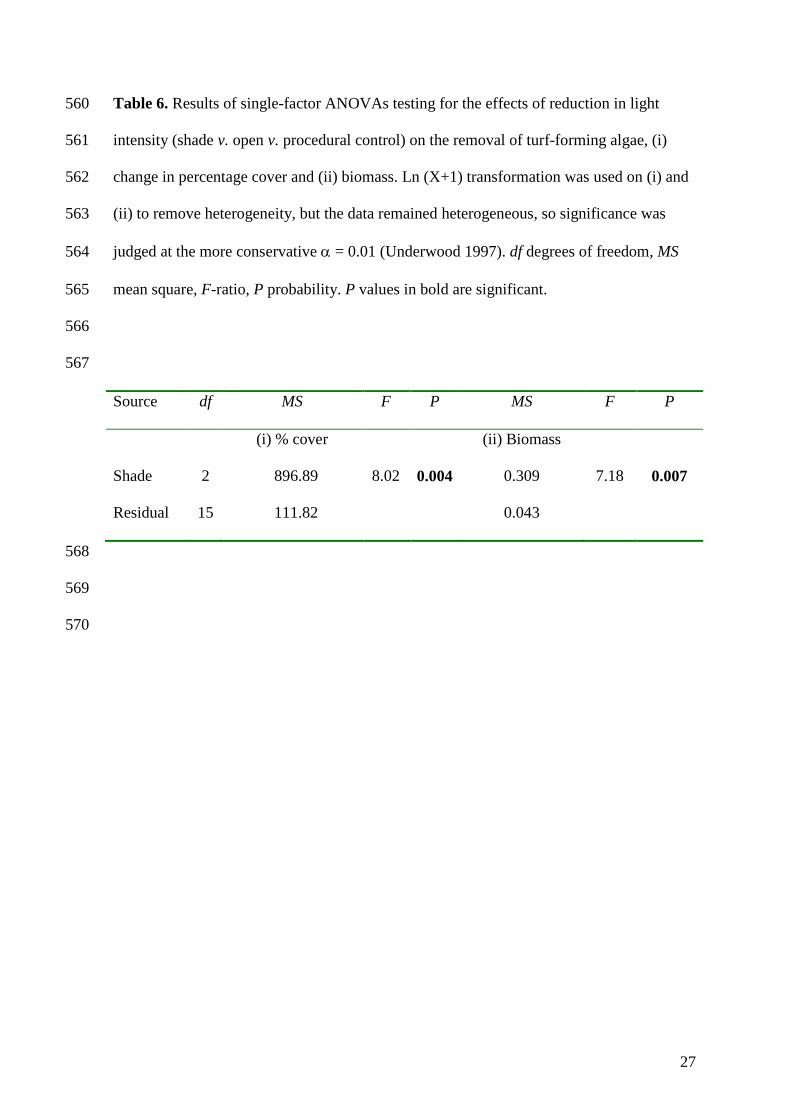
Table 5). For the removal of algae, the change in both percentage cover and biomass was 254
affected by shade. In full light, both the percentage cover and biomass of algae increased, 255
while under shade percentage cover and biomass decreased (Figure 5b, Table 6). 256
257
Tests for differences in light and flow conditions 258
Light intensity was much less under artificial canopies when water flow was absent than 259
present (Figure 6a; F2,18 = 89.23, P < 0.0001). In the presence of water flow, light intensity 260
was greater under artificial than natural kelp canopies, but was least under artificial 261
canopies when water flow was absent (Figure 6a; F2,6 = 45.88, P < 0.001). This difference 262
is possibly because when water flow was absent, the artificial canopy remained motionless 263
above (but not touching) plates, but when water flow was present the artificial canopy 264
would move on and off the plates in different directions, leaving the plate totally 265

12
uncovered for short periods (B. Russell, pers. obs.). In contrast, even in high flow 266
conditions, part of the natural canopy always seemed to be covering the settlement plates, 267
leaving very little time that plates were totally uncovered. 268
269
Light intensity was less under shade roofs than under procedural control roofs or the open, 270
which did not differ from each other (Figure 6b; F2,6 = 26.80, P = 0.001) . Light intensity 271
under shade roofs was similar to light intensity in the absence of water flow and under 272
natural kelp canopies. 273
274
Less mass was lost from plaster clods when water flow was absent (43.6 ± 0.6 %) than 275
present (54.3 ± 0.6 %) or in the procedural control (51.7 ± 0.6 %; two-factor ANOVA flow 276
× abrasion: F2,18 = 100.89, P < 0.0001). When water flow was present, a greater percentage 277
of mass was lost from clods under artificial canopies (flow present: 55.7 ± 0.2 %) than 278
under natural canopies (52.4 ± 0.8 %), but loss from under artificial canopies did not differ 279
from clods in the open (55.8 ± 0.4 %; single-factor ANOVA: F2,6 = 14.96, P < 0.005). This 280
result indicates that artificial canopies were not slowing water flow to the same degree as 281
natural canopies. 282
283
Discussion 284
A key finding was that water flow had a large effect on the early colonisation of turf-285
forming algae under canopies. The effect of physical abrasion by kelp canopies on the 286
benthos seems to increase with increasing water flow (Kennelly 1989), so it was expected 287
that when flow was reduced, the movement of canopy across the surface of settlement 288
plates would be less, thus reducing abrasion. However, in my experiments, the canopy 289
removed a greater percentage cover and biomass of turf-forming algae when water flow 290

13
was reduced. Thus, abrasion alone cannot account for this effect, reinforcing that algal 291
canopies alter multiple physical factors. It is likely that other factors, such as light intensity 292
or nutrient availability, were altered by a reduction in flow, and consequently caused the 293
differences in algal growth. 294
295
Movement of algal canopies increases with water flow. This increased movement may 296
allow greater light penetration (Leigh et al. 1987), and light can structure understorey 297
assemblages (e.g. Reed and Foster 1984; Kennelly 1989; Duggins et al. 1990; Clark et al. 298
2004; Toohey et al. 2004). The amount of light under artificial kelp was an order of 299
magnitude less when water flow was absent than present, and was similar to under the 300
shade roofs. This reduced light could account for the reduction in the biomass and 301
percentage cover of algae. There was, however, greater loss of percentage cover of turf-302
forming algae when water flow was reduced (~ 80 % loss) than under the shade roofs 303
(~ 20 % loss). This difference suggests that a reduction in light intensity may only account 304
for part of the loss seen when water flow is reduced, especially given that the treatments 305
reduced light intensity to below levels seen under natural kelp canopies. 306
307
There was a decrease in biomass and percentage cover of turf-forming algae when water 308
flow was reduced. Although reduced light intensities in the reduced flow treatment may 309
account for some of this loss (see previous paragraph), it is possible that when water flow 310
was reduced, nutrient depleted water was not moved away from the algae. The effect of 311
water flow on nutrient uptake by macroalgae is not a simple relationship. In general, 312
uptake of nutrients is limited at slower water velocities (Wheeler 1980; Hurd et al. 1996; 313
Williams and Carpenter 1998; Ryder et al. 2004), because a boundary layer of nutrient 314
depleted water rapidly forms around algae (Hurd 2000). Furthermore, filamentous turf-315

14
forming algae have a physiology that is suited to quick uptake of nutrients (Hein et al. 316
1995; Pedersen and Borum 1996), and are more likely to be affected by any boundary 317
layer of water that is poor in nutrients (Hurd 2000). Therefore, it is possible that the turf-318
forming algae rapidly used the available nutrients, creating a nutrient poor boundary layer 319
and reducing growth. 320
321
When abrasion was removed there was greater biomass of turfs on settlement plates for 322
both natural and artificial abrasion. Physical abrasion by algal canopies is known to reduce 323
the biomass of erect forms of benthic algae (Kennelly 1989; Kendrick 1991; Irving and 324
Connell 2006a; but see Toohey et al. 2004). Kendrick (1991) found that artificial abrasion 325
reduced percentage cover and biomass of turfs, but that there was a greater negative effect 326
on biomass. The present study showed a similar result. It is possible, therefore, that 327
biomass of turf-forming algae is quickly lost to canopy abrasion, but when the algal 328
filaments are smaller than some critical vertical height no more is lost. If this is so, 329
biomass could be lost without a corresponding reduction in percentage cover. 330
331
I did not detect any difference between the effects of abrasion by natural and artificial 332
kelp, yet for the colonisation of algae both mean percentage cover and biomass appeared to 333
be greater for artificial kelp. Water flow was reduced by natural kelp canopy but not 334
artificial kelp (percentage of plaster clods lost), and light intensity was almost 4 times 335
greater under artificial than natural kelp. Furthermore, density of kelp influences 336
understorey composition (Kendrick et al. 1999), and my artificial kelp may have been 337
more consistent with more sparse densities of kelp than used in this study. Therefore, even 338
though no difference was detected between the effects different canopies, it is probable 339
that greater water flow and greater light meant that the effect of artificial kelp was only 340

15
between 50 % (biomass) and 80 % (percentage cover) of natural kelp. However, the 341
greater light intensity and water flow are likely to make my interpretation of treatment 342
effects more conservative, increasing the likelihood of accepting the null hypothesis. 343
344
When water flow was absent, there was greater shading under artificial than natural 345
canopies. This difference in shading may create problems for interpreting the effects of 346
water flow, because any observed effect may be a result of the greater shading rather than 347
a reduction of water flow per se. Again, this demonstrates the difficulty in separating the 348
effects of individual physical factors altered by canopies. The greater light intensity under 349
artificial canopies, in the presence of water flow, also creates problems for comparing 350
artificial and natural canopies, because the greater light intensity makes it less likely to 351
detect an effect of canopy. Again, this leads to a more conservative experimental test and a 352
greater likelihood of accepting the null hypothesis. 353
354
In the artificial kelp experiments, I detected artefacts associated with the cages used to 355
remove abrasion. In general, the procedural controls had less turf-forming algae than when 356
abrasion was present. This difference was probably caused by the kelp becoming caught in 357
the partial cage (B. Russell pers. obs.), restricting movement and reducing abrasion. 358
Furthermore, the procedural control plates generally had less algae than when abrasion was 359
absent, suggesting that any effect of the cage was less than that of removing abrasion. 360
However, the significant artefacts associated with cages suggest caution in interpreting the 361
magnitude of effects in cage treatments. 362
363
It is widely acknowledged that canopies (both terrestrial and marine) have large effects on 364
the structure of understorey assemblages. However, knowledge of the processes by which 365

16
canopies alter the understorey will allow generalisations and prediction of canopy-366
understorey associations (Levin 1992; Wright and Jones 2004; Connell in press). This 367
understanding may be important in view of the increasing loss of canopies, in favour of 368
turf-forming algae (Jackson 2001; Eriksson et al. 2002). The experimental results 369
presented here have increased knowledge how canopies alter these processes by showing 370
that the amount of water flow through a canopy alters the intensity of abrasion and shading 371
by canopies. Furthermore, I suggest that the reduction in abundance of turfs in reduced 372
water flow may be partly caused by nutrient limitation, an area that requires further study. 373
374
Acknowledgements 375
I thank J. Stehbens, E. Raghoudi and K. Rouse for help with construction of experimental 376
structures. The fieldwork would not have been possible without the assistance of A. Irving 377
and T. Elsdon. Comments by B. Gillanders, S. Connell, A. Munro and three anonymous 378
reviewers substantially improved the manuscript. This project was assisted by an 379
Australian Postgraduate Award to the author. 380
381
References 382
Belyea LR, Lancaster J (1999) Assembly rules within a contingent ecology. Oikos 86, 402-383
416. 384
Bertness MD, Leonard GH, Levine JM, Schmidt PR, Ingraham AO (1999) Testing the 385
relative contribution of positive and negative interactions in rocky intertidal 386
communities. Ecology 80, 2711-2726. 387
Bruno JF (2000) Facilitation of cobble beach plant communities through habitat 388
modification by Spartina alterniflora. Ecology 81, 1179-1192. 389

17
Bulleri F, Benedetti-Cecchi L, Acunto S, Cinelli F, Hawkins SJ (2002) The influence of 390
canopy algae vertical patterns of distribution of low-shore assemblages on rocky 391
coasts in the northwest Mediterranean. Journal of Experimental Marine Biology 392
and Ecology 267, 89-106. 393
Clark RP, Edwards MS, Foster MS (2004) Effects of shade from multiple kelp canopies on 394
an understorey algal assemblage. Marine Ecology-Progress Series 267, 107-119. 395
Connell SD (2003a) The monopolization of understorey habitat by subtidal encrusting 396
coralline algae: a test of the combined effects of canopy-mediated light and 397
sediment. Marine Biology 142, 1065-1071. 398
Connell SD (2003b) Negative effects overpower the positive of kelp to exclude 399
invertebrates from the understorey community. Oecologia 137, 97-103. 400
Connell SD (2005) Assembly and maintenance of subtidal habitat heterogeneity: 401
synergistic effects of light penetration and sedimentation. Marine Ecology 402
Progress Series 289, 53-61. 403
Connell SD (in press) Subtidal temperate rocky habitats: habitat heterogeneity at local to 404
continental scales. In 'Marine Ecology'. (Eds SD Connell and BM Gillanders). 405
(Oxford University Press: Melbourne) 406
Dayton PK, Currie V, Gerrodette T, Keller BD, Rosenthal R, Ventresca D (1984) Patch 407
Dynamics and Stability of Some California Kelp Communities. Ecological 408
Monographs 54, 253-289. 409
Dayton PK, Tegner MJ, Parnell PE, Edwards PB (1992) Temporal and Spatial Patterns of 410
Disturbance and Recovery in a Kelp Forest Community. Ecological Monographs 411
62, 421-445. 412

18
Drummond SP, Connell SD (2005) Quantifying percentage cover of subtidal organisms on 413
rocky coasts: a comparison of the costs and benefits of standard methods. Marine 414
and Freshwater Research 56, 1-12. 415
Duggins DO, Eckman JE, Sewell AT (1990) Ecology of understorey kelp environments. 416
II. Effects of kelps on recruitment of benthic invertebrates. Journal of Experimental 417
Marine Biology and Ecology 143, 27-45. 418
Eckman JE, Duggins DO, Sewell AT (1989) Ecology of understorey kelp environments. I. 419
Effects of kelps on flow and particle transport near the bottom. Journal of 420
Experimental Marine Biology and Ecology 129, 173-187. 421
Edwards MS (1998) Effects of long-term kelp canopy exclusion on the abundance of the 422
annual alga Desmarestia ligulata (Light F). Journal of Experimental Marine 423
Biology and Ecology 228, 309-326. 424
Eriksson BK, Johansson G, Snoeijs P (2002) Long-term changes in the macroalgal 425
vegetation of the inner Gullmar Fjord, Swedish Skagerrak coast. Journal of 426
Phycology 38, 284-296. 427
Fowler-Walker MJ, Connell SD (2002) Opposing states of subtidal habitat across 428
temperate Australia: consistency and predictability in kelp canopy-benthic 429
associations. Marine Ecology Progress Series 240, 49-56. 430
Hein M, Pedersen MF, Sand-Jensen K (1995) Size-dependent nitrogen uptake in micro- 431
and macroalgae. Marine Ecology Progress Series 118, 247-253. 432
Hurd CL (2000) Water motion, marine macroalgal physiology, and production. Journal of 433
Phycology 36, 453-472. 434
Hurd CL, Harrison PJ, Druehl LD (1996) Effect of seawater velocity on inorganic nitrogen 435
uptake by morphologically distinct forms of Macrocystis integrifolia from wave-436
sheltered and exposed sites. Marine Biology 126, 205-214. 437

19
Irving AD, Connell SD (2002) Interactive effects of sedimentation and microtopography 438
on the abundance of subtidal turf-forming algae. Phycologia 41, 517-522. 439
Irving AD, Connell SD (2006a) Physical disturbance by kelp abrades erect algae from the 440
understorey. Marine Ecology Progress Series 324, 127-137. 441
Irving AD, Connell SD (2006b) Predicting understorey structure from the presence and 442
composition of canopies: an assembly rule for marine algae. Oecologia 148, 491-443
502. 444
Irving AD, Connell SD, Elsdon TE (2004a) Effects of kelp canopies on bleaching and 445
photosynthetic activity of encrusting coralline algae. Journal of Experimental 446
Marine Biology and Ecology 310, 1-12. 447
Irving AD, Connell SD, Gillanders BM (2004b) Local complexity in patterns of canopy–448
benthos associations produces regional patterns across temperate Australasia. 449
Marine Biology 144, 361-368. 450
Jackson JBC (2001) What was natural in the coastal oceans? Proceedings of the National 451
Academy of Sciences USA 98, 5411-5418. 452
Kendrick GA (1991) Recruitment of coralline crusts and filamentous turf algae in the 453
Galapagos archipelago: effect of simulated scour, erosion and accretion. Journal of 454
Experimental Marine Biology and Ecology 147, 47-63. 455
Kendrick GA, Lavery PS, Phillips JC (1999) Influence of Ecklonia radiata kelp canopy on 456
structure of macro-algal assemblages in Marmion Lagoon, Western Australia. 457
Hydrobiologia 398/399, 275-283. 458
Kennelly SJ (1989) Effects of kelp canopies on understorey species due to shade and 459
scour. Marine Ecology Progress Series 50, 215-224. 460
Kennelly SJ, Underwood AJ (1993) Geographic consistencies of effects of experimental 461
physical disturbance on understorey species in sublittoral kelp forests in central 462

20
New South Wales. Journal of Experimental Marine Biology and Ecology 168, 35-463
58. 464
Leigh EG, Paine RT, Quinn JF, Suchanek TH (1987) Wave Energy and Intertidal 465
Productivity. Proceedings of the National Academy of Sciences of the United States 466
of America 84, 1314-1318. 467
Levin SA (1992) The Problem of Pattern and Scale in Ecology. Ecology 73, 1943-1967. 468
Melville A, Connell SD (2001) Experimental effects of kelp canopies on subtidal coralline 469
algae. Austral Ecology 26, 102-108. 470
Pedersen MF, Borum J (1996) Nutrient control of algal growth in estuarine waters. 471
Nutrient limitation and the importance of nitrogen requirements and nitrogen 472
storage among phytoplankton and species of macroalgae. Marine Ecology Progress 473
Series 142, 261-272. 474
Reed DC, Foster MS (1984) The effects of canopy shading on algal recruitment and 475
growth in a giant kelp forest. Ecology 65, 973-948. 476
Russell BD, Connell SD (2005) A novel interaction between nutrients and grazers alters 477
relative dominance of marine habitats. Marine Ecology Progress Series 289, 5-11. 478
Ryder E, Nelson SG, McKeon C, Glenn EP, Fitzsimmons K, Napolean S (2004) Effect of 479
water motion on the cultivation of the economic seaweed Gracilaria parvispora 480
(Rhododophyta) on Molokai, Hawaii. Aquaculture 238, 207-219. 481
Shepherd SA, Turner JA (1985) Studies on southern Australian abalone (genus Haliotis). 482
VI. Habitat preference, abundance and predators of juveniles. Journal of 483
Experimental Marine Biology and Ecology 93, 285-298. 484
Shepherd SA, Womersley HBS (1970) The sublittoral ecology of West Island, South 485
Australia. 1. Environmental features and algal ecology. Transactions of the Royal 486
Society of South Australia 94, 105-137. 487

21
Toohey B, Kendrick GA, Wernberg T, Phillips JC, Malkin S, Prince J (2004) The effects 488
of light and thallus scour from Ecklonia radiata canopy on an associated foliose 489
algal assemblage: the importance of photoacclimation. Marine Biology 144, 1019-490
1027. 491
Underwood AJ (1997) 'Experiments in Ecology. Their logical design and interpretation 492
using analysis of variance.' (Cambridge University Press: Cambridge) 493
Velimirov B, Griffiths CL (1979) Wave-induced kelp movement and its importance for 494
community structure. Botanica Marina 22, 169-172. 495
Wheeler WN (1980) Effect of boundary layer transport on the fixation of carbon by the 496
giant kelp Macrocystis pyrifera. Marine Biology 56, 103-110. 497
Williams SL, Carpenter RC (1998) Effects of unidirectional and oscillatory water flow on 498
nitrogen fixation (acetylene reduction) in coral reef algal turfs, Kaneohe Bay, 499
Hawaii. Journal of Experimental Marine Biology and Ecology 226, 293-316. 500
Wright JP, Jones CG (2004) Predicting effects of ecosystem engineers on patch-scale 501
species richness from primary productivity. Ecology 85, 2071-2081. 502
503

22
Table 1. Results of two-factor ANOVAs testing for the effects of type of canopy (natural 504
v. artificial) and abrasion (present v. absent v. procedural control) on the colonisation of (i) 505
percentage cover and (ii) biomass of turf-forming algae. Ln (X) transformation was used 506
on (ii) to remove heterogeneity from the data. df degrees of freedom, MS mean square, F-507
ratio, P probability. P values in bold are significant. 508
509
Source df MS F P MS F P
(i) % cover (ii) Biomass
Canopy 1 486.00 0.47 0.500 0.723 1.17 0.294
Abrasion 2 4420.67 4.31 0.029 3.938 6.36 0.008
C × A 2 234.00 0.23 0.798 0.647 1.04 0.372
Residual 18 1025.56 0.647
510
511
512
513
514
515
516

23
Table 2. Results of two-factor ANOVAs testing for the effects of type of canopy (natural 517
v. artificial) and abrasion (present v. absent v. procedural control) on the removal of turf-518
forming algae, (i) change in percentage cover and (ii) biomass. Ln (X+1) transformation 519
was used on (ii) to remove heterogeneity, but the data remained heterogeneous, so 520
significance was judged at the more conservative α = 0.01 (Underwood 1997). df degrees 521
of freedom, MS mean square, F-ratio, P probability. P values in bold are significant. 522
523
Source df MS F P MS F P
(i) % cover (ii) Biomass
Canopy 1 640.67 0.98 0.336 0.006 0.11 0.741
Abrasion 2 1608.67 2.46 0.114 0.404 7.49 0.004
C × A 2 964.67 1.47 0.255 0.011 0.21 0.815
Residual 18 654.44 0.054
524
525
526

24
Table 3. (a) Results of two-factor ANOVAs testing for the effects of water flow (present v. 527
absent v. procedural control) and abrasion by artificial canopy (present v. absent v. 528
procedural control) on the colonisation of (i) percentage cover and (ii) biomass of turf-529
forming algae, (b) SNK comparison of means for the significant flow × abrasion 530
interaction for percentage cover. df degrees of freedom, MS mean square, F-ratio, P 531
probability. P values in bold are significant. 532
533
534
(a) Source df MS F P MS F P
(i) % cover (ii) Biomass
Flow 2 2907.11 3.18 0.057 0.035 1.35 0.276
Abrasion 2 2760.44 3.02 0.065 0.125 4.82 0.016
F × A 4 3591.11 3.93 0.012 0.047 1.81 0.156
Residual 27 913.19 0.026
535
(b) Pairwise comparisons for percentage cover
Flow
Present Abrasion present = Abrasion absent = Procedural control
Absent Abrasion present << Abrasion absent = Procedural control
Abrasion
Present Flow absent < Flow present = Procedural control
Absent Flow absent = Flow present = Procedural control
536

25
Table 4. Results of two-factor ANOVAs testing for the effects of water flow (present v. 537
absent v. procedural control) and abrasion by artificial canopy (present v. absent v. 538
procedural control) on the removal of turf-forming algae, (i) change in percentage cover 539
and (ii) biomass. df degrees of freedom, MS mean square, F-ratio, P probability. P values 540
in bold are significant. 541
542
543
Source df MS F P MS F P
(i) % cover (ii) Biomass
Flow 2 7744.00 8.83 0.001 3.993 5.42 0.011
Abrasion 2 185.33 0.21 0.811 2.495 3.39 0.049
F × A 4 565.33 0.64 0.635 0.152 0.21 0.932
Residual 27 877.33 0.734
544
545
546
547

26
Table 5. Results of single-factor ANOVAs testing for the effects of reduction in light 548
intensity (shade v. open v. procedural control) on the colonisation of (i) percentage cover 549
and (ii) biomass of turf-forming algae. df degrees of freedom, MS mean square, F-ratio, P 550
probability. P values in bold are significant. 551
552
553
Source df MS F P MS F P
(i) % cover (ii) Biomass
Shade 2 32.89 1.27 0.310 0.117 8.20 0.004
Residual 15 25.96 0.014
554
555
556
557
558
559
27
Table 6. Results of single-factor ANOVAs testing for the effects of reduction in light 560
intensity (shade v. open v. procedural control) on the removal of turf-forming algae, (i) 561
change in percentage cover and (ii) biomass. Ln (X+1) transformation was used on (i) and 562
(ii) to remove heterogeneity, but the data remained heterogeneous, so significance was 563
judged at the more conservative α = 0.01 (Underwood 1997). df degrees of freedom, MS 564
mean square, F-ratio, P probability. P values in bold are significant. 565
566
567
Source df MS F P MS F P
(i) % cover (ii) Biomass
Shade 2 896.89 8.02 0.004 0.309 7.18 0.007
Residual 15 111.82 0.043
568
569
570

28
Fig. 1. The effect of natural abrasion (absent v. present v. procedural control) and artificial 571
abrasion (absent v. present v. procedural control) on the colonisation of turf-forming algae 572
on bare settlement plates for (a) percentage cover and (b) biomass of turf-forming algae. 573
574
Fig. 2. The effect of natural abrasion (absent v. present v. procedural control) and artificial 575
abrasion (absent v. present v. procedural control) on the change in (a) percentage cover and 576
(b) biomass of turf-forming algae. Treatments correspond to legend in Fig. 1. 577
578
Fig. 3. The effect of water flow (absent v. present v. procedural control) and canopy 579
abrasion (absent v. present v. procedural control) on the colonisation of turf-forming algae 580
on bare settlement plates. (a) percentage cover and (b) biomass of turf-forming algae. “0” 581
indicates 0 % cover or 0 g biomass. 582
583
Fig. 4. The effect of water flow (absent v. present v. procedural control) and canopy 584
abrasion (absent v. present v. procedural control) on the change in (a) percentage cover and 585
(b) biomass of turf-forming algae. Treatments correspond to legend in Fig. 3. 586
587
Fig. 5. The effect of light (shade v. open v. procedural control) on (a) the colonisation of 588
turf-forming algae, shown as percentage cover and biomass and (b) the change in 589
percentage cover and biomass of turf-forming algae. 590
591
Fig. 6. Light intensity measured among (a) flow treatments (natural kelp v. absent v. 592
present v. procedural control) and (b) shade treatments (shade v. open v. procedural 593
control).594

29
Fig. 1. 595
596
597
598
0
0.1
0.2
0.3
0.4
0.5
Mea
n bi
omas
s of
turf-
form
ing
alga
e ±
SE (g
)
Naturalkelp
Artificialkelp
(b)
Mea
n pe
rcen
tage
cov
er o
f tu
rf-fo
rmin
g al
gae
± SE
0
20
40
60
80
100
Naturalkelp
Artificialkelp
(a) Abrasion absentAbrasion presentProcedural control

30
Fig. 2. 599
600
601
602
Mea
n ch
ange
in p
erce
ntag
e co
ver o
f tur
f-for
min
g al
gae
± SE
0
- 10
- 20
- 30
- 40
- 50
- 60
10
Naturalkelp
Artificialkelp
(a)
Mea
n ch
ange
in b
iom
ass
of
turf-
form
ing
alga
e ±
SE (g
)
Naturalkelp
Artificialkelp
0
- 0.2
- 0.4
0.2
0.4 (b)

31
Fig. 3. 603
604
605
606
607
0
20
40
60
80
100
Mea
n pe
rcen
tage
cov
er o
f tu
rf-fo
rmin
g al
gae
± SE
Flowabsent
Flowpresent
Proceduralcontrol
Abrasion absentAbrasion presentProcedural control
0
(a)M
ean
biom
ass
of tu
rf-fo
rmin
g al
gae
± SE
(g)
0.0
0.1
0.2
0.3
0.4
0.5
Flowabsent
Flowpresent
Proceduralcontrol
0
(b)

32
Fig. 4. 608
609
610
Mea
n ch
ange
in p
erce
ntag
e co
ver o
f tur
f-for
min
g al
gae
± SE
Flowabsent
Flowpresent
Proceduralcontrol
0
- 20
- 40
- 60
- 80
- 100(a)
Mea
n ch
ange
in b
iom
ass
of
turf-
form
ing
alga
e ±
SE (g
)
0
- 0.3
- 0.6Flow
absentFlow
presentProcedural
control
(b)
0.3
0.6

33
Fig. 5. 611
612
613
ShadeOpenProcedural control
Biomass of turf-form
ing algae (g)
0
20
40
60
80
100Pe
rcen
tage
cov
er o
f tu
rf-fo
rmin
g al
gae
Cover Biomass0
0.1
0.2
0.3
0.4
0.5(a)
0
- 10
- 20
- 30
10
20
0.1
0.2
0
- 0.1
- 0.2
- 0.3
Cover Biomass
(b)
Change in biom
ass of turf-form
ing algae (g)
Cha
nge
in p
erce
ntag
e co
ver
of tu
rf-fo
rmin
g al
gae

34
Fig. 6. 614
615
616
Related Documents