Effects of age and symptomatology on cortical thickness in autism spectrum disorders Krissy A.R. Doyle-Thomas a , Emma G. Duerden b,c , Margot J. Taylor b,c , Jason P. Lerch c , Latha V. Soorya d , A. Ting Wang d , Jin Fan d , Eric Hollander e , and Evdokia Anagnostou a,* Krissy A.R. Doyle-Thomas: [email protected]; Emma G. Duerden: [email protected]; Margot J. Taylor: [email protected]; Jason P. Lerch: [email protected]; Latha V. Soorya: [email protected]; A. Ting Wang: [email protected]; Jin Fan: [email protected]; Eric Hollander: [email protected] a Bloorview Research Institute, Holland Bloorview Kids Rehabilitation Hospital, 150 Kilgour Road, Toronto, Ontario, M4G 1R8, Canada b Department of Diagnostic Imaging, The Hospital for Sick Children, 555 University Ave, Toronto, M5G 1X8, Canada c Neurosciences and Mental Health Programme, Research Institute, The Hospital for Sick Children, 555 University Ave, Toronto, Ontario, M5G 1X8, Canada d Department of Psychiatry, Mount Sinai School of Medicine, 1 Gustave L. Levy Place, New York, NY, 10029-6574, USA e Department of Psychiatry and Behavioral Sciences, Albert Einstein College of Medicine and Montefiore Medical Center, 111 East 210th Street, Bronx, NY, 10467, USA Abstract Several brain regions show structural and functional abnormalities in individuals with autism spectrum disorders (ASD), but the developmental trajectory of abnormalities in these structures and how they may relate to social and communicative impairments are still unclear. We assessed the effects of age on cortical thickness in individuals with ASD, between the ages of 7 and 39 years in comparison to typically developing controls. Additionally, we examined differences in cortical thickness in relation to symptomatology in the ASD group, and their association with age. Analyses were conducted using a general linear model, controlling for sex. Social and communication scores from the Autism Diagnostic Interview-Revised (ADI-R) were correlated with the thickness of regions implicated in those functions. Controls showed widespread cortical thinning relative to the ASD group. Within regions-of-interest, increased thickness in the rostral anterior cingulate cortex was associated with poorer social scores. Additionally, a significant interaction between age and social impairment was found in the orbitofrontal cortex, with more impaired younger children having decreased thickness in this region. These results suggest that differential neurodevelopmental trajectories are present in individuals with ASD and some differences are associated with diagnostic behaviours. © 2012 Elsevier Ltd. All rights reserved. * Corresponding author at: 150 Kilgour Road, Toronto, Ontario, M4G 1R8, Canada. Tel.: +1 416 753 6005; fax: +1 416 753 6046. [email protected] (E. Anagnostou). Conflict of interest Dr. Anagnostou has consulted without fees to Neuropharm, Proximagen and Novartis and consulted with fees to Seaside Therapeutics. None of the other authors have any conflicts of interest to disclose. Autism Speaks Author Manuscript Accepted for publication in a peer-reviewed journal Published in final edited form as: Res Autism Spectr Disord. 2013 January ; 7(1): 141–150. doi:10.1016/j.rasd.2012.08.004. Autism Speaks Author Manuscript Autism Speaks Author Manuscript

Welcome message from author
This document is posted to help you gain knowledge. Please leave a comment to let me know what you think about it! Share it to your friends and learn new things together.
Transcript
Effects of age and symptomatology on cortical thickness inautism spectrum disorders
Krissy A.R. Doyle-Thomasa, Emma G. Duerdenb,c, Margot J. Taylorb,c, Jason P. Lerchc,Latha V. Sooryad, A. Ting Wangd, Jin Fand, Eric Hollandere, and Evdokia Anagnostoua,*
Krissy A.R. Doyle-Thomas: [email protected]; Emma G. Duerden: [email protected]; MargotJ. Taylor: [email protected]; Jason P. Lerch: [email protected]; Latha V. Soorya:[email protected]; A. Ting Wang: [email protected]; Jin Fan: [email protected]; Eric Hollander:[email protected] Research Institute, Holland Bloorview Kids Rehabilitation Hospital, 150 Kilgour Road,Toronto, Ontario, M4G 1R8, CanadabDepartment of Diagnostic Imaging, The Hospital for Sick Children, 555 University Ave, Toronto,M5G 1X8, CanadacNeurosciences and Mental Health Programme, Research Institute, The Hospital for SickChildren, 555 University Ave, Toronto, Ontario, M5G 1X8, CanadadDepartment of Psychiatry, Mount Sinai School of Medicine, 1 Gustave L. Levy Place, New York,NY, 10029-6574, USAeDepartment of Psychiatry and Behavioral Sciences, Albert Einstein College of Medicine andMontefiore Medical Center, 111 East 210th Street, Bronx, NY, 10467, USA
AbstractSeveral brain regions show structural and functional abnormalities in individuals with autismspectrum disorders (ASD), but the developmental trajectory of abnormalities in these structuresand how they may relate to social and communicative impairments are still unclear. We assessedthe effects of age on cortical thickness in individuals with ASD, between the ages of 7 and 39years in comparison to typically developing controls. Additionally, we examined differences incortical thickness in relation to symptomatology in the ASD group, and their association with age.Analyses were conducted using a general linear model, controlling for sex. Social andcommunication scores from the Autism Diagnostic Interview-Revised (ADI-R) were correlatedwith the thickness of regions implicated in those functions. Controls showed widespread corticalthinning relative to the ASD group. Within regions-of-interest, increased thickness in the rostralanterior cingulate cortex was associated with poorer social scores. Additionally, a significantinteraction between age and social impairment was found in the orbitofrontal cortex, with moreimpaired younger children having decreased thickness in this region. These results suggest thatdifferential neurodevelopmental trajectories are present in individuals with ASD and somedifferences are associated with diagnostic behaviours.
© 2012 Elsevier Ltd. All rights reserved.*Corresponding author at: 150 Kilgour Road, Toronto, Ontario, M4G 1R8, Canada. Tel.: +1 416 753 6005; fax: +1 416 753 [email protected] (E. Anagnostou).
Conflict of interestDr. Anagnostou has consulted without fees to Neuropharm, Proximagen and Novartis and consulted with fees to Seaside Therapeutics.None of the other authors have any conflicts of interest to disclose.
Autism SpeaksAuthor ManuscriptAccepted for publication in a peer-reviewed journal
Published in final edited form as:Res Autism Spectr Disord. 2013 January ; 7(1): 141–150. doi:10.1016/j.rasd.2012.08.004.
Autism Speaks Author M
anuscriptAutism
Speaks Author Manuscript
KeywordsAutism spectrum disorders; Structural MRI; Cortical thickness; Social impairment;Developmental changes
1. IntroductionAge-related structural abnormalities in the brains of individuals with autism spectrumdisorders (ASD) have been explored in a number of longitudinal and cross-sectional studies.Across these studies, grey matter volumes within frontal and temporal lobes weresignificantly increased in children and adolescents with ASD compared to typicallydeveloping individuals (Bloss & Courchesne, 2007; Carper, Moses, Tigue, & Courchesne,2002; Courchesne, Campbell, & Solso, 2011; Hazlett, Poe, Gerig, Smith, & Piven, 2006;Kates et al., 2004; Palmen et al., 2005; Schumann et al., 2010). However, volumetricmeasurements of lobular regions do not provide spatially localized information on greymatter abnormalities. Advances in brain morphometric analyses now permit the directmeasure of cortical thickness, a determinant of grey matter volume, and can provide detailedinformation concerning the spatial extent and location of cortical differences betweengroups.
Large-scale developmental studies in typically developing individuals that include bothcross-sectional and longitudinal data show that after a period of growth in early childhood,grey matter thinning occurs across the entire cortex in adolescence (Raznahan, Shaw, et al.,2011; Raznahan, Lerch, et al., 2011; Shaw et al., 2008). To our knowledge, no longitudinalstudies in individuals with ASD have examined cortical thickness development across awide age-range. Cross-sectional studies in ASD suggest atypical cortical thickness changesbetween childhood and adulthood in individuals with ASD (Mak-Fan, Taylor, Roberts, &Lerch, 2011; Raznahan et al., 2010; Scheel et al., 2011; Wallace, Dankner, Kenworthy,Giedd, & Martin, 2010). In children with ASD aged 6–15 years, Mak-Fan et al. (2011)reported decreased cortical thickness with age across the entire brain, as well as in thefrontal and parietal lobes; however group differences were not found. In older samples,studies have observed thinner cortices with increasing age in participants with ASD relativeto typically developing controls in the left posterior part of the superior temporal sulcus(Scheel et al., 2011; Wallace et al., 2010), left cuneus (Scheel et al., 2011) and rightparacentral lobule (PCL) (Scheel et al., 2011). In contrast, brain regions such as the leftsupramarginal gyrus (Scheel et al., 2011), left inferior parietal lobule (Scheel et al., 2011),left middle temporal gyrus (Raznahan et al., 2010), right postcentral gyrus (Scheel et al.,2011) and right fusiform (Raznahan et al., 2010), show decreased cortical thickness acrossage in typically developing individuals, but little to no change in individuals with ASD.These findings suggest a maturational process that is both atypical and complex in ASD.
Maturational brain changes in regions of the brain implicated in sensorimotor and cognitivefunctions are believed to be associated with improvement in these functions (Greene, Braet,Johnson, & Bellgrove, 2008). Thus, deviation from the typical developmental trajectory ofcortical thickness in frontal and temporal brain regions may underlie impairments in socialand communication functions in ASD. Few studies have examined the relation betweencortical thickness abnormalities and ASD symptom severity (Hadjikhani, Joseph, Snyder, &Tager-Flusberg, 2006; Hardan, Libove, Keshavan, Melhem, & Minshew, 2009), althoughthese studies indicated that cortical thinning over a 2-year period in the frontal lobes(Hardan et al., 2009), and thinner cortices in frontal, temporal and parietal regions in adultswith ASD (Hadjikhani et al., 2006), were associated with more severe social impairments.The age-range in both studies was narrow and did not examine morphological changes
Doyle-Thomas et al. Page 2
Res Autism Spectr Disord. Author manuscript; available in PMC 2013 May 13.
Autism Speaks Author M
anuscriptAutism
Speaks Author Manuscript
related to ASD symptomatology in children and adults. As ASD are a group ofneurodevelopmental disorders, age-related changes in brain morphology are crucial tounderstanding the neurobiology and how it relates to changes in behaviour over time.
In the current cross-sectional study, we assessed cortical thickness in a cohort of 53individuals with and without ASD spanning childhood, adolescence and adulthood. Inaddition, we assessed the relation between cortical thickness in specific regions implicatedin social and communication functions and symptom severity. In this latter analysis, a prioriregions of interest (ROIs) included anterior cingulate cortices (ACC), medial prefrontalcortices (mPFC), orbital frontal cortices (OFC), inferior frontal gyri (IFG), the superiortemporal gyri (STG) and fusiform gyri because of their involvement in social behavioursand communication (Baron-Cohen & Belmonte, 2005).
2. Materials and methods2.1. Ethics and consent
This study was approved by the Mount Sinai School of Medicine Institutional ResearchBoard (IRB) and conducted in accordance with its guidelines. Written informed consent wasobtained from all participants 18 years of age and older. Younger participants providedwritten informed assent and parents provided written informed consent in accordance withIRB guidelines.
2.2. ParticipantsSeventy-one participants between the ages of 7 and 39 years who were enrolled in magneticresonance imaging (MRI) studies at Mount Sinai School of Medicine were evaluated forinclusion [children: 7–21 years, n = 41; ASD = 25, typically developing children = 16;adults: 22 years and older, n = 30; ASD = 15, typically developing adults = 15]. Participantswith ASD were clinically diagnosed according to the Diagnostic and Statistical Manual ofMental Disorders, 4th Edition (DSM-IV) and were recruited from the Seaver Autism Centerat Mount Sinai School of Medicine. Their diagnoses were then confirmed using the AutismDiagnostic Observational Schedule (ADOS) (Lord et al., 2000) and the Autism DiagnosticInterview-Revised (ADI-R) (Lord, Rutter, & Le Couteur, 1994). Typically developingindividuals were recruited from the community using newspaper advertisements. Allparticipants had a full scale IQ of greater than 70 as estimated by either the WechslerIntelligence Scale for Children-fourth edition (WISC-IV; Wechsler, 2003) or the WechslerAdult Intelligence Scale-fourth edition (WAIS-IV; Wechsler, 2008).
Participants were excluded if they had a primary psychiatric diagnosis (in addition to ASDin the ASD group) or a medical history of neurological disease, including but not limited toepilepsy/seizure disorder (except simple febrile seizures), movement disorder, tuberoussclerosis, fragile X, and any other known genetic syndromes, or known abnormal MRI/structural lesion of the brain. Typically developing individuals were also excluded if theyhad a first-degree relative with ASD. All participants indicated that they were right-handed.
2.3. ImagingParticipants were scanned on a Siemens Allegra 3 T MRI system, which has a maximumgradient strength of 40 mT/m, and a slew-rate of 400 mT/m s. A low-resolution localizerimage was first obtained, followed by a series of axial scans. High-resolution structuralimages with good grey/white matter contrast were obtained using a T1-weightedmagnetization-prepared rapid gradient-echo (MP-RAGE) sequence (isotropic resolution of0.82 mm × 0.82 mm × 0.82 mm, matrix size = 256 × 256 × 208, FOV = 210 mm, 208 slices,
Doyle-Thomas et al. Page 3
Res Autism Spectr Disord. Author manuscript; available in PMC 2013 May 13.
Autism Speaks Author M
anuscriptAutism
Speaks Author Manuscript
TR = 2500 ms, TE = 4.38 ms, TI = 1100 ms and a 8° flipangle, fast low angle shot [FLASH]acquisition). The total imaging time was approximately 10 min.
2.4. Cortical thickness measurementsStructural MRIs were preprocessed using a standard protocol (linear registration intostandardized space, RF inhomogeniety correction) within the CIVET processing pipeline asdescribed in Ad-Dab’bagh et al. (Ad-Dab’bagh et al., 2006). This pipeline is highly efficientand has been used widely to study cortical thickness in healthy individuals, specialpopulations and in disease states (Bermudez, Lerch, Evans, & Zatorre, 2009; Bernhardt etal., 2008; Charil et al., 2007; Fahim, Yoon, Sandor, Frey, & Evans, 2009; Giedd et al., 2007;Lenroot et al., 2009; Lerch et al., 2005, 2006, 2008; Meguid et al., 2010; Singh et al., 2006;Zhou et al., 2011). The preprocessing involves linear registration of MRIs into a commonstereotactic space followed by correcting for non-uniformity artefacts (Collins, Peters, &Evans, 1994; Sled, Zijdenbos, & Evans, 1998). The processed MRIs were then segmentedaccording to their physiological classification (grey matter, white matter, cerebrospinalfluid) (Zijdenbos, Forghani, & Evans, 2002). The Constrained Laplacian AnatomicalSegmentation using Proximities (CLASP) method (Kim et al., 2005) was applied to producethe surfaces of grey and white matter. The white matter surfaces were expanded out to thegrey matter/cerebrospinal fluid surface boundary using a surface deformation algorithm(Kim et al., 2005). This procedure permits close matching of grey and white matterboundaries and cortical thickness can be calculated based on the distance between thesurfaces. This procedure resulted in 40,962 vertices for each hemisphere. The corticalsurfaces were non-linearly aligned to a standardized surface template (Lyttelton, Boucher,Robbins, & Evans, 2007). Cortical thickness data were smoothed following surfacecurvature using a blurring kernel of 20 mm. This technique enhances the identification ofcortical thickness changes among the population.
2.5. Scans and surfaces quality assessmentStructural MRIs were visually assessed for scan quality. Great care was taken to assess eachanatomical scan both pre- and post-processing to minimize the total number of excludedscans. First, scans were visually inspected by 2 authors (KDT and EGD) for ghosting ofimages and blurrinesss, and these attributes, if present, were noted. No scans were excludedat this stage. All images were entered into the cortical thickness processing pipeline andsubsequently the surfaces were inspected for any bridging, malformation of gyri, sulci andany features that did not compare with anatomical scans. If any of these characteristics werepresent those scans were excluded.
2.6. Cortical thickness analysesCortical thickness analyses were performed using the Matlab (The Mathworks, Natick VA)based program SurfStat (Worsley et al., 2009). The statistical analysis was performed ateach vertex of the cortical surface using linear models to examine: (1) differences in corticalthickness between groups controlling for both sex and age; (2) interaction analyses to assessage-related changes between groups (ASD and controls) by regressing cortical thicknessagainst age, controlling for sex; (3) in the ASD group only, the relation between social andcommunication scores on the ADI-R (most severe) and changes in cortical thickness; (4)lastly, the interaction effects between age and social scores (most severe on the ADI-R). Forthe latter analysis, a priori ROIs were manually drawn bilaterally on an average anatomicalMRI in MNI space constructed from participant scans by one of the authors (EGD). Fig. 1shows the location and spatial extent of the ROIs. These regions included those in frontal(rostral and dorsal ACC, mPFC, OFC, IFG) and temporal (STG, fusiform gyri) cortices.
Doyle-Thomas et al. Page 4
Res Autism Spectr Disord. Author manuscript; available in PMC 2013 May 13.
Autism Speaks Author M
anuscriptAutism
Speaks Author Manuscript
The rostral portion of the ACC is anterior and superior to the genu of the corpus callosum.The anterior border was the rostral portion of the cingulate gyrus/marginal segment of thesupraorbital sulcus. Posterior boundary was the portion of the gyrus located ~24 mmanterior to the anterior commissure. The superior boundary was the cingulate sulcus and theinferior boundary was the intercommissural plane. The anterior border of the dorsal ACCwas just posterior to that of the rostral ACC. The posterior border of the dorsal ACC was themidpoint of the corpus callosum located near the most anterior portion of that thalamus. Thesuperior boundary was the cingulate sulcus and the inferior boundary was the commissuralsulcus.
Other frontal lobe structures that were defined included the mPFC, the IFG, and the OFC.The mPFC was comprised of the medial aspect of the superior frontal gyrus that extendedfrom the frontal pole to the anterior commissure. The inferior boundary was the cingulatesulcus. The inferior frontal gyrus was comprised of the most inferior gyri of the frontal lobeand included the pars orbitalis, triangularis, and opercularis. The OFC was comprised ofgyrus rectus and the anterior, posterior, lateral and medial oribital gyri extending mediallyand superiorly to the supraorbital sulcus.
Temporal lobe structures included the STG and fusiform gyrus. The STG extended from theanterior portion of the temporal lobe and posteriorly to the angular gyrus. The superiorborder was the lateral fissure and the inferior border was the superior temporal sulcus. Thefusiform gyrus was defined anteriorly to the medial occipital sulcus and extended posteriorlyto the occipital pole. The lateral boundary was the lateral occipitotemporal sulcus and themedial boundary was the collateral sulcus.
The ADI-R scores from the social and communication domain were included in asubsequent linear model with and without age, controlling for sex. The data were correctedfor multiple comparisons using the false discovery rate (q < 0.05).
3. Results3.1. Participants
The scans and surfaces quality assessment resulted in 53 useable scans that allowed us toexamine cortical thickness in ASD (n = 28) and typically developing (n = 25) participantsbetween the ages of 7 and 39 years. A significant age difference was found between theexcluded group (mean age = 11.05 years) and the included group (mean age = 22.64 years;unpaired t-test, df = 69, t = 5.68, p < 0.05). No significant differences were found betweenthese groups on IQ. ASD participants who were included in the analyses had higher scoresin the ADOS social domain compared to the excluded group (included participants: meanscore = 7.71; excluded participants: mean score = 5.36, df = 37, t = 2.67, p < 0.05). TheASD groups did not differ on scores in the ADOS communication domain, ADI-R socialdomain or ADI-R communication domain. The final participant groups were notsignificantly different in age or full scale IQ based on unpaired t-tests (Table 1). Mean ageand IQ scores for ASD and control participants included in the analysis are shown in Table1.
3.2. Whole brain – between group analysisBased on an analysis of the entire grey matter controlling for sex and age, no significantdifferences in cortical thickness were observed between groups. In the ASD group comparedto controls a trend toward thicker cortices was observed in the rostral ACC, the paracentrallobule, primary somatosensory/motor cortex (M1/S1) and anterior insula (aIns), howeverthese did not survive corrections for multiple comparisons. Typically developing individualsshowed a trend towards thicker cortices relative to the ASD group in the IFG, STG and
Doyle-Thomas et al. Page 5
Res Autism Spectr Disord. Author manuscript; available in PMC 2013 May 13.
Autism Speaks Author M
anuscriptAutism
Speaks Author Manuscript
OFC, however these also did not survive corrections for multiple comparisons (all q > 0.05corrected).
3.3. Whole brain – within group age effectsWithin the ASD group, only the inferior frontal gyrus, inferior temporal gyrus (ITG) and theposterior cingulate gyrus (PCG) were thinner with increasing age (all q < 0.05 corrected,Fig. 2A). In controls, cortical thickness reduced with age across the entire grey mattersurface (all q < 0.05 corrected, Fig. 2B). All analyses were done controlling for sex.
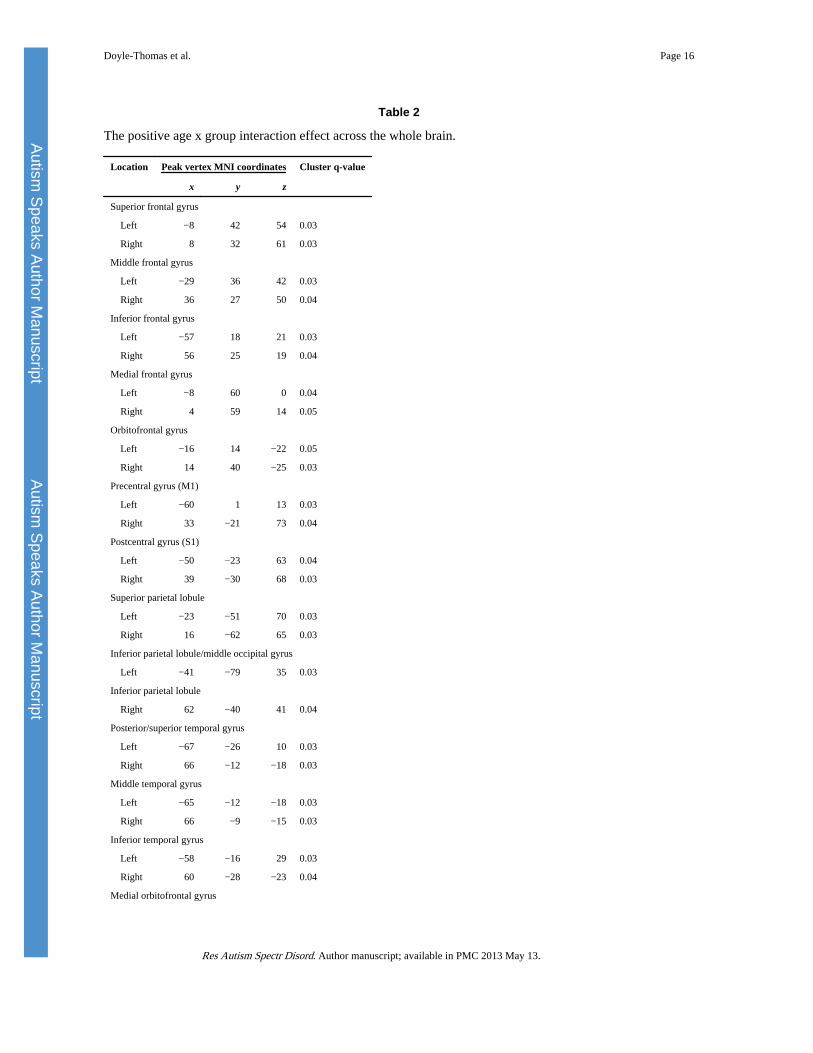
3.4. Whole brain – group-by-age interaction analysisWhile typically developing children and adults showed thinner cortices with increasing age,significantly less age-related thinning was observed in the ASD group in the superior frontalgyri (SFG), middle frontal gyri (MFG), IFG, medial frontal gyri (MFG), OFC, M1, S1, PCL,superior parietal lobules (SPL), inferior parietal lobules (IPL), middle occipital gyri (MOG),temporal poles, STG, middle temporal gyri (MTG), ITG, medial orbitofrontal gyrus(mOFG), PCG, precuneus and parietoccipital fissure (Fig. 2C and Table 2).
The age-by-group interaction analysis was repeated after removing the data from thechildren aged 7–10 years, as this represented a small portion of the sample (n = 6) and mayhave unduly influenced the results. Results were similar to what was previously found whenanalysing the data from the entire cohort where the ASD participants showed little age-related thinning in M1, S1, PCL, IPL, STG, mOFG, PCG and parietoccipital fissure. Thus,all participants were included in subsequent analyses.
3.5. Correlation with autism severity measures3.5.1. Relation between social impairment scores and cortical thickness inROIs—A directed search in the brain regions (ROIs) implicated in social andcommunication functions revealed a significant correlation between thicker cortices in therACC (Montreal Neurological Institute, MNI coordinates; x = 4, y = 28, z = 23; df = 25, q =0.03) and more severe scores on the ADI-R social domain (t = 2.09, df = 25, p = 0.047, seeFig. 3), but not in the mPFC, IFG or STG. No associations were observed betweencommunication scores on the ADI-R and cortical thickness.
3.5.2. Relation between age, social impairment scores and cortical thicknessin ROIs—Significant interaction effects were found in the left orbitofrontal gyrus (MNIcoordinates: x = −16, y = 36, z = −26, df = 25, q = 0.014) where reduced cortical thicknesswas associated with more severe social impairments on the ADI-R in all participants, butwas more pronounced in younger participants relative to adults with ASD. No othersignificant correlations were observed in the selected ROIs between cortical thickness,symptomatology and age.
4. DiscussionThe present study provides insight into age-related cortical thickness changes in a well-characterized ASD sample with a wide age range. The results indicate that socialimpairment is associated with atypical brain morphology in ASD participants.
In this sample of children and adults with and without ASD, when controlling for age,between-group analysis revealed only trends towards thicker cortices in the rACC, PCL,M1/S1 and anterior insula in the ASD group. Some groups have reported increasedthickness or density in brain regions in groups of pre-adolescents (Bonilha et al., 2008) andadults (Hyde, Samson, Evans, & Mottron, 2010; Schmitz et al., 2006; Toal et al., 2009) with
Doyle-Thomas et al. Page 6
Res Autism Spectr Disord. Author manuscript; available in PMC 2013 May 13.
Autism Speaks Author M
anuscriptAutism
Speaks Author Manuscript
ASD relative to typically developing individuals. As these prior studies focused on sampleswith narrower age ranges their results reflect alterations in brain morphology duringrestricted periods and are not able to examine developmental changes.
However, when examining age-related differences within groups, the ASD group hadreduced cortical thinning across age relative to controls, across a large portion of the cortex.To date, few studies have investigated age-related changes in cortical thickness inindividuals with ASD and collectively they suggest a complex pattern of cortical thicknessmaturation in this group. In agreement with the current findings, studies that includedparticipants across a wide age range (Raznahan et al., 2010; Scheel et al., 2011) found moreregions with little to no change in cortical thickness in individuals with ASD. In comparison,studies with narrower age ranges report that the cortex thins with age in individuals withASD. (Mak-Fan et al., 2011; Wallace et al., 2010). This may suggest that the developmentalpattern observed in the current study and others with large age-spans is most apparent whenexamining a wider window of development.
Social impairment was associated with different cortical thickness profiles in the OFC andthe rACC in individuals with ASD. The OFC is implicated in social cognitive functions suchas affective empathy and arousal (Decety, 2010), social reward processing (Adolphs, 2009)and emotional self-regulation (Bachevalier & Loveland, 2006). The rACC is linked withassessing the salience and motivational value of social stimuli, as well as regulatingemotional responses (Bush, Luu, & Posner, 2000). In the OFC, thinner cortices wereassociated with more severely impacted social function and the rate of thinning was morepronounced in younger participants relative to adults. Conversely, in the rACC, poor socialfunction was related to thicker cortices and did not vary with age, suggesting that thisabnormality is present in childhood and persists in a similar form into adulthood.
The observed age-related decrease in cortical thickness in the OFC and its relation to moresevere social impairment in ASD is consistent with Hardan et al. (2009), who found similarresults across the entire frontal lobe in pre-adolescent boys with ASD over a 2-year period.In the current study, we utilized a higher magnetic field strength (3 T) to acquire theanatomical MRIs which may have improved our ability to detect regional changes (Alvarez-Linera, 2008). In addition, our directed search in the OFC reduced the number of correctionsfor multiple comparisons, which resulted in a significant correlation between corticalthickness and symptomatology. Our results add to the literature by suggesting that corticalthinning in the OFC may start early in childhood and persist into adulthood.
The results of the present study also show that thicker cortices in the rACC at all ages wereassociated with more severe social impairment. Increased thickness and other structuralatypicalities in the ACC were initially reported in post-mortem studies (Bailey et al., 1998;Kemper & Bauman, 1993). Previous structural MRI studies reported both decreased greymatter volume in the ACC (Abell et al., 1999; Kwon, Ow, Pedatella, Lotspeich, & Reiss,2004; McAlonan et al., 2002), and increased thickness in this region in individuals withASD relative to controls (Bonilha et al., 2008; Hyde et al., 2010; Schmitz et al., 2006; Toalet al., 2009), but there were no data on age-related changes in the ACC. The present study isimportant in its findings of developmental changes in cortical thickness in ASD in therACC, a region central to the social cognitive functions.
4.1. LimitationsThe cross-sectional study design used in the present study is only a proxy for a longitudinalstudy design, which is better suited for understanding developmental changes. Future studiesusing a larger sample and a longitudinal study design will further inform our currentknowledge of developmental atypicalities in cortical thickness and its relation to social
Doyle-Thomas et al. Page 7
Res Autism Spectr Disord. Author manuscript; available in PMC 2013 May 13.
Autism Speaks Author M
anuscriptAutism
Speaks Author Manuscript
impairment. In the present cohort, a balanced distribution of individuals across the entireage-range would have been most desirable. Unfortunately, there were fewer ASDindividuals between the ages of 7 and 10 years than typically developing controls. For thepurpose of comparison we removed these extra control participants from the analysis andobtained similar results in many of the regions listed in the full group analysis. Thusdevelopmental differences in cortical thickness across the brain persisted despite thislimitation.
In the present study, our focus was on the cortical mantle. Few structural brainmorphometric studies have correlated changes in subcortical grey matter volume or corticaldensity with behavioural impairment in ASD (Hollander et al., 2005; Nacewicz et al., 2006),highlighting the need for more research in this area. Although we observed an associationbetween the morphology of social brain regions, symptomatology and age, it still needs tobe determined whether these structural abnormalities are the cause or effect of socialimpairment in ASD.
5. ConclusionsASD are neurodevelopmental disorders and therefore age-related changes are crucial tounderstanding the neurobiology of crucial to understanding the neurobiology of associatedbehaviour. The present findings underscore the importance of including age interactionswhen analysing structural properties of the autistic brain, as age effects may contribute tovariance in structural indices. Across the age-span of our sample we found significantdifferences in the development of cortical thickness across the entire brain. In regionsimplicated in social and communication functions specifically, atypical cortical thickness inthe rACC and OFC were associated with impaired social function. These findings raise thequestion of whether atypical development of cortical thickness in these areas of the brainmay be an intermediate phenotype that may be explored further for neurobiological andtreatment research.
AcknowledgmentsThe data for this study were collected at Mount Sinai School of Medicine in New York, New York. The analyseswere carried out at Holland Bloorview Kids Rehabilitation Hospital and the Hospital for Sick Children.
ReferencesAbell F, Krams M, Ashburner J, Passingham R, Friston K, Frackowiak R, et al. The neuroanatomy of
autism: A voxel-based whole brain analysis of structural scans. Neuroreport. 1999; 10:1647–1651.[PubMed: 10501551]
Ad-Dab’bagh, Y.; Lyttelton, O.; Muehlboeck, JS.; Lepage, C.; Einarson, D.; Mok, K., et al. TheCIVET image-processing environment: A fully automated comprehensive pipeline for anatomicalneuroimaging research. In: Corbetta, M., editor. Proceedings of the 12th annual meeting of theorganization for human brain mapping; Florence, Italy. 2006. p. 2266
Adolphs R. The social brain: Neural basis of social knowledge. Annual Review of Psychology. 2009;60:693–716.
Alvarez-Linera J. 3 T MRI: Advances in brain imaging. European Journal of Radiology. 2008;67:415–426. [PubMed: 18455895]
Bachevalier J, Loveland KA. The orbitofrontal-amygdala circuit and self-regulation of social-emotional behavior in autism. Neuroscience & Biobehavioral Reviews. 2006; 30:97–117. [PubMed:16157377]
Bailey A, Luthert P, Dean A, Harding B, Janota I, Montgomery M, et al. A clinicopathological studyof autism. Brain. 1998; 121:889–905. [PubMed: 9619192]
Doyle-Thomas et al. Page 8
Res Autism Spectr Disord. Author manuscript; available in PMC 2013 May 13.
Autism Speaks Author M
anuscriptAutism
Speaks Author Manuscript
Baron-Cohen S, Belmonte MK. Autism: A window onto the development of the social and the analyticbrain. Annual Review of Neuroscience. 2005; 28:109–126.
Bermudez P, Lerch JP, Evans AC, Zatorre RJ. Neuroanatomical correlates of musicianship as revealedby cortical thickness and voxel-based morphometry. Cerebral Cortex. 2009; 19:1583–1596.[PubMed: 19073623]
Bernhardt BC, Worsley KJ, Besson P, Concha L, Lerch JP, Evans AC, et al. Mapping limbic networkorganization in temporal lobe epilepsy using morphometric correlations: insights on the relationbetween mesiotemporal connectivity and cortical atrophy. Neuroimage. 2008; 42:515–524.[PubMed: 18554926]
Bloss CS, Courchesne E. MRI neuroanatomy in young girls with autism: A preliminary study. Journalof the American Academy of Child & Adolescent Psychiatry. 2007; 46:515–523. [PubMed:17420687]
Bonilha L, Cendes F, Rorden C, Eckert M, Dalgalarrondo P, Li LM, et al. Gray and white matterimbalance—typical structural abnormality underlying classic autism? Brain and Development.2008; 30:396–401. [PubMed: 18362056]
Bush G, Luu P, Posner MI. Cognitive and emotional influences in anterior cingulate cortex. Trends inCognitive Sciences. 2000; 4:215–222. [PubMed: 10827444]
Carper RA, Moses P, Tigue ZD, Courchesne E. Cerebral lobes in autism: Early hyperplasia andabnormal age effects. NeuroImage. 2002; 16:1038–1051. [PubMed: 12202091]
Charil A, Dagher A, Lerch JP, Zijdenbos AP, Worsley KJ, Evans AC. Focal cortical atrophy inmultiple sclerosis: relation to lesion load and disability. Neuroimage. 2007; 34:509–517. [PubMed:17112743]
Collins D, Peters T, Evans A. An automated 3D non-linear deformation procedure for determination ofgross morphometric variability in the human brain. Proceedings of SPIE. 1994:180–194. 2359.
Courchesne E, Campbell K, Solso S. Brain growth across the life span in autism: Age-specific changesin anatomical pathology. Brain Research. 2011; 1380:138–145. [PubMed: 20920490]
Decety J. The neurodevelopment of empathy in humans. Developmental Neuroscience. 2010; 32:257–267. [PubMed: 20805682]
Fahim C, Yoon U, Sandor P, Frey K, Evans A. Thinning of the motor-cingulate-insular cortices insiblings concordant for tourette syndrome. Brain Topography. 2009; 22:176–184. [PubMed:19779823]
Giedd J, Shaw P, Eckstrand K, Sharp W, Blumenthal J, Lerch JP, et al. Attention deficit/hyperactivitydisorder is characterized by a delay in cortical maturation. Proceedings of the National Academyof Sciences of the United States of America. 2007; 104:19649–19654. [PubMed: 18024590]
Greene CM, Braet W, Johnson KA, Bellgrove MA. Imaging the genetics of executive function.Biological Psychiatry. 2008; 79:30–42.
Hadjikhani N, Joseph RM, Snyder J, Tager-Flusberg H. Anatomical differences in the mirror neuronsystem and social cognition network in autism. Cerebral Cortex. 2006; 16:1276–1282. [PubMed:16306324]
Hardan AY, Libove RA, Keshavan MS, Melhem NM, Minshew NJ. A preliminary longitudinalmagnetic resonance imaging study of brain volume and cortical thickness in autism. BiologicalPsychiatry. 2009; 66:320–326. [PubMed: 19520362]
Hazlett HC, Poe MD, Gerig G, Smith RG, Piven J. Cortical gray and white brain tissue volume inadolescents and adults with autism. Biological Psychiatry. 2006; 59:1–6. [PubMed: 16139816]
Hollander E, Anagnostou E, Chaplin E, Esposito K, Haznedar MM, Licalzi E, et al. Striatal volume onmagnetic resonance imaging and repetitive behaviors in autism. Biological Psychiatry. 2005;58:226–232. [PubMed: 15939406]
Hyde KL, Samson F, Evans AC, Mottron L. Neuroanatomical differences in brain areas implicated inperceptual and other core features of autism revealed by cortical thickness analysis and voxel-based morphometry. Human Brain Mapping. 2010; 31:556–566. [PubMed: 19790171]
Kates WR, Burnette CP, Eliez S, Strunge LA, Kaplan D, Landa R, et al. Neuroanatomic variation inmonozygotic twin pairs discordant for the narrow phenotype for autism. The American Journal ofPsychiatry. 2004; 161:539–546. [PubMed: 14992981]
Doyle-Thomas et al. Page 9
Res Autism Spectr Disord. Author manuscript; available in PMC 2013 May 13.
Autism Speaks Author M
anuscriptAutism
Speaks Author Manuscript
Kemper TL, Bauman ML. The contribution of neuropathologic studies to the understanding of autism.Neurologic clinics. 1993; 11:175–187. [PubMed: 8441369]
Kim JS, Singh V, Lee JK, Lerch J, Ad-Dab’bagh Y, MacDonald D, et al. Automated 3-D extractionand evaluation of the inner and outer cortical surfaces using a Laplacian map and partial volumeeffect classification. NeuroImage. 2005; 27:210–221. [PubMed: 15896981]
Kwon H, Ow AW, Pedatella KE, Lotspeich LJ, Reiss AL. Voxel-based morphometry elucidatesstructural neuroanatomy of high-functioning autism and Asperger syndrome. DevelopmentalMedicine and Child Neurology. 2004; 46:760–764. [PubMed: 15540637]
Lenroot KR, Shmitt JE, Ordaz SJ, Wallace GL, Neale MC, Lerch JP, et al. Differences in genetic andenvironmental influences on the human cerebral cortex associated with development duringchildhood and adolescence. Human Brain Mapping. 2009; 30:163–174. [PubMed: 18041741]
Lerch JP, Pruessner J, Zijdenbos AP, Collins DL, Teipel SJ, Hampel H, et al. Automated corticalthickness measurements from MRI can accurately separate Alzheimer’s patients from normalelderly controls. Neurobiology of Aging. 2008; 29:23–30. [PubMed: 17097767]
Lerch JP, Worsley K, Shaw WP, Greenstein DK, Lenroot RK, Giedd J, et al. Mapping anatomicalcorrelations across cerebral cortex (MACACC) using cortical thickness from MRI. Neuroimage.2006; 31:993–1003. [PubMed: 16624590]
Lord C, Risi S, Lambrecht L, Cook EH, Leventhal BL, DiLavore PC, et al. The autism diagnosticobservation schedule-generic: A standard measure of social and communication deficits associatedwith the spectrum of autism. Journal of Autism and Developmental Disorders. 2000; 30:205–223.[PubMed: 11055457]
Lord C, Rutter M, Le Couteur A. Autism Diagnostic Interview-Revised: A revised version of adiagnostic interview for caregivers of individuals with possible pervasive developmental disorders.Journal of Autism and Developmental Disorders. 1994; 24:659–685. [PubMed: 7814313]
Lyttelton O, Boucher M, Robbins S, Evans A. An unbiased iterative group registration template forcortical surface analysis. NeuroImage. 2007; 34:1535–1544. [PubMed: 17188895]
Mak-Fan, KM.; Taylor, MJ.; Roberts, W.; Lerch, JP. Measures of cortical grey matter structure anddevelopment in children with autism spectrum disorder. Journal of Autism and DevelopmentalDisorders. 2011. http://dx.doi.org/10.1007/s10803-011-1261-6
McAlonan GM, Daly E, Kumari V, Critchley HD, van Amelsvoort T, Suckling J, et al. Brain anatomyand sensorimotor gating in Asperger’s syndrome. Brain. 2002; 125:1594–1606. [PubMed:12077008]
Meguid N, Fahim C, Yoon U, Nashaat N, Ibrahim A, Mancini-Marie A, et al. Brain morphology inautism and fragile X syndrome correlates with social IQ: First report from the Canadian–Swiss–Egyptian neurodevelopmental study. Journal of Child Neurology. 2010; 25:599–608. [PubMed:20110214]
Nacewicz BM, Dalton KM, Johnstone J, Long MT, McAuliff EM, Oakes TR, et al. Amygdala volumeand nonverbal social impairment in adolescent and adult males with autism. Archives of GeneralPsychiatry. 2006; 63:1417–1428. [PubMed: 17146016]
Palmen SJ, Hulshoff Pol HE, Kemner C, Schnack HG, Durston S, Lahuis BE, et al. Increased gray-matter volume in medication-naive high-functioning children with autism spectrum disorder.Psychological Medicine. 2005; 35:561–570. [PubMed: 15856726]
Raznahan A, Lerch JP, Lee N, Greenstein D, Wallace GL, Stockman M, et al. Patterns of coordinatedanatomical change in human cortical development: a longitudinal neuroimaging study ofmaturational coupling. Neuron. 2011; 72:873–884. [PubMed: 22153381]
Raznahan A, Shaw P, Lalonde F, Stockman M, Wallace GL, Greenstein D, et al. How does yourcortex grow? The Journal of Neuroscience. 2011; 31:7174–7177. [PubMed: 21562281]
Raznahan A, Toro R, Daly E, Robertson D, Murphy C, Deeley Q, et al. Cortical anatomy in autismspectrum disorder: An in vivo MRI study on the effect of age. Cerebral Cortex. 2010; 20:1332–1340. [PubMed: 19819933]
Scheel C, Rotarska-Jagiela A, Schilbach L, Lehnhardt FG, Krug B, Vogeley K, et al. Imaging derivedcortical thickness reduction in high-functioning autism: Key regions and temporal slope.NeuroImage. 2011; 58:391–400. [PubMed: 21749926]
Doyle-Thomas et al. Page 10
Res Autism Spectr Disord. Author manuscript; available in PMC 2013 May 13.
Autism Speaks Author M
anuscriptAutism
Speaks Author Manuscript
Schmitz N, Rubia K, Daly E, Smith A, Williams S, Murphy DGM. Neural correlates of executivefunction in autistic spectrum disorders. Biological Psychiatry. 2006; 59:7–16. [PubMed:16140278]
Schumann CM, Bloss CS, Barnes CC, Wideman GM, Carper RA, Akshoomoff N, et al. Longitudinalmagnetic resonance imaging study of cortical development through early childhood in autism. TheJournal of Neuroscience. 2010; 30:4419–4427. [PubMed: 20335478]
Shaw P, Kabani NJ, Lerch JP, Eckstrand K, Lenroot R, Gogtay N, et al. Neurodevelopmentaltrajectories of the human cerebral cortex. The Journal of Neuroscience. 2008; 28:3586–3594.[PubMed: 18385317]
Singh V, Chertkow H, Lerch JP, Evans AC, Door AE, Kabani NJ. Spatial patterns of cortical thinningin mild cognitive impairment in Alzheimer’s disease. Brain. 2006; 129:2885–2893. [PubMed:17008332]
Sled JG, Zijdenbos AP, Evans AC. A nonparametric method for automatic correction of intensitynonuniformity in MRI data. IEEE Transactions on Medical Imaging. 1998; 17:87–97. [PubMed:9617910]
Toal F, Bloemen OJN, Deeley Q, Tunstall N, Daly EM, Page L, et al. Psychosis and autism: magneticresonance imaging study of brain anatomy. The British Journal of Psychiatry. 2009; 194:418–425.[PubMed: 19407271]
Wallace GL, Dankner N, Kenworthy L, Giedd JN, Martin A. Age-related temporal and parietalcortical thinning in autism spectrum disorders. Brain. 2010; 133:3745–3754. [PubMed: 20926367]
Wechsler, D. Manual for the Wechsler Intelligence Scale for Children (WISC-IV). 4. San Antonio,Texas: Psychological Corporation; 2003.
Wechsler, D. Wechsler Adult Intelligence Scale. 4. San Antonio, Texas: Pearson; 2008.
Worsley, KJ.; Taylor, JE.; Carbonell, F.; Chung, MK.; Duerden, E.; Bernhardt, B., et al. SurfStat: AMatlab toolbox for the statistical analysis of univariate and multivariate surface and volumetricdata using linear mixed effects models and random field theory. Paper presented at the HumanBrain Mapping; San Francisco, California. 2009.
Zhou D, Lebel C, Lepage C, Rasmussen C, Evans A, Wyper K, et al. Developmental cortical thinningin fetal alcohol spectrum disorders. Neuroimage. 2011; 58:16–25. [PubMed: 21704711]
Zijdenbos AP, Forghani R, Evans AC. Automatic pipeline analysis of 3-D MRI data for clinical trials:application to multiple sclerosis. IEEE Transactions on Medical Imaging. 2002; 21:1280–1291.[PubMed: 12585710]
Doyle-Thomas et al. Page 11
Res Autism Spectr Disord. Author manuscript; available in PMC 2013 May 13.
Autism Speaks Author M
anuscriptAutism
Speaks Author Manuscript
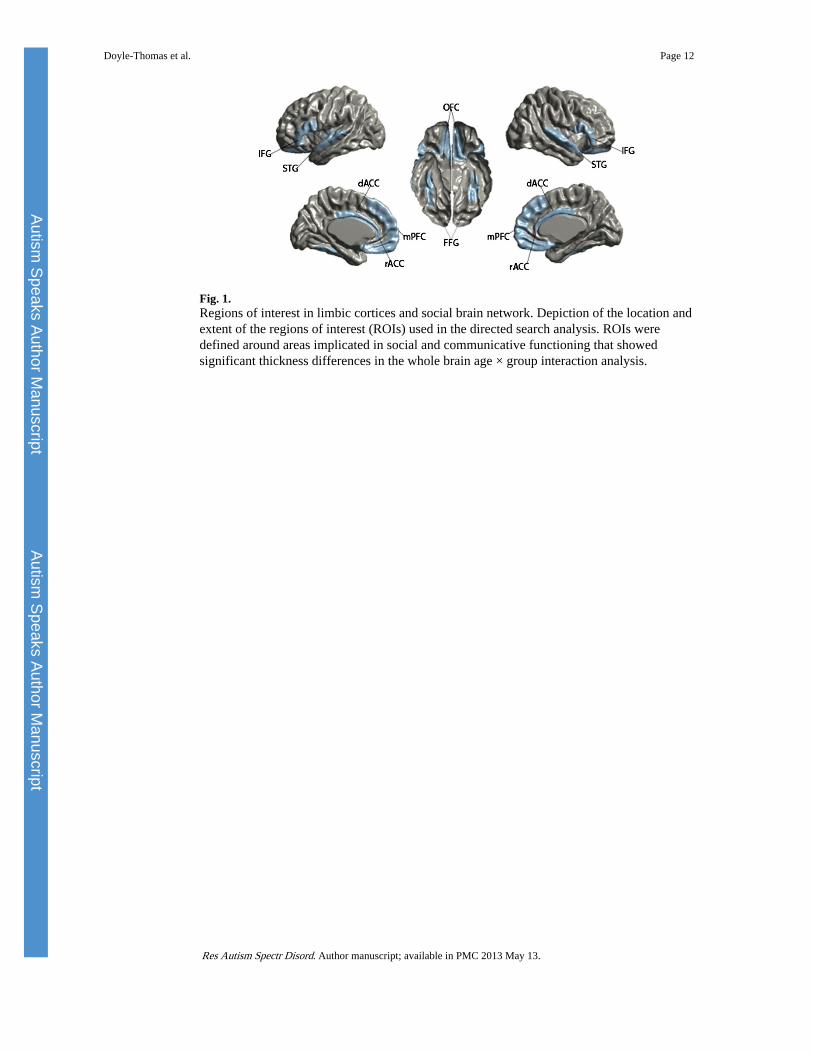
Fig. 1.Regions of interest in limbic cortices and social brain network. Depiction of the location andextent of the regions of interest (ROIs) used in the directed search analysis. ROIs weredefined around areas implicated in social and communicative functioning that showedsignificant thickness differences in the whole brain age × group interaction analysis.
Doyle-Thomas et al. Page 12
Res Autism Spectr Disord. Author manuscript; available in PMC 2013 May 13.
Autism Speaks Author M
anuscriptAutism
Speaks Author Manuscript
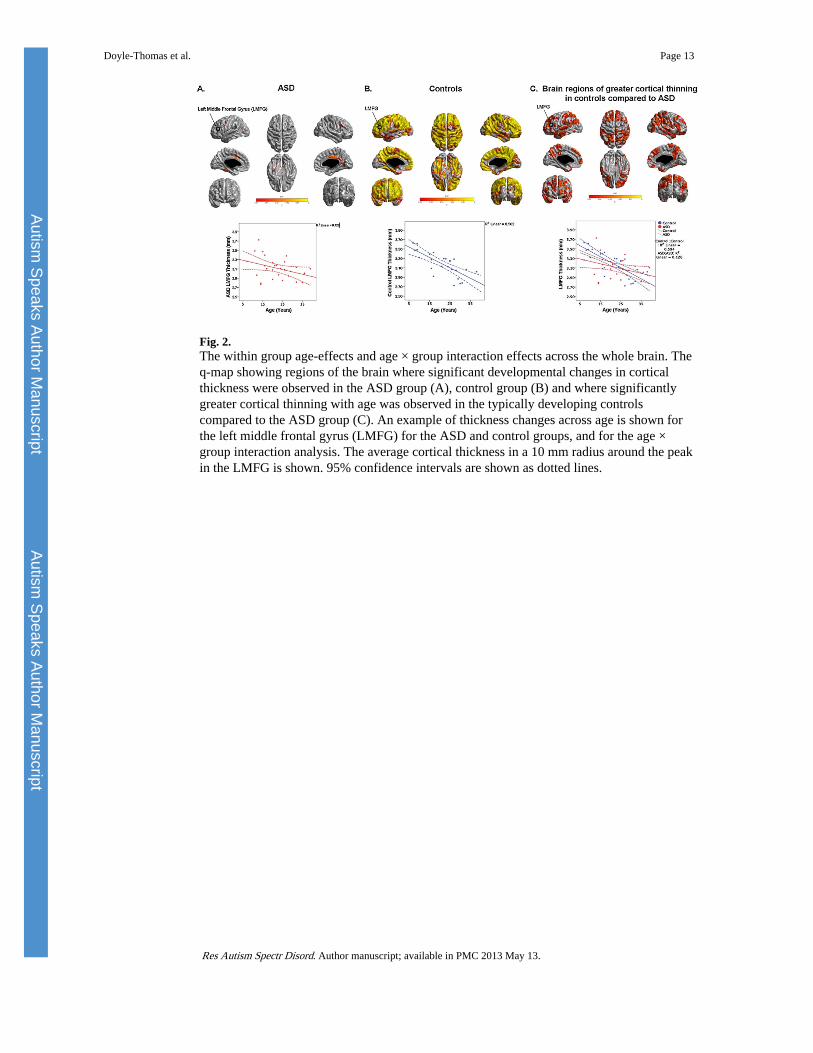
Fig. 2.The within group age-effects and age × group interaction effects across the whole brain. Theq-map showing regions of the brain where significant developmental changes in corticalthickness were observed in the ASD group (A), control group (B) and where significantlygreater cortical thinning with age was observed in the typically developing controlscompared to the ASD group (C). An example of thickness changes across age is shown forthe left middle frontal gyrus (LMFG) for the ASD and control groups, and for the age ×group interaction analysis. The average cortical thickness in a 10 mm radius around the peakin the LMFG is shown. 95% confidence intervals are shown as dotted lines.
Doyle-Thomas et al. Page 13
Res Autism Spectr Disord. Author manuscript; available in PMC 2013 May 13.
Autism Speaks Author M
anuscriptAutism
Speaks Author Manuscript
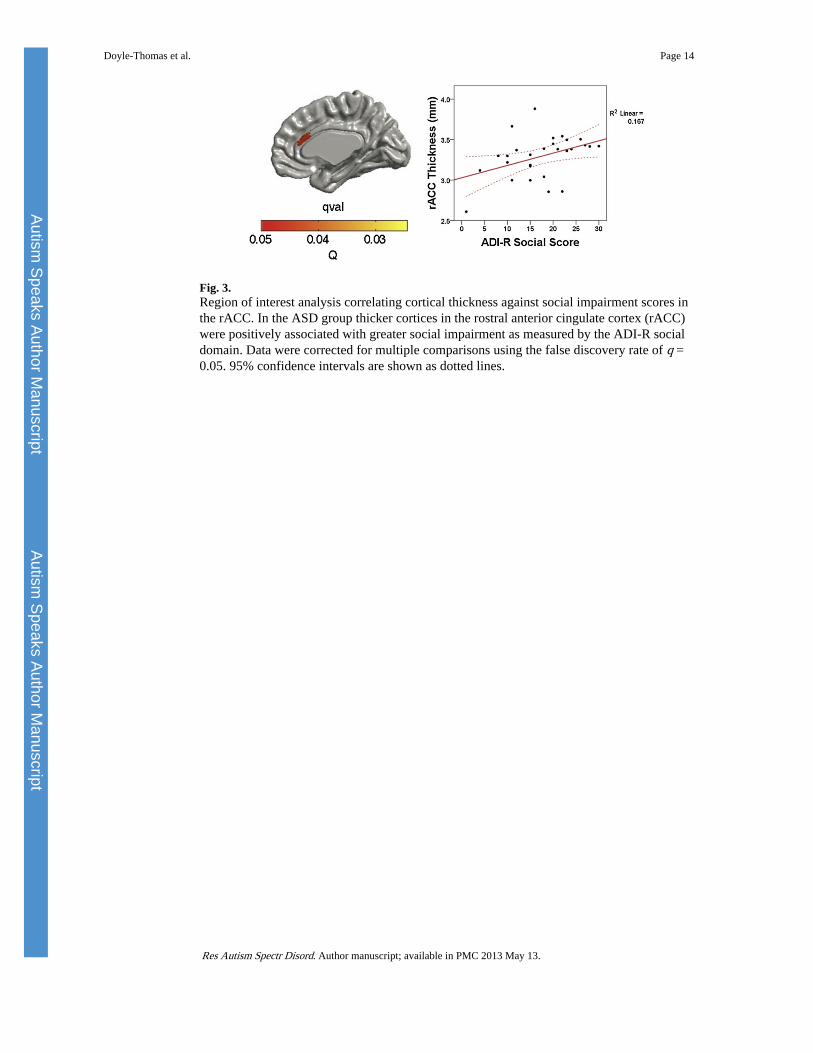
Fig. 3.Region of interest analysis correlating cortical thickness against social impairment scores inthe rACC. In the ASD group thicker cortices in the rostral anterior cingulate cortex (rACC)were positively associated with greater social impairment as measured by the ADI-R socialdomain. Data were corrected for multiple comparisons using the false discovery rate of q =0.05. 95% confidence intervals are shown as dotted lines.
Doyle-Thomas et al. Page 14
Res Autism Spectr Disord. Author manuscript; available in PMC 2013 May 13.
Autism Speaks Author M
anuscriptAutism
Speaks Author Manuscript
Autism Speaks Author M
anuscriptAutism
Speaks Author Manuscript
Doyle-Thomas et al. Page 15
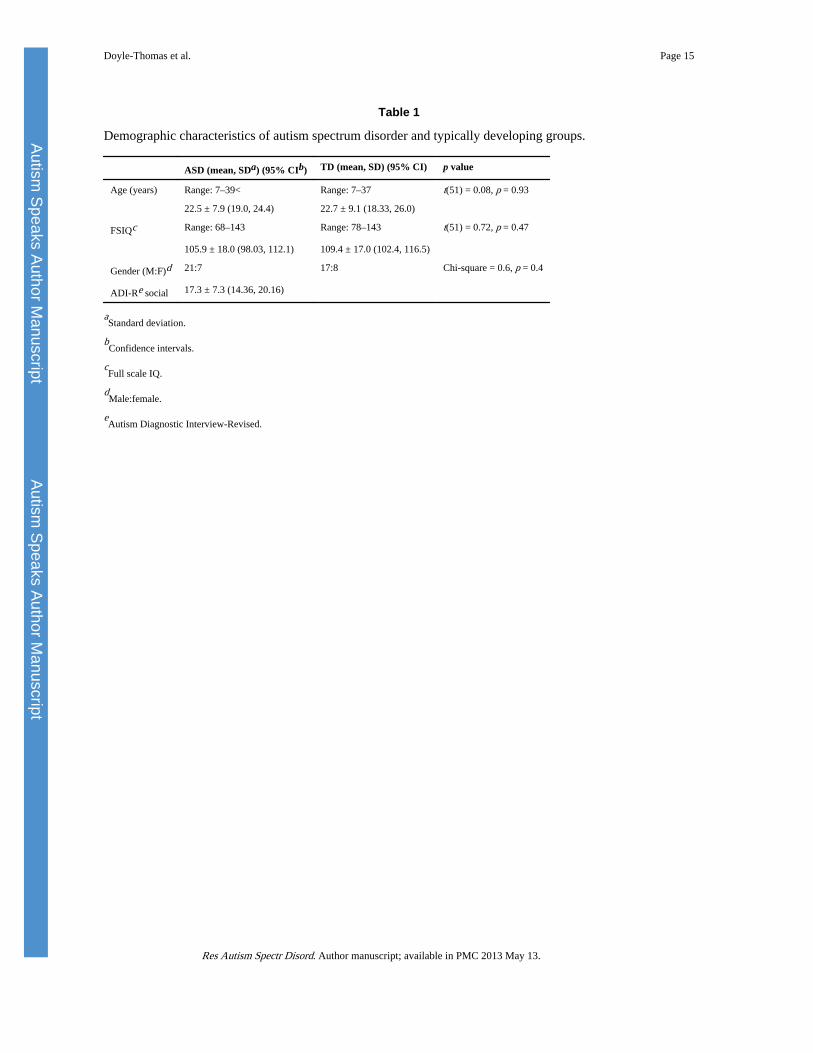
Table 1
Demographic characteristics of autism spectrum disorder and typically developing groups.
ASD (mean, SDa) (95% CIb) TD (mean, SD) (95% CI) p value
Age (years) Range: 7–39< Range: 7–37 t(51) = 0.08, p = 0.93
22.5 ± 7.9 (19.0, 24.4) 22.7 ± 9.1 (18.33, 26.0)
FSIQc Range: 68–143 Range: 78–143 t(51) = 0.72, p = 0.47
105.9 ± 18.0 (98.03, 112.1) 109.4 ± 17.0 (102.4, 116.5)
Gender (M:F)d 21:7 17:8 Chi-square = 0.6, p = 0.4
ADI-Re social 17.3 ± 7.3 (14.36, 20.16)
aStandard deviation.
bConfidence intervals.
cFull scale IQ.
dMale:female.
eAutism Diagnostic Interview-Revised.
Res Autism Spectr Disord. Author manuscript; available in PMC 2013 May 13.
Autism Speaks Author M
anuscriptAutism
Speaks Author Manuscript
Doyle-Thomas et al. Page 16
Table 2
The positive age x group interaction effect across the whole brain.
Location Peak vertex MNI coordinates Cluster q-value
x y z
Superior frontal gyrus
Left −8 42 54 0.03
Right 8 32 61 0.03
Middle frontal gyrus
Left −29 36 42 0.03
Right 36 27 50 0.04
Inferior frontal gyrus
Left −57 18 21 0.03
Right 56 25 19 0.04
Medial frontal gyrus
Left −8 60 0 0.04
Right 4 59 14 0.05
Orbitofrontal gyrus
Left −16 14 −22 0.05
Right 14 40 −25 0.03
Precentral gyrus (M1)
Left −60 1 13 0.03
Right 33 −21 73 0.04
Postcentral gyrus (S1)
Left −50 −23 63 0.04
Right 39 −30 68 0.03
Superior parietal lobule
Left −23 −51 70 0.03
Right 16 −62 65 0.03
Inferior parietal lobule/middle occipital gyrus
Left −41 −79 35 0.03
Inferior parietal lobule
Right 62 −40 41 0.04
Posterior/superior temporal gyrus
Left −67 −26 10 0.03
Right 66 −12 −18 0.03
Middle temporal gyrus
Left −65 −12 −18 0.03
Right 66 −9 −15 0.03
Inferior temporal gyrus
Left −58 −16 29 0.03
Right 60 −28 −23 0.04
Medial orbitofrontal gyrus
Res Autism Spectr Disord. Author manuscript; available in PMC 2013 May 13.
Autism Speaks Author M
anuscriptAutism
Speaks Author Manuscript
Doyle-Thomas et al. Page 17
Location Peak vertex MNI coordinates Cluster q-value
x y z
Left −28 52 −13 0.04
Posterior cingulate
Left −4 −32 39 0.04
Right 3 −49 −28 0.03
Precuneus
Left −1 −73 23 0.05
Parietoccipital fissure
Right 20 −68 25 0.04
Brain regions across the entire brain that show significantly greater cortical thinning with age in typically developing controls compared to theASD group. Coordinates are given in MNI space. Medial-lateral (X), anterior-posterior (Y), and superior-inferior (Z) positive values are right,anterior and superior. All q-values are above the threshold for significance (corrected for multiple comparisons using the False Discovery Rate, q =0.05).
Res Autism Spectr Disord. Author manuscript; available in PMC 2013 May 13.
Related Documents