Research paper on Effects and Prospects of Customer Handling in the Insurance Industry in Ethiopia (A Case Study at Nile Insurance Share Company) By BERHANU BELAY DESTA (Enrollment No: 099114006) Submitted to the Coordinator (Project MS-100), School of Management Studies, IGNOU, Maidan Garhi, New Delhi-110068, in Partial Fulfillment of the Requirements for Master of Business Administration in Operational Management. ADVISOR: Matiwos Ensermu (PhD) October, 2014 Addis Ababa, Ethiopia

Welcome message from author
This document is posted to help you gain knowledge. Please leave a comment to let me know what you think about it! Share it to your friends and learn new things together.
Transcript

Research paper
on
Effects and Prospects of Customer Handling
in the Insurance Industry in Ethiopia
(A Case Study at Nile Insurance Share Company)
By
BERHANU BELAY DESTA (Enrollment No: 099114006)
Submitted to the Coordinator (Project MS-100), School of
Management Studies, IGNOU, Maidan Garhi, New Delhi-110068, in
Partial Fulfillment of the Requirements for Master of Business
Administration in Operational Management.
ADVISOR:
Matiwos Ensermu (PhD)
October, 2014
Addis Ababa, Ethiopia

Certificate of Originality
This is to certify that the project titled “The Effects and Prospects of Customer Handling in
the Insurance Industry in Ethiopia (A Case Study at Nile Insurance Share Company)” is an
original work of the student and is being submitted in partial fulfillment for the award of the
Master’s Degree in Business Administration of Indira Gandhi National Open University
(IGNOU).
This report has not been submitted earlier either to this university or any other
university/institutions for the fulfillment of the requirement of a course of study.
_______________________ ______________________
SIGNATURE OF SUPERVISOR SIGNATURE OF STUDENT
Place Place:
Date: Date:

Acknowledgements
First and foremost I would like to thank the Almighty God for His invaluable gifts and love.
Next I would like to thank the participating company, i.e. Nile Insurance Share Company for
the overall support including customers’ data base fulfillment for the accomplishment of the
study objective.
My cordial thank goes to Dr. Matiwos Ensermu, for his indispensable advice and guidance in
bringing the research work to its present shape.
I would also like to take this opportunity that I’m grateful to the Indira Gandhi National
Open University (IGNOU) to furnish me in-depth knowledge through variety of courses in
the area of operations and business administration and also for the success of this research
paper.
Last but not the least, I would also like to thank my families particularly my wife W/o Addis-
Hiwot Assefa, daughters- Adiel Berhanu & Nardos Berhanu and Sister Kokebe Mamo for
their continuous encouragement and giving me sufficient time throughout years of my
educational study and at every stage of the research project to be realized.

Definition of Terms
SERVQUAL: A function of the gap between customers’ expectations of a service and their
perceptions of the actual service delivered by an organization.
Policy Holder: A person who owns an insurance policy/any other person who has legal
right to claim the benefits under that insurance policy
Value: The customers’ perception of the balance between the quality of products or
services that a firm provides and their price.
Quality: The totality of features and characteristics of a product and service which bear on its
ability to satisfy the stated or implied needs.
Service Quality: The expected and perceived quality of service offerings
Customer Satisfaction: The result of a product or services meeting or exceeding the
Buyers’ needs and expectations
Dissatisfaction: The un-pleasurable fulfillment response to a customer experience.
Front line personnel: Those employees who have the most contact with customers.
Customer: A person or organization receiving advice, a service, using the facilities
in a business relationship in the Insurance Service.
Complaint: A genuine expression of dissatisfaction/concern with the product/service
delivered by the Company that has failed to reach the standard stated, implied,
or expected.

List of Acronyms
Ans. Answer
Qn. Question
NBE National Bank of Ethiopia
EIC Ethiopian Insurance Corporation
NICE National Insurance Company of Ethiopia S.C
UNIC United Insurance Share Company
HRMPAD Human Resource Management and Property Administration Dep’t
BOD Board of Directors
GWP Gross Written Premium
SERVQUAL Service Quality
Eth. Ethiopia
SPSS Statistical Package for the Social Sciences
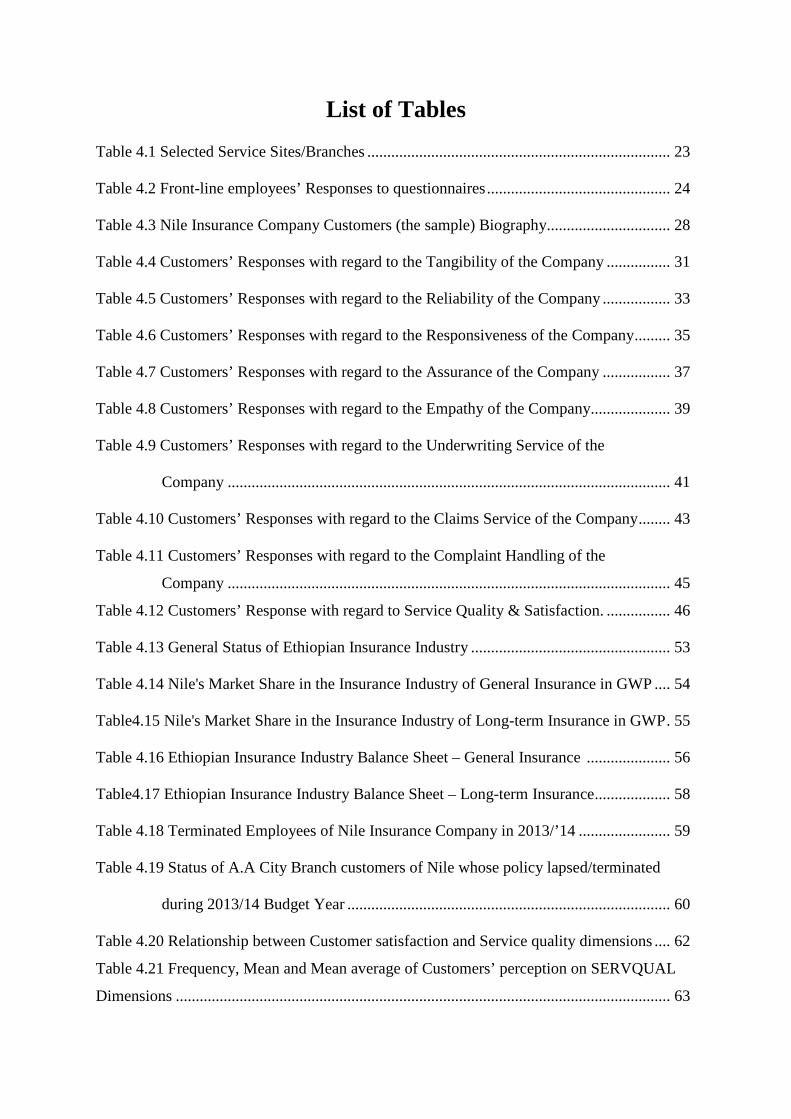
List of Tables
Table 4.1 Selected Service Sites/Branches ............................................................................ 23
Table 4.2 Front-line employees’ Responses to questionnaires .............................................. 24
Table 4.3 Nile Insurance Company Customers (the sample) Biography............................... 28
Table 4.4 Customers’ Responses with regard to the Tangibility of the Company ................ 31
Table 4.5 Customers’ Responses with regard to the Reliability of the Company ................. 33
Table 4.6 Customers’ Responses with regard to the Responsiveness of the Company ......... 35
Table 4.7 Customers’ Responses with regard to the Assurance of the Company ................. 37
Table 4.8 Customers’ Responses with regard to the Empathy of the Company.................... 39
Table 4.9 Customers’ Responses with regard to the Underwriting Service of the
Company ............................................................................................................... 41
Table 4.10 Customers’ Responses with regard to the Claims Service of the Company ........ 43
Table 4.11 Customers’ Responses with regard to the Complaint Handling of the
Company ............................................................................................................... 45 Table 4.12 Customers’ Response with regard to Service Quality & Satisfaction. ................ 46
Table 4.13 General Status of Ethiopian Insurance Industry .................................................. 53
Table 4.14 Nile's Market Share in the Insurance Industry of General Insurance in GWP .... 54
Table4.15 Nile's Market Share in the Insurance Industry of Long-term Insurance in GWP . 55
Table 4.16 Ethiopian Insurance Industry Balance Sheet – General Insurance ..................... 56
Table4.17 Ethiopian Insurance Industry Balance Sheet – Long-term Insurance ................... 58
Table 4.18 Terminated Employees of Nile Insurance Company in 2013/’14 ....................... 59
Table 4.19 Status of A.A City Branch customers of Nile whose policy lapsed/terminated
during 2013/14 Budget Year ................................................................................. 60
Table 4.20 Relationship between Customer satisfaction and Service quality dimensions .... 62 Table 4.21 Frequency, Mean and Mean average of Customers’ perception on SERVQUAL
Dimensions ............................................................................................................................ 63

List of Figures
Figure 2.1 Determination of customers delivered value ........................................................ 16
Figure 2.2 Measuring Customer Satisfaction......................................................................... 17
Figure 2.3 Relationship with customers................................................................................. 17
Figure 2.4 Nile’s SERVQUAL Dimension Chart.................................................................. 48
Annex
Annex I Questionnaire for Customers of Nile Insurance (Section I-III) (English &
Amharic version) ........................................................................................ 78-88
Annex II Questionnaire for Employees of Nile Insurance (Sec. IV) ......................... 89
Annex III Interview Questions for Managers of Nile Insurance (Sec. V) ................... 90-91
Annex IV Sample size determination table ................................................................. 92
Annex V Nonparametric Correlations Analysis ......................................................... 93

Abstract
The main aim of this thesis was to assess the effects and prospects of customer handling in the insurance industry in Ethiopia with a particular reference at Nile Insurance Company S.C as a case study. It tries to identify the level of customer satisfaction by measuring customers’ perception with regard to quality service delivered by the insurance using the five service quality dimensions which are Tangibles, Reliability, Responsiveness, Assurance and Empathy plus three additional variables, i.e. Underwriting, Claims Service and Complaint Handling. The study is basically a survey that used both quantitative and qualitative approaches. For the purpose of data collection SERVQUAL model questionnaire was adopted, pre-tested and personally administered to the targeted population by following the appropriate ethical procedure. In total 100 respondents were sampled from the total population of 15,936 customers of Nile Insurance S.C that are found in Addis Ababa City branches, using the sample size determination table developed by Yamane, 1967. Out of the distributed 100 questionnaires, 94 were returned constituting 94% response rate. More over ten frontline customer service employees from the ten selected branches, one from each, and four managers from both the head office and branches were also sampled. Out of the distributed questionnaires to front line employees and interviews conducted with managers, all were returned, which constituted 100%. The findings of this study showed that customers of Nile Insurance S.C in Addis Ababa branches were moderately satisfied in the service quality dimensions which showed expectations of customers’ perception exceed the actual performance of the insurer. Therefore, it is recommended that Nile Insurance Company S.C should give greater attention to improve its customer handling service quality and satisfy its customers by meeting or exceeding customers’ expectation through assessing and improving the gaps on all the service quality dimensions which will result in reputation of purchase, positive word of mouth, and customer loyalty that can help the company to stay competitive in the insurance industry and increase its market share, profit and its financial position among the peer groups.

Table of Contents
Certificate of Originality ............................................................................................ i
Acknowledgements .................................................................................................... ii
Definition of Terms.................................................................................................... iii
List of Acronyms ....................................................................................................... iv
List of Tables ............................................................................................................. v
List of Figures ............................................................................................................ vi
List of Annexes .......................................................................................................... vi
Abstract ...................................................................................................................... vii
Table of Contents ....................................................................................................... viii-x
Chapter One: Introduction ......................................................................................... 1
1.1 Background and justification for the Study ......................................................... 1
1.2 Background of Nile Insurance Company ............................................................ 4
1.3 Problem Statement .............................................................................................. 5
1.4 Research Questions ............................................................................................. 7
1.5 Objective of the Study ......................................................................................... 8
1.5.1 General Objective .......................................................................................... 8
1.5.2 Specific Objective .......................................................................................... 8
1.6 Significance of the Study .................................................................................... 8
1.7 Scope (Delimitation) of the Study ....................................................................... 9
1.8 Limitations ........................................................................................................... 9
1.9 Organization of the Project Report ...................................................................... 9
Chapter Two: Literature Review
2.1 Theoretical Review ............................................................................................. 10
2.2 Insurance Industry Services ................................................................................ 12

2.3 The Service-Profit Chain ................................................................................... 13
2.4 Customer Value Management (CVM) ............................................................... 13
2.5 Employee Empowerment ................................................................................... 14
2.6 Customer Handling ............................................................................................. 14
2.7 Customer Satisfaction ......................................................................................... 15
2.8 Customer Service Standards ............................................................................... 18
2.9 Resolving Conflict .............................................................................................. 18
2.10 Total Quality Management (TQM) .................................................................... 19
Chapter Three: Research Design and Methodology
3.1 Introduction .......................................................................................................... 20
3.2 Population and Sampling ..................................................................................... 20
3.3 Research Design and Data Collection.................................................................. 21
3.4 Variable and Measurement .................................................................................. 22
3.5 Methods of Data Analysis .................................................................................... 22
3.6 Ethical Considerations ......................................................................................... 22
Chapter Four: Results and Discussion
4.1 Analysis of Data & Interpretation ........................................................................ 23
4.2 General Information about the Respondents........................................................ 23
4.3 Analysis and Presentation of Respondents’ Responses for Questionnaires ........ 31
4.4 Analysis of Interview Responses ......................................................................... 48
4.5 The Ethiopian Insurance Industry ........................................................................ 51
4.5.1 Functions of the Supervisory Authority with regard to Insurance Business . 52
4.5.2 The General Status/information of the Ethiopian Insurance Industry ........... 52
4.5.3 Nile's Market Share in the Insurance Industry vis-à-vis Competitors
of General Insurance (Non-life) in GWP ....................................................... 53
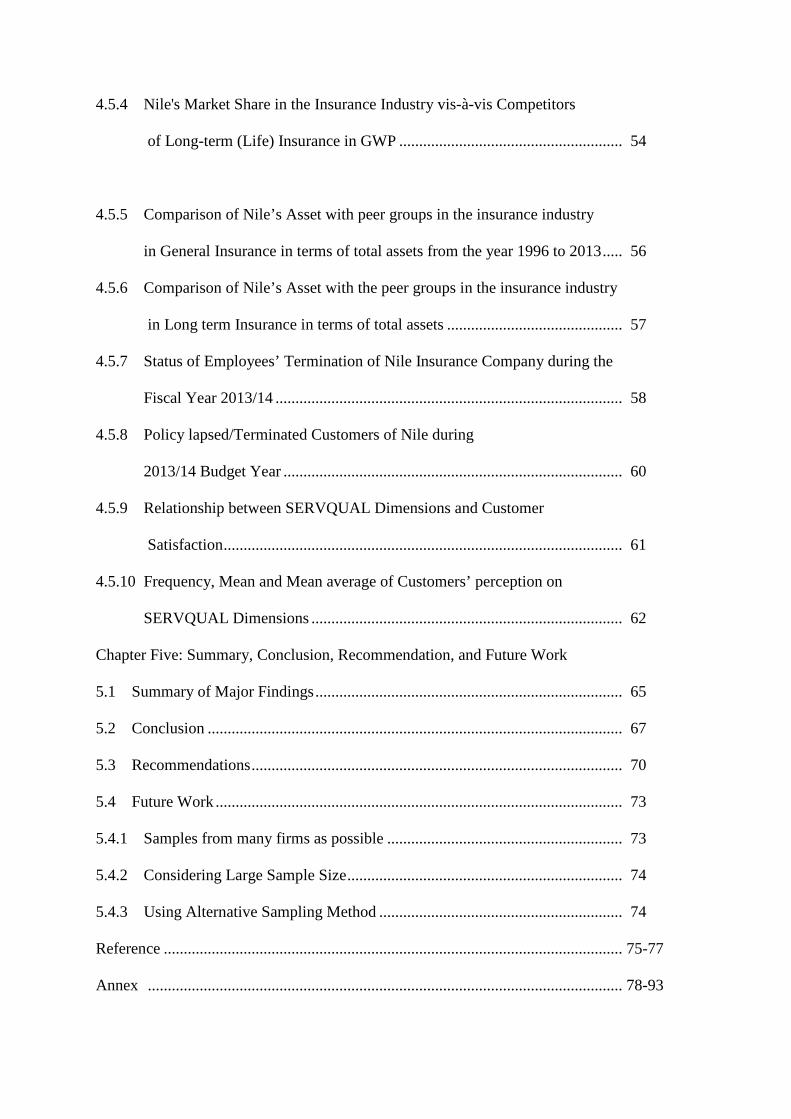
4.5.4 Nile's Market Share in the Insurance Industry vis-à-vis Competitors
of Long-term (Life) Insurance in GWP ........................................................ 54
4.5.5 Comparison of Nile’s Asset with peer groups in the insurance industry
in General Insurance in terms of total assets from the year 1996 to 2013 ..... 56
4.5.6 Comparison of Nile’s Asset with the peer groups in the insurance industry
in Long term Insurance in terms of total assets ............................................ 57
4.5.7 Status of Employees’ Termination of Nile Insurance Company during the
Fiscal Year 2013/14 ....................................................................................... 58
4.5.8 Policy lapsed/Terminated Customers of Nile during
2013/14 Budget Year ..................................................................................... 60
4.5.9 Relationship between SERVQUAL Dimensions and Customer
Satisfaction .................................................................................................... 61
4.5.10 Frequency, Mean and Mean average of Customers’ perception on
SERVQUAL Dimensions .............................................................................. 62
Chapter Five: Summary, Conclusion, Recommendation, and Future Work
5.1 Summary of Major Findings ............................................................................. 65
5.2 Conclusion ........................................................................................................ 67
5.3 Recommendations ............................................................................................. 70
5.4 Future Work ...................................................................................................... 73
5.4.1 Samples from many firms as possible ........................................................... 73
5.4.2 Considering Large Sample Size ..................................................................... 74
5.4.3 Using Alternative Sampling Method ............................................................. 74
Reference ................................................................................................................... 75-77
Annex ....................................................................................................................... 78-93

Chapter one: Introduction
1.1 Background and justification of the Study
The emergence of insurance business in Ethiopia was closely linked to expatriates & foreign
insurance companies operating in Ethiopia participated actively in the establishment of the
first domestic insurance company, i.e. Imperial Insurance Company established in 1951.
The emergence of modern insurance in Ethiopia is traced back to the Bank of Abyssinia
which was established in 1905 as the first Ethiopian bank. The Bank had been acting as an
agent for a foreign insurance company to underwrite fire and marine policies. Insurance
companies provide two types of covers mainly; general insurance (non-life) and long term
insurance (life) covers. General insurance can be categorized into major classes of business
such as: motor, workmen’s compensation, liability, engineering, fire, marine, aviation,
accident and pecuniary. Similarly, long term insurance is categorized into individual group
endowment, medical, term life and accident riders (Hailu, 2007).
The service industry plays an increasingly important role in a country’s economy. In today’s
global competitive environment delivering quality service is considered an essential strategy
for success & survival. Most service giving organizations are under pressure to deliver
quality services to customers & improve efficiencies. In parallel customer needs &
expectations changing when it comes into utility services & the quality of services. It is
known that services unlike tangible products are produced & consumed at the same time in
the presence of customer and service producer (Prabha Ramseook-Munhurrun et al, 2010).
To be successful in business today requires a commitment to excellence in customer service
as customer service is an integral part of doing business. Today’s customer service providers
must have adequate preparation to interact effectively with today’s customers (Harris, 2000).
The average business company loses 10% - 30% of its customers each year because of their
dissatisfaction mainly in ‘service quality gaps’. The overall gap which results in a
dissatisfied-customer is the gap between expectations and experience. The root cause of
dissatisfaction can be traced back to one of the five gaps, namely, promotional,
understanding, procedural, behavioural, and perception. (Nigel Hill & Jim Alexander, 2003)
Insurers face pressures from every direction. Competition is surging. Innovative products and
services are needed to break from the pack, but lack the operational capabilities to support
them. Partners and customers want new communications channels and ‘’24/7’’ convenience,
but integration concerns delay progress. Compliance has become unwieldy in the wake of
rapid regulatory change. Fraud is on the rise, and mitigating risk is more important than ever.
These operational pains are preventing insurers from addressing customer service challenges
that pose significant short- and long-term threats. Poor service experiences, limited
interaction channels and lack of transparency have eroded trust. Industry evidence shows that
when insurance companies understand and act on customer needs, they are more profitable.
Even in a tough economy, service can win out over price. And as social networking
proliferates, the value in strengthening customer relationships will continue to increase.
Insurers have the ability to effectively predict customer behavior and lifetime value while
improving retention and profitability.
In today’s business world, the key to be successful is customer value in the minds of
customers. Companies must create value for customers that attracts and retains existing as
well as potential customers, address the basis of competition, and deliver a profit to a
company through operational excellence in the primary business, personnel, quality, and
information systems etc. that constitute business. (Peter Duchessi, 2002)
Companies face the consequences of declining customer loyalty, deteriorating market share,
decaying profits, & the associated chaos that ensues. It is the very essence of doing business.

To be successful, companies have to provide quality products and services at fair prices/
premiums, creating the impression of value and exciting customers about their products and
services in the process. These imperatives require that a company understand its customers
(perhaps better than they understand themselves) and manage its business as effectively and
efficiently as possible (Peter Duchessi, 2002).
Through high-quality services and effective operations, a company can deliver superior and
sustainable value to customers. And hence a good company that understands this will:
• Have a focus on customers and a clear understanding of their needs and expectations;
• Offer a combination of product and service benefits and fair prices; and
• Aggressively manage the business processes, information technologies, and staff that
are responsible for communicating, creating, and delivering customer value/service
and allowing profitability at the same time (Peter Duchessi, 2002).
Creating and retaining loyal customers through quality services must be a high priority for
companies, because these activities earn high returns. For example, a 5% increase in
customer retention can increase profitability between 25% and 50% (Peter Duchessi, 2002).
Companies can become market leaders by delivering superior customer value in one of three
ways: 1) increase product and service quality, 2) lower/optimum prices, or 3) do both
simultaneously. Customers must feel and perceive that they are receiving significant pro duct
and service quality for the money they spend. Quality service differentiates an offering
sufficiently enough so that it doesn’t become a commodity (avoid commoditization) and
strongly positions a company in a market place. Service is a primary means for building
customer value and earning higher profits as well. (Peter Duchessi, 2002).
Companies that have dedicated base of customers are resistant to commoditization and price
wars, because their customers are less susceptible to the competitions’ entreaties. Thus,
faithful customers represent long-term revenue and profit streams as their spending increases
and accelerate over time. As loyal customers become more familiar with the purchasing
process, companies and their customers save considerable amounts of time and money. Using
IT – enabled approaches to sales, a company can build and cement new relationships and
contracts with customers. By listening to the voice of the customer using electronic
transactions, a company can learn how to more effectively serve its customers. If a company
doesn’t use IT to improve the buying process, it risks being at the mercy of others who do.
The effect of a business process is so broad that companies should optimize their business
processes rather than optimize the performance of their business functions. Customers are
interested more in the business processes with which they interface and the outcomes of those
processes. Thus there is a need for true operational effectiveness. The three critical business
dimensions/performance in which companies will affect customer value are: IT, people, and
business process. (Peter Duchessi, 2002)
In today’s Internet- and mobile-enabled world, customer expectations are being shaped by
daily transactions and interactions with companies across various industries. Insurance
companies must establish their own benchmarks for service delivery against those of leading
experience providers, not their peers.
1.2 Background of Nile Insurance Company
Nile Insurance Company S.C was established on 11th of April 1995 with a subscribed capital
of Birr 12 million. Currently the paid up capital of the Company is raised to Birr 100 million.
It is a legal business entity registered by the licensing and supervising body of the National
Bank of Ethiopia (NBE). It is one of the oldest private insurance Companies entering into the
industry serving more than 19 years with diligent and professional experience committing itself
to excellence. The Company is backed by more than 9 reputable and renowned international
reinsurers located in the different parts of the globe.

The Vision, Mission & Motto of the company is “To be a Front Line Insurer with
Excellence.”, “To provide unmatched value in insurance services and engage in investment
through high profile expertise and state of the art technology” & “Your Security is Our Prime
Concern” respectively. One of the values of the Company is “To strive for the highest
customer responsiveness and measure successes by the level of customer satisfaction.”
It is the pioneer company in launching & implementing modern information technology,
PREMIA, for its operation to enhance & provide quality services by way of automating and
networking. Regarding Human Resources, Nile has a total of 306 employees who are
professionals in insurance sector and other fields.
1.3 Problem Statement
Customer service is such a valuable concept that it seems it would be simple to provide it.
Any how this is not necessarily the case. Customer service providers must begin to
understand the customers that they are serving.
Customer satisfaction in insurance means the use of the policy product purchased for a cost
(premium), to the ultimate satisfaction of the buyer, when a claim is paid. The product bought
by the buyer/policy holder will give him/her the expected fruit i.e., peace of mind during the
product cycle when it is in use by the customer.
The present day customer buys his/her ultimate satisfaction, not the product. The customer is
an active seeker of value evidence (certificate, policy prompt service/full value)
The insurance policy is an intangible promise to pay in time of happening of an event but it
also promises reliability, trust, assurance, competence, empathy, responsiveness, and
tangibility.
Some of the challenges/barriers to excellent customer service are within the control of
customer service providers such as poor communication skills, poor time management, and
attitude, lack of adequate training, inadequate staff, and so forth. Creation of a customer

service culture which consists of the values, beliefs and norms shared by a group of people is
indispensable. A part of the culture that the leadership of an organization can inspire is the
attitude of the employees.
The quality of service computation, market fluctuation and attitude, perception, expectation
of the customer are some of the factors which rise problems of customer handling.
Customers whose complaints are satisfactorily resolved become more company-loyal than
customers who were never dissatisfied. Companies that encourage disappointed customers to
complain and also empower employees to remedy the situation on the spot have been shown
to achieve higher revenues and greater profits than companies that do not have a systematic
approach for addressing service failures. Satisfying employees as well as customers will
promote stronger customer loyalty as there is positive employee attitude in excellent service
companies. (Kotler, 2006: 420)
Companies can provide value-added services or excellent customer service to differentiate
them from others.
Customer expectations of service come from many sources; such as past experiences, word of
mouth, and advertising. If perceived service falls below the expected service, customers are
disappointed. If perceived service meets or exceeds their expectations they are apt to use the
provider again. Successful companies add benefits to their offering that not only satisfy
customers but also surprise and delight them. Delighting customers is a matter of exceeding
their expectations. (Kotler, 2006: 412)
Some of the best service companies create a responsive, customer pleasing system by
empowering their line employees to satisfactorily resolve customer issues. Designing a
system that empowers employees to do what they feel is right in making actions on service to
satisfy customers at the time without management approval, while being held accountable for
their actions.

The key to any successful conflict resolution is ability to hear a customer. I.e. listening to the
customer with full attention of understanding what he/she is really saying taking the required
time.
Besides listening to a complaint, ask the customer what the expectations are for an
‘’acceptable level of service,’’ in order to be in a position to adequately solve the complaint.
Excellent customer service really does play a vital role in the marketing approach of a
company. It is no longer a departmental issue. It is the issue of a company. The company can
View complainers/ customers who complain as potential referral champions for long-term
success. Turning complaints into positive experiences is a sure-fire way of developing loyal
customers who are guaranteed to spread the word of mouth (Karr & Blohowiak, 1998:139)
Therefore, on the basis of the above over all description of customer satisfaction and
challenges and the likelihood remedies mentioned, this research paper will try to analyze in
Nile Insurance mainly the challenges/problems described below:
� The gap between customers’ expectations of a service and their perceptions of the actual
service delivered by the company, in order to see applicability of SERVQUAL approach.
� To identify and analyze service quality dimensions and customer satisfaction
� To analyze whether there is a link between customer satisfaction and profit.
� To clearly identify the challenges of customer handling and the fate/consequence of
dissatisfied customers.
1.4 Research Questions
The study will try to address the following questions
1. What are the major factors that determine service quality in the Ethiopian insurance
industry?
2. What are the effects of customer handling to insurance companies?
3. What are the possible causes for customers’ dissatisfaction?

4. Why particular emphasis is given in adequate underwriting and claim handling process in
insurance customer services?
1.5 Objective of the Study
The objective of this study is classified as general and specific objectives. The general
objective specifies the overall purpose of the study and based on this objective, the specific
questions will be included in order to satisfy the research questions.
1.5.1 General Objective
The general objective of this research is to identify and analyze the effects and prospects of
customer handling in insurance companies operational performance in Ethiopia. (A Case
Study at Nile Insurance Share Company)
1.5.2 Specific Objective
With regards to the general objective, and to satisfy the research questions, the specific
objectives include:
1. To examine views of insurance companies about customer service & handling
2. To express the main challenges of customer handling.
3. To assess the fairness of premium generation and timely service delivery of insurers.
4. To provide the views on the performance of customer handling in Nile Insurance
Company S.C as a case study.
5. To provide possible solutions for improvement of quality/excellence service delivery.
1.6 Significance of the Study
The output of the research will be expected to have the following benefits:
� Serves for insurance companies as inputs to understand the overall impact of customer
handling and better decision making for managers regarding customer service quality.

� It may invite other researchers to further investigate how to improve customer service and
handling in the insurance sector.
� It may serve for policy makers as input for the preparation of Customer Handling Policy.
� To the researcher as means of academic fulfillment for the requirement of MBA degree.
1.7 Scope of the Research
The work of this research is limited to only the case study of impacts and prospects of
customer handling in insurance industry with particular emphasis and reference to Nile
Insurance Company. The population of the research paper is the Addis Ababa branches’
customers. However, they represent similar services given in all other branches of Nile
insurance Company in Ethiopia.
1.8 Limitations
The research paper couldn’t cover the 26 active branches of Nile. Nevertheless the study is
conducted only on 10 branches due to time and budget constraints.
1.9 Organization of the Project Report
The research paper is organized in five sections. In the first section, the overall performance
of insurance industry in general is pointed out. This introductory section contains background
of insurance business in Ethiopia, problem statement, research questions, objectives of the
study, significance of the study, and scope of the research as well as limitations. The second
section of the research paper will deal with literature review on operational performance in
insurance with special emphasis on customer service and handling in the insurance industry.
The third section deals with the research design and methodology. The fourth section will be
on findings and discussion and finally, in the fifth section; summary of findings, conclusion,
recommendation and future work direction will be dealt.

Chapter two: Literature Review
� 2.1 Theoretical Review
Literature Review is an essential part of the research study since it helps researchers to be
familiar with the subject background under study. Others’ ideas, approaches, and
methodologies, etc can be obtained via literature review. So the researcher will use relevant
review of literature materials for the study.
Therefore, a model designed to measure customers’ perceptions of service quality,
SERVQUAL, which was developed in the 1980s by the three American academics,
Parasuraman, Zeithaml and Berry, is used as a methodology to measure consumers’
perception of quality in the insurance service business.
Based on this, the quality dimensions in addition to some other dimensions will be used.
The dimensions are:
Tangibles - the physical facilities, equipment and appearance of personnel.
Reliability – the ability to perform the promised service dependably and accurately
Responsiveness - willingness to help customers and provide prompt service
Assurance – knowledge & courtesy of employees, their ability to inspire trust & confidence.
Empathy – caring, individualized attention that the firm provides its customers.
Parasuraman et al. also used their research as the basis for the service quality gap model.
They defined service quality as a function of the gap between customers’ expectations of a
service and their perceptions of the actual service delivered by an organization.
The overall service quality gap which results in a dissatisfied customer can be formed by one
or more of several specific gaps. The root cause of dissatisfaction can be traced back to one
of the five gaps, namely, promotional, understanding, procedural, behavioural & perception.
Promotional Gap- What is said about the service differs from the standards actually delivered.

Understanding Gap- Managers’ perceptions of customers’ expectations are inaccurate.
Procedural Gap- Customers’ expectations not translated into appropriate operating procedure.
Behavioural Gap- The service delivered is different from the specification for the service.
Perception Gap- The level of service perceived by customers differs from the service actually
provided. (Nigel Hill & Jim Alexander, 2003)
Consumer sovereignty presents a formidable challenge, but skillful marketing can affect both
motivation and behavior if the product or service offered is designed to meet consumer needs
and expectations. (James et al, 1995)
For the organization to succeed the management must carefully balance the two desires and
objectives, i.e., profit making and customer satisfaction. This can be achieved by the careful
management of the elements of all required marketing mix, such as product, price, etc. must
complement each other in order to bring to market the best possible package, that means, the
right product at the right price, advertised in the right way and available through the right
channels in order to make optimum profit and ensuring customer satisfaction. (Charley
Watkins, 2006)
The cost of finding new customers increases as markets become more competitive,
particularly in maturing markets where there are a limited number of new customers to sell to
and the organizations find themselves increasingly competing to attract the same customers.
In the financial services industry, providers find a benefit to be gained from ensuring that
they keep the customers they already have. It is far easier and less costly to keep the existing
customers than to keep attracting new customers from their competitors. This can be done so
by building long term profitable relationships with their customers and hence the move from
transactional selling to ‘relationship marketing’-meaning the art of creating and maintaining
over time a strong and value-driven relationship with customers. (Charley Watkins, 2006)
Profit impact of customer retention: If the business can retain 80% of its customers each year,
the business will reduce the cost associated with customer dissatisfaction and exit and will
not have to spend as much on marketing efforts to attract new customers. Retained customers
produce higher annual revenue and margin per customer than do lost or new customers, the
total profits of the business should increase. (Best, 2006: 14)
2.2 Insurance Industry Services
Insurers can either prosper by becoming more relevant, or continue along the same path and
see business slowly deteriorates as customers migrate to companies with more innovative
solutions and business models that better suit their needs.
By focusing on three major innovation strategies— i.e. 1) identify profitable target
customers; 2) develop new products and services for these target groups; and 3) create media-
rich experiences to serve customers—insurers can increase profitability by 15–20 % within
five years, according to estimates from the Cisco® Internet Business Solutions Group
(IBSG). Consumers expect better service than they are receiving from their insurers today. To
meet customers’ needs, insurers should create a collaboration architecture that offers anytime,
anywhere access through any device they wish to use.
The interaction between the customer and service provider is referred to as the service
encounter or the moment of truth in popular management jargon. The provider and the
customer create value together. An improvement in customer perceived quality will increase
customer satisfaction, loyalty, and profitability. I.e. Good internal Quality → Satisfied
employees→ Employees stay→ good external Quality→ Satisfied customers→ Customers
stay→ High profitability (Gummesson, 2000)

2.3 The Service-Profit Chain
Successful service companies focus their attention on both their customers and employees.
They understand the service-profit chain, which links service firm profits with employee and
customer satisfaction. This chain consists of five links according to Philip and Gary (2004):
Internal service quality: Superior employee selection and training, a quality work
environment, and strong support for those dealing with customers.
Satisfied & productive service employees: Become more satisfied, loyal & hard working.
Greater service value: More effective & efficient customer value creation & service
delivery.
Satisfied and loyal customer: Satisfied customers, who remain loyal, do repeat purchase,
and refer other customers.
Healthy service profits and growth: Super service firm performance.
2.4 Customer Value Management (CVM)
It can help a business enterprise create and sustain differentiating value. I.e. it is a vehicle to
understand what the customers/clients want of the company and how to go about aligning the
business to deliver that product/service consistently. CVM has become a leading approach to
attract market share and customer loyalty by making the customers’ view an integral part of
the business design. It is the means by which companies can balance the demand for service,
even create that demand, with an infrastructure that is customer-centered, delivers increased
productivity, and benefits the company’s bottom line. CVM provides the basis to become
customer centered and attain growth by enabling an organization to be “Number 1 in the eyes
of its customers.’’

2.5 Employee Empowerment:
Providing superior customer value is the criterion that determines the nature of employee
involvement - in form of work teams, job enrichment, quality circles, task forces, and labour
management action teams. I.e. provide - training, suggestion scheme, measurement and
recognition, and excellence teams. Workers suggestions: workers are often a source of
continuous improvements. They can provide suggestions on how to improve a process and
eliminate waste/unnecessary work. Employees should be managed for positive results. They
develop a company’s plans and execute them and serve customers. As result employees are
an especially critical asset. Therefore a company must empower & motivate them to embrace
the skills and attitudes necessary to satisfy and exceed customers’ needs and expectations
(Kumar, 2008). Some of the best service companies create a responsive, customer pleasing
system by empowering their line employees to satisfactorily resolve customer issues.
Designing a system that empowers employees to do what they feel is right in making actions
on service to satisfy customers at the time without management approval, while being held
accountable for their actions (Karr & Blohowiak, 1998).
Staffs need to be able to access information which is a key resource that will allow them to
deliver a better standard of customer care.
Management needs to allow staff the necessary time which is a precious resource to deal with
the customer as an individual. Customers can become very angry if they feel that a member
of staff has not got the time to deal with them properly. (Cartwright, 2000)
2.6 Customer Handling
Proper complaint handling can be a marketing asset having the following bottom-line
benefits: maintenance of market share, low-cost market research data base, lower warranty
and service costs, improved employee productivity, and decreased government involvement
in corporate affairs. (Loudon &Della Bitta, 1993)

Complaints and Recovery: No organization can avoid complaints. Complaints often escalate
from minor problems into disasters because of a lack of perception from the organization as
to the apparent seriousness of the situation as viewed by the customer. The three basic
reasons why customers complain are: 1) Lower than expected quality, 2) Lower than
expected service, and 3) Higher than expected price. Complaints can, if properly handled,
turn a disaster into a triumph and should be handled to achieve a win-win situation and a
delighted customer. Organizations may be able to enhance the relationship with customers by
effectively dealing with a complaint with a complaint procedure need to be simple enough for
those with a genuine complaint to be able to make their grievance known. When customers
cease to be customers, it is better that they leave saying positive things about the organization
than telling their friends and relatives about poor recovery.
Customer /Service recovery is a crucial issue in managing the relationship between customers
and the organization if things go wrong & ‘lifetime value of a customer’ approach is taken. It
is an important element of the company’s service delivery that ensures the customer who is
dissatisfied or irritated is returned to a state of satisfaction as soon as possible. It helps the
company to recognize the problems and improve the service it offers for all existing and
new/potential customers. It is not only just about fixing things that have gone wrong but
should also focus on the critical service encounters that customers are saying are important to
them, and help the company to develop a long-term customer service strategy (Cartwright,
2000). The three key ingredients for designing a service strategy are: 1. Desired outcomes, 2.
Customer expectations, and 3. Process capability (Lake & Hickey, 2006)
2.7 Customer Satisfaction
Markets in which consumers don’t have much power tend to have low customer satisfaction.
For companies in industries where customers don’t have a great deal of choice, where good

information is harder to come by, and where the costs associated with rejecting one brand for
another are high, customer satisfaction typically suffers.(Fornell, 2007)
Customer satisfaction is an excellent market-based performance metric and barometer of
future revenue and profits. It is a forward-looking indicator of business success that measures
how well customers will respond to the company in the future. Thus it is a good leading
indicator of operating performance. Dissatisfied customers often don’t complain, but they do
walk and talk. Studies show that out of 100 dissatisfied customers, only 4% will complain to
a business. Of the 96 dissatisfied customers who don’t complain, 91 will exit as customers.
Many dissatisfied customers become “customer terrorists”; by telling others about their
dissatisfaction. (Best, 2006)
In today’s environment, customers have become kings and queens they have taken on new
importance as the focal point of business, as seen on the banner of corporate stockholder
reports and mission and vision statements. (Thompson, 2003)
The concept of customer value must be made operational to realize the benefits of a customer
value strategy. One way to make the concept operational is to devise methods to measure
value and use the information to make the better strategic and operational decisions.
Figure 2.1 Determination of customers delivered value:
Source: P. Kotler, 1999
Product value
Service value Total customer value
Personnel value
Image value
Monetary cost Time cost
Total customer cost Energy cost
Psychic cost
Customer Delivered Value
Monetary cost

According to Kotler & Armstrong (1996) the customer satisfaction is the level of a person
felt state resulting from comparing a product’s perceived performance or outcome in
violation to his/her own expectations. So, customer satisfaction could be considered a
comparative behavior between inputs beforehand and post obtainments. Customer
satisfaction of insurance services can also be measured by timely service delivery and
reliability, claims handling and customer handling.
Figure 2.2 Measuring Customer Satisfaction:
Source: Niguel Hill & Jim Alexander, 2003
Service Quality: It is used to signify excellence of a service top quality. I.e. it is to meet the
customer requirements. Quality refers to conformance for specification. It is the customer,
not the company, who decides whether quality is right and fitness for proposed business.
(Oakland, 2003) The major reason companies want relationships with customers is to
identify, acquire, satisfy, and retain profitable customers. The relationship is based on a
foundation of trust and commitment. The primary motivation for companies trying to develop
long-term relationships with customers is the profit motive.
Figure 2.3 Relationship with customers:
Understand customer’s Behavioural loyalty Revenue growth
requirements Attitude loyalty share of customers Meet customer’s expectation Customer possession Deliver customer value Source: Buttle F., 2009
Reliability
Assurance
Tangibles
Empathy
Responsiveness
Service expectations
Service performance
Perceived service quality
Customer Satisfaction
Customer satisfaction
Customer loyalty
Business performance
2.8 Customer Service Standards:
Conducting a service gap analysis: Asking internal and external customers to rate the
current level of service quality of the organization against a list of criteria such as: timeliness,
accuracy, flexibility, responsiveness, technical knowledge. The gap between the service that
is currently provided and that which customers need against each of the criteria is the
opportunity to improve service.
Setting standards for processes: E.g. issuing new policy documents within three working
days of having all necessary information; settling a claim within one working day of having
agreed a settlement amount.
Setting quality standards: For example: only 0.1% of documents issued to customers should
have to be sent back due to error.
Setting internal service standards: For instance: if claims need policy information this
should be provided within 24 hours. (Prichard and Jordan, 1999)
2.9 Resolving Conflict:
There must be a win-win tactic or resolution mindset with customers. I.e. focus on both sets
of needs, concerns, and feelings. Respect each other’s view. See the issue as a mutual
problem to be solved. Prepared to listen and compromise as effective listening improves
relationships between people. Not interested in winning at any cost. Opt for power with rather
than power over. The win-win approach creates partners not opponents.
Key skills for collaboration which prevent the escalation of the conflict and allow one to steer
the energy along a path that will increase understanding, trust, and co-operation are: 1. Listen
acceptably – find out what others see through their window on the world. 2. Talk
constructively – share what you see through your window on the world, and 3. Problem
solving – marry the views for mutual wins. (McConnon, 2002)

2.10 Total Quality Management (TQM)
The total quality management (TQM) philosophy is customer-oriented. TQM incorporates
the concepts of product quality, process control, quality assurance, and quality improvement.
Pushing problem-solving and decision making down in the organization allows people who
do the work to measure and take corrective action in order to deliver a product/service that
meets the needs of the customer. The major principle of TQM is to satisfy the customer.
Customers want to get their money’s worth from a product or service they purchase. TQM is
considered a means to introduce participative management. Some of the key principles of
TQM are management commitment, i.e. PDCA [plan (drive, direct), do (deploy, support,
and participate), check (review), act (recognize, communicate, and revise).] (Kumar, 2008).
Chapter Three: Research Design and Methodology
3.1 Introduction
This chapter presents the methodology that has been used for the research. It described the
research purpose, research approach, research strategy, sample selection, and data collection.
It also discussed data analysis and challenges and prospects of customer handling of the
research. In general this chapter provides the methodological frame work to collect data from
various sources, sampling, data collection instruments and approach to data analysis for
achieving the set objectives. Finally, ethical consideration maintaining during data collection
stage was provided.
In this research work, qualitative and quantitative analysis have been performed such as
analysis of research document, review of related literature in brief, questionnaire, and
interview conducted to know the impacts/challenges of customer handling as well as future
prospects. Nile Insurance Company S.C, as a case study, would be the focus area to obtain
major available information for this research paper with regard to customer handling and
retention, and those who terminate their policy and switch to other insurance companies.
Open and close ended questions have also been used to have full-fledged views of customer
handling in the company.
3.2 Population and Sampling
During the study Nile Insurance Company has 26 branches and one contact/liaison office to
handle the operational activities.
The target population of this study consists of customers of Nile Insurance Company in Addis
Ababa branches only, to make the study manageable because of cost and time constraints,
with appropriate sampling method.
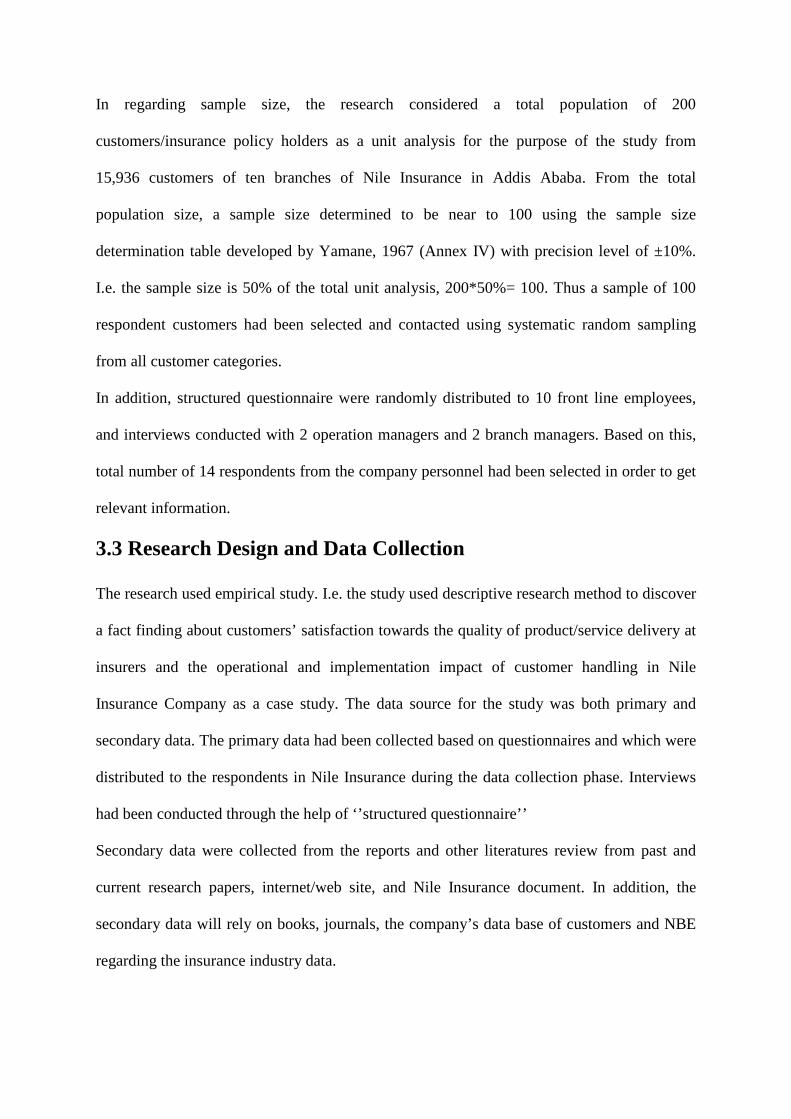
In regarding sample size, the research considered a total population of 200
customers/insurance policy holders as a unit analysis for the purpose of the study from
15,936 customers of ten branches of Nile Insurance in Addis Ababa. From the total
population size, a sample size determined to be near to 100 using the sample size
determination table developed by Yamane, 1967 (Annex IV) with precision level of ±10%.
I.e. the sample size is 50% of the total unit analysis, 200*50%= 100. Thus a sample of 100
respondent customers had been selected and contacted using systematic random sampling
from all customer categories.
In addition, structured questionnaire were randomly distributed to 10 front line employees,
and interviews conducted with 2 operation managers and 2 branch managers. Based on this,
total number of 14 respondents from the company personnel had been selected in order to get
relevant information.
3.3 Research Design and Data Collection
The research used empirical study. I.e. the study used descriptive research method to discover
a fact finding about customers’ satisfaction towards the quality of product/service delivery at
insurers and the operational and implementation impact of customer handling in Nile
Insurance Company as a case study. The data source for the study was both primary and
secondary data. The primary data had been collected based on questionnaires and which were
distributed to the respondents in Nile Insurance during the data collection phase. Interviews
had been conducted through the help of ‘’structured questionnaire’’
Secondary data were collected from the reports and other literatures review from past and
current research papers, internet/web site, and Nile Insurance document. In addition, the
secondary data will rely on books, journals, the company’s data base of customers and NBE
regarding the insurance industry data.
3.4 Variable and Measurement
To assess the impacts of customer handling as a case study at Nile Insurance with regard to
excellent customer service and satisfaction measurement, SERVQUAL Model was used
which has five dimensions on a five point Likert Scale with the inclusion of three additional
dimensions of being 1 highly dissatisfied to 5 highly satisfied continuum, using
questionnaire.
3.5 Methods of Data Analysis
The researcher used SERVQUAL model and various tables, figures, and percentages for both
primary and secondary data analysis in the discussion part of the paper. After data analysis
and interpretation, findings are summarized. Based on the major findings, conclusion has
been drawn and lastly, possible recommendation forwarded in order to better satisfy the
expectations of customers.
3.6 Ethical Considerations
In both questionnaires and interviews conducted, the respondents were given a chance not to
write their names and other identifications to make them feel free and properly respond in
answering the questionnaire and the interview conducted. Questionnaires which are prepared
for ‘customers’ in English language have been equally translated in to Amharic language to
make it more comfortable keeping their interest. Respondents were assured of that their
overall responses kept in confidentiality.

Chapter 4: Results and Discussion
4.1 Data Analysis and Interpretation
The data was collected from customers, employees, and management of Nile Insurance
Company S.C in Addis Ababa. Practically facts about service quality and its effect on
customer satisfaction and handling has been analyzed and interpreted.
4.2 General Information about the Respondents
Sample size of 100 customers was determined, collected and investigated. Besides, 4
managers were interviewed with the structured interview questions and 10 front-line
employees responded with the structured questionnaire in total 14 were contacted. Out of the
100 questionnaires distributed to the customers 94 (94%) were filled and collected back, and
of the company staffs’ questionnaires and interviews all 14 (100%) were fully responded.
Table 4.1 Selected Service Sites/Branches
S.N Name of Branch Questionnaires
% Returned Distributed Returned
1. Kirkos 10 10 100% 2. Tewodros 10 9 90% 3. Addisketema 10 9 90% 4. Beklobet 10 10 100% 5. Gerji 10 9 90% 6. Kality 10 9 90% 7. Bole 10 9 90% 8. Life 10 10 100% 9. Abakoran 10 10 100% 10. Megenagna 10 9 90%
Total 100 94 94% Source: Own Analysis, 2014
A total of 100 questionnaires were distributed to ten of Nile Insurance Company branches,
out of which 94 were returned while six questionnaires were returned unfilled from six
branches, one each. Full responses i.e. 10 from Kirkos, Beklobet, Life, and Abakoran, 9

responses from Tewodros, Addisketema, Gerji, Kality, Bole and Megenagna were obtained
from the 94 Company Customers.
Therefore, with regard to customers, 94 questionnaires served as data sources for analysis to
present the findings and draw conclusions and recommendations.
Table 4.2: Front-line employees’ responses to questionnaires with regard to their biography
& over all activities of the company with emphasis to customers:
S.N Item No of
Respondent %age Approximate
1. Sex: Male Female
6 4
60% 40%
Total 10 100% 2. Age (Year):
18-30 31-45 46-60 Above 60
3 6 1 0
30% 60% 10%
0 Total 10 100% 3. Education Level:
High school Complete Diploma Degree Master
0 0 9 1
0 0
90% 10%
Total 10 100% 4. Work Unit:
Underwriting Claims Engineering Other
9 1 0 0
90% 10%
0 0
Total 10 100% 5. How long have you been serving in the
insurance company? Less than 1 year 1-3 years 3-5 years Above 5 years
2 1 0 7
20% 10%
0 70%
Total 10 100%

Table 4.2: Front-line employees’ responses to questionnaires with regard to their biography & over all activities of the company with emphasis to customers (cont’d):
S.N Item No of
Respondent %age Approximate
6. Are you happy with your job? Yes No If no, what are the possible reasons?
7 3
70% 30%
*Refer below #6 Total 10 100% 7. How is your interaction/communication with
customers? Very good Good Neutral Poor Very poor
7 3 0 0 0
70% 30%
0 0 0
Total 10 100% 8. Have you ever taken any training in relation
to customer service delivery/complaint handling? Yes No If the answer for the Qn. is No, what do you suggest is the reason?
7 3
70% 30%
*Refer below #8
Total 10 100% 9. How do you rate your capacity/knowledge
regarding the standard of your service delivery? Very good Good Neutral Poor Very poor
5 4 1 0 0
50% 40% 10%
0 0
Total 10 100% 10. Does the Company give a chance to
employees to participate in decision making with regard to service delivery? Yes No If the answer for the Qn. is “No’, what do you think the reason?
8 2
80% 20%
*Refer below #10 Total 10 100% 11. Do you have any suggestion or comment to
make with regard to excellent service provision?
*Refer below #11
Source: Questionnaire Analysis, 2014

As indicated above in item S.N 1 of Table 4.2, sex-wise grouping of front-line employees is
overwhelmed by males who covered 60% of the total 10 respondents. Females accounted for
only 40%. This figure shows that females are less represented as compared to males in the
sample.
In item S.N 2 of Table 4.2, 60% of the respondents of company staffs lied within the age
groups of 31- 45 years, 30% within the age groups of 18-30 years, and 10% within the age
groups of 46-60 years. There was none within the age group above 60. Hence more than 90%
of the company staffs are found between the age group of 18-45 years which is active
member of the society.
In item S.N 3 of Table 4.2, with regard to educational qualification, 90% of the personnel
respondents have got First degree. 10% got Master’s degree, and none with Diploma and/or
High School. Therefore it is possible to suggest that almost all personnel have good academic
back ground to serve the company’s customers promptly.
As shown above in Item No 4 of Table 4.2, with regard to assignment of work, 90% of the
respondents were assigned in Underwriting and all the remaining 14.29% were in Claims.
With regard to length of service year in the insurance company, in Item No 5 of Table 4.2,
70% of the respondents have served the company above 5 years. The rest 20% & 10% of
respondents have served the company for less than 1 year & 1-3 years respectively. This
indicates that the larger portion of internal customers (employees) registered relatively long
time existence with the forthcoming of few new employees in recruitment.
In consideration of employees’ happiness with their job, Item No 6 of table 4.2, 70% of the
respondents agreed that they are happy; the remaining 30% responded that they are not
happy. The possible suggested reasons for unhappiness were: work load, routine nature of the
work, no promotional growth, and salary is not satisfactory and needs a long journey to reach
the top or middle level management to get optimum salary and benefit package.
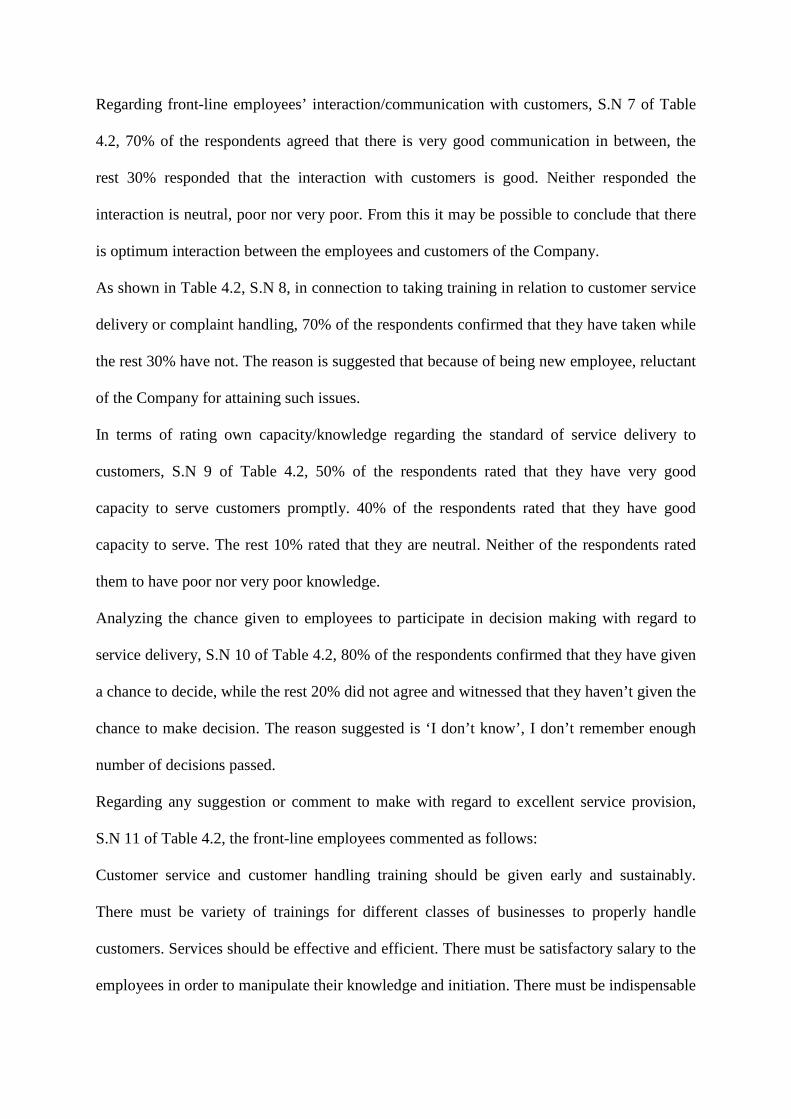
Regarding front-line employees’ interaction/communication with customers, S.N 7 of Table
4.2, 70% of the respondents agreed that there is very good communication in between, the
rest 30% responded that the interaction with customers is good. Neither responded the
interaction is neutral, poor nor very poor. From this it may be possible to conclude that there
is optimum interaction between the employees and customers of the Company.
As shown in Table 4.2, S.N 8, in connection to taking training in relation to customer service
delivery or complaint handling, 70% of the respondents confirmed that they have taken while
the rest 30% have not. The reason is suggested that because of being new employee, reluctant
of the Company for attaining such issues.
In terms of rating own capacity/knowledge regarding the standard of service delivery to
customers, S.N 9 of Table 4.2, 50% of the respondents rated that they have very good
capacity to serve customers promptly. 40% of the respondents rated that they have good
capacity to serve. The rest 10% rated that they are neutral. Neither of the respondents rated
them to have poor nor very poor knowledge.
Analyzing the chance given to employees to participate in decision making with regard to
service delivery, S.N 10 of Table 4.2, 80% of the respondents confirmed that they have given
a chance to decide, while the rest 20% did not agree and witnessed that they haven’t given the
chance to make decision. The reason suggested is ‘I don’t know’, I don’t remember enough
number of decisions passed.
Regarding any suggestion or comment to make with regard to excellent service provision,
S.N 11 of Table 4.2, the front-line employees commented as follows:
Customer service and customer handling training should be given early and sustainably.
There must be variety of trainings for different classes of businesses to properly handle
customers. Services should be effective and efficient. There must be satisfactory salary to the
employees in order to manipulate their knowledge and initiation. There must be indispensable

flexibility for win-win dealing and mutual benefit. Avail appropriate number of employees
who possess the required skill and knowledge to serve customers with utmost efficiency.
Table 4.3 Nile Insurance Company Customers’ (the sample) Biography
S.N Item No of
Respondent Percentage
Approximate 1. Gender:
Male Female
64 30
68.09% 31.91%
Total 94 100% 2. Age:
18-30 31-45 46-60 Above 60
29 48 17 0
30.85% 51.06% 18.09% 00.00%
Total 94 100% 3. Occupation:
Doing own business Private organization employed Government employee NGO’s employee Others
41 37 5 8 3
43.62% 39.36% 5.32% 8.51% 3.19%
Total 94 100% 4. How long are you a customer of the Company?
More than 10 years 6-10 years 1-5 years Less than 1 year
20 21 45 8
21.28% 22.34% 47.87% 8.51%
Total 94 100% 5. What type of insurance cover do you have in the
company/branch? (Select more than one, if there is any) Motor Marine Fire and lightening Life insurance Others
68 32 16 17 6
72.34% 34.04% 17.02% 18.09% 6.38%
Total 94 100% 6. How frequent do you come to the Branch /Company
to get service in a month? 1 time 1-3 times 4-6 times 7-10 times More than 10 times
46 27 12 6 3
48.94% 28.72% 12.77% 6.38% 3.19%
Total 94 100% Source: Questionnaire Analysis, 2014

The above Table 4.3, S.N 1 reveals the biographic information of the respondents. As can be
seen the biographic variable, gender division of the respondents, the majority of the
respondents were males, i.e. 68.09% (64) representing the greater part of the sample group,
while 31.91 % (30) of the respondents (which is near half of males) were females.
As indicated in item 2 of Table 4.3, age-wise distribution of the respondents of the company
branches is overwhelmed within the age group of 31- 45 which covered 51.09% of the total
94 respondents. Within the age group of 18- 30 respondents covered 30.85%, and all the rest
within the age group of 46- 60 lied 18.09%. Within the age group above 60 years is none.
Therefore it can be said that more than 81.94% of customers are active members of the
society within age group of 18-45. This will help the company extend long existing
relationship with these customers by providing proper service delivery.
In item 3 of Table 4.3 above, with regard to occupation of the sample respondents, 43.62%
of them were doing their own business, 39.36% of them were private organization employed,
and 8.51% of them were NGO employed. The rest 8.51% in total were government employed
and other works. This has shown that more of the company customers are self-employed and
doing own businesses which is a good potential for the company to give further insurance
cover to the extended insurable activities.
In item 4 of table 4.3, regarding duration (time) of existence of customers in the company,
47.87% of the respondents existed within the range of 1- 5 years, 22.34% of the respondents
existed within the range of 6- 10 years. 21.28% of the respondents existed above 10 years of
age and the rest 8.51% of the respondents existed less of 1 year age. Based on the data
analysis, more of the company customers (56.38%) are new entrants existed with the range of
0-5 years. 43.62% of the customers have existed six and above years of age in the company.
Therefore as there is a tendency of outgoing long existed customers the company should
revisit and examine its way of handling customers to have better retention power.

As indicated in table 4.3 item 5, with regard to the type of insurance coverage in the
Company/Branch, 72.34% (68) of the respondents have motor insurance cover, which is the
greatest of all. 34.04 % (32) of them have marine insurance. 18.09% (17) and 17.02% (16) of
them have life and fire & lightening insurance cover respectively. The rest 6.38% (6) of them
have other type of insurance cover. As it is shown, the dominant class of business for
insurance cover is motor (vehicles) and is also a source of problematic area for complaint as
described by the respondents of Operational & Branch Managers during the interview
session. Therefore the company should properly handle every class of business to be insured
with a particular attention and emphasis for motor insurance.
As displayed in Table 4.3, item 6 above, with regard to the frequency of visits respondents
make to the Branch /Company to get service per month: majority of the respondents i.e.
48.94% (46) of them come to the Branch /Company to get service once per month. 28.72%
(27) of the respondents visit 1- 3 times. 12.77% (12), 6.38% (6), and 3.19% (3) of the
respondents come to get the service 4-6 times, 7-10 times, and more than 10 times
respectively. The company must take care for customers not to waste their time, money,
energy and peace of mind by coming now and then to the branch without their own purpose
and will. There should be immediate service delivery as required by customers.

4.3 Analysis and presentation of Respondents’ Responses for Questionnaires
Table 4.4: Customers’ responses with regard to the Tangibility of the Company
S.N Item No of
respondent Percentage
Approximate 1. The physical facilities of the service provider such as logo,
agenda, building, office furniture, etc will be appealing
1. Very Dissatisfied 4 4.26% 2. Dissatisfied 4 4.26% 3. Neutral 9 9.57% 4. Satisfied 46 48.94% 5. Very Satisfied 31 32.98% Total 94 100% 2. The availability of modern technology and equipment such as
PREMIA, computer soft ware’s, etc
1. Very Dissatisfied 5 5.32% 2. Dissatisfied 5 5.32% 3. Neutral 8 8.51% 4. Satisfied 33 35.11% 5. Very Satisfied 43 45.74% Total 94 100% 3. Neatness of employees and well-dressing, their approaches 1. Very Dissatisfied 2 2.13% 2. Dissatisfied 4 4.26% 3. Neutral 4 4.26% 4. Satisfied 36 38.30% 5. Very Satisfied 48 51.06% Total 94 100% 4. The nature of working environment, availability of parking,
security checkup, etc
1. Very Dissatisfied 7 7.45% 2. Dissatisfied 10 10.64% 3. Neutral 21 22.34% 4. Satisfied 34 36.17% 5. Very Satisfied 22 23.40% Total 94 100% Source: Questionnaire Analysis, 2014
As depicted in item 1of the table 4.4 above, 48.94% (46) and 32.98% (31) of the respondents
satisfied and strongly satisfied respectively with the attractiveness of the company’s physical

facilities to furnish service. 9.57% (9), 4.26% (4), and 4.26% (4) of the respondents were
neutral (i.e. neither satisfied nor dissatisfied), dissatisfied and very dissatisfied respectively.
That means 81.92% (77) of the respondents were under the category of satisfaction where as
18.08% (17) of them were under neutral and dissatisfaction. Therefore, Nile should further
improve the pleasing of physical facilities in all branches as 18.08% of dissatisfaction level is
not insignificant quantity.
As displayed in item 2 of the table 4.4, 45.74% and 35.11% of the respondents were very
satisfied and satisfied respectively with regard to the availability of modern technological
equipment in the company. 8.51% of the respondents were neutral; where as in lump sum
10.64% of the respondents were found dissatisfied and very dissatisfied. Similarly to be more
competitive and have an advantage, the Company should provide more advanced technology
and equipment such as upgrading of PREMIA software and the like to substantially minimize
the level of neutrality & dissatisfaction which is in total 19.15%.
As observed in item 3 of table 4.4 above, 51.06% and 38.30% of the respondents were very
satisfied and satisfied in respective order with the neatness of employees and their well
dressing at the time of service delivery. I.e., there is about 90% of satisfaction of respondents
with regard to approaches and neatness of employees. The company should keep it up with
further reduction of neutrality and dissatisfaction of respondents which is about 10%.
As shown in item 4 of the table 4.4, with regard to the nature of working environment,
availability of parking, security checkup, etc 36.17% and 23.40% of the respondents were
satisfied and very satisfied while 22.34%, 10.64%, and 7.45% were found neutral,
dissatisfied, and very dissatisfied respectively. Here there is totally about 40% of neutrality
and dissatisfaction. Hence the company should fulfill the required parking for vehicles,
security checkup and good working environment such as well furnished office.

Table 4.5: Customers’ responses with regard to the Reliability of the Company
S.N Item No of
respondent Percentage
Approximate 5. The service provider respects its promises to fulfill customer
requirements
6. Very Dissatisfied 3 3.19% 7. Dissatisfied 3 3.19% 8. Neutral 12 12.77% 9. Satisfied 37 39.36% 10. Very Satisfied 39 41.49% Total 94 100% 6. The service provider performs service delivery in time 1. Very Dissatisfied 3 3.19% 2. Dissatisfied 5 5.32% 3. Neutral 12 12.77% 4. Satisfied 35 37.23% 5. Very Satisfied 39 41.49% Total 94 100% 7. At time of the customer is in problem, the service provider
shows due interest in solving it
1. Very Dissatisfied 3 3.19% 2. Dissatisfied 5 5.32% 3. Neutral 12 12.77% 4. Satisfied 38 40.43% 5. Very Satisfied 36 38.30% Total 94 100% 8. Service giver keeps the up-to-date records related to
customer’s policy accurately
1. Very Dissatisfied 3 3.19% 2. Dissatisfied 3 3.19% 3. Neutral 11 11.70% 4. Satisfied 33 35.11% 5. Very Satisfied 44 46.81% Total 94 100% 9. The service provider is dependably serves customer 1. Very Dissatisfied 3 3.19% 2. Dissatisfied 2 2.13% 3. Neutral 7 7.45% 4. Satisfied 27 28.72% 5. Very Satisfied 55 58.51% Total 94 100%
Source: Questionnaire Analysis, 2014
As can be seen from Table 4.5 above, with regard to Reliability service of the Company,
respondents rated in the following way:
In item no 5, with regard to respecting promises to fulfill customer requirements, 80.85% of
the respondents were very satisfied & satisfied. The other 12.77% and 6.38% of the
respondents were neutral and dissatisfied/very dissatisfied respectively. Hence the company
should dwell regarding promise keeping in fulfilling customers’ needs and minimizing the
level of dissatisfaction and if possible avoid neutrality.
In item no 6, regarding in-time service delivery, in general 78.72% of the respondents, the
majority, were very satisfied and satisfied, 12.77% of them were neutral while the rest 5.32%
and 3.19% of the respondents were dissatisfied and very dissatisfied respectively. Here also
as much as possible all customers should be equitably served in time. The total of
dissatisfaction and neutrality is 21.28% which is significant in quantity. Therefore the
company should give due attention in this issue in order to have all delighted customers
through proper time service delivery.
In item no 7, with regard to showing due interest in solving the problem at time the customer
is in problem, 78.73% of the respondents agreed that they are satisfied & very satisfied,
12.77% are neutral and the remaining 8.51% are dissatisfied & very dissatisfied. Similarly the
company should focus on fair treatment of customers through its employees with great
interest to help at time of problem. Because, 12.77% neutrality and 8.51% dissatisfaction is
not insignificant in number, and there may be a probability that those dissatisfied and neutral
customers will switch to other nearby competing companies and is difficult to trace back
them again.
In item no 8, in consideration of keeping the up-to-date and accurate records related to
customer’s policy, 81.92% of the respondents agreed that they are very satisfied and satisfied,
11.70% were neutral and the rest 6.38% of them were dissatisfied and very dissatisfied. Here
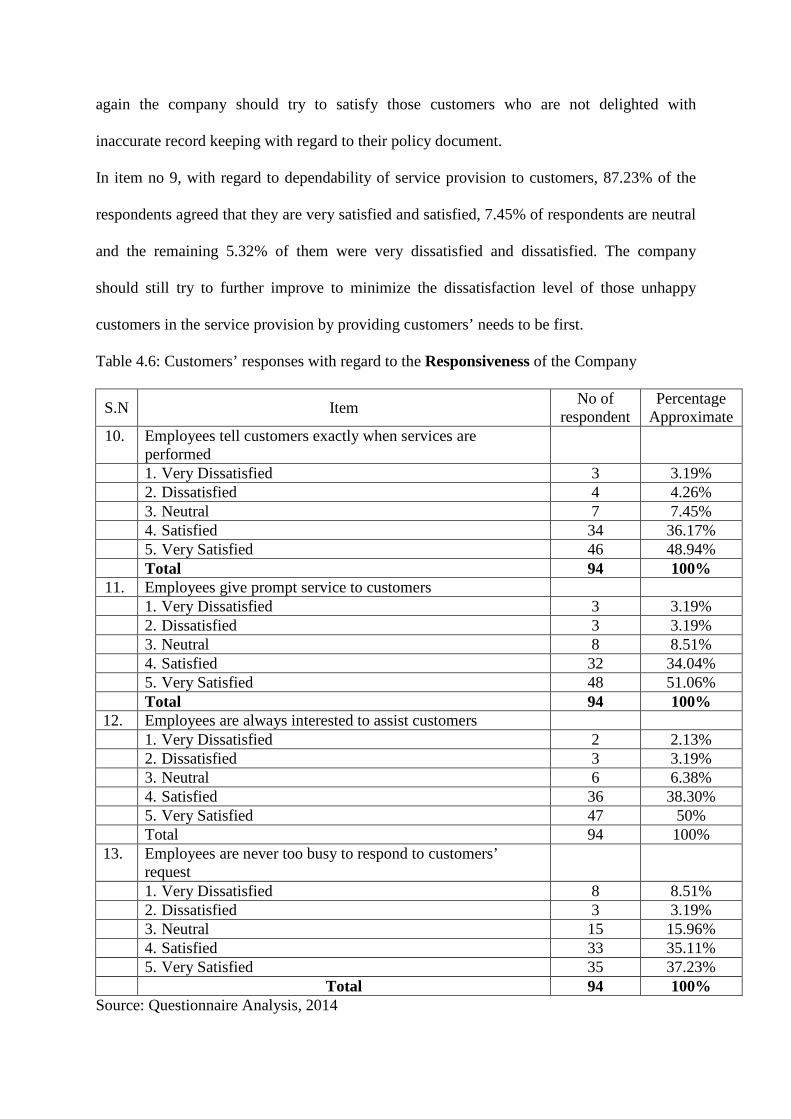
again the company should try to satisfy those customers who are not delighted with
inaccurate record keeping with regard to their policy document.
In item no 9, with regard to dependability of service provision to customers, 87.23% of the
respondents agreed that they are very satisfied and satisfied, 7.45% of respondents are neutral
and the remaining 5.32% of them were very dissatisfied and dissatisfied. The company
should still try to further improve to minimize the dissatisfaction level of those unhappy
customers in the service provision by providing customers’ needs to be first.
Table 4.6: Customers’ responses with regard to the Responsiveness of the Company
S.N Item No of
respondent Percentage
Approximate 10. Employees tell customers exactly when services are
performed
1. Very Dissatisfied 3 3.19% 2. Dissatisfied 4 4.26% 3. Neutral 7 7.45% 4. Satisfied 34 36.17% 5. Very Satisfied 46 48.94% Total 94 100% 11. Employees give prompt service to customers 1. Very Dissatisfied 3 3.19% 2. Dissatisfied 3 3.19% 3. Neutral 8 8.51% 4. Satisfied 32 34.04% 5. Very Satisfied 48 51.06% Total 94 100% 12. Employees are always interested to assist customers 1. Very Dissatisfied 2 2.13% 2. Dissatisfied 3 3.19% 3. Neutral 6 6.38% 4. Satisfied 36 38.30% 5. Very Satisfied 47 50% Total 94 100% 13. Employees are never too busy to respond to customers’
request
1. Very Dissatisfied 8 8.51% 2. Dissatisfied 3 3.19% 3. Neutral 15 15.96% 4. Satisfied 33 35.11% 5. Very Satisfied 35 37.23% Total 94 100%
Source: Questionnaire Analysis, 2014

As shown from Table 4.6 above, with regard to employees’ Responsiveness to service
delivery of the Company, respondents rated as follows:
In item no 10, with regard to whether employees tell customers exactly when services are
performed, most of the respondents, i.e. 85.11%, were very satisfied and satisfied, 7.45%
were neutral, and the rest 7.45% were dissatisfied and very dissatisfied.
In item no 11, considering prompt service delivery to customers, 85.10% of the responding
customers were very satisfied and satisfied, and the rest 14.90% of the respondents were in
the level of neutrality and dissatisfaction.
In item no 12, with regard to employees’ at all times interest to assist customers, 88.30% of
the respondents were very satisfied and satisfied. 11.70% of the respondents were in the
category of neutrality and dissatisfaction.
In item no 13, regarding Employees are never too busy to respond to customers’ request,
72.34% of the respondents were very satisfied and satisfied, the rest in total 27.66% of the
respondents were under the category of neutrality and dissatisfaction.
The above table shows that regarding Responsiveness in terms of employees’ tell customers
when service is performed, prompt service delivery, interest to assist customers, and never be
too busy to respond to customers’ request more positive results have been achieved. On
average more than 83% of the respondents are found at the level of satisfaction on these
services rendered to them. About 17% of the respondents are of course found at the level of
neutrality and dissatisfaction and this also needs more attention to improve and please those
dissatisfied ones. Besides, the company is on the process to install its own system/policy
namely- Customer Service and Complaint Handling Policy to evaluate customer service
activities and ultimate satisfaction of customers.
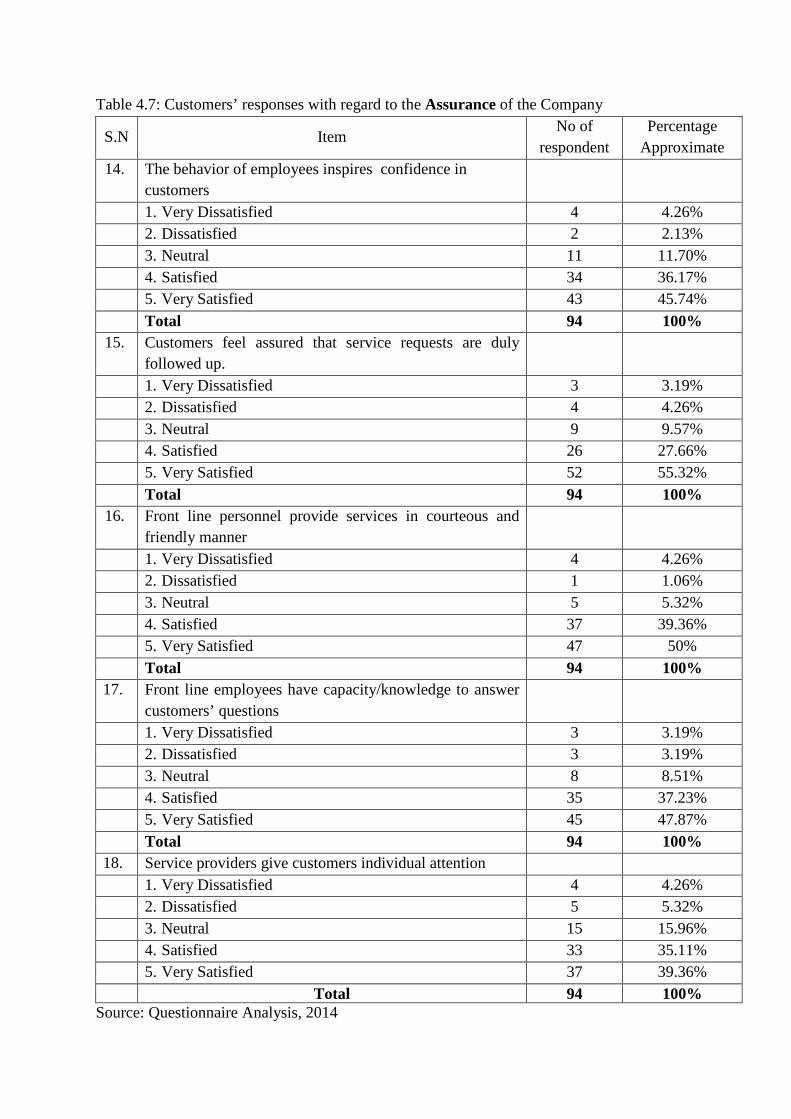
Table 4.7: Customers’ responses with regard to the Assurance of the Company
S.N Item No of
respondent Percentage
Approximate 14. The behavior of employees inspires confidence in
customers
1. Very Dissatisfied 4 4.26% 2. Dissatisfied 2 2.13% 3. Neutral 11 11.70% 4. Satisfied 34 36.17% 5. Very Satisfied 43 45.74% Total 94 100% 15. Customers feel assured that service requests are duly
followed up.
1. Very Dissatisfied 3 3.19% 2. Dissatisfied 4 4.26% 3. Neutral 9 9.57% 4. Satisfied 26 27.66% 5. Very Satisfied 52 55.32% Total 94 100% 16. Front line personnel provide services in courteous and
friendly manner
1. Very Dissatisfied 4 4.26% 2. Dissatisfied 1 1.06% 3. Neutral 5 5.32% 4. Satisfied 37 39.36% 5. Very Satisfied 47 50% Total 94 100% 17. Front line employees have capacity/knowledge to answer
customers’ questions
1. Very Dissatisfied 3 3.19% 2. Dissatisfied 3 3.19% 3. Neutral 8 8.51% 4. Satisfied 35 37.23% 5. Very Satisfied 45 47.87% Total 94 100% 18. Service providers give customers individual attention 1. Very Dissatisfied 4 4.26% 2. Dissatisfied 5 5.32% 3. Neutral 15 15.96% 4. Satisfied 33 35.11% 5. Very Satisfied 37 39.36% Total 94 100%
Source: Questionnaire Analysis, 2014

As depicted from above Table 4.7, considering Customers’ Responses with regard to the
Assurance of the Company, respondents rated as follows:
In item no 14, regarding the Behavior of employees which inspires confidence in customers,
81.91% of respondents were very satisfied and satisfied. 11.70% of them were neutral; where
as 6.39% of the respondents were at the level of very dissatisfaction and dissatisfaction.
In item no 15, with Customers’ feeling of assurance that service requests are duly followed
up, 82.98% of the respondents were found at a level of higher satisfaction and only 7.45% of
them found at a level of dissatisfaction while 9.57% of the respondents were neutral.
In item no 16, with regard to Front line personnel’s service provision to customers in
courteous and friendly manner, 89.36% of the respondents were found at the level of greater
satisfaction and only 5.32% of them found at a level of greater dissatisfaction. The rest 5.32%
were neutral.
In item no 17, in consideration of Front line employees’ capacity/knowledge to answer
customers’ questions, 85.1% of the respondents were found at the level of better satisfaction,
8.51% were at a level of neutral and the rest 6.38% of the respondents were at the level of
dissatisfaction.
In item no 18, in giving Customers individual attention in the provision of service, 74.47% of
the respondents agreed that the company gives individual attention to its customers. 15.96%
of them were neutral, and the rest 9.58% of the respondents were in general dissatisfied,
arguing that the company doesn’t give individual attention to the customers.
As it is depicted in the Table 4.7 above, Customers’ responses with regard to the Assurance is
good and positive. On the average the level of satisfaction of customers with regard to
assurance is nearer to 83% & the dissatisfaction and neutrality level together account 17%.
Hence the company should make an effort to improve further in service follow up,
knowledge/capacity of employees, and giving individual attention to dissatisfied customers.

Table 4.8: Customers’ responses with regard to the Empathy of the Company
S.N Item No of
respondent Percentage
Approximate 19. Service providers have operating hours convenient to all
their customers
1. Very Dissatisfied 3 3.19% 2. Dissatisfied 1 1.06% 3. Neutral 7 7.45% 4. Satisfied 41 43.62% 5. Very Satisfied 42 44.68% Total 94 100% 20. Employees providing quality services give personal
attention to customers
1. Very Dissatisfied 2 2.13% 2. Dissatisfied 4 4.26% 3. Neutral 12 12.77% 4. Satisfied 27 28.72% 5. Very Satisfied 49 52.12% Total 94 100% 21. Service provider gives attention for customer’s best interest,
heartily
1. Very Dissatisfied 3 3.19% 2. Dissatisfied 4 4.26% 3. Neutral 8 8.51% 4. Satisfied 32 34.04% 5. Very Satisfied 47 50% Total 94 100% 22. Service provider understands the specific needs of its
customers
1. Very Dissatisfied 2 2.13% 2. Dissatisfied 4 4.26% 3. Neutral 10 10.64% 4. Satisfied 39 41.49% 5. Very Satisfied 39 41.49% Total 94 100%
Source: Questionnaire Analysis, 2014
Customers were asked to evaluate the Empathy dimension of the service quality. As it can be
seen in table 4.8 above:

With regard to convenience of operating hours to customers (S.N 19), 88.3% of the
responding customers was comfortable, while 4.25% of the respondents were not. The rest
7.45% was neither comfortable nor discomfort able.
As far as giving personal attention to customers, by employees, with provision of quality
service (S.N 20) concerned, 80.84% of the respondents were found at a satisfactory level,
where as 6.39% of them in a level of dissatisfaction. The rest 12.77% were not either satisfied
or dissatisfied.
In the analysis of giving attention for customer’s best interest, heartily, by the Company (S.N
21), 84.04% of the respondents were very happy and satisfied, but 7.45% of the respondents
were not happy rather were dissatisfied. The remaining 8.51% respondents were neutral.
In considering the Company’s understanding of the specific needs of its customers (S.N 22),
82.98% of respondents were well satisfied, 6.39% of the respondents were much dissatisfied.
The rest 10.64% of the respondents were neither satisfied nor dissatisfied.
As per the analysis, the response of customers regarding Empathy in general is positive, and
the level of satisfaction on average is above 84% and the neutrality and dissatisfaction is
about 16%. Nevertheless, the company should make an endeavour to improve more in the
area of providing quality services, specific needs, and giving attention for customers best
interest in order to retain and make delight those neither satisfied nor dissatisfied and
dissatisfied customers.

Table 4.9: Customers’ responses with regard to the Underwriting service of the Company
S.N Item No of
respondent Percentage
Approximate 23. Employees be committed to give clarification on
insurance policy benefits, rights and duties of concerned parties
1. Very Dissatisfied 3 3.19% 2. Dissatisfied 4 4.26% 3. Neutral 10 10.64% 4. Satisfied 30 31.91% 5. Very Satisfied 47 50% Total 94 100% 24. Employees providing underwriting service have the
necessary technical and professional skill/competence
1. Very Dissatisfied 2 2.13% 2. Dissatisfied 4 4.26% 3. Neutral 7 7.45% 4. Satisfied 36 38.30% 5. Very Satisfied 45 47.87% Total 94 100% 25. Service providers simplify insurance documents; such as
policies, proposals, endorsements, claims procedures, etc. to suite customers
1. Very Dissatisfied 4 4.26% 2. Dissatisfied 7 7.45% 3. Neutral 10 10.64% 4. Satisfied 29 30.85% 5. Very Satisfied 44 46.81% Total 94 100% 26. Service providers build constant use of professionals;
like agents, surveyors, lawyers, etc to advice customers on insurance matters
1. Very Dissatisfied 5 5.32% 2. Dissatisfied 8 8.51% 3. Neutral 16 17.02% 4. Satisfied 32 34.04% 5. Very Satisfied 33 35.11% Total 94 100% 27. Service providers prepare documents in the widely
understood languages to customers
1. Very Dissatisfied 5 5.32% 2. Dissatisfied 12 12.77% 3. Neutral 17 18.09% 4. Satisfied 31 32.98% 5. Very Satisfied 29 30.85% Total 94 100%
Source: Questionnaire Analysis, 2014
As shown above in Table 4.9, Customers were asked to evaluate UNDERWRITING
SERVICE of the Company, and rated as follows:
Considering Commitment of employees to give clarification on insurance policy benefits,
rights and duties of concerned parties (S.N 23), 81.91% of respondents were at a level of
better satisfaction, where as 7.45% of the respondents were at a level of dissatisfaction. The
remaining 10.64% of respondents was neutral in choice.
With regard to the possession of necessary technical and professional skill/competence of
employees providing underwriting service (S.N 24), 86.17% of the respondents were (very)
satisfied, while 6.39% of the respondents were found (very) dissatisfied. The rest 7.45% were
neither satisfied nor dissatisfied.
In analyzing to what extent service providers/employees simplify insurance documents; such
as policies, proposals, endorsements, claims procedures, etc. to suite customers (S.N 25),
77.66% of respondents were found at optimum satisfaction level, where as 11.71% of them
was found much dissatisfied. 10.64% of the respondents were neutral.
In terms of making constant use of professionals, such as agents, surveyors, etc to advice
customers (S.N 26), 69.15% of the respondents were satisfied, 13.83% was dissatisfied and
the rest 17.02% was neutral.
In consideration of Documents preparation in the widely understood languages to customers
(S.N 27), 63.83% of the respondents are comfortable with the existing language, 18.09% of
them were not comfortable, and the rest 18.09% of the respondents was neutral.
As per the analysis, the response of customers with regard to Underwriting Service is positive
in general, i.e. the level of satisfaction on average is above 75% and both the neutrality and
dissatisfaction is above 24%. Anyhow, the company should make a great effort, as the
number of neutral and dissatisfied customers is too many, to improve much more in the areas
of preparing documents in the widely understood languages to customers, clarification on

insurance policies, constant use of professionals; as agents, surveyors, etc to advice
customers on insurance matters, in simplifying insurance documents to suite customers, and
providing necessary technical and professional skill to employees.
Table 4.10: Customers’ responses with regard to the Claims service of the Company
S.N Item No of
respondent Percentage
Approximate 28. Employees provide adequate guide and service to customers
in case of claims
1. Very Dissatisfied 3 3.19% 2. Dissatisfied 6 6.38% 3. Neutral 14 14.89% 4. Satisfied 32 34.04% 5. Very Satisfied 39 41.49% Total 94 100% 29. Service providers are accessible to customers in time of
claims via telephone, in person, in writing, etc.
1. Very Dissatisfied 4 4.26% 2. Dissatisfied 2 2.13% 3. Neutral 12 12.77% 4. Satisfied 39 41.49% 5. Very Satisfied 37 39.36% Total 94 100% 30. Employees providing claims service have adequate
empowerment to solve customer’s problem.
1. Very Dissatisfied 3 3.19% 2. Dissatisfied 3 3.19% 3. Neutral 13 13.83 4. Satisfied 42 44.68% 5. Very Satisfied 33 35.11% Total 94 100% 31. Employees assigned in claims service are free of integrity/
ethical problems
1. Very Dissatisfied 4 4.26% 2. Dissatisfied 2 2.13% 3. Neutral 7 7.45% 4. Satisfied 32 34.04% 5. Very Satisfied 49 52.12% Total 94 100%
Source: Questionnaire Analysis, 2014
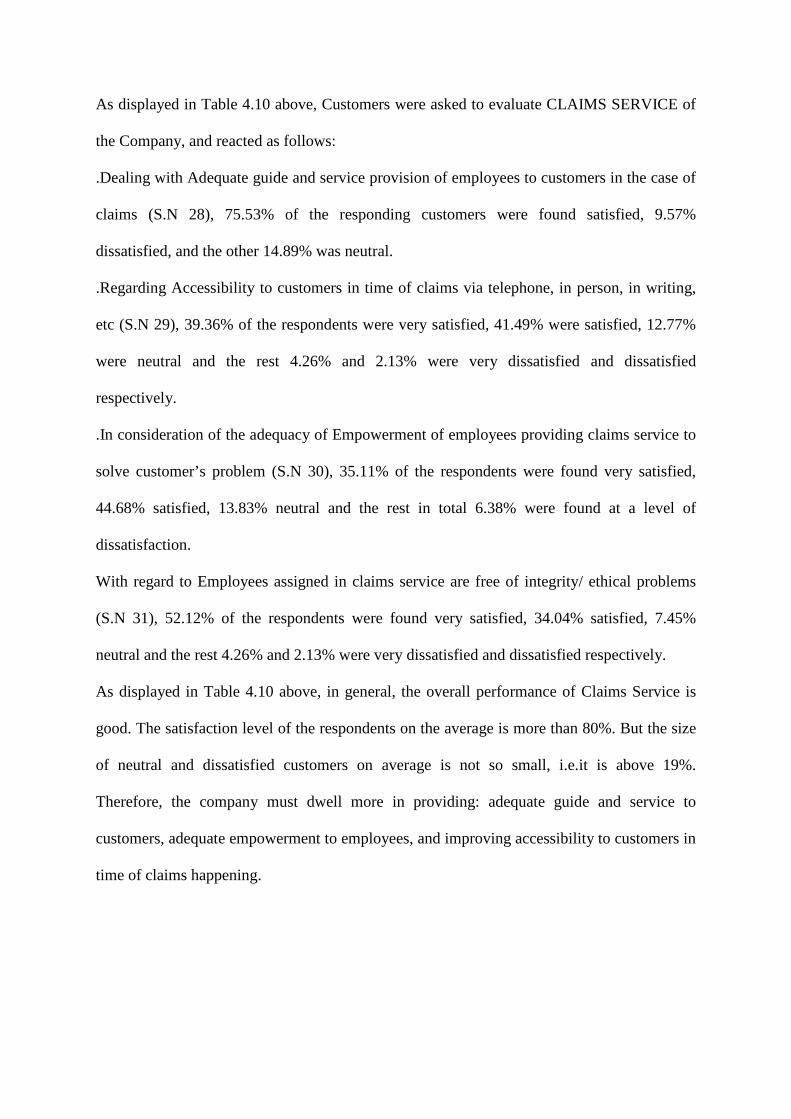
As displayed in Table 4.10 above, Customers were asked to evaluate CLAIMS SERVICE of
the Company, and reacted as follows:
.Dealing with Adequate guide and service provision of employees to customers in the case of
claims (S.N 28), 75.53% of the responding customers were found satisfied, 9.57%
dissatisfied, and the other 14.89% was neutral.
.Regarding Accessibility to customers in time of claims via telephone, in person, in writing,
etc (S.N 29), 39.36% of the respondents were very satisfied, 41.49% were satisfied, 12.77%
were neutral and the rest 4.26% and 2.13% were very dissatisfied and dissatisfied
respectively.
.In consideration of the adequacy of Empowerment of employees providing claims service to
solve customer’s problem (S.N 30), 35.11% of the respondents were found very satisfied,
44.68% satisfied, 13.83% neutral and the rest in total 6.38% were found at a level of
dissatisfaction.
With regard to Employees assigned in claims service are free of integrity/ ethical problems
(S.N 31), 52.12% of the respondents were found very satisfied, 34.04% satisfied, 7.45%
neutral and the rest 4.26% and 2.13% were very dissatisfied and dissatisfied respectively.
As displayed in Table 4.10 above, in general, the overall performance of Claims Service is
good. The satisfaction level of the respondents on the average is more than 80%. But the size
of neutral and dissatisfied customers on average is not so small, i.e.it is above 19%.
Therefore, the company must dwell more in providing: adequate guide and service to
customers, adequate empowerment to employees, and improving accessibility to customers in
time of claims happening.

Table 4.11: Customers’ responses with regard to the Complaint handling of the Company
S.N Item No of
respondent Percentage
Approximate 32. Service providers installed complaint handling procedures in
place to the customers.
1. Very Dissatisfied 5 5.32% 2. Dissatisfied 8 8.51% 3. Neutral 18 19.15% 4. Satisfied 28 29.79% 5. Very Satisfied 35 37.23% Total 94 100% 33. Complaints handling procedure/system of service provider is
time effective.
1. Very Dissatisfied 2 2.13% 2. Dissatisfied 7 7.45% 3. Neutral 15 15.96% 4. Satisfied 37 39.36% 5. Very Satisfied 33 35.11% Total 94 100% 34. Complaint handling procedure at service provider is simple
and straight forward.
1. Very Dissatisfied 4 4.26% 2. Dissatisfied 6 6.38% 3. Neutral 10 10.64% 4. Satisfied 35 37.23% 5. Very Satisfied 39 41.49% Total 94 100%
Source: Questionnaire Analysis, 2014
As displayed above in Table 4.11, customers were asked to evaluate the complaint handling
of the company, and responded as follows:
In consideration of installing complaint handling procedures in place to the customers (S.N
32), 37.23% of the respondents were found very satisfied, 29.79% satisfied, 19.15% neutral
and the rest 8.51% and 5.32% were dissatisfied and very dissatisfied respectively.
In analyzing time effectiveness of complaints handling procedure/system of service provider
(S.N 33), 35.11% of the respondents was found very satisfied, 39.36% satisfied, 15.96%
neutral & the rest 7.45% and 2.13% were dissatisfied & very dissatisfied respectively.
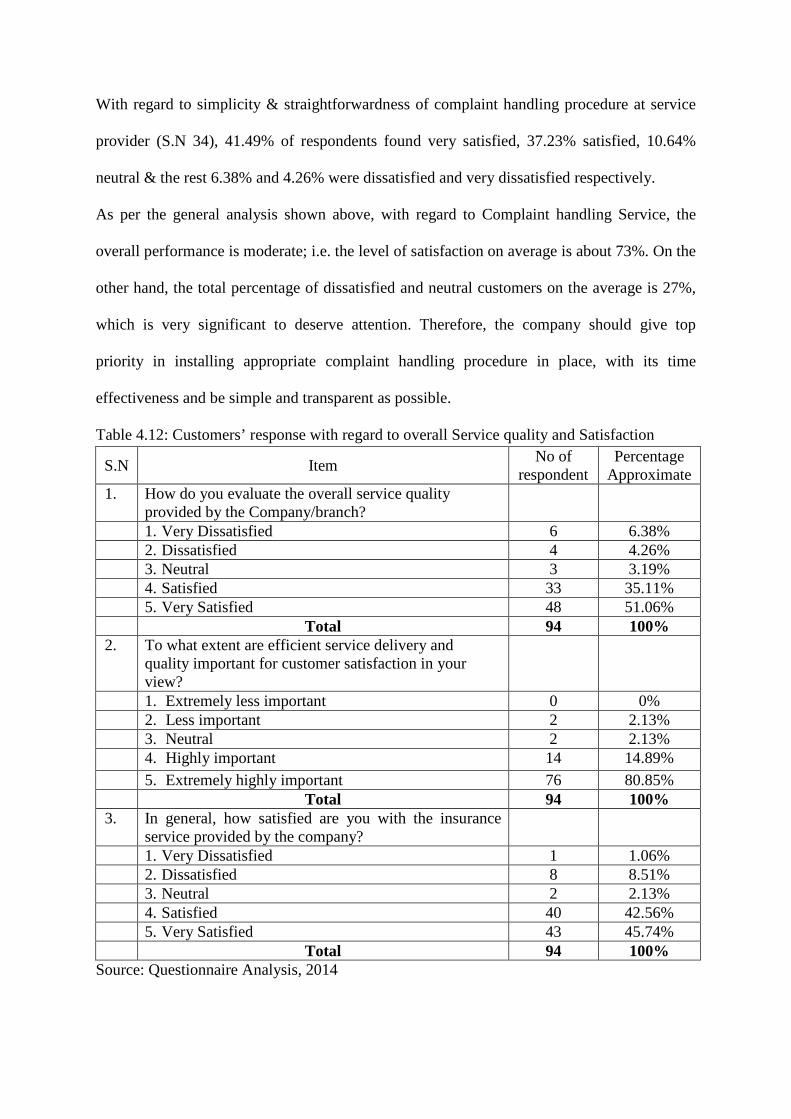
With regard to simplicity & straightforwardness of complaint handling procedure at service
provider (S.N 34), 41.49% of respondents found very satisfied, 37.23% satisfied, 10.64%
neutral & the rest 6.38% and 4.26% were dissatisfied and very dissatisfied respectively.
As per the general analysis shown above, with regard to Complaint handling Service, the
overall performance is moderate; i.e. the level of satisfaction on average is about 73%. On the
other hand, the total percentage of dissatisfied and neutral customers on the average is 27%,
which is very significant to deserve attention. Therefore, the company should give top
priority in installing appropriate complaint handling procedure in place, with its time
effectiveness and be simple and transparent as possible.
Table 4.12: Customers’ response with regard to overall Service quality and Satisfaction
S.N Item No of
respondent Percentage
Approximate 1. How do you evaluate the overall service quality
provided by the Company/branch?
1. Very Dissatisfied 6 6.38% 2. Dissatisfied 4 4.26% 3. Neutral 3 3.19% 4. Satisfied 33 35.11% 5. Very Satisfied 48 51.06% Total 94 100% 2. To what extent are efficient service delivery and
quality important for customer satisfaction in your view?
1. Extremely less important 0 0% 2. Less important 2 2.13% 3. Neutral 2 2.13% 4. Highly important 14 14.89% 5. Extremely highly important 76 80.85% Total 94 100% 3. In general, how satisfied are you with the insurance
service provided by the company?
1. Very Dissatisfied 1 1.06% 2. Dissatisfied 8 8.51% 3. Neutral 2 2.13% 4. Satisfied 40 42.56% 5. Very Satisfied 43 45.74% Total 94 100%
Source: Questionnaire Analysis, 2014

As depicted from above Table 4.12, Customers were asked to evaluate the overall Service
Quality and Satisfaction of the Company and responded as follows:
Regarding evaluation of the overall service quality provided by the Company/branch (S.N 1),
51.06% of the respondents were found very satisfied, 35.11% satisfied, 3.19% neutral and the
rest 4.26% and 6.38% were dissatisfied and very dissatisfied respectively.
Analyzing the view of customers to the extent of importance of efficient service delivery and
quality for customer satisfaction (S.N 2), 80.85% of respondents agreed that it is extremely
highly important, 14.89% agreed it is highly important, 2.13% were neutral & 2.13% and
none agreed it is less important and extremely less important respectively.
In views of satisfaction level with the insurance service provided by the company (S.N 3),
45.74% of the respondents were found very satisfied, 42.56% satisfied, and 2.13% neutral.
The rest 8.51% and 1.06% were dissatisfied and very dissatisfied respectively.
As described above, regarding the overall service quality, importance of efficient service and
satisfaction on average is rated about 90% which is positive. However, the total percentage of
neutral and dissatisfied customers is 10% which needs due consideration to improve.
Even if the result based on SERVQUAL and other dimensions is satisfied, on the total
average, about 12% of the customers are at neutral position and this indicates that there is
high probability to shift to other insurance companies. Therefore the company may lose its
potential customers.
As depicted below in the pie chart (fig. 2.4), from all dimensions of service quality (the five
SERVQUAL and other three additional dimensions), the company is assumed to exercise
empathy widely (16%) and complaint handling least (9%). This implies that, Nile Insurance
Company’s Management and Share Holders through their appointed BOD should further
work on those dimensions registering low rate such as: complaint handling, underwriting
service, tangibles, etc in order to enhance and build the competitive strength of the company.

Figure 2.4 Nile’s SERVQUAL Dimension Chart; Own Analysis, 2014
4.4 Analysis of Interview Responses
The responses from the interviewees of Nile Insurance Company’s Operational & Branch
Managers are presented below. This interview represents the summary of the result in which
the majority has agreed.
Qn. 1. What is customer for you and how is your interaction?
Ans. Customer means anybody who comes to the Company/Branch for service.
Customer (client) is the backbone of the company as it is the very means of income, and
hence, the interaction/ relationship with customer is based on intimacy, trustworthiness, &
utmost good faith.
Qn. 2. In which areas of the “insurance products” is complaint more visible?
Ans. Motor Class of Business is the most visible and dominant part in terms of customers’
complaint. Subsequently to motor is work men compensation due to the consequential effect
of motor accident.
Assurance
Empathy
Complaint Handling
Underwriting Service
Reliability
Tangibles
Claims service
Responsiveness

This is because more of the clients purchase motor insurance and hence correspondingly
claims will also be abundant. In addition to this, a number of parties (stake holders) involved
in the claims handling process such as garage, spare part companies, police organizations,
and so on which will take substantial amount of time and energy in order to fulfill the
relevant documents. Therefore, the interests of the parties involved in the policy and other
third parties will make handling claims of motor class of business somewhat more
problematic. For instance ‘loss of use’ of the customer (policy holder) who is exposed to a
particular risk because of a certain accident of the insured object will make the complaint
more due to a decline in the financial position of the policy holder.
Qn. 3. How do you handle customer complaint in your work unit in the company?
Ans. Through fair treatment customers are tried to be properly handled. Especially
aggrieved/dissatisfied customers are given due consideration as the negative word of mouth
will have a devastating impact on the Company. A genuine discussion is conducted with the
complainant on the issue and way of convincing is reached in between based on the policy
document. If the complaint is not resolved, with all the efforts made, it will be referred in
step-wise to the next hierarchical body for better remedy.
Qn. 4. What is the effort of your unit to improve the service quality of the company?
Ans. Through giving due respect and proper attention to customers, initiate or encourage
customers to have a say and listen to them carefully, to recruit competent and skillful
manpower to settle claims and respond to any query on time, to have re-insurance backup for
the settlement of heavy losses of customers’ property, clarification of terms, and conditions,
etc in the policy and add value for their satisfaction, try to win them through service
excellence and make them good advocators and have belongingness to the company. Through
developing existing manpower with required training to fill the gap and provide required
empowerment.

Qn. 5. Has it been established proper way of receiving customers’ suggestion/complaints? If
no how would you entertain it?
Ans. No, it has not been established yet. It is on the process. I.e. Customer Service &
Complaint Management Policy is being prepared and will be realized in the very near future.
Therefore, currently customers’ suggestions and/or complaints will be handled step by step as
the case may be by front-line personnel, supervisor, manager and executive office.
Qn. 6. Do you think that the service delivered to customers is satisfactory and customers are
happy? How do you measure it?
Ans. Yes, to some extent but not all in all are they satisfied. This is because customers have
unsatisfied greed and expect more. Besides, there are internal and external factors which
make the service delivery to be delayed. Such as internally- work load, the issue raised will
be beyond capacity and referred to next authority level, etc and externally- understanding
policy issues in times of claims, and subsequent involvement of third party, government and
other bodies for evidence purposes, etc will make customers dissatisfied.
Satisfaction or dissatisfaction of customers is measured through face to face conversation
with customers and their tone of voice, feedback and word of mouth.
Qn. 7. Are there enough resources to meet customers’ satisfaction? If not specify the lack of
resources with a possible remedy.
Ans. Yes, of course. But the existing manpower needs further required skill training in their
profession to be more effective, efficient and competitive vis-à-vis with other peer
companies’ work force. There is also shortage of man power in some work units,
service/working vehicles and utility problems as electric power interruption and tele network
problems. As a remedy, the company should purchase additional working vehicles, employ
required personnel, & provide generators and Evideo to minimize power interruption and
network problems respectively.

Qn. 8. Do you have any other comment / suggestion regarding customer service delivery?
Ans. It is better for the company to properly and adequately start e-mail service, install call
center, door to door service, adopt on time service delivery and keeping its promise, make
customers have clear understanding of policy and its ingredients such as excess recovery,
exceptions, fraudulent acts etc. Give due consideration for the internal workforce
(employees) and motivate them, provide commensurate empowerment. Avoid unnecessary
interference with in various work units from up/top to down the bottom.
4.5 The Ethiopian Insurance Industry
The major challenges/problems of the Ethiopian Insurance Industry in customer handling are:
unfair/unhealthy competition on premium rate cutting(under-pricing), higher premium rates
that the public or household can’t afford and increasing claims cost, lack of new insurance
product/service development, lack of required information exchange system among insurance
companies, unfair competition between state-owned and private insurance companies, lack of
public awareness of insurance, life insurance products, insurance policies & their advantages.
The main factors that determine service quality for customer satisfaction in the industry
/insurance companies are: ability to perform promised services in time, capability of
delivering the service with accuracy and adequacy, knowledge of the product/service,
employees’ courtesy towards customers, willingness to help /provide prompt services and
appearance of facilities, personnel, communication skill/materials, etc. If there is a gap in the
perception of these mentioned service qualities between employees and customers, customer
dissatisfaction is inevitable to occur. This will have an effect on quality of service/image of
insurance companies and their employees and in finality affects the ultimate business
prospects i.e. profitability.
4.5.1 Functions of the Supervisory Authority with regard to Insurance Business
According to the proclamation No. 86/1994, the principal function of the supervisory
authority (National Bank of Ethiopia) with regard to insurance business in the country is to
formulate policy:
a) To promote the business of insurance in Ethiopia
b) In respect of reinsurance and of investment of insurance funds; and
c) On such other matters as may be conducive to the attainment of sound insurance
business in Ethiopia.
4.5.2 The General Status/information of the Ethiopian Insurance Industry
The first & dominant actor in the insurance industry sector is the state-owned Ethiopian
Insurance Company (EIC) established in the year 1975. The total number of its branches
reached 60. As it is observed in the table below (Table 4.13), NICE, Awash & Africa were
established in 1994 where as, Nyala & Nile in 1995. Currently the total number of branches
for NICE, Awash, Africa, Nyala & Nile reached 22, 33, 19, 21 & 32 respectively. Global &
UNIC insurances were founded in the year 1977 and currently their branches reached 12 &
29 respectively. Nib Insurance Company was founded in 2002 and has 24 branches. The rest
insurance companies: Lion, Ethio-life, Oromia & Abay were established in the year 2007,
2008, 2009 & 2010 respectively. Their branches in respective order are: 21, 6, 24 & 15.
Berhan & Bunna founded in the year 2011 with currently available branches in number 9 & 4
respectively. Finally; Tsehay & Lucy insurers (the youngest) were established in the year
2012 with number of branches 8 & 4 respectively.

Table 4.13: The General Status of Ethiopian Insurance Industry
S.N Name of insurer Year/Date of Establishment
No of branches
Remark
1. EIC 1975 60
2. NICE 23/09/1994 22 3. Awash 01/10/1994 33 4. Africa 01/12/1994 19 5. Nyala 06/01/1995 21 6. Nile 11/04/1995 29 3 branches recently
installed
7. Global 11/01/1997 12 8. UNIC 01/04/1997 29 9. Nib 01/05/2002 24
10. Lion 01/07/2007 21 11. Ethio-life 23/10/2008 6 12. Oromia 26/01/2009 24 13. Abay 26/07/2010 15 14. Berhan 24/05/2011 9
15. Bunna Aug 2011 4 16. Tsehay 28/03/2012 8 17. Lucy Nov 2012 4 Total 340
Source: Own computation based on data obtained from NBE & Eth. insurance companies.
4.5.3 Nile's Market Share in the Insurance Industry vis-à-vis Competitors
of General Insurance (Non-life) in GWP
As shown in the Table 4.14 below, regarding General Insurance performance of the insurance
industry in Ethiopia, the 5 years average gross premium and market share for EIC (the only
Government Insurance) is Birr 1,160.36 million (about 40%) and 41.31% respectively. The
average gross premium and market share of the rest privately owned insurance companies in
total is Birr 1747.88 Million (about 60%) and 58.69% respectively. With regard to Nile’s
position in the insurance industry in the five years’ both average premium and market share it
stood 5th in rank, next to EIC, Africa, Nib and Awash. That means Nile almost became last
comparing it with main/peer group competitors. Therefore, the BOD and management of the
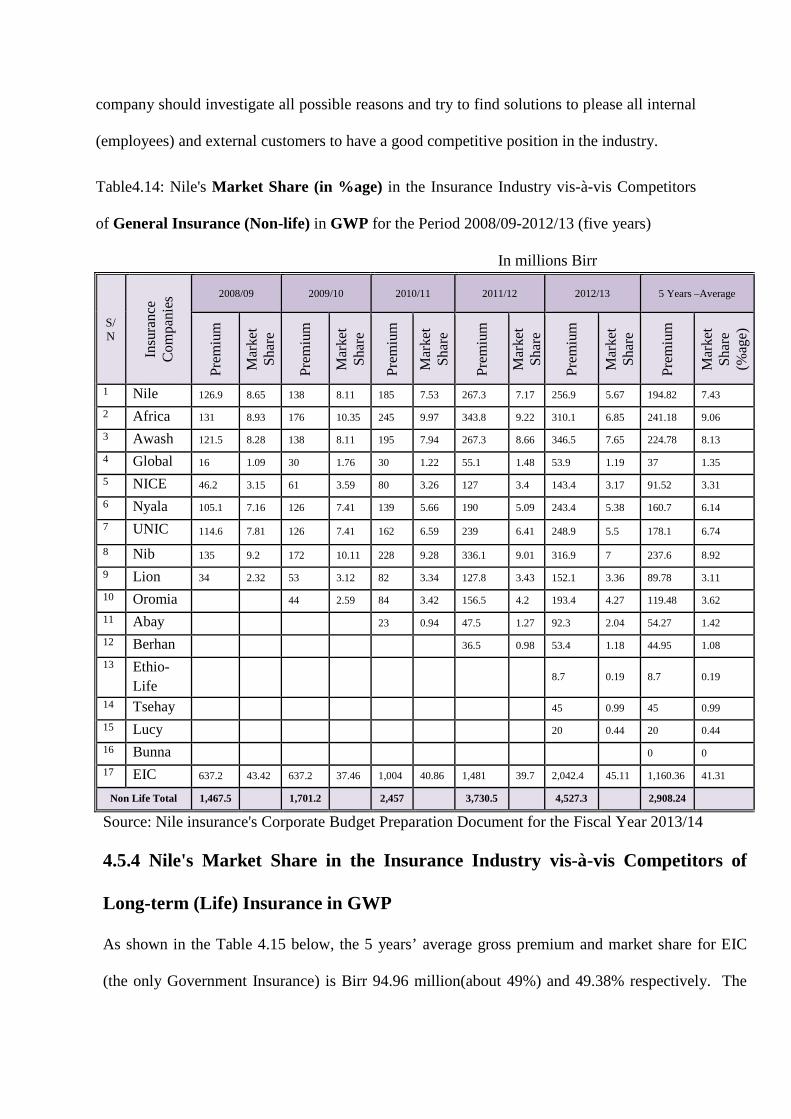
company should investigate all possible reasons and try to find solutions to please all internal
(employees) and external customers to have a good competitive position in the industry.
Table4.14: Nile's Market Share (in %age) in the Insurance Industry vis-à-vis Competitors
of General Insurance (Non-life) in GWP for the Period 2008/09-2012/13 (five years)
In millions Birr
S/N
Insu
ranc
e C
ompa
nies
2008/09
2009/10 2010/11 2011/12
2012/13
5 Years –Average
Pre
miu
m
Mar
ket
Sha
re
Pre
miu
m
Mar
ket
Sha
re
Pre
miu
m
Mar
ket
Sha
re
Pre
miu
m
Mar
ket
Sha
re
Pre
miu
m
Mar
ket
Sha
re
Pre
miu
m
Mar
ket
Sha
re
(%ag
e)
1 Nile 126.9 8.65 138 8.11 185 7.53 267.3 7.17 256.9 5.67 194.82 7.43
2 Africa 131 8.93 176 10.35 245 9.97 343.8 9.22 310.1 6.85 241.18 9.06
3 Awash 121.5 8.28 138 8.11 195 7.94 267.3 8.66 346.5 7.65 224.78 8.13
4 Global 16 1.09 30 1.76 30 1.22 55.1 1.48 53.9 1.19 37 1.35
5 NICE 46.2 3.15 61 3.59 80 3.26 127 3.4 143.4 3.17 91.52 3.31
6 Nyala 105.1 7.16 126 7.41 139 5.66 190 5.09 243.4 5.38 160.7 6.14
7 UNIC 114.6 7.81 126 7.41 162 6.59 239 6.41 248.9 5.5 178.1 6.74
8 Nib 135 9.2 172 10.11 228 9.28 336.1 9.01 316.9 7 237.6 8.92
9 Lion 34 2.32 53 3.12 82 3.34 127.8 3.43 152.1 3.36 89.78 3.11
10 Oromia
44 2.59 84 3.42 156.5 4.2 193.4 4.27 119.48 3.62
11 Abay
23 0.94 47.5 1.27 92.3 2.04 54.27 1.42
12 Berhan
36.5 0.98 53.4 1.18 44.95 1.08
13 Ethio-Life
8.7 0.19 8.7 0.19
14 Tsehay
45 0.99 45 0.99
15 Lucy
20 0.44 20 0.44
16 Bunna
0 0
17 EIC 637.2 43.42 637.2 37.46 1,004 40.86 1,481 39.7 2,042.4 45.11 1,160.36 41.31
Non Life Total 1,467.5
1,701.2
2,457
3,730.5
4,527.3
2,908.24
Source: Nile insurance's Corporate Budget Preparation Document for the Fiscal Year 2013/14
4.5.4 Nile's Market Share in the Insurance Industry vis-à-vis Competitors of
Long-term (Life) Insurance in GWP
As shown in the Table 4.15 below, the 5 years’ average gross premium and market share for EIC
(the only Government Insurance) is Birr 94.96 million(about 49%) and 49.38% respectively. The

average gross premium and market share of the rest privately owned insurance companies in total
have Birr 99.49 Million (about 51%) and 50.62% respectively. With regard to Nile’s position in the
five years’ both average premium and market share has stood 5th in rank, next to EIC, Awash,
Nyala, UNIC and EIC, Nyala, Awash, UNIC respectively. Similarly, here Nile’s position among the
peer competing groups is last. Hence the BOD & the management of the company must thoroughly
discuss the possible reasons why this is so, and find the required solutions in order the company to
get a better rank in the peer groups
Table4.15: Nile's Market Share in the Insurance Industry vis-à-vis Competitors of Long-term
(Life) Insurance in GWP for the Period 2008/09-2012/13
In Millions Birr
S/N In
sura
nce
Com
pani
es
2008/09 2009/10 2010/11 2011/12 2012/13 5 Years -Average
Pre
miu
m
Mar
ket
Sha
re P
rem
ium
Mar
ket
Sha
re P
rem
ium
Mar
ket
Sha
re P
rem
ium
Mar
ket
Sha
re P
rem
ium
Mar
ket
Sha
re P
rem
ium
Mar
ket
Sha
re
1 Nile 9.5 9.49 11 8.85 12.73 7.11 18.4 6.89 20.4 6.82 14.41 7.83
2 Africa 9 8.99 10.3 8.29 12.31 6.87 13.3 4.98 20.2 6.75 13.02 7.18
3 Awash 5.5 5.49 7 5.63 18 10.05 18.7 7 60 20.06 21.84 9.65
4 Global N.A*
5 NICE N.A
6 Nyala 10 9.99 15 12.07 20.71 11.56 25 9.36 26.8 8.96 19.5 10.39
7 UNIC 8 7.99 10 8.05 24 13.4 15.2 5.69 16.9 5.65 14.82 8.15
8 Nib 3.6 3.6 5 4.02 10.67 5.96 13.5 5.05 13.3 4.45 9.21 4.62
9 Lion N.A
10 Oromia 0.07 0.03 1.58 0.53 0.83 0.28
11 Abay N.A
12 Berhan 0 N.A
13 Ethio-Life
1 1 4 3.22 4 2.23 6.2 2.32 14.1 4.71 5.86 2.7
14 Tsehay N.A
15 Lucy N.A
16 Bunna N.A
17 EIC 53.52 53.46 62 49.88 76.7 42.82 156.8 58.69 125.8 42.06 94.96 49.38
Life Total 100.12 124.3 179.12 267.17 299.1 194.5
N.A* = Data Not Available.
Source: Nile insurance's Corporate Budget Preparation Document for the Fiscal Year 2013/14

4.5.5 Comparison of Nile’s Asset with peer groups in the insurance industry
in General Insurance in terms of total assets from the year 1996 to 2013:
As shown below in the Table 4.16, comparing the peer group insurance companies in the
Industry with regard to total assets ( total liabilities and share holders’ fund) position in Balance
Sheet of general insurance for 18 years; Nile was the 2nd next to EIC. I.e. it was the first among
the private insurers for 12 consecutive years (1996- 2007).
But for the subsequent years, Nile left its position & had become 3rd, 4th, 5th, and 7th for the
periods 2008-09, 2010, 2011-12, and 2013 respectively. This is really terrible when such a lead-
ing company among the private insurers next to EIC has gradually become lagging behind/ follo-
wers to others.
Table 4.16: Ethiopian Insurance Industry Balance Sheet – General (None-Life) Insurance for the Year Ended June 30, 1996-2013
(In millions Birr) Name of Insurance Companies, their Total Assets, and Position(Rank)
-Year -Asset -Rank
EIC
Africa
Nib
Awash
UNIC
Nile
Nyala
1996-2007: Asset (average) Rank
593.16
1st
90.26
3rd
47.96
7th
73.52
5th
59.84
6th
111.89
2nd
89.96
4th 2008-2009: Asset (average) Rank
1,116.96
1st
270.98
2nd
126.14
4th
96.21
6th
63.65
7th
126.50
3rd
120.88
5th 2010: Asset Rank
1,104.45 1st
333.44 2nd
251.28 3rd
216.85 5th
212.11 6th
225.03 4th
187.78 7th
2011-2012: Asset (average) Rank
961.29 1st
468.06 2nd
390.44 4th
399.75 3rd
308.62 6th
315.89 5th
261.66 7th
2013: Asset Rank
2,080.40 1st
496.64 4th
517.61 3rd
558.71 2nd
432.24 5th
423.11 7th
426.36 6th
Own Analysis; based on source: NBE Data

4.5.6 Comparison of Nile’s Asset with the peer groups in the insurance industry
in Long-term Insurance in terms of total assets from the year 2001 to 2013:
As it is seen below in the Table 4.17, comparing the peer group insurance companies in the
Industry with regard to total assets ( total liabilities and share holders’ fund) position in Balance
Sheet of long-term insurance for 13 years; Nile was the 3rd in total asset position next to EIC &
UNIC during the year 2001& 2002. I.e. it was the 2nd among the private insurers. The same thing
happened within four subsequent periods (2003-2006).
But for the succeeding years (2007- 2009), Nile missed its position and had become 4th next to
EIC, UNIC, and Africa. During the remaining four consecutive years ( 2010-12) & 2013) the
position of Nile further declined and had become 6th next to EIC, Africa, UNIC, Nyala, Awash &
EIC, Awash, Africa, UNIC, Nyala respectively. This gradual decline in the asset position of the
company will eventually lead it to be less competitive, unless and otherwise a very constructive
measure is taken by the concerned company’s officials in order the company be more competitive
and regain its position by thoroughly discussing why the company has become declined from year to
year. The peer group insurers’ asset position is tabulated below as follows.

Table 4.17: Ethiopian Insurance Industry Balance Sheet – Long-term (Life) Insurance for the
Year Ended June 30, 2001-2013
(In millions Birr)
Name of Insurance Companies, their Total Assets, and Position(Rank)
-Year -Asset -Rank
EIC
Africa
Nib
Awash
UNIC
Nile
Nyala
2001 - ‘02: Asset (average) Rank
132.24
1st
4.33 5th
N.A
-
4.48 4th
8.78 2nd
5.61 3rd
N.A
-
2003 - ‘05: Asset (average) Rank
161.68
1st
6.02 4th
N.A
-
4.19 5th
10.78 2nd
7.98 3rd
N.A
-
2006: Asset Rank
196.26
1st
8.24 5th
N.A
-
8.25 4th
11.95 2nd
9.75 3rd
4.51 6th
2007: Asset Rank
219.10
1st
11.81
3rd
N.A
-
10.64
5th
13.17 2nd
10.86
4th
6.26 6th
2008: Asset Rank
255.64
1st
17.72
3rd
10.84
6th
13.62
5th
19.03 2nd
15.09 4th
7.82 7th
2009: Asset Rank
298.81
1st
24.31
3rd
14.77
7th
18.57
5th
25.11 2nd
20.20
4th
15.63 6th
2010 - 2012: Asset (average) Rank
384.70
1st
44.35 2nd
20.64
7th
33.75
5th
36.48
3rd
28.57
6th
34.44
4th 2013: Asset Rank
551.62
1st
70.94
3rd
28.48
7th
104.67
2nd
59.19
4th
43.36
6th
49.68
5th Own Analysis, 2014; based on source: NBE Data.
4.5.7 Status of Employees’ Termination of Nile Insurance Company during the Fiscal Year 2013/14 The company has 306 permanent employees during the year specified. But as depicted in the table
below 58 employees have terminated during the year.
The possible reasons for terminating an agreement are: better opportunities, self employment,
further education, go to other foreign countries, not specified, disciplinary cases, retirement, and etc.

Their percentage share is displayed as follows in the table
Table 4.18 Terminated Employees of Nile Insurance Company in 2013/’14
S.N No of Employees
terminated Percentage
(%) Possible Reasons Remark
1. 27 46.55% Better opportunity 2. 8 13.79% Self-Employment 3. 1 1.72% Further education 4. 3 5.17% Go to abroad 5. 11 18.97% Not specified 6. 4 6.90% Disciplinary measure 7. 2 3.45% Retirement 8. 2 3.45% Death
58 100.00%
Own Analysis; based on source: 2013/14 Annual Report of HRMPAD of Nile. As shown in the table above, the number of internal customers (employees) leaving the company for
various reasons are many. Among the reasons, ‘better opportunity’ takes the lion share (about 47%).
If we compare the number of terminated employees with the total employees in the company in terms
of percentage, it is nearer to 19% which is significant. In terms of position, most (almost all) of those
leaving the company is less and/or equal to divisional heads, senior officers, officers and so on. This
is because other peer group companies’ competitive pay and fringe benefits have been found more
attractive. As a result of this, Nile has got a name ‘training center’ as it recruits employees, sooner or
later they terminate and switch to other insurance companies. This has been habituated in the
company which is a waste of time, money and energy in terms of frequent vacancy advertisement,
screening and selection, placement, orientation, introducing new ones to existing employees, etc.
Such rush out trend of terminating employees seems to continue unless the company takes a very
serious measure to improve and update in time the scale of competitive salary and commensurate
benefit packages and narrows the higher gap in salary/ benefit between hierarchical positions by
uplifting the salary and benefit of those very low paid positions which is very discouraging and
demoralizing for the workforce not to be more productive and proactive for the company’s
competitive advantage.
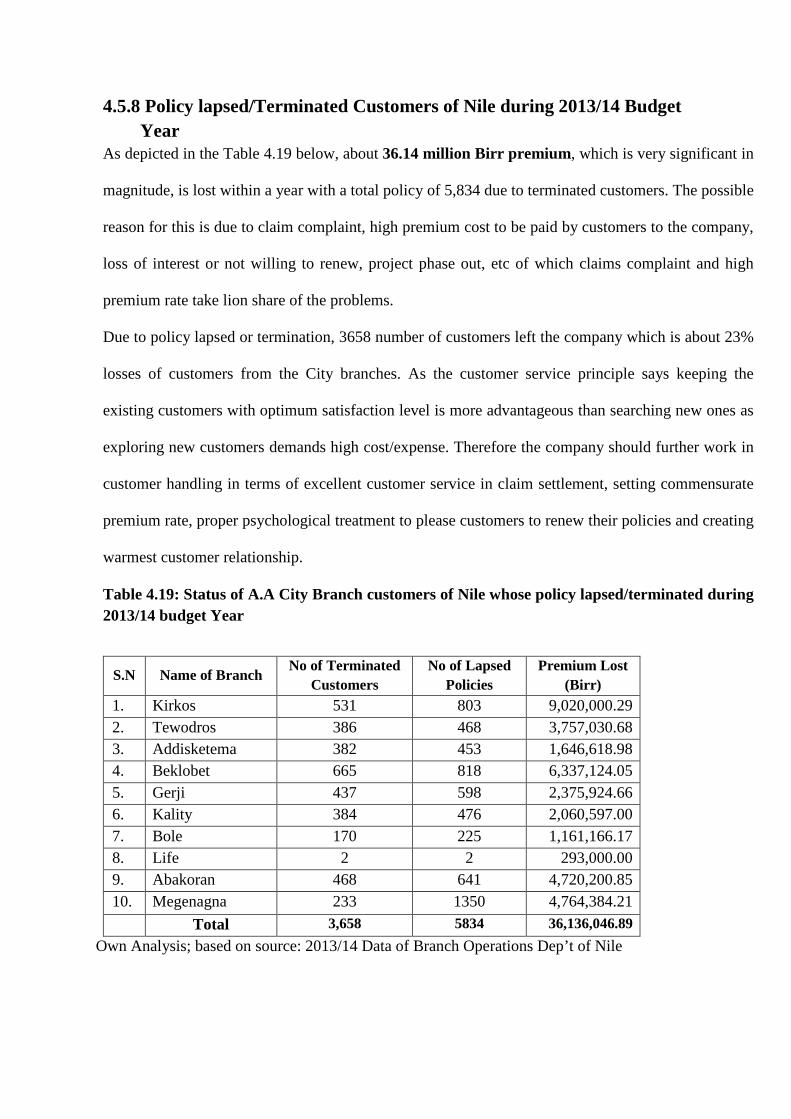
4.5.8 Policy lapsed/Terminated Customers of Nile during 2013/14 Budget Year As depicted in the Table 4.19 below, about 36.14 million Birr premium , which is very significant in
magnitude, is lost within a year with a total policy of 5,834 due to terminated customers. The possible
reason for this is due to claim complaint, high premium cost to be paid by customers to the company,
loss of interest or not willing to renew, project phase out, etc of which claims complaint and high
premium rate take lion share of the problems.
Due to policy lapsed or termination, 3658 number of customers left the company which is about 23%
losses of customers from the City branches. As the customer service principle says keeping the
existing customers with optimum satisfaction level is more advantageous than searching new ones as
exploring new customers demands high cost/expense. Therefore the company should further work in
customer handling in terms of excellent customer service in claim settlement, setting commensurate
premium rate, proper psychological treatment to please customers to renew their policies and creating
warmest customer relationship.
Table 4.19: Status of A.A City Branch customers of Nile whose policy lapsed/terminated during 2013/14 budget Year
S.N Name of Branch No of Terminated
Customers No of Lapsed
Policies Premium Lost
(Birr) 1. Kirkos 531 803 9,020,000.29 2. Tewodros 386 468 3,757,030.68 3. Addisketema 382 453 1,646,618.98 4. Beklobet 665 818 6,337,124.05 5. Gerji 437 598 2,375,924.66 6. Kality 384 476 2,060,597.00 7. Bole 170 225 1,161,166.17 8. Life 2 2 293,000.00 9. Abakoran 468 641 4,720,200.85 10. Megenagna 233 1350 4,764,384.21
Total 3,658 5834 36,136,046.89 Own Analysis; based on source: 2013/14 Data of Branch Operations Dep’t of Nile

4.5.9 Relationship between SERVQUAL dimensions and customer
satisfaction
The table 4.2, below, shows the nature of correlation exists between customer satisfaction and
service quality dimensions (based on SPSS version 20, Annex V). We can observe that all the
eight service quality dimensions have significant correlation with customer satisfaction.
As we see from the table 4.20 below, the highest correlation is between customer satisfaction
and complaint handling with correlation coefficient of 0.947. This strong correlation signifies
the importance of executing customer complaints handling policy in place which has strong
human touch elements on the realization of customer satisfaction. The other human touch
variable is the underwriting service proved to have strong positive relationship with customer
satisfaction by scoring the second highest correlation with correlation coefficient of 0.941.
Here clarification/simplification of policies, proposals, etc, & constant use of
professionals/employees with technical skill/competency have strong correlation with
satisfaction. Tangibles scored the third highest correlation coefficient which is 0.939. This
strong correlation shows that the company should provide appealing physical facilities &
equipment, attractive working environment and well-dressing employees to satisfy its
customers. Claims service scored the fourth highest correlation coefficient of 0.930. The
result shows the importance of providing adequate guide and service to customers, adequate
empowerment to the concerned employees to solve encountered problems.
Reliability scored the fifth highest correlation coefficient, 0.928. The result shows the
importance of respecting promises and in time service delivery, keeping up-to-date/accurate
records to the satisfaction of customer.
Responsiveness scored the sixth highest correlation coefficient with customer satisfaction,
0.922. The result shows the significance of being interested to assist & give prompt service to
customers, always respond to customers’ request. Assurance scored the seventh highest
correlation coefficient, 0.920 with customer satisfaction. This means that assuring customers’

service request is duly followed-up, equip front-line employees with required capacity/
knowledge to answer customer’s request and provide individual attention to customers.
Empathy scored the eighth highest correlation coefficient, 0.919 with customer satisfaction.
The result shows that understanding customers’ specific needs, best interest, personal
attention and time convenience are of paramount importance for their satisfaction.
Table 4.20: Relationship between Customer satisfaction and Service quality dimensions
Tang Reliab
Respo
nsiv Assur Empathy U/writing Claims C/handling
Spearman’s rho
Customer satisfaction
correlation Coefficient
Sig. (2-tailed)
N
.939**
.000
94
.928**
.000
94
.922**
.000
94
.920**
.000
94
.919**
.000
94
.941**
.000
94
.930**
.000
94
.947**
.000
94
** Correlation is significant at the 0.01 level (2-tailed). Own Survey, 2014
4.5.10 Frequency, Mean and Mean average of Customers’ perception on SERVQUAL Dimensions
SPSS has also been applied to test status of customers’ perception on the 5 service quality
dimensions and 3 additional variables, in total 8 dimensions.
As it is well observed in the table 4.21 below, each mean and mean-average score of all the
service quality dimensions are higher than the median value of 3. This shows that customers’
perception of service quality is higher regarding that Nile insurance company needs to:
have better physical appearance & modern equipment, perform the promised service
accurately/dependably, be willing to help customers & provide prompt service, have better
knowledge & courtesy of employees to inspire trust and confidence, give individualized
attention & care of customers, prepare documents/policies in more understandable language
to customers, adequately empower its employees to solve customers’ problems & improve
accessibility to customers in occurrence of claims, implement Customer service and

Complaint Management Policy in order to provide standardized service delivery and ultimate
customer satisfaction.
Table 4.21: Frequency, Mean and Mean average of Customers’ perception on SERVQUAL Dimensions:
Tangibles 1 2 3 4 5 Total Mean Mean Average
Tangible 1 4 4 9 46 31 94 4.02
4.01
Tangible 2 5 5 8 33 43 94 4.11
Tangible 3 2 4 4 36 48 94 4.32
Tangible 4 7 10 21 34 22 94 3.57
Reliability 1 2 3 4 5 Total Mean Mean Average
Reliability 5 3 3 12 37 39 94 4.13
4.17
Reliability 6 3 5 12 35 39 94 4.09
Reliability 7 3 5 12 38 36 94 4.05
Reliability 8 3 3 11 33 44 94 4.19
Reliability 9 3 2 7 27 55 94 4.37
Responsiveness 1 2 3 4 5 Total Mean Mean Average
Responsiveness 10 3 4 7 34 46 94 4.23
4.18
Responsiveness 11 3 3 8 32 48 94 4.27
Responsiveness 12 2 3 6 36 47 94 4.31
Responsiveness 13 8 3 15 33 35 94 3.89
Assurance 1 2 3 4 5 Total Mean Mean Average
Assurance 14 4 2 11 34 43 94 4.17
4.20
Assurance 15 3 4 9 26 52 94 4.28
Assurance 16 4 1 5 37 47 94 4.30
Assurance 17 3 3 8 35 45 94 4.23
Assurance 18 4 5 15 33 37 94 4.00
Empathy 1 2 3 4 5 Total Mean Mean Average
Empathy 19 3 1 7 41 42 94 4.26
4.23 Empathy 20 2 4 12 27 49 94 4.25
Empathy 21 3 4 8 32 47 94 4.23
Empathy 22 2 4 10 39 39 94 4.16

Table 4.21: Frequency, Mean and Mean average of Customers’ perception on SERVQUAL Dimensions (cont’d):
Underwriting 1 2 3 4 5 Total Mean Mean Average
Underwriting 23 3 4 10 30 47 94 4.21
4.02
Underwriting 24 2 4 7 36 45 94 4.26
Underwriting 25 4 7 10 29 44 94 4.09
Underwriting 26 5 8 16 32 33 94 3.85
Underwriting 27 5 12 17 31 29 94 3.71
Claims service 1 2 3 4 5 Total Mean Mean Average
Claims service 28 3 6 14 32 39 94 4.04
4.12
Claims service 29 4 2 12 39 37 94 4.10
Claims service 30 3 3 13 42 33 94 4.05
Claims service 31 4 2 7 32 49 94 4.28
Complaint handling 1 2 3 4 5 Total Mean Mean Average
Complaint handling 32 5 8 18 28 35 94 3.79
3.94
Complaint handling 33 2 7 15 37 33 94 3.98
Complaint handling 34 4 6 10 35 39 94 4.05
Own survey, 2014

Chapter Five: Summary, Conclusion, Recommendation, &
Future Work
5.1 Summary of Major Findings
Based on the data analysis & interpretation the major findings are summarized as follows:
� 30% of front-line employees were not happy in their job, because of work load, routine
nature of the work, no promotional growth, and unsatisfactory salary and yet needs a
long journey to reach the top/middle level management to get optimum pay and benefit
package.
� With regard to taking training in relation to customer service delivery or complaint
handling, 30% of the employees have not got the chance to train. This is because of
being new and/or hesitates of the company to attain such issues.
� Giving the opportunity to employees to participate in decision making with regard to
service delivery, 20% of the employees haven’t given the chance to make decision.
� Regarding duration (time) of existence of customers in the company, 56.38% of the
company customers are new entrants existed with the range of 0-5 years.
� With regard to the type of insurance coverage in the Company/Branch, motor insurance
cover is the dominant of all, which accounts 72.34% and as well a great source of
customer complaint during maintenance and claims.
� With regard to the nature of working environment, availability of parking, security
checkup, about 40% of neutrality and dissatisfaction was observed.
� There was on average 17% in both neutrality and dissatisfaction of customers with
regard to Assurance in terms of service follow-up, knowledge/capacity of employees,
and giving individual attention to dissatisfied customers.

� The neutrality and dissatisfaction level of customers on average is about 16% regarding
Empathy in providing quality services, specific needs, and giving attention for customers
best interest.
� The neutrality and dissatisfaction of customers is above 24% with regard to
Underwriting Services such as in the areas of preparing documents in the widely
understood languages to customers, clarification on insurance policies, constant use of
professionals.
� With regard to the performance of Claims Service, the size of neutral and dissatisfied
customers on average is above 19% - in terms of adequate guide and service to
customers, adequate empowerment to employees, and improving accessibility to
customers in time of claims happening.
� In the analysis of customers’ Complaint handling Service, the total percentage of
dissatisfied and neutral customers on the average is 27%, which is very significant to
deserve attention. The overall performance is moderate, as only 37.94% of customers are
highly satisfied on the average.
� With regard to Nile’s comparative position in the insurance industry in the five years’
(2008/09-2012/13) average premium and market share in general and long-term
insurance, Nile almost became last comparing with main/peer group
competitors/insurers.
� Comparing the peer group insurance companies in the Industry with regard to total assets
(Total Liabilities and Share Holders’ Fund) position in the Balance Sheet of general
insurance for 18 years; Nile was the 2nd next to EIC or the first among the private
insurers for 12 consecutive years (1996- 2007). But for the subsequent years, Nile left its
position and had become 3rd, 4th, 5th, and 7th for the periods 2008-09, 2010, 2011-12, and
2013 respectively.

� Comparing the peer group insurance companies in the Industry with regard to total assets
(Total Liabilities and Share Holders’ Fund) position in the Balance Sheet of long-term
insurance for 13 consecutive years, Nile was the 3rd in total asset position next to EIC &
UNIC or 2nd among private insurers for six subsequent periods (2001-2006). But for the
succeeding years (2007-2013) Nile missed its position and had become 4th & 6th in rank.
� There has been higher turnover (termination) of employees and customers in Nile in the
year 2013/14. The number of terminated employees compared with the total number of
employees in the Company in terms of percentage is nearer to 19% which is significant.
Due to policy lapsed or termination, 3658 number of customers left the company which
is about 23% losses of customers from the City branches only. In terms of premium
revenue, Nile has lost Birr 36,136,046.89 within a year from city branches only, which is
very significant in amount, due to the termination of those customers with a total number
of lapsed policies of 5,834.
� The observable challenges in the insurance industry with regard to customer handling
are: unhealthy premium rate cutting, increasing claims cost, lack of information
exchange system, lack of public awareness of insurance & new insurance
product/service development & unfair competition between the state-owned and private
insurance companies.
5.2 Conclusions
The study used SERVQUAL Model to analyze the level of customer satisfaction by
measuring customers’ perception with regard to quality service delivered by the insurance
using the five service quality dimensions which are Tangibles, Reliability, Responsiveness,
Assurance and Empathy plus three additional variables, i.e. Underwriting, Claims service and
Complaint Handling. These eight dimensions and their respective attributes of the model are
expressed using a five point Likert Scale Model in the manner: Very dissatisfied,
Dissatisfied, Neither Satisfied nor Dissatisfied, Satisfied, and Very satisfied.
Therefore, based on the findings of the study, the following conclusion is forwarded:
� The company has accomplished less in terms of providing training and pleasing its
employees in their job in relation to customers’ complaint handling & motivational
packages with regard to salary & benefit package. If the company doesn’t care&
appreciate its staff, they might move to other better competitors which satisfy them.
� About 20% of the employees were not empowered to make decision with regard to
service delivery in the company. This will make a delay in terms of time & wastage of
energy and money of the company’s customers.
� Motor class of business is the dominant of all in terms of insurance coverage which
accounts 72.34%, and also a good source of premium. Unless and otherwise, this
business is well done with excellent and prompt service delivery, it will be a source of
complaint in claims handling, as a result, this will make the customers to switch to other
insurers which provide them proper service.
� Regarding duration (time) of existence of customers in the company, more than half
(56.38%) of the company customers are new entrants existed with the range of 0-5 years.
This shows that there is a tendency of outgoing long-existed customers which makes the
company to lose good amount of premium revenue.
� Nearly, 40% of neutrality and dissatisfaction of customers was observed in the nature of
working environment, availability of parking & security checkup. Unless due
consideration is given to improve, customers will be further dissatisfied and hesitated to
come to the company.
� In Assuring service follow-up & capacity of employees in giving individual attention to
dissatisfied customers, 17% of dissatisfaction and neutrality was observed. Regarding

Empathy, too, the dissatisfaction & neutrality level of customers on average is about
16% in providing quality services, specific needs and giving attention to best interest of
customers. Therefore, employees be further equipped with required knowledge and
motivation to be proactive and self starter in pleasing the dissatisfied customers utmost
individually to retain them sustainably.
� With regard to underwriting services, dissatisfaction and neutrality of customers is more
than 24% which really deserves due attention, care and emphasis as underwriting service
is the ultimate source of the company’s overall revenue. Therefore, it requires an all-out
and concerted effort to improve the service such as preparing required documents in the
widely understandable languages in which customers can easily understand such as in
Amharic, etc, regular use of professionals, and equip employees with necessary technical
and professional skill.
� As far as claims service is concerned, the total size of dissatisfaction and neutrality is
above 19%. This also needs due care. If claims handling process makes customers
annoyed in every class of insurance business, especially in motor insurance business
which contributes major share of revenue, the company will lose its comparative
financial position as customers are forced to exit and go to other competitors. Hence,
adequate training & empowerment to employees is required in order to provide adequate
guide and immediate service and accessibility to customers in time of claims occurrence.
� The total percentage of dissatisfied and neutral customers on the average is 27%
regarding Complaint Handling Service. As this is significant, it requires top attention.
I.e. executing Customer Service and Complaint Management Policy in place is of
paramount importance for the company to provide standardized service delivery and
ultimate customer satisfaction.
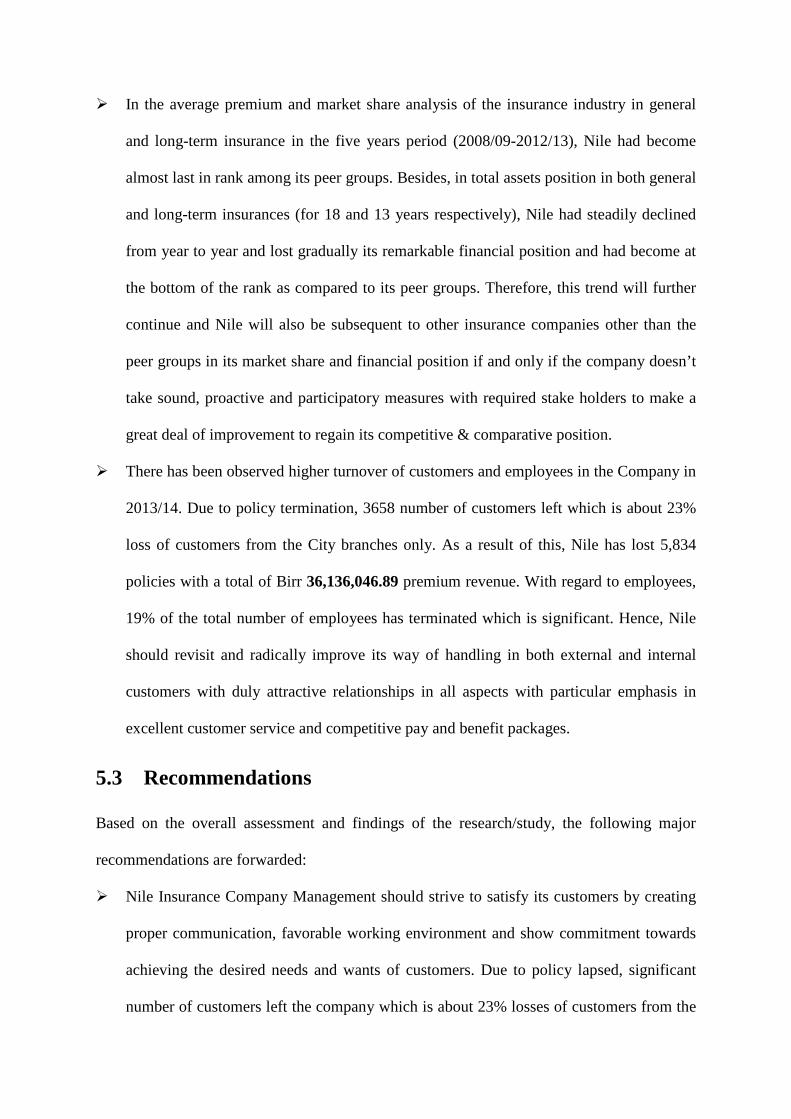
� In the average premium and market share analysis of the insurance industry in general
and long-term insurance in the five years period (2008/09-2012/13), Nile had become
almost last in rank among its peer groups. Besides, in total assets position in both general
and long-term insurances (for 18 and 13 years respectively), Nile had steadily declined
from year to year and lost gradually its remarkable financial position and had become at
the bottom of the rank as compared to its peer groups. Therefore, this trend will further
continue and Nile will also be subsequent to other insurance companies other than the
peer groups in its market share and financial position if and only if the company doesn’t
take sound, proactive and participatory measures with required stake holders to make a
great deal of improvement to regain its competitive & comparative position.
� There has been observed higher turnover of customers and employees in the Company in
2013/14. Due to policy termination, 3658 number of customers left which is about 23%
loss of customers from the City branches only. As a result of this, Nile has lost 5,834
policies with a total of Birr 36,136,046.89 premium revenue. With regard to employees,
19% of the total number of employees has terminated which is significant. Hence, Nile
should revisit and radically improve its way of handling in both external and internal
customers with duly attractive relationships in all aspects with particular emphasis in
excellent customer service and competitive pay and benefit packages.
5.3 Recommendations
Based on the overall assessment and findings of the research/study, the following major
recommendations are forwarded:
� Nile Insurance Company Management should strive to satisfy its customers by creating
proper communication, favorable working environment and show commitment towards
achieving the desired needs and wants of customers. Due to policy lapsed, significant
number of customers left the company which is about 23% losses of customers from the

City branches. More than half of the company customers are new entrants who have
existed with the range of 0-5 years. This shows that there is a tendency of outgoing long-
existed & potential customers which makes the company to lose good amount of income.
Therefore, I recommend that the company should improve its way/strategy of customer
handling as customers are kings and/or queens with a source of premium revenue.
� As far as Tangibility is concerned, it is recommended that the company should fulfill
good working environment such as: required parking for vehicles & well furnished
office in branches, as the magnitude of neutrality & dissatisfaction of customers is high,
which is about 40%. This makes customers hesitate to come to the company.
� Regarding empathy, assurance, responsibility & reliability, though the satisfaction of
customers is positive, much has to be made in terms of customers’ best interest /needs,
service follow-up & individual attention, promise keeping in fulfilling customers’ needs,
keeping the up-to-date and accurate records related to customer’s policy.
� With regard to Underwriting services, dissatisfaction and neutrality of customers is more
than 24% which really deserves due attention, care and emphasis as underwriting service
is the ultimate source of the company’s overall revenue. Therefore, it is strongly
recommended that an all-out and concerted effort is to be made to improve the service
quality such as preparing required documents in the widely understandable languages in
which customers can easily comprehend, such as in Amharic, etc, regular use of
professionals, and equip employees with necessary technical and professional skill.
� Regarding Claims service, I strongly recommend that the company should show the
required dedication & make it practical in providing: adequate guide & service to
customers, adequate empowerment to the concerned employees to solve problems on
spot, & improve accessibility to customers in time of claims occur to minimize the
shortfall as neutral & dissatisfied customers in this regard is on average above 19%.

� As per the analysis of the eight service quality dimensions, with regard to Complaint
handling service, the level of customer satisfaction on average is the least of all, which
was about 73%. On the other hand, the total percentage of dissatisfied and neutral
customers on the average is 27%. Therefore, it is highly recommended that the company
should give top concern in installing appropriate complaint handling procedure in place
and act accordingly to fully resolve complaints and retain satisfied & loyal customers for
the long-run via quality and prompt service delivery.
� In the Gross written premium (GWP), Market share & Total Assets analysis of the
insurance industry, in general & long-term insurance, Nile had become steadily declined
from year to year and lost gradually its remarkable financial position and found almost at
the bottom of the rank as compared to its peer groups. Therefore, I strongly recommend
that the company should feel repentant to take all required endeavor, proactive &
participatory measures with all concerned in order to make a great deal of all-round
improvement in appropriate customer handling & quality service delivery in the eyes of
the customer to regain its competitive strength & comparative position in the industry.
� As per the analysis, there has been observed high turnover of employees, which is about
19% of the total number of employees in Nile. Among the reasons, employees left the
company; ‘better opportunity’ takes the lion share (about 47%). Therefore it is strongly
recommended that the top officials of the company should take constructive measure to
improve/update the scale of competitive salary & benefit packages & narrow the higher
gap in salary/ benefit between hierarchical positions by uplifting the salary & benefit of
those very low paid position which is discouraging and demoralizing for the workforce
not to be more productive and proactive for the company’s competitive advantage.
� Training should be conducted for all staffs as required, especially for front-line customer
contact employees on Customer/complaint handling so that they can exert their

maximum possible efforts to improve service quality and retain existing loyal customers
with the possibility of attracting newcomers.
� Even though the result based on SERVQUAL dimensions is moderately satisfied in
terms of service perception, on average about 21% of the customers are at neutral and
dissatisfaction level of service. This indicates there is a high probability for these
customers to switch to other nearby competitors to get prompt service. Therefore, the
company should strive to gain more & pertinent information about the attitudes of its
customers with regard to quality service & prepare plan to improve weaknesses
sustainably. Satisfying customers’ service expectation is critical to the company to stay
within the insurance market and regain its position within its peer competitors.
� With regard to the prevailing problems in the insurance industry such as unfair
competition in premium pricing, unhealthy competition between state-owned & private
insurance companies the supervisory authority (NBE) should make practical endeavor to
resolve such unnecessary situations in order to promote sound insurance business in
Ethiopia.
5.4 Future Work
As this is the first study on Customer Handling in Nile Insurance Company in the Ethiopian
Insurance Industry, the limitation of the study would be overcome by adopting new
approaches to the future research. In general, the following points could be sited as to be
included or considered for the upcoming studies in the field.
5.4.1 Samples from many firms as possible
Even if customers of Ethiopian insurance industry have much in common, each insurance
company may have its own special characteristics in terms of customer handling services.
Hence, it is important to consider large samples from many insurance industries to come up
with a very detail analysis.

5.4.2 Considering Large Sample Size
Though adequate for analysis in relation to other studies, the samples on which this study was
undertaken were small. This can be considered as further limiting the generalization of the
findings.
5.4.3 Using Alternative Sampling Method
Even though, a special sampling style is common in management studies, it may have its own
limitation, as the study adopted with systematic random sampling. However, for further
study, together with a large sample size and incorporate more number of companies from the
industry a change in sampling techniques may cause deviation from the present study result.
Reference
Hailu Zeleke (2007), Insurance in Ethiopia; Historical Development, Present Status and
Future Challenges. First Edition
Darlene D. Richard (2004), the Customer Response Management Hand Book. Tata
McGraw-Hill Edition, New Delhi
Elaine k. Harris (2000), Customer Service; A Practical Approach, 2nd Edition, By Prentice
Hall, Inc.
Nigel Hill & Jim Alexander, Hand book for Measuring Customer Satisfaction and
Loyalty
James F. Engel, Roger D. Blackwell, Paul W. Miniard (1995), Consumer Behaviour;
International Edition, 8th Edition. The Dryden Press, Harcourt Brace College Publishers.
Charley Watkins (2006), Marketing, Sales & Customer Services, A.I.T.B.S Publishers &
Distributors (Regd.) Delhi-51
Peter Duchessi (2002), Crafting Customer Value- The Art and Science. Published by
Jaico Publishing House, Mumbai
Ron Karr and Don Blohowiak (1998), Great Customer Service, Prentice-Hall of India,
New Delhi.
David L. Loudon, Albert J. Della Bitta (1993), Consumer Behaviour: Concepts and
Applications, Fourth Edition, Fifth reprint 2004,Tata McGraw-Hill Edition 2002, New
Delhi.
Frank R. Kardes (2002), Consumer Behaviour and Managerial Decision Making, Second
Edition, Prentice-Hall of India New Delhi.
Prabha Ramseook-Munhurrun, Soolakshna D. Lukea-Bhiwajee and Perunjodi Naidoo.
(2010). Service Quality in the public service. International Journal of Management and
Marketing Research volume 3, 37-50.

Roger I. Cartwright (2000), Mastering Customer Relations. Printed and bound in Great
Britain. First Published in 2000.
Y.P. Singh (2002), Effective Service Management. Printed in India
Dale H. Besterfield, Carol Besterfield-Michna, Glen H. Besterfield, and Mary
Besterfield-Sacre (2003), Total Quality Management, Third Edition. Printed in India.
Second Indian Reprint, 2004.
Dr. S. Kumar (2006), Total Quality Management, Published by University Science Press,
New Delhi. Reprint in 2008.
Julia Prichard and Louis Jordan (1999), Maximising Performance in Insurance operations.
Printed in England.
Nicky Stanton (1996), Mastering Communication. Third Edition, Printed in Malaysia.
Neville Lake & Kristin Hickey (2006), Making Customer Service Happen. First South
Asian Edition.
Shay & Margaret McConnon (2002), Resolving Conflict, Establishing Trusting and
Productive Relationships in the Workplace. Published in United Kingdom
Claes Fornell (2007), The Satisfied Customer, Winners and Losers in the Battle for Buyer
Preference. Printed in the United States of America.
Harvey Thompson (2003), The Customer–Centered Enterprise, Tata McGraw-Hill
Edition 2003 New Delhi.
Francis Buttle (2009), Customer Relationship Management: Concepts and Technologies.
Second Edition. Printed and bound in India.
Henry kyambalesa (2003), Successful Marketing in the 21st Century. The imperatives,
Concepts and Challenges. First Indian Edition 2003.
Philip Kotler (1999), Kotler on Marketing, how to create, win and dominate markets. This
edition published in Great Britain by Simon & Schuster UK Ltd, 2001

Roger J. Best (2006), Market-Based Management, Strategies for Growing Customer
Value and Profitability. Fourth Edition. Indian Reprint, New Delhi-2006
Evert Gummesson (2000), Total Relationship Marketing, Printed and bound in Great
Britain by Bath Press, Bath.
P. Kotler (1999), Marketing Management: analysis, planning, implementation & control.
9th Ed. New Jersey, USA: Prentice – Hall, Inc
Kotler and Armstrong (1996), Customer Satisfaction. New Jersey: Prentice hall.
Niguel & Jim (2003), Measuring Customer Satisfaction & Loyalty. New Delhi: Shakit
Packers.
Oakland (2003), Total Quality Management. New Delhi: Saurabh
Buttle, F. (2009), Concept & Technologies. Mumbai: Sanat Printers.
Philip Kotler and Gary Armstrong (2004), Principle of Marketing, Tenth Edition. New
delhi
Yamane, Taro (1967), Statistics: An Introductory Analysis, 2nd Ed. New York: Harper
and Row.
Web-site Internet References:
Customer Satisfaction in General Insurance Industry- -A Step Towards Competitiveness: A Journal
of Risk. & Insurance Pravartak, Vol. IV Issue 3, March 2009. Accessed on Feb. 1, 2014
http://www.astutesolutions.com High-Touch, High-Quality Service Solutions for Insurers.
Accessed on March 5, 2014.
Markus Schaerer, Herbert Wanner, and Clive Grinyer. “Transforming the Insurance Industry to
Increase Customer Relevance, How Cultural, Process, and Technology Change Can Significantly
Increase Shareholder Value for Insurers.” March 2011. Accessed in Feb. 2014.
Ibm.com/insurance. Insuring the Future of an Industry. Driving insurance industry
growth through informed insight. Accessed in January, 2014
Annex Annex I
Indira Gandhi National Open University (IGNOU), India
School of Graduate Studies
MBA Program (Operations Management)
Questionnaire for Customers
Dear Respondent,
This questionnaire is designed to gather data regarding customer handling in relation to
insurance service and delivery in the insurance industry in Ethiopia, the case study at Nile
Insurance Share Company. The purpose of the study is to fulfill a thesis requirement for the
Master of Business Administration (MBA) at IGNOU in Distance Education Program.
Besides to recommend for the improvement of required customer service if there is a gap in
the quality of customer service delivery.
Your genuine, esteemed and timely response for the questions enclosed here is extremely
important for the successful completion of my thesis. The information that you provide will
be used purely for the purpose of academic study and will be kept strictly confidential.
Therefore, I kindly request you to respond each question carefully to help me be able to
accomplish the project on time.
Please Note:
1. No need of writing your name.
2. Where alternative answers are given, encircle your choice and put ‘’√’’ mark where
required.
3. Please return the completed & filled questionnaire in time.
I would like to thank you very much in advance for your cooperation and sparing your
valuable time to fill the questionnaire and return timely.
With Best Regards,
Berhanu Belay

Code No: ___
Annex I
Indira Gandhi National Open University (IGNOU), India
School of Graduate Studies
MBA Program (Operations Management)
Questionnaire for Customers of Nile Insurance S.C (Section I-III)
Section I Personal Information:
Please put a thick ‘’√’’ mark where appropriate:
1. Gender: Male Female
2. Age (Year):18-30 31-45 46-60 above 60
3. Occupation: Doing own business Private organization employed
Government employee NGO’s employee other
4. How long are you a customer of the Company?
More than 10 years 6-10 years 1-5 years Less than 1 year
5. What type of insurance cover do you have in the company/branch? (Select more than
one, if there is any)
Motor Marine Fire and lightening Life insurance other
6. How frequent do you come to the Branch/Company to get service in a month?
1 time 1-3 times 4-6 times 7-10 times more than 10 times
Section II: Service Satisfaction Questionnaire for customers
Please rate the degree of satisfaction of the following services being provided by the
company/branch on scale of five points by circling a number among the five alternatives.
Where: 1=Highly dissatisfied, 2= Dissatisfied, 3= Neutral, 4= Satisfied, 5=Highly satisfied

S.N Comparison Factors/SERVQUAL Dimensions or Attributes Rating Points
Tangibles:
1. the physical facilities of the service provider such as logo, agenda,
building, office furniture, etc will be appealing 1 2 3 4 5
2. The availability of modern technology and equipment such as PREMIA,
computer soft wares, etc 1 2 3 4 5
3. Neatness of employees and well-dressing, their approaches 1 2 3 4 5
4. The nature of working environment, availability of parking, security
checkup, etc 1 2 3 4 5
Reliability:
5. The service provider respects its promises to fulfill customer requirements 1 2 3 4 5
6. The service provider performs service delivery in time 1 2 3 4 5
7. At time of the customer is in problem, the service provider shows due
interest in solving it 1 2 3 4 5
8. Service giver keeps the up-to-date records related to customer’s policy
accurately 1 2 3 4 5
9. The service provider is dependably serves customer 1 2 3 4 5
Responsiveness:
10. Employees tell customers exactly when services are performed 1 2 3 4 5
11. Employees give prompt service to customers 1 2 3 4 5
12. Employees are always interested to assist customers 1 2 3 4 5
13. Employees are never too busy to respond to customers’ request 1 2 3 4 5
Assurance:
14. The behavior of employees inspires confidence in customers 1 2 3 4 5
15. Customers feel assured that service requests are duly followed up. 1 2 3 4 5
16. Front line personnel provide services in courteous and friendly manner 1 2 3 4 5
17. Front line employees have capacity/knowledge to answer customers’
questions 1 2 3 4 5
18. Service providers give customers individual attention 1 2 3 4 5
Empathy:
19. Service providers have operating hours convenient to all their customers 1 2 3 4 5
20. Employees providing quality services give personal attention to customers 1 2 3 4 5

21. Service provider gives attention for customer’s best interest, heartily 1 2 3 4 5
22. Service provider understands the specific needs of its customers 1 2 3 4 5
Underwriting Service:
23. Employees be committed to give clarification on insurance policy
benefits, rights and duties of concerned parties 1 2 3 4 5
24. Employees providing underwriting service have the necessary technical
and professional skill/competence 1 2 3 4 5
25. Service providers simplify insurance documents; such as policies,
proposals, endorsements, claims procedures, etc. to suite customers 1 2 3 4 5
26. Service providers build constant use of professionals; like agents,
surveyors, lawyers, etc to advice customers on insurance matters 1 2 3 4 5
27. Service providers prepare documents in the widely understood languages
to customers 1 2 3 4 5
Claims Service:
28. Employees provide adequate guide and service to customers in case of
claims 1 2 3 4 5
29. Service providers are accessible to customers in time of claims via
telephone, in person, in writing, etc. 1 2 3 4 5
30. Employees providing claims service have adequate empowerment to solve
customer’s problem. 1 2 3 4 5
31. Employees assigned in claims service are free of integrity/ ethical
problems 1 2 3 4 5
Complaint Handling:
32. Service providers installed complaint handling procedures in place to the
customers. 1 2 3 4 5
33. Complaints handling procedure/system of service provider is time
effective. 1 2 3 4 5
34. Complaint handling procedure at service provider is simple and straight
forward. 1 2 3 4 5
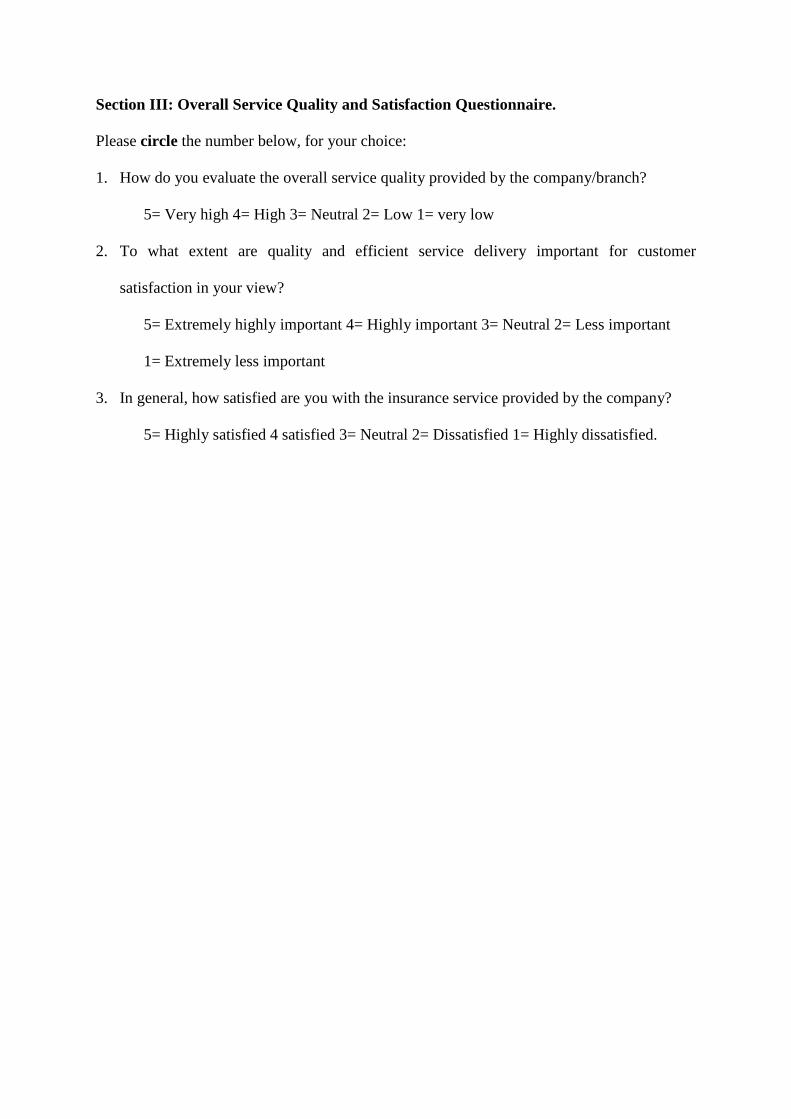
Section III: Overall Service Quality and Satisfaction Questionnaire.
Please circle the number below, for your choice:
1. How do you evaluate the overall service quality provided by the company/branch?
5= Very high 4= High 3= Neutral 2= Low 1= very low
2. To what extent are quality and efficient service delivery important for customer
satisfaction in your view?
5= Extremely highly important 4= Highly important 3= Neutral 2= Less important
1= Extremely less important
3. In general, how satisfied are you with the insurance service provided by the company?
5= Highly satisfied 4 satisfied 3= Neutral 2= Dissatisfied 1= Highly dissatisfied.

Annex I
[Questionnaire for Customers of Nile Insurance: translated into Amharic language]
•••• ••• •••• ••• •••••• (IGNOU) •••
•••• ••• •••••
•••••• ••••• ••••
••••• ••••••/•••••• •••••
••• •••• •• ••• •••••• •••••• •••••• •••••• •••• • • •••• ••••
•• ••••• ••• ••••••• •••••• ••••• •••• ••• ••••• •• •• •••• •••
••••• ••• •••• ••• •••••• (IGNOU) •••• ••••• •••••• •••••
•••••• •••• ••• ••• ••••• •••••• ••• ••••• ••• •••• • •••••
•••••• •••• ••• •• ••••• ••••• •• ••••••• ••• ••••• • •••••
•••••• •••••• ••••
••••• ••• •• •••••• ••••• ••••• •••• ••••• •••••• • ••••• •••
••• •••• •••• ••• ••• •••• ••••••• ••• ••••• •••••• ••••••
•••••• •••• ••••• ••• •••••• ••• ••• •• •••• ••• •• ••••••
••••• •••• ••••••• •••••• ••••••••
••••••-
1. •••• •••• •••••••••
2. ••••• •• ••• •••••••• ••• ••• •••• ‘’ √’’ ••••• ••• ••••
••••• ••••••
3. •••• ••••• ••••• ••••• •••• ••••••
••••••••• •••• •••• ••••• ••• •••••••••
•••••• •••• ••
•••• •••
Code No: ___
Annex I
•••• ••• •••• ••• •••••• (IGNOU) • •••
•••• ••• •••••
•••• •••••• ••••• ••••• •••• (••• I-III)

••• I: ••• •••:
•••• ••••• ••••• •••• •••• •••••••• •••••• ••• ••• • ‘’ √’’
••••• ••••••
1. ••: ••• ••
2. ••• (••••): 18-30 31-45 46-60 60 •••
3. •• : ••• ••• ••• •• ••• •••• ••••
•••••• •••• • “ ••• ” •••• ••
4. •••••• •••• ••• •• ••• •• •••••?
•10 ••• ••• 6-10 ••• 1-5 ••• •1 ••• •••
5. ••••••/•••••• •••• •••••••/•••• ••• •••• •••• ••? ( ••••
••• •••• ••••)
••••/•••••• •••• •• •• ••••• ••••
••••• ••• •• ••
6. ••• ••• •••••• ••••• •• •••••/••••• ••• •• ••••?
1 •• 1-3 •• 4-6 •• 7-10 •• 10 •• • ••
••• II: ••••••• •••••• •••• •••• •••
•••••••/••••••• ••••• •••• ••••• ••• ••• ••••••• •• ••••• ••••
••• ••• 1-5 ••••• ••••• •••• •••• •••• •••• ••••••• • ••••
•••••• ••••• ••••••••
•••• • 1 = ••• •••• ••••• • 2 = •••• ••••• • 3 = •••••• ••••• 4 =
•• ••• 5 = ••• •• •• •
•.• ••••• ••••• •••• •••• •••• •••••
••••
•••••• (Tangibles):
1. •••••• ••• •••••• ••••••• •••••• • •••• •••••
••• ••••• •••••• ••• ••••• •••••• ••• •••
••••••••
1 2 3 4 5
2. •••• •••• ••• •••••• ••• ••••• •••• ••••••
•••••• •••• •.•.•. •••• •••••• 1 2 3 4 5

3. •••••• ••••• •••••• ••••• •• •• •••••• •••••
••• ••••• 1 2 3 4 5
4. ••• •••••• •••• •••• ••• •••• •• •••••• ••••••
••••••• •• ••• •••• 1 2 3 4 5
••••• (Reliability):
5. •••••• ••• ••• ••••• •••••• ••••• •••• •••••••
•••• •••• •••••• 1 2 3 4 5
6. ••••• ••••••• •• •••• •• ••• •••••• •••••• 1 2 3 4 5
7. ••••• ••• ••••••• ••••• •••• ••••• •• •••• / •••
••••/••••• ••••••• 1 2 3 4 5
8. •••••• ••• ••••• •••••• ••• •• ••••• ••••• ••
•••• ••• ••• ••••• 1 2 3 4 5
9. •••• •••••• •••••• •••••• •••••• 1 2 3 4 5
•••••• (Responsiveness):
10. ••••• •••••• ••••• •• ••••••• •••••• •••••
•••••• 1 2 3 4 5
11. ••••• •••••• ••••• / •••••• •••••• ••• •••••• 1 2 3 4 5
12. ••••• ••••• •••••• •••••• ( ••••• ) ••••••••• •••••
• 1 2 3 4 5
13. ••••• •••• ••• •••• ••••••• ••• ••••••• •••••
••• •• •••••• ••••••• 1 2 3 4 5
••• ••••• (Assurance):
14. •••••• ••••• ••• ••• / •••• •••••• •• •••••• •••
••••••• 1 2 3 4 5
15. ••••• ••••••• •••••• ••••• •••• •••• •••••• •••
•••••••••• 1 2 3 4 5
16. ••••• •• ••• ••••• •••• ••••• •••• • •••••• ••••
•••• ••• •••••••• 1 2 3 4 5
17. ••••• •• ••• ••••• •••• ••••• ••••••• •••
••••••• •• •••• •••• (•••) ••••• •••••• 1 2 3 4 5
18. •••••• ••• •••••• ••••• ••• ( ••••••• ) •••• •••
••••••• 1 2 3 4 5
••• •••••• (Empathy):
19. •••••• ••• •••• ••••• •••• ••• ••• •••• •••••• 1 2 3 4 5
20. ••••• ••• ••• •••••• ••••• •••••• •••• •••• •••
•••••• 1 2 3 4 5
21. •••••• ••• •••••• ••••• •••• •••• ••• ••• ••••• 1 2 3 4 5

••••••
22. •••••• •••• ( •••••• ••••• ) ••••••• •••• ••••
•••••• 1 2 3 4 5
••••••• •• •• •••••• (Underwriting Service):
23. ••••• •••••••• •••• •••••••• ••• •••• ••• •• •••
••••• ••••• ••••• •••••••• ••• •••••• 1 2 3 4 5
24. ••••••• •• •• •••••• ••••• •••••• •••••• •••
••••/•••• ••••• •••••• 1 2 3 4 5
25. ••••••• ••••• ••••••• ••••• •••••• •••• • ••••••
•••••• •••• •••• •• •••••••• •••••• •••• ••••
••••••• ••••• ••••• •••••••
1 2 3 4 5
26. •••••• •••• •••••• •••••••• •••• ••••• ( •••
••••) ••••••• •••• ••• ••• ••••• ••••••••• •••
••••••• •.•.•. •••••/•••• ••• ••• •••• •••••••••
1 2 3 4 5
27. •••••• •••• ••••• ••••••• •••••••• ••••• •••••
••••• ••• ••••• •••••••• 1 2 3 4 5
••• •••••• (Claims Service): 28. ••••• •••••• ••• ••• ••••••• •• ••••• •••••
•••••• ••••• ••• •••• ••••••••• 1 2 3 4 5
29. •••••• •••••• ••••• ••••••• ••• ••• •• ••••• ••••••••• ••••• ••••• ••••• ••••• •.•.•. •••• •••••••••
1 2 3 4 5
30. ••• •••••• ••••• ••••••• ••• ••••• •••••• ••••• •••• ••••• ••••••
1 2 3 4 5
31. ••• •••••• ••••• •••••• / •••••• ••• ••• ••• ••••••••
1 2 3 4 5
•••• •••• (Complaint Handling): 32. ••••• ••••• •••••••• ••• ••••• •••••• ••• ••• ••
•• ••• ••••••• 1 2 3 4 5
33. •••••• ••••• ••• •••• ••• / •••• ••••• •••• ••••
•••• ••• •••••••• 1 2 3 4 5
34. •••••• ••••• ••• •••• ••• / •••• ••••• •••• ••••
••• •••••• 1 2 3 4 5
••• III: ••••• ••••••• •••• •••••• •••• ••••
•••• ••••• ••••• •••• •••• •••••••• ••• •••• •••••• •••••
••••••
1. ••••••/•••••• •••••• ••••••• ••• •••• •••••••?
1 = ••• •••• ••••• 2 = •••• ••••• 3 = •••••• ••••

4 = •• •• 5 = ••• •• ••
2. ••••• ••• ••• ••• •••••• •••• ••••• •••• ••••• •• • •• ••?
1 = ••• ••• ••• ••••• 2 = ••• ••• ••••• 3 = •••••• •••• 4 =
••• ••• •• 5 = ••• ••• ••• ••
3. •••••• •••• ••••• ••••• •••• •••••• •• ••• •••••?
1 = ••• •••• ••••• 2 = •••• ••••• 3 = •••••• ••••
4 = •• •• 5 = ••• •• ••
Code No: ___
Annex II
Indira Gandhi National Open University (IGNOU), India
School of Graduate Studies
MBA Program (Operations Management)
Questionnaire for Employees of Nile (Sec. IV)
Section IV: Questionnaire for Front-line Employees:
Please put a thick ‘’ √’’ mark where appropriate for your choice:
1. Gender: Male Female
2. Age (Year):18-30 31-45 46-60 Above 60

3. Educational Status: High School Complete Diploma Degree
Master
4. Work Unit: Underwriting Claims Engineering Other
5. How long have you been serving in the insurance company?
Less than 1 year 1 -3 years 3 – 5 years above 5 years
6. Are you happy with your job?
Yes No
If no, what are the possible reasons?
7. How is your interaction or communication with customers?
Very good Good Moderate Poor Very poor
8. Have you ever taken any training in relation to customer service delivery/complaint
handling?
Yes No
9. If the answer for question no 8 is ‘No’ what do you suggest is the reason for this? __
10. How do you rate your capacity/knowledge regarding the standard of your service
delivery?
Very good Good Moderate Poor Very poor
11. Does the company give a chance to employees to participate in decision making with
regard to service delivery?
Yes No
12. If your answer for question 11 is ‘No’ what do you think the reason? ___
13. Do you have any suggestion or comment to make with regard to excellent service
provision? .
Annex III
Indira Gandhi National Open University (IGNOU), India
School of Graduate Studies
MBA Program (Operations Management)
Interview Questions for Managers
Dear Respondent,
This interview question is designed to gather data regarding customer handling in relation to
insurance service and delivery in the insurance industry in Ethiopia, the case study at Nile

Insurance Share Company. The purpose of the study is to fulfill a thesis requirement for the
Master of Business Administration (MBA) at IGNOU in Distance Education Program.
Besides to recommend for the improvement of required customer service if there is a gap in
the quality of customer service delivery.
Your genuine, esteemed and timely response for the questions is extremely important for the
successful completion of my thesis. The information that you provide will be used purely for
the purpose of academic study and will be kept strictly confidential.
Therefore, I kindly request you to respond each question carefully to help me be able to
accomplish the project on time.
I would like to thank you very much in advance for your cooperation and sparing your
valuable time in the interview conversation.
With Best Regards,
Berhanu Belay
Code No: ___
Annex III
Indira Gandhi National Open University (IGNOU), India
School of Graduate Studies
MBA Program (Operations Management)
Interview Questions for Managers of Nile (Sec. V)
Section V: Interview Questions for Operational & Branch Managers
1. What is customer for you & how is your interaction?

2. In which areas of the “insurance products” is complaint more visible? .
3. How do you handle customer complaint in your work unit in the company? .
4. What is the effort of your unit to improve the service quality of the company? .
5. Has it been established proper way of receiving customers’ suggestion/ complaints? If no
how would you entertain it? .
6. Do you think that the service delivered to customers is satisfactory and customers are
happy? How do you measure it? .
7. Are there enough resources to meet customers’ satisfaction? If not specify the lack
resources with a possible remedy .
8. If you have any other comment/suggestion regarding customer service delivery?
Annex IV
Sample size determination table
Sample Size for ±3%, ±5%, ±7%, and ±10% Precision Levels where Confidence Level is
95% and P=.5.
Size of Population Sample Size (n) for Precision (e) of:
±3% ±5% ±7% ±10%
500 a 222 145 83
600 a 240 152 86
700 a 255 158 88
800 a 267 163 89
900 a 277 166 90
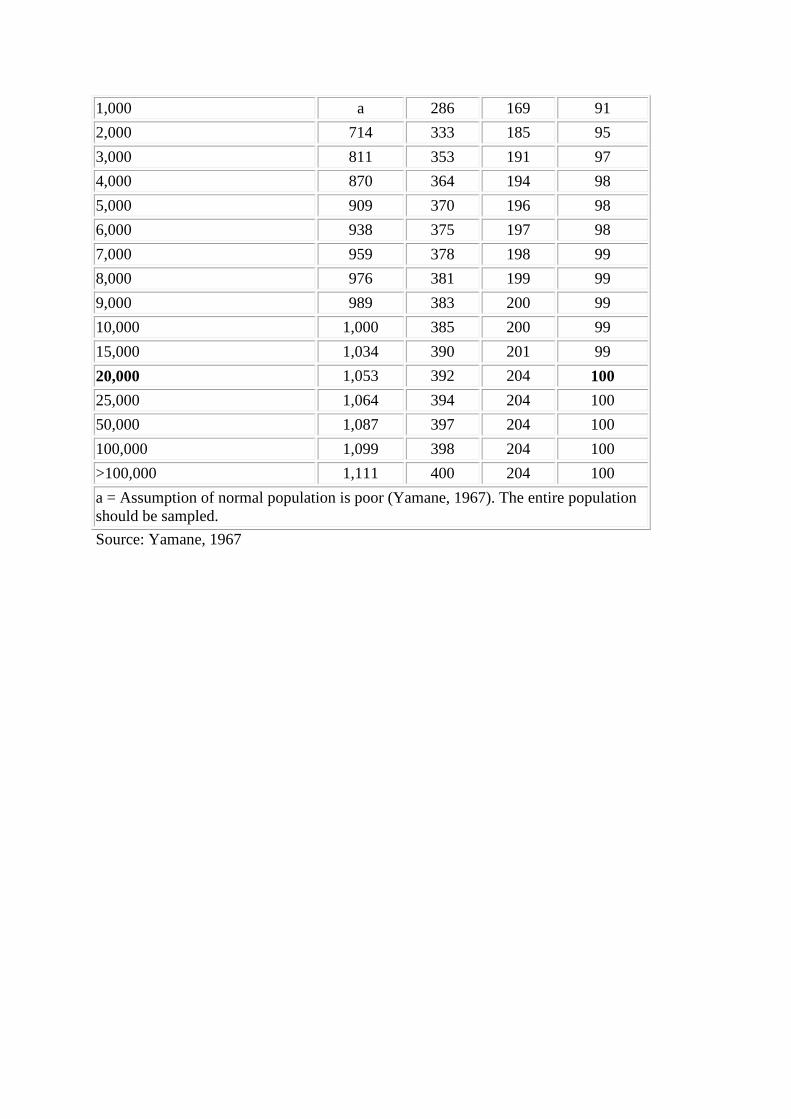
1,000 a 286 169 91
2,000 714 333 185 95
3,000 811 353 191 97
4,000 870 364 194 98
5,000 909 370 196 98
6,000 938 375 197 98
7,000 959 378 198 99
8,000 976 381 199 99
9,000 989 383 200 99
10,000 1,000 385 200 99
15,000 1,034 390 201 99
20,000 1,053 392 204 100
25,000 1,064 394 204 100
50,000 1,087 397 204 100
100,000 1,099 398 204 100
>100,000 1,111 400 204 100
a = Assumption of normal population is poor (Yamane, 1967). The entire population should be sampled.
Source: Yamane, 1967

Own analysis, 2014; based on SPSS data analysis 20.0
Annex V Nonparametric Correlations Analysis
Correlations
Cust.Satis
Tang Reliab Responsiv
Assur Empathy
U/writing
Claims C/handlg
Spearman's rho
Cust Satis
Correlation Coefficient
1.000 .939** .928** .922** .920** .919** .941** .930** .947**
Sig. (2-tailed) . .000 .000 .000 .000 .000 .000 .000 .000
N 94 94 94 94 94 94 94 94 94
Tang
Correlation Coefficient .939** 1.000 .926** .901** .893** .898** .951** .944** .835**
Sig. (2-tailed) .000 . .000 .000 .000 .000 .000 .000 .000
N 94 94 94 94 94 94 94 94 94
Reliab
Correlation Coefficient .928** .926** 1.000 .968** .957** .964** .961** .976** .820**
Sig. (2-tailed) .000 .000 . .000 .000 .000 .000 .000 .000
N 94 94 94 94 94 94 94 94 94
Respons
Correlation Coefficient .922** .901** .968** 1.000 .987** .996** .938** .945** .816**
Sig. (2-tailed) .000 .000 .000 . .000 .000 .000 .000 .000
N 94 94 94 94 94 94 94 94 94
Assur
Correlation Coefficient .920** .893** .957** .987** 1.000 .983** .929** .934** .818**
Sig. (2-tailed) .000 .000 .000 .000 . .000 .000 .000 .000
N 94 94 94 94 94 94 94 94 94
Empathy
Correlation Coefficient .919** .898** .964** .996** .983** 1.000 .935** .941** .814**
Sig. (2-tailed) .000 .000 .000 .000 .000 . .000 .000 .000
N 94 94 94 94 94 94 94 94 94
U/writing
Correlation Coefficient .941** .951** .961** .938** .929** .935** 1.000 .981** .836**
Sig. (2-tailed) .000 .000 .000 .000 .000 .000 . .000 .000
N 94 94 94 94 94 94 94 94 94
Claims
Correlation Coefficient .930** .944** .976** .945** .934** .941** .981** 1.000 .820**
Sig. (2-tailed) .000 .000 .000 .000 .000 .000 .000 . .000
N 94 94 94 94 94 94 94 94 94
C/handling
Correlation Coefficient .947** .835** .820** .816** .818** .814** .836** .820** 1.000
Sig. (2-tailed) .000 .000 .000 .000 .000 .000 .000 .000 .
N 94 94 94 94 94 94 94 94 94
**. Correlation is significant at the 0.01 level (2-tailed).
Related Documents