Effectiveness of SEZs Over EPZs Structure: The Performance at Aggregate Level Malini L Tantri

Welcome message from author
This document is posted to help you gain knowledge. Please leave a comment to let me know what you think about it! Share it to your friends and learn new things together.
Transcript

Effectiveness of SEZsOver EPZs Structure:The Performance atAggregate Level
Malini L Tantri
ISBN 978-81-7791-104-6
© 2010, Copyright ReservedThe Institute for Social and Economic Change,Bangalore
Institute for Social and Economic Change (ISEC) is engaged in interdisciplinary researchin analytical and applied areas of the social sciences, encompassing diverse aspects ofdevelopment. ISEC works with central, state and local governments as well as internationalagencies by undertaking systematic studies of resource potential, identifying factorsinfluencing growth and examining measures for reducing poverty. The thrust areas ofresearch include state and local economic policies, issues relating to sociological anddemographic transition, environmental issues and fiscal, administrative and politicaldecentralization and governance. It pursues fruitful contacts with other institutions andscholars devoted to social science research through collaborative research programmes,seminars, etc.
The Working Paper Series provides an opportunity for ISEC faculty, visiting fellows andPhD scholars to discuss their ideas and research work before publication and to getfeedback from their peer group. Papers selected for publication in the series presentempirical analyses and generally deal with wider issues of public policy at a sectoral,regional or national level. These working papers undergo review but typically do notpresent final research results, and constitute works in progress.

EFFECTIVENESS OF SEZs OVER EPZs STRUCTURE:
THE PERFORMANCE AT AGGREGATE LEVEL
Malini L Tantri1
ABSTRACT
Empirical evidence on the effectiveness of SEZs policy over EPZs structure is analysed in this paper by aggregating data of seven conventional SEZs from 1986-87 to 2007-08. The study reveals that the introduction of SEZs in place of its predecessor, the EPZs, is having a significant and positive impact on its performance at the aggregate level. However, in terms of contribution to national trade, the Indian SEZs are lagging way beyond the expectations of policymakers. Further, the SEZ policy does not seem to be successful in diversifying exports basket, which in turn has affected the direction of exports by SEZs. Moreover, these zones were found to be highly susceptible to external shocks. Thus, we strongly argue in favour of a care in deciding the sectoral choice of SEZs and careful scrutiny of its approval across major Indian States.
Introduction
Free Trade Zones (FTZs)/Export Processing Zones (EPZs) were promoted in India during the “Import
Substitution Industrialization (ISI)” period (1964-65). This can be termed as an early attempt to check
the possibilities of switching to export promotion strategies, but in a different way. Undoubtedly, the
EPZs policy is termed as a successful initiative undertaken during the ISI regime. However, it failed to
create the most needed economic space due to lack of a well-structured policy and trade sector
controls. During this phase it was noted that the failure was on account of the most -needed incentives
structure compared to those available elsewhere (Tandon, 1980) and the poor institutional and
infrastructure facilities in these zones (Aggarwal, 2004 and 2005).
The changes in the economic policy during the 1990s altered the trade situation significantly.
Fist, it was the acceptance of opening of the trade and followed by the various measures to promote
trade as the major strategy among the growth initiatives (Deepika and Deshpande, 2003). One can see
four broad changes in the trade policy in the last two decades. First, the regulations in the trade sector
were relaxed across the board and on the most important tradable goods. Second, the procedures were
made simple and special care taken to improve participation of different actors. Third, the export sector
was incentivized in terms of processes/procedures and fourth, the EPZ policy was reformulated to suit
the Special Economic Zones (SEZ) policy. In this context, during late the 1990s, a visit to China by a
high-level delegation led by the then Minister of Commerce and Industry, the late Murasoli Maran,
changed the course of the EPZ policy in India. Based on their recommendations, the Government of
India in its EXIM policy statement of 1997-2002 announced a policy to rejuvenate the EPZs structure
1 PhD Scholar, Institute for Social and Economic Change (ISEC), Nagarabhavi, Bangalore 560072, E-Mail
I acknowledge with gratitude the comments and suggestions made by my Supervisor, Prof R. S. Deshpande, Director, ISEC. I am also grateful to two anonymous referees for their comments on the earlier draft. However, usual disclaimers apply.

2
and to unplug the loopholes to effect the transmutation into the SEZ policy. Thus, SEZs in the present
context have their origins traced to the ‘qualitative transformation’ of the conventional EPZs of the
country (Government of India, 2000). The erstwhile EPZs continued to function under the new name
and regime defined under the SEZ policy with an added vigor but essentially continuing the same
operations. They were also bestowed with leadership in the SEZ family as being the early starters.
The qualitative transformation was engineered by allowing 100 per cent FDI inflow through
automatic channels, exemption from daily customs examination of export and import cargo, allowing
import on self-certification basis and other measures (Government of India, 2000). Thus, compared to
EPZs, the current SEZs policy has more clarity and it is focused not only in terms of objectives but also
in terms of institutional arrangements. In this connection, the purpose of this paper is to trace how the
changes in the focus of the policy are effective in improving the performance of the SEZs. In particular,
we are analyzing here how these SEZs were performing under the EPZs structure and how the
interventions through the SEZs policy were successful in promoting t rade dynamics. In this context , the
earlier studies (Kumar 1987; Kumar, 1989; Kundra, 2000; Agaarwal, 2004 and 2005; Shah, 2009)
analysing trade performance of Indian EPZs/SEZs show a few limitations. First, these studies focused
largely on EPZs performance in general and did not clearly bring out the role of the EPZs/SEZs in
promoting trade. Second, most of these studies are dated and lack rigorous analyses of the
effectiveness of SEZs over EPZs. Though Shah (2009) sketches the trade performance up to 2007-08,
but did not touch the question of the relative effectiveness of SEZs over EPZs in the country. Given the
limitations associated in the existing literature on SEZs, this paper locates the effectiveness of SEZs over
EPZs.
The analysis is based on the aggregated data collected from the seven conventional SEZsi,
namely, Kandla, Santacruz, Noida, Cochin, Chennai, Falta and Vizag ii. Meanwhile, in order to
substantiate the secondary findings the author’s extended first-hand fieldwork in these seven zones is
utilised to validate the findings. The analysis is carried out for the period 1985-86 to 2007-08iii. The
time-period under consideration is long enough to analyse the effectiveness of the SEZs policy, enacted
in 2000-01, compared to that of the EPZs. The following section provides a brief description of the
evolution of FTZs to current SEZs policy in India. This is followed by an analysis of the empirical
evidence of the effectiveness of SEZs over EPZsiv in the country, with special reference to trade
performance. The last section summarises the paper.
A Brief on Historical Steps Covered from Free Trade Zone to Special
Economic Zones in India
India was the first among the developing countries, specifically in Asia, to experiment with the system
of ‘special enclaves’ for promotion of trade in the 1960s. The Kandla SEZ came into existence on the
western coast of Gujarat in 1965 as the first FTZ. It came into existence five years after the government
took the decision in this regard. Almost a decade later, the Government of India took a decision to set
up the first EPZ in Bombay (1974-75), known as the Santacruz EPZ (SEEPZ) for the development of the
electronics sector. If we look at the nomenclature alone, Santacruz becomes the first EPZ of the
country, and Kandla was the first and only FTZ in the country. Quite erroneously, most of the earlier

3
studies on SEZs reported Kandla as the first EPZ of the country. Other than nomenclature, the major
difference between the two initial attempts lies in the history and prime objectives of their promotion.
The early thought of creating the first FTZ of the country came soon after independence. It was put
forwarded to promote the Kandla Port as a substitute to the Karachi Port, which India lost at the time of
partition (IIFT, 1990). The Santacruz EPZ on the other hand was proposed by the Trade Development
Authority for the promotion of the electronics industry after taking into consideration the growing
international demand for the same. In 1986-87, the Governme nt decided to carve out a jewellery sector
in the SEEPZ for the export of gems and jewellery. The Kandla and Santacruz zones were followed by a
few more based on the recommendations of the Tandon Committee Report (1980), which stressed the
importance of such zones in the process of economic growth, specifically to boost the export s of the
country. These include, EPZs at Chennai, Cochin, Noida, Falta and Vizag. Except for the Vizag EPZ,
which became operational in 1994, all the other zones commenced economic activities in 1985-86. The
Central Government owned all these seven EPZs since there was no policy provision for the entry of
private sector either through the concerned State Government s or through private investment.
Nevertheless, the private investors were encouraged with incentives to establish units in the zones
and/or take up joint venture.
In the wake of new economic policy beginning in the early 1990s certain changes in the
structure and ownership pattern of these zones were effected. These actually began in 1994 with the
Government of Indiav allowing State Government and private sector participation in the promotion of
EPZs in the country. In this context, the first private EPZ came into existence in 1994 at Sachin Surat
exclusively promoted for diamond export. It was followed by a few more interventions to address the
structural problems of the transmuted EPZs. Arrora (2003) (Cited in Aggarwal 2004) identified nearly
164 circulars on EPZs/Export Oriented Units (EOUs) issued by the Government of India during early
1990s to bring about the rapid changes. The major shift noticed under the new SEZs policy is
mentioned in the EXIM Policy statement of 1997-2002 as a ‘qualitative transformation’ of the
conventional EPZs of the country (Government of India, 2000). It has given a legal framework in 2005,
through enacting the SEZs Act, 2005 followed by SEZs Rule, 2006. Besides this, every participating
State Government s have enacted State specific SEZs Acts and policies. These State specific SEZs
policies helped to locate their orientation along with the State specific requirements. As against the
earlier practices under the EPZs regime, the new SEZs policy allows these enclaves to operate as public,
private and joint ventures and/or in collaboration with the State Government. The economic activities
within these enclaves are encouraged in manufacturing, service and/or trading units, thereby providing
for larger areas of operation.
The SEZs policy enacted in the country could be seen as coming in two different phases.
Initially, all existing EPZs were converted under the SEZs regime in two different phases. As per the first
ordinance the EPZs of Kandla, Santacruz, Cochin and, Surat were initially brought under the SEZs
framework in 2000. On the other hand, the EPZs of Noida, Falta, Chennai and Vizag were converted in
2003. This was later followed by fresh approval for different projects under the banner of SEZs. By
February 10, 2010, on a very large scale, 578 SEZs were given formal approval and 348 SEZs were
not ified. The total number of operating SEZs in the country now stands at 105 (www.sez.nic.in).

4
However, the State and sector wise distribution of formal approvalvi of SEZs presents a few glaring
inequities. State wise, the developed States like Maharashtra, Andhra Pradesh, Tamil Nadu and
Karnataka received more number of approvals. The share of the other States is just 33.39 per cent of
the total SEZs approved in the country (Figure 1a). Within the developed States, the SEZs are located in
a few districts, which are above the national average in number of development parameters
(Mukhopadhyay, 2009). This in turn is assumed to have adverse an impact on urban planning due to
congestion and diseconomies of scale (Mitra, 2007); specifically, these zones may ruin the existing
infrastructure without actually adding to the infrastructure base in the country (Mukhopadhyay and
Pradhan, 2009). Thus, if proper attention is not paid it may aggravate the problem of regional disparity
in India. Sector wise, on the other hand, IT/ITes/electronics industries received maximum approval in
the country (Figure 1b). This pattern, further, comes in conflict with the argument put forth in the
promotion of these enclaves as efforts to develop a strong industrial base in the country and mitigate
the problems of unemployment.
Figure 1a: State wise Distribution of SEZs Approval (Formal) in the country
Source: www.sez.nic.in
Figure 1b: Sector wise Distribution of SEZs Approval (Formal) in the country
Source: www.sez.nic.in

5
Performance at the Aggregate Level
Trends in Trade through SEZs
The basic purpose of the SEZs policy is to enhance production of exportable commodities in an
environment free of the usual constraints of the domestic industry. Therefore, trends in EPZs/SEZs
trade can be seen as a proxy for analysing the effectiveness of the policy and this has been explained in
this section. The EPZ/SEZ existed since 1960s and hence it will not be erroneous to look into the trends
from 1985-86 to 2007-08. The focus of the exercise is to assess how these enclaves were performing
initially under EPZs policy and were there any significant breaks in the trends especially after 2000,
following introduction of the SEZs policy.
Table 1 presents the time series data on SEZs exports and import s (expressed in Rs crore at
Constant Prices) for the period between 1986-87 and 2007-08 (reference period of the study).
Table 1: Trade Scenario of EPZs/SEZs (for major few years from 1986-87 to 2007-08)
(Values are in Rs Crore and at Constant prices)
Year Total SEZs Export Total SEZs import NFE
Value Growth rate (Per cent) Value
Growth rate (Per cent) Value
Growth rate
1986-87 975.96 624.3874 351.57
1990-91 1822.54 17.02 1181.621 13.13 640.92 24.93
1995-96 3896.51 14.91 2641.943 33.28 1254.56 -10.94
1999-00 6716.23 23.53 3032.003 37.29 3684.22 14.11
2000-01 10053.62 49.69 3583.341 18.18 6470.28 75.62
2001-02 8009.60 -20.33 4456.741 24.37 3552.86 -45.09
2002-03 8323.65 3.92 5183.047 16.30 3140.61 -11.60
2003-04 9781.32 17.51 5968.612 15.16 3812.71 21.40
2004-05 12575.74 28.57 8983.272 50.51 3592.47 -5.78
2005-06 15428.38 22.68 9667.567 7.62 5760.82 60.36
2006-07 17508.71 13.48 11670.85 20.72 5837.86 1.34
2007-08 21195.77 21.06 15832.97 35.66 5362.80 -8.14
Trend Growth Rate (CAGR)
1986-87 to 2007-08 16.90 18.30
Source: Based on the data collected from the Seven Conventional SEZs Development Commissioner Office Note: Growth rate is the percent changes over the preceding year
Altogether, one can note two major breaks in the trends in EPZs/SEZs trade performances
during these years. The first break in trend is noticeable in the early 1990svii. This positive development
in trade performance could be attributed to two major policy developments. First, there was
improvement in the general economic scenario of the country, in the post -reform period, particularly,
the reduced tariff rate, relaxation in quantitative restrictions on exports and imports and the measures

6
undertaken to rationalize the exchange rate. The second is related to specific policy initiates undertaken
to carry out reforms in the EPZs framework and the most important among them includes permission
for DTA sale up to 25 per cent of production on payment of 50 per cent custom duties and allowing the
role of the State and private sectors in the EPZs structure of the country. It implies that though these
zones are considered as exclusively separate economic entities the general macroeconomic framework
and corresponding business climate of the country vastly influences the outcome of these zones along
with specific policy initiatives addressed to SEZs. This in turn also explains implicitly the factors
responsible for the poor performance of EPZs up to 1990s.
The second, break is noticed in 2000-01 following the introduction of the SEZs policy in the
country. Within eight years of introducing the SEZs policy in the country, the value of exports generated
from seven conventional SEZs of the country increased almost three-fold. In 1999-2000, the value of
SEZs exports was around Rs 6 crore in and in at the end of 2007-08, it was Rs 21,000 crore. Except for
2001-02, SEZs exports have shown positive trends but with greater volatility (Table 1). A setback in t he
value of exports and its growth rate noticed in 2001-02 could be due to the switchover of couple of
units from EPZs framework to EOUs rather than accept SEZs schemeviii. In the Vizag SEZ, for instance,
units like Synergies (an exporting unit), which were dominating the trade scenario preferred to shift
their economic base from EPZs activities to EOUs. This had a corresponding impact on the trade
performance of the Vizag SEZix. On the eve of the withdrawal of Synergies, the export value of the
Vizag SEZ fell from Rs 1,956 crore in 2002-03 to Rs 534 crore in 2003-04. Further, between 2000 and
2003, a decline in the number of exporting units in most of the seven conventional SEZs was noticed.
For instances in the case of the Kandla and Santacruz SEZs, the number of exporting units dropped,
respectively, from 129 to 109 and 150 to 103 between 1999-2000 and 2000-01x, though it increased in
the subsequent year.
It is very interesting to note that in line with the break in SEZs exports in 2000-01 a similar
pattern could be seen with respect to India’s exports trend (Figure 2.1a and 2.1b). There was an
increase in the exports value for one year (2000-01) and a dip in the next financial year - similar to the
case of SEZs exports. This reveals the growing dependence of India’s exports on SEZs exports and
henceforth indicates the need to re-engineer the SEZs structures in the country. The value of imports of
the SEZs, on the other hand, displayed more or less similar patterns of growth in the reference period.
However, it should be noted that, despite an increase in the gross value of exports there was not much
increase in the net foreign exchange earnings form these enclaves. In fact, the net foreign exchange
earnings from these enclaves for 2007-08 are less than that of 2000-01. Even in the context of other
Asian EPZs/SEZs, a similar pattern of higher gross exports but failure to reflect the same in NFE is found
(Amirahamdi and Wu, 1995). Moreover, in the current SEZs regime there are variations in growth rates
of net foreign exchange earnings compared to the same figure during EPZs regime.

7
Figure 2a: Trend in SEZs Exports
0
5000
10000
15000
20000
25000
1986
-87
1988
-89
1990
-91
1992
-93
1994
-95
1996
-97
1998
-99
2000
-2001
2002
-2003
2004
-2005
2006
-2007
Year
In R
s C
rore
Source: Based on the data collected from Seven Conventional SEZs Development Commissioner Office
Figure 2b: Trend in India’s Exports
Source: Computed from data collected from RBI Annual report, 2007-08
At the aggregate level, exports earnings from these zones recorded a steady increase during
the period under analysis. This expansion in exports, among others,xi could be due to the increase in
the number of zones and corresponding increase in the number of exporting units in each zo ne or
improvement in productivity. As one can see in Figure 3, over the years the number of exporting units
in the seven SEZs increased from one in 1964-65 to 985 by the end of 2007-08. In this regard a few
interesting observations emerge. One, there was a steady increase in the entry and operation of
exporting units in EPZs after the commencement of the Santacruz EPZ in 1975 and others in 1986-87.
Corresponding to this, there noted a steady increase in their growth rates (Figure 4). This indicates the
positive response of investors to the new policy of the Government. Two, a few units, especially in
Kandla and Falta, closed down in the early 1990s due to the disintegration of the USSR which was a
major trade partner for these zones.
Further, the East Asian crisis of the late 1990s also had an impact on the performance of the
Kandla, Chennai and Cochin SEZs both in terms of value of exports and number of exporting units. This
leads us to support the argument of Wong and Chu, that “…. EPZs are vulnerable to changing
conditions in the world economy, such as recessions and inflation, which may bring about extensive
B
C
A

8
closures and lay-off” (1985; p 20-21). However, we have seen that the exposure to such vulnerable
conditions depends on the type and intensity of association of these enclaves with the world economy.
If investments in such enclaves are largely dominated by foreign investments and in a particular sector,
then it will not only result in a sudden drop in investments but also a decline in the value of the exports
and a fall in employment generated in these enclavesxii. Thus, these enclaves may act as agent s to
percolate the global chain of recession and/or inflation into the different sectors of the domestic
economy. The capacity to cope with such vulnerable conditions, depends upon, among others things, on
the diversity of the SEZs export baskets and their trading partners. For instance, the disintegration of
the USSR in the early 1990s hardly had any negative impact with respect to performance of the
Santacruz, Noida and Chennai zones due to their sectoral composition, which was also helpful in
shaping their trading partners. Thus, along with the promotion of such enclaves it is also equally
important to diversify their export baskets and trading partners. Three, as outlined above , the negative
growth rates observed in the exporting units in 2000-01 were due to the switch over of a few units from
the EPZs scheme to the EOUs. Despite the steady increase in exporting units over the last eight years,
these zones are not occupied to full potential given their total size as argued by Aggrawal (2004).
Figure 3: Trend in Total-Exporting Units in EPZs/SEZs
0
200
400
600
800
1000
1200
1966
-67
1975
-76
1985
-86
1991
-92
1993
-94
1995
-96
1997
-98
1999
-00
2001
-2002
2003-20
04
2005
-2006
2007
-2008
Year
In U
nits
Source: Based on the data collected from Seven Conventional SEZs Development Commissioner Office
Figure 4: Annual Growth Rate of Exporting Units in EPZs/SEZs
-15.00
-10.00
-5.00
0.00
5.00
10.00
15.00
20.00
25.00
30.00
1985
-86
1987
-88
1989
-90
1991-9
2
1993-9
4
1995-9
6
1997-9
8
1999-0
0
2001
-.02
2003
-.04
2005
-.06
2007
-.08
Year
Per
cen
t
Source: Based on the data collected from Seven Conventional SEZs Development Commissioner Office

9
In line with the increase in the number of exporting units, it would be quite interesting to see
corresponding changes in productivity. This is referred to as average unit productivity of SEZs and is
analysed here (Figure 5). It is good to observe positive and steady increase in the productivity. Up to
the 1990s per unit exports, was around Rs 2 crore . It was in the post liberalisation period, especially
post-SEZs regime, that a steady increase from single digit to double digit s was recorded. In 2007-08,
exports worth Rs 21.52 crore were generated from each exporting unit. This implies that exporting units
turned to be more competitive and productive particularly after the implementation of SEZs policy.
Figure 5: Trends in per Exporting Units Productivity of EPZs/SEZs
0
5
10
15
20
25
Year
1987
-88
1989
-90
1991
-92
1993
-94
1995
-96
1997-98
1999-00
2001
-02
2003
-04
2005-06
.
2007-08
.
Year
In R
s C
ore
rs
Source: Computed from data collected from the Offices of the Development Commissioner Note: Values are in Rs crores at Constant Prices
The Performance in the Current SEZs Period (2000 onwards)
We now turn towards the question, whether there is any break in terms of the performance of the SEZs
after 2000-01, the period that witnessed introduction of the new SEZs policy to replace the EPZs
structure of the country. It is clear from the graph 1 that there was a structural break in 2000-01
(Figure 1a). In the absence of any policy changes one could have expected growth in the exports of the
SEZs to the tune of AB, whereas due to policy interventions SEZs exports grew at the rate of AC. A
similar pattern can be traced in the case of exports generated per exporting unit (Figure 4). To
substantiate the results (obtained through graphical representation), we carried out the structural
stability (Dummy) regression modelxiii. The Functional Form of the Structural Stability Regression is as
follows:
Y = α 1+α 2D1+β 1t t+β 2(Dt)+ut ……………………… (1)
In this,
Y = Exports;
D = Dummy variable. It takes value 0 for EPZs period (1986-87 to 1999-2000) and one
during SEZs period (20001-01 to 2007-08)
T = Time period
In this model, whether the introduction of SEZs policy in the place of its predecessors namely,
EPZs, has any significant impact on the performance is explained based on the significance of the
coefficients of the dummy intercept and slope coefficients. If both are statistically significant then it
10
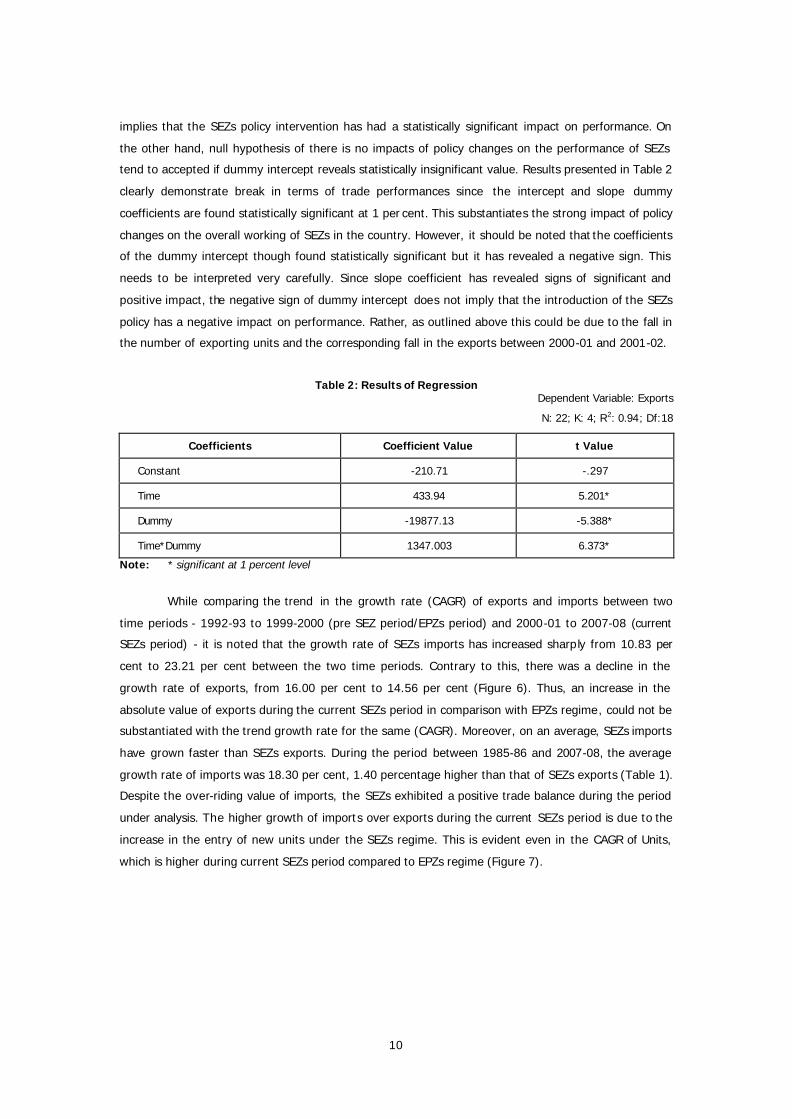
implies that the SEZs policy intervention has had a statistically significant impact on performance. On
the other hand, null hypothesis of there is no impacts of policy changes on the performance of SEZs
tend to accepted if dummy intercept reveals statistically insignificant value. Results presented in Table 2
clearly demonstrate break in terms of trade performances since the intercept and slope dummy
coefficients are found statistically significant at 1 per cent. This substantiates the strong impact of policy
changes on the overall working of SEZs in the country. However, it should be noted that the coefficients
of the dummy intercept though found statistically significant but it has revealed a negative sign. This
needs to be interpreted very carefully. Since slope coefficient has revealed signs of significant and
positive impact, the negative sign of dummy intercept does not imply that the introduction of the SEZs
policy has a negative impact on performance. Rather, as outlined above this could be due to the fall in
the number of exporting units and the corresponding fall in the exports between 2000-01 and 2001-02.
Table 2: Results of Regression Dependent Variable: Exports
N: 22; K: 4; R2: 0.94; Df:18
Coefficients Coefficient Value t Value
Constant -210.71 -.297
Time 433.94 5.201*
Dummy -19877.13 -5.388*
Time*Dummy 1347.003 6.373*
Note: * significant at 1 percent level
While comparing the trend in the growth rate (CAGR) of exports and imports between two
time periods - 1992-93 to 1999-2000 (pre SEZ period/EPZs period) and 2000-01 to 2007-08 (current
SEZs period) - it is noted that the growth rate of SEZs imports has increased sharply from 10.83 per
cent to 23.21 per cent between the two time periods. Contrary to this, there was a decline in the
growth rate of exports, from 16.00 per cent to 14.56 per cent (Figure 6). Thus, an increase in the
absolute value of exports during the current SEZs period in comparison with EPZs regime, could not be
substantiated with the trend growth rate for the same (CAGR). Moreover, on an average, SEZs imports
have grown faster than SEZs exports. During the period between 1985-86 and 2007-08, the average
growth rate of imports was 18.30 per cent, 1.40 percentage higher than that of SEZs exports (Table 1).
Despite the over-riding value of imports, the SEZs exhibited a positive trade balance during the period
under analysis. The higher growth of imports over exports during the current SEZs period is due to the
increase in the entry of new units under the SEZs regime. This is evident even in the CAGR of Units,
which is higher during current SEZs period compared to EPZs regime (Figure 7).

11
Figure 6: Compound Annual Growth Rate of EPZs & SEZs Trade
23.21
14.56
10.83
16.00
0.00
5.00
10.00
15.00
20.00
25.00
Exports Imports Exports Imports
EPZs SEZs EPZs & SEZs Policy
Per
cent
Source: Based on data collected from the seven Conventional SEZs Offices of the Development Commissioner
Figure 7: CAGR of Exporting Units during EPZs and SEZs Regime
0.00
1.00
2.00
3.00
4.00
5.00
6.00
7.00
EPZs SEZs
Policy
perce
nt
EPZs SEZs
Source: Based on data collected from the seven Conventional SEZs Offices of the Development Commissioner
Trade Participation of SEZs
Based on the above fact s, one cannot gather only pessimistic views about Indian SEZs. Moreover,
absolute comparison may not be the right approach for understanding the export intensity of SEZs. The
dynamics of SEZs can be captured only through its status in the country’s trade scenario. This, in the
present context is analysed by measuring the EPZs/SEZs share in the country’s total trade. The
contribution of EPZs/SEZs to the country’s exports and imports, presented in Figure 8, shows a positive
increase over the years. During the 1970s, the contribution of the SEZs in the exports and imports of
the country was, respectively, 0.02 and 0.03 per cent. In the last 25 years, the SEZs share in country’s
exports and imports has shown a gradual increase with a few major breaks in trend. One can notice
that between 1980-81 and 1985-86 the EPZs share in country’s exports and imports picked up very
sharply from 0.67 and 0.22 to 3.05 and 1.02 respectively. This sudden rise in EPZs share in India’s trade
is due to emergence of gems and jewellery sector in the Santacruz EPZ. On the other hand in the
current SEZs period (after 2000), there was a decrease in the contribution of the SEZs for two
consecutive time-spans (from 2000-01 to 2002-03) because as per the Government’s new ordinance, all
working EPZs were converted into SEZs at two different stages. Consequently, a couple of units, which
were willing to concentrate on the domestic market, switched their economic base from EPZs to EOUs
rather than get into the SEZ regime. Focusing attention on the period from 2000-01 to 2007-08, during

12
which the EPZs policy was substantially liberalised with the imposition of the SEZs framework, an
upward trend was noticed in the relative share of the SEZs in exports and imports after an initial two-
year fall in the same. However, the value of the exports of all working SEZs in India for 2007-08
accounts for about 10 per cent of country’s total exports, which is a highly appreciable developmentxiv.
However, if we compare the contribution of such enclaves in other countries it is noted that Indian SEZs
are way below in performance. For example, the Shenzhen SEZ alone contributed 14 per cent of China’s
total trade for 2005-06 (CSY, 2006 and SZSY 2006). Within Asian zones, the Indian SEZs are not
comparable with those of Bangladesh and Sri Lanka (Aggrawal, 2005) thereby emphasizing a larger
scope for further expansion in its performance.
Figure 8: EPZs/SEZs Share in Country’s Exports and Imports
0
1
2
3
4
5
6
1970
-71
1980
-81
1986
-87
1988
-89
1990
-91
1992
-93
1994
-95
1996
-97
1998-9
9
2000-2
001
2002
-2003
2004-2
005
2006
-2007
Year
In P
er C
ent
Share in Country's Export
Share in Country's Import
Source: Based on data collected from the Offices of the Development Commissioner and RBI Annual Report
2007-08 Note: Values are in percent
Structure of SEZs Exports
Having analysed the trends in exports and imports it would be quite interesting to trace the changes in
the composition of the SEZs trade. It is especially important because the major concern of the trade
policy is not only associated with higher exports earnings but also in diversifying the commodity and
sectoral composition of exports, particularly towards high value exports. Theoretical arguments in
favour of diversification of exports originate from two different views. The first theoretical justification
dates back to the 1950s in line with the thesis put forwarded by Nurkse (1953) and Prebisch (1959).
Nukse sketches the poor performance of the LDC as due to the composition of their exports, which is
primarily inelastic in demand. Prebisch, on the other hand, illustrated its consequences in terms of the
deteriorating terms of trade. Convinced by the theoretical arguments and empirical evidence, most of
the developing countries in the 1960s and 1970s changed trade policies to diversifying their exports.
The second theoretical justification in favour of diversification of exports was based on the argument of
a possible correlation between instability and diversification of exports. Instability of exports in most of
LDCs is put forward as a consequence of higher sectoral and geographical concentration which
eventually was assumed to affect the overall growth of the country in questionxv.

13
In this context, it is to be noted that Indian EPZs, specifically the Santacruz EPZ, was initiated
for diversifying India’s exports, specifically in electronic products. This was later followed by promoting
gems and jewellery in the Santacruz EPZ. Moreover, one of the stated objectives of the current SEZs
policy is to diversify India’s trade. Thus, the effectiveness of EPZs/SEZs in diversifying exports as well as
the changes over the years is analysed in this section. This is explained by presenting the structure of
SEZs exportsxvi under broad sector divisions for a number of years between 1986-87 and 2007-08.
Figure 9: Structure of SEZs Exports, by Broad Sector Divisions
(1986-87 to 2007-08)
Source: Based on Data collected from the seven Conventional SEZs Offices of the Development Commissioner
From figure 9, it is evident that until the mid-Eighties, chemicals and pharmacy followed by
electronics goods had the highest share in the total trade of the country. They accounted for almost 66
per cent of the total exports of SEZs for 1985-86. This is followed by engineering and textile garments.
The early 1990s witnessed changes in the composition of exports largely due to emergence of gems
and jewellery units in Santacruz EPZ in the late 1980s. Since t hen gems and jewellery units, followed by
electronics industries, have been dominating the composition of exports in these special enclaves.
Currently gems, jewellery and electronics together contribute almost 77 per cent of the total
conventional exports of SEZs of the country. The maximum share generated by the Santacruz SEZ,
which is exclusively allowed to promote these two sectors. Despite having multi-product base, the SEZs
are, disappointingly, influenced by the two sectors namely gems and jewellery and electronics. This
could also be one of the factors for the poor performance of Indian SEZs in comparison with their
counterpart somewhere else.
The changes over the years in the direction of trade reveals whether the country’s trade is
concentrated in only a few countries or has to diversify in terms of its reach to different markets. To
understand this direction we have presented SEZs exports to a few major countriesxvii. As can be seen in
Figure 10, over the years USA has emerged as one of the prominent trade partners of the SEZs in India.
This is especially due to changing sectoral composition of SEZs exports, which is dominated by the
gems, jewellery and electronics, which is concentrated in USA. The share of other countries, on the
other hand, has reduced gradually from 59 per cent in 1990-91 to 38 per cent in 2007-08. The reason
for the concentration of SEZs exports on a few markets is due to the sectoral composition, which is
restricted to few products. Thus, contrary to the argument of Aggarwal (2004), which relate changes in

14
the sectoral composition to changes in the trading partner of SEZs, our findings suggest that over the
years, changes in the direction of exports have been in line with the changes in the sectoral composition
of SEZs exports. This is because, as per present understanding of comparative advantage, a country
tends to enter into international trade based upon its comparative advantage and factor endowments;
whereas the availability of international market alone does not determine the composition of exports,
which is quite difficult at least in the short run. Thus, unless the government take steps to diversify its
exports it would be quite difficult to diversify its reach in the international market. Further, it is seen
that due to a common sectoral composition of these enclaves, zones tend to compete with each other in
the same international market.
Figure 10: Direction of EPZs/SEZs Exports
(1986-87 to 2007-08)
U.S.A.
U.K.
Germany
Singapore UAE
Other
0
10
20
30
40
50
60
70
1990-91 1995-96 2000-2001 2005-2006 2007-2008 Year
Per
Cen
t
Source: Based on Data collected from the seven Conventional SEZs Offices of the Development Commissioner
Summary
In this paper, the empirical evidence to analyse the effectiveness of the SEZs policy over the EPZs
structure of the country is put together. It is observed that the introduction of the SEZs policy has had a
positive and significant impact on the working structure of these enclaves. The performance of the SEZs
in terms of their share in the country’s trade presents an optimistic picture but still is not comparable to
the SEZs in other countries. An analysis of the trend of India’s exports, vis-à-vis with SEZs exports,
reveals that changes enacted in the SEZs policy left its imprints on the total value of exports. This
underlines the growing dependence of India’s export on the growth and performance of SEZs. At the
same, it is noticed that the general macroeconomic structure and business environment of the economy
significantly shapes the overall working of these zones. Thus, it establishes the bidirectional relation
between SEZs and rest of the economic scenario.
Moreover, these enclaves were noted to be highly sensitive to any changes in the global
economy in terms of global slowdown or inflation. The capacity to withstand against it depends on how
well the SEZs are diversified in terms of products and trading partners. Thus, along with building up of
trade-related infrastructure in the context of SEZs, it is equally important to diversify the exports of

15
these enclaves, which may require more elaborate macroeconomic policy support. However, the SEZs
policy in the present context has not been very successful so far in diversifying exports. This has a
strong policy implication as aptly remarked by Kundra: ‘instead of establishing multi-product SEZs, the
State should promote two or three product -based SEZs’ (2000, pp-74) from both efficiency and cost
point of view. Thus, instead of directing and assessing these SEZs on policy objectives, their
development and performance should be guided by the existing comparative advantages (Wong 1987).
The most important task to be undertaken, in this regard, is to identify each region’s comparative
advantage in factor endowment and production. Theoretically, also, the exports to be promoted from a
region and/or an attempt to attract foreign investments should reflect the factor endowment or else it
may result in under utilization of resources due to non-availability of the required factors at reasonable
costs and other supporting mechanism. Moreover, unless the Government take s serious steps to
diversify its exports, it would be difficult to diversify its reach in the international market as well. This
will make these enclaves more susceptible to changes in the world economy through either recession
and/or inflation. A scrutiny of the newly approved SEZs in the country further mirrors the mal-
adjustment not only in terms of sectoral composition but also in terms of SEZs approval across the
States. It is clear that the developed States have received maximum approval and backward States are
lagging even in attracting the attention of investors. This, thereby, indicates the problem of regional
disparity, which may aggravate in future if adequate remedial measures are not initiated. Moreover, we
know a little about the performance of these enclaves at the disaggregated level and way to boost the
performance of poor performing zones. We sum up without any further addition that there is a need to
restructure the SEZs scheme in the country, specifically by identifying the problems and prospects in
expansion rather than just extending liberal incentive schemes.
End Notes
i Currently operating SEZs in the country could be categorized under two major types, viz., Conventional SEZs and Modern/new SEZs. Conventional SEZs are those which were operating under the EPZs structure of the country, and currently brought under the SEZs scheme. Modern SEZs, on the other hand are those which got approval after the enactment of SEZs policy in the country.
ii The zones were set up respectively in 1964-65 (KSEZ), 1974-75 (SSEZ), 1986-87 (CSEZ, MSEZ, NSEZ, FSEZ) and 1989-90 (VSEZ)
iii Though the present analysis is restricted to the period from 1986-87 to 2007-08, but wherever necessary, we have provided the scenario as it existed in the 1970s and 1980s.
iv In the present analysis, EPZs and SEZs are used synonymously v Under Indian Constitution, trade is on Central List vi The SEZs approval in the country could be categorized under two heads, namely, in-principle and formal SEZs.
The classification is based upon the stage of approval of the SEZs. In the case of in-principle approval, the developer gets approval considering the plan of the SEZs projects. Formal approval, on the other hand, is the final approval for SEZs projects from the BoA
vii In addition to this, the late 1980s has also seen improvement in exports by these enclaves the number of zones operating in the country increased from two to six.
Besides this, the early 1970s also witnessed changes in the trend of SEZs exports. This break in trend was in analogous with the India’s exports. At this particular juncture, the country’s exports (in value terms) more than doubled due to depreciation of the Indian currency. As Nayyar (1970) noted, there was 21 per cent increase in the rupee value of India’s exports in the first half of the 1970s.

16
viii Since the former allows 50 per cent sale of production in the domestic market without any additional tax. Such sale under the SEZs scheme, however, requires payment of custom duties because the SEZs policy does not allow sale in the domestic market.
ix The Vizag EPZ was brought under the SEZs framework in 2003 along with Noida, Falta and Chennai EPZs
x Kandla, Santacruz, Cochin and Surat were brought under the SEZ purview in 2000.
xi As explained already exports earning revealed better performance in line with improvements in the general macreconomic scenario of the country in general and the policy addressed these zones in particular.
xii Historically such scenario is revealed in the case of Philippines, Bhutan, Taiwan and Chinese enclaves.
xiii Chow test is not feasible in the present set of analysis due to less number of observations, which eventually provides less degree of freedom.
xiv Generated from all working SEZs in the country
xv Among others see discussion by Masell (1970), Kingston (1973), Kingston (1976) xvi There are a lot data-specific problems involved with respect to Indian SEZs. One is non-availability of data on
sectoral composition of imports of any of the seven conventional SEZs. Thus, we are analysing sectoral composition of exports without sketching the sectoral composition of imports.
xvii Due to data constraints we could not present the trade scenario of SEZs with any other major countries and
regions.
References
Aggarwal, Aradhana (2004). “Export Processing Zones in India: Analysis of the Export Performance”,
Working Paper No. 148. ICRIER, New Delhi.
————— (2005). “Performance of Export Processing Zones: A Comparative Analysis of India, Sri
Lanka, and Bangladesh”, Working Paper No. 155. ICRIER, New Delhi.
Amirahamdi, Hooshang and Weiping Wu (1995). “Export Processing Zones in Asia”. Asian Survey, Vol.
35.
Arora, O P (2003). Compilation of Circulars on EPZ/SEZ/EOU issued by CBEC, DGFT & RBI. New Delhi:
M/s Anmkur Arora Associates.
Chinese Statistical Year Book (CSY) (2006). National St atistics Bureay. China Statistical Press, Beijing
Deepika, M G and R S Deshpande (2003). “Trade Policy and Determinants of Trade in Agriculture”.
Working Paper No. 118. ISEC, Bangalore.
Government of India (2001). “EXIM Policy Statement, 2000-01”. Ministry of Commerce, New Delhi.
IIFT (1990). “Exports Processing Zones in India: A Case study of Kandla Free Trade Zone”. New Delhi:
Indian Institute of Foreign Trade.
Kingston, J L (1973). “Exports Instability in Latin America: The Postwar Statistical Record”. Journal of
Developing Areas, Vol. 7, No 3.
————— (1976). “Exports Concentration and Exports Performance in Developing Countries: 1954-67”.
Journal of Development Studies, Vol. 12, No 4.
Kumar, Rajiv (1987). “Performance of Foreign and Domestic Firms in Export Processing Zones”. World
Development, Vol. 15, No.10/11
————— (1989). “Indian Export Processing Zones: An Evaluation”. New Delhi: Oxford University Press.
Kundra, Ashok (2000). “The Performance of India’s Export Zones- A Comparison with Chinese
Approach”. New Delhi: Sage Publication.

17
Masell, Benton F (1970). “Exports Instability and Economic Growth”. American Economic Review, Vol.
60.
Mitra, Siddhartha (2007). “Special Economic Zones – Rationale and Pitfalls in Implementations”. Man
and Development , Vol. 24 No. 4.
Mukhopsdhyay, Partha and Kanhu Charan Pradhan (2009). “Location of SEZs and Policy Benefits: What
Does the Data Say?”. CPR Occasional Paper Series No 3. New Delhi.
Mukhopsdhyay, Partha (2009). “The Promised Land of SEZs”. CPR Occasional Paper Series No 2. New
Delhi.
Nayyar, Deepak (1976). “India’s Export Performance in the 1970s”. Economic and Political Weekly. Vol.
11. No. 5.
Nurkse, R (1953). “Problems of capital formation in Underdeveloped countries”. Oxford: Basil Blackwell.
Prebisch, R (1959). “Commercial Policy in the Underdeveloped Countries”. American Economic Review,
Papers and Proceedings, Vol. 59.
Reserve Bank of India (2008). “Annual Report on Currency and Finance 2007-08”. Mumbai: RBI.
Shah, Deepak (2009). “Special Economic Zones in India: A Review of Investment, Trade, Employment
Generation and Impact Assessment”. Indian Journal of Agricultural Economics, Vol. 64, No 3.
Shenzhen Statistical Year Book (SZSY) (2006). “Shenzhen Statistics Bureau”. China Statistical Press.
Tandon Committee (1980). “Report of the committee on Export Strategy”. New Delhi: Ministry of
Commerce, Government of India.
Wong Edy L (1987). “Recent development in china’s Special Economic Zoe: Problems and Prognosis”.
The Developing Economies, Vol. 25, No. 1.
Wong Kwan-Yiu and David K Y Chu (1985). ‘Export Processing Zones and Special Economic Zones as
Locomotives of export -led Economic Growth’. In Wong Kwan-Yiu and David K Y Chu (eds),
Modernization in China: The case of Shenzhen Special Economic Zone. Oxford University Press,
Hong Kong pp- 89-107
www.sez.nic.in

186 Socio-Economic Determinants of WomenLeadeship at the Grass - RootsK C Smitha
187 Groundwater for Agriculural Use in India:An Institutional PerspectiveSarbani Mukherjee
188 Comparative Study of Traditional Vs.Scientific Shrimp Farming in West Bengal:A Technical Efficiency AnalysisPoulomi Bhattacharya
189 Urban and Service Delivery in Bangalore:Public-Private PartnershipSmitha K C and Sangita S N
190 Social Capital in Forest GovernanceRegimesSangita S N
191 Agriculture in Karnataka: A HistoricalView After the Fall of SerirangapatanaR S Deshpande and Malini Tantri
192 Personality Traits and AdministratorsAnitha V
193 Sustainability of Indian Agriculture:Towards an Assessment V M Rao
194 Emerging Development Issues of GreaterBangaloreG S Sastry
195 Rural Infrastructure Development Fund:Need for a Track ChangeMeenakshi Rajeev
196 Emerging Ground Water Crisis in UrbanAreas — A Case Study of Ward No. 39,Bangalore CityK V Raju, S Manasi and N Latha
197 In Pursuit of India’s Export earningadvantage: An Assessment of IT-EnabledServices IndustryMeenakshi Rajeev
198 A Patriarchal Link to HIV/AIDS in IndiaSkylab Sahu
199 Collective Action and Property Rights:Some Critical Issues in the Context ofKarnatakaK G Gayathri Devi
200 State, Society and Inclusive Governance:Community Forests in Andhra Pradesh,Karnataka and OrissaS N Sangita
201 Urban Poverty and Links with theEnvironment: An ExplorationK G Gayathri Devi
202 Groundwater Over-exploitation, Costsand Adoption Measures in the CentralDry Zone of KarnatakaAnantha K H and K V Raju
203 Changing Child Population: Growth,Trends and Levels in KarnatakaC M Lakshmana
204 Awareness About HIV/AIDS AmongKarnataka Woment: An Analysis of RCH2002-04 DataK S Umamani
205 The Microfinance Promise in FinancialInclusion and Welfare of the Poor:Evidence from Karnataka, IndiaNaveen K Shetty
206 Structure of Central Himalayan ForestsUnder Different Management Regimes:An Empirical StudySunil Nautiyal
207 Poverty and Natural Resources:Measuring the Links (Some Issues in theContext of Karnataka)K G Gayathri Devi
208 Federalism and Decentralisation in India:Andhra Pradesh and Tamil NaduV Anil Kumar
209 Capital, ‘Development’ and CanalIrrigation in Colonial IndiaPatric McGinn
210 Gender, Ecology and Development inKarnataka: Situation and Tasks AheadK G Gayathri Devi
211 Greenhouse Gases Emission andPotential Corbon Sequestration: A CaseStudy of Semi-Arid Area in South IndiaLenin Babu and K V Raju
212 Emerging Trends in Managing DrinkingWater – Case Studies of Coastal Villagesin KarnatakaManasi S, Latha N and K V Raju
213 Spatio-Temporal Analysis of ForestsUnder Different Management RegimesUsing Landsat and IRS ImagesSunil Nautiyal
214 Traditional Knowledge System(Medicine): A Case Study of ArakalgudTaluk, Karnataka, IndiaB K Harish, K Lenin Babu
215 Tribal Movement in Orissa: A StruggleAgainst Modernisation?Patibandla Srikant
216 Technological Progress, Scale Effect andTotal Factor Productivity Growth inIndian Cement Industry: PanelEstimation of Stochastic ProductionFrontierSabuj Kumar Mandal and S Madheswaran
217 Fisheries and Livelihoods in TungabhadraBasin, India: Current Status and FuturePossibilitiesManasi S, Latha N and K V Raju
218 Economics of Shrimp Farming: AComparative Study of Traditional Vs.Scientific Shrimp Farming in West BengalPoulomi Bhattacharya
219 Output and Input Efficiency ofManufacturing Firms in India: A Case ofthe Indian Pharmaceutical SectorMainak Mazumdar, Meenakshi Rajeevand Subhash C Ray
220 Panchayats, Hariyali Guidelines andWatershed Development: Lessons fromKarnatakaN Sivanna
Recent Working Papers

221 Gender Differential in Disease Burden: It’sRole to Explain Gender Differential inMortalityBiplab Dhak and Mutharayappa R
222 Sanitation Strategies in Karnataka: AReviewVeerashekharappa and Shashanka Bhide
223 A Comparative Analysis of Efficiency andproductivity of the Indian PharmaceuticalFirms: A Malmquist-Meta-FrontierApproachMainak Mazumdar and Meenakshi Rajeev
224 Local Governance, Patronage andAccountability in Karnataka and KeralaAnand Inbanathan
225 Downward Dividends of GroundwaterIrrigation in Hard Rock Areas of SouthernPeninsular IndiaAnantha K H
226 Trends and Patterns of Private Investmentin IndiaJagannath Mallick
227 Environmental Efficiency of the IndianCement Industry: An Interstate AnalysisSabuj Kumar Mandal and S Madheswaran
228 Determinants of Living Arrangements ofElderly in Orissa: An AnalysisAkshaya Kumar Panigrahi
229 Fiscal Empowerment of Panchayats inIndia: Real or Rhetoric?M Devendra Babu
230 Energy Use Efficiency in Indian CementIndustry: Application of DataEnvelopment Analysis and DirectionalDistance FunctionSabuj Kumar Mandaland S Madheswaran
231 Ethnicity, Caste and Community in aDisaster Prone Area of OrissaPriya Gupta
232 Koodankulam Anti-Nuclear Movement: AStruggle for Alternative Development?Patibandla Srikant
233 History Revisited: Narratives on Politicaland Constitutional Changes in Kashmir(1947-1990)Khalid Wasim Hassan
234 Spatial Heterogeneity and PopulationMobility in IndiaJajati Keshari Parida and S Madheswaran
235 Measuring Energy Use Efficiency inPresence of Undesirable Output: AnApplication of Data Envelopment Analysis(DEA) to Indian Cement IndustrySabuj Kumar Mandaland S Madheswaran
236 Increasing trend in Caesarean SectionDelivery in India: Role of Medicalisationof Maternal HealthSancheetha Ghosh
237 Migration of Kashmiri Pandits:Kashmiriyat Challenged?Khalid Wasim Hassan
238 Casuality Between Energy Consumptionand Output Growth in Indian CementIndustry: An Application of Panel VectorError Correction ModelSabuj Kumar Mandal and S Madheswaran
239 Conflict Over Worship:A Study of the SriGuru Dattatreya Swami BababudhanDargah in South IndiaSudha Sitharaman
240 Living Arrangement Preferences of theElderly in Orissa, IndiaAkshaya Kumar Panigrahi
241 Challenges and Pospects in theMeasurement of Trade in ServicesKrushna Mohan Pattanaik
242 Dalit Movement and Emergence of theBahujan Samaj Party in Uttar Pradesh:Politics and PrioritiesShyam Singh
243 Globalisation, DemocraticDecentralisation and Social Secutiry inIndiaS N Sangita and T K Jyothi
244 Health, Labour Supply and Wages: ACritical Review of LiteratureAmrita Ghatak
245 Is Young Maternal Age A Risk Factor forSexually Transmitted Diseases andAnemia in India? An Examination inUrban and Rural AreasKavitha N
246 Patterns and Determinants of FemaleMigration in India: Insights from CensusSandhya Rani Mahapatro
247 Spillover Effects from MultinationalCorporations: Evidence From West BengalEngineering IndustriesRajdeep Singha and K Gayithri
Price: Rs. 30.00 ISBN 978-81-7791-104-6
INSTITUTE FOR SOCIAL AND ECONOMIC CHANGEDr V K R V Rao Road, Nagarabhavi P.O., Bangalore - 560 072, India
Phone: 0091-80-23215468, 23215519, 23215592; Fax: 0091-80-23217008E-mail: [email protected]; Web: www.isec.ac.in
Related Documents