Journal of Economics and International Finance Vol. 3(16), pp. 801–817, 22 December, 2011 Available online at http://www.academicjournals.org/JEIF DOI: 10.5897/JEIF11.126 ISSN 2006-9812 ©2011 Academic Journals Full Length Research Paper Effectiveness of foreign aid in sub-Saharan Africa: Does disaggregating aid into bilateral and multilateral components make a difference? Hassen Abda Wako Department of Economics, College of Business and Economics, Jimma University, P. O. Box 378, Jimma, Ethiopia. E- mail: [email protected], [email protected]. Tel: +251911083176, +251922876002. Accepted 22 November, 2011 Inspired by the contradicting findings of studies on aid effectiveness and the recently emerging dissatisfaction of scholars with the methodologies of earlier works, this study took up the examination of the effectiveness of bilateral and multilateral aids on economic growth. To this end, the study applied the estimation technique of system-GMM (system - generalized method of moments) to panel data of 42 Sub-Saharan African countries collected from secondary sources for the years 1980 through 2007. For the data at hand, there was no evidence for the (conditional or unconditional) effectiveness of both kinds of aid. This result was robust to the use of alternative growth models. Bilateral aid on its own, or in interaction with policy, is ineffective at enhancing economic growth, regardless of whether one measures it relative to the recipients' gross domestic product or in per capita terms. The same holds for multilateral aid. This conclusion confines itself to the data at hand and thus gives no evidence about the effectiveness of the recently emerging aid modalities, which are argued to possess elements of better government accountability, better transparency and better recipient-ownership. Key words: Foreign aid, aid effectiveness, Sub-Saharan Africa, economic growth, system- GMM (system - generalized method of moments. INTRODUCTION Foreign aid is a transfer of resources on concessional terms undertaken by official agencies in order to support the economic, social and political development of the developing world. The concessionality of the transfer is reflected in that a transfer is considered as foreign aid if it has a grant element of 25% or more (Sharma, 1997; Radelet, 2006). This definition of foreign aid more accurately reflects development aid, commonly known as Official Development Assistance (ODA hereafter). However, as (for instance) Tarnoff and Nowels (2004) discuss, the term foreign aid also includes such other resource transfers as humanitarian aid and military aid. One way to classify aid is to distinguish between aid from bilateral and multilateral sources. Bilateral aid is administered by agencies of donor governments such as USAID or JOECF. In contrast to this, multilateral assistance, while funded by contributions from wealthy countries is administered by international agencies such as UNDP and the World Bank (Boone, 1995; World Bank, 1998). The total ODA to developing countries experienced changing trends over time. In particular, it experienced a large fall in the 1990s – after the Cold War ended (Boschini and Olófsgard, 2005; Radelet, 2006). Recently, the volume of ODA has been rising though with an enlarged number of constituents and though “the lion’s share of the increase came from debt relief grants (parti- cularly to Iraq and Nigeria), which more than tripled, and from humanitarian aid, which rose by 15.8%” (OECD, 2007:1). The need for aid to support the development of the South was originally explained based on the gap models, which, coupled with the argument that LDCs are stuck in “poverty trap”, implies that they need a large (and aid- financed) increase in investment – a “Big Push”. As the gap models came under severe criticisms, other alter- native poverty-related explanations were put in place. In this regard, economists have postulated different reasons for the poverty of the poor (particularly Africa), which could have differing implications for designing the

Welcome message from author
This document is posted to help you gain knowledge. Please leave a comment to let me know what you think about it! Share it to your friends and learn new things together.
Transcript
Journal of Economics and International Finance Vol. 3(16), pp. 801–817, 22 December, 2011 Available online at http://www.academicjournals.org/JEIF DOI: 10.5897/JEIF11.126 ISSN 2006-9812 ©2011 Academic Journals
Full Length Research Paper
Effectiveness of foreign aid in sub-Saharan Africa: Does disaggregating aid into bilateral and multilateral
components make a difference?
Hassen Abda Wako
Department of Economics, College of Business and Economics, Jimma University, P. O. Box 378, Jimma, Ethiopia. E-mail: [email protected], [email protected]. Tel: +251911083176, +251922876002.
Accepted 22 November, 2011
Inspired by the contradicting findings of studies on aid effectiveness and the recently emerging dissatisfaction of scholars with the methodologies of earlier works, this study took up the examination of the effectiveness of bilateral and multilateral aids on economic growth. To this end, the study applied the estimation technique of system-GMM (system - generalized method of moments) to panel data of 42 Sub-Saharan African countries collected from secondary sources for the years 1980 through 2007. For the data at hand, there was no evidence for the (conditional or unconditional) effectiveness of both kinds of aid. This result was robust to the use of alternative growth models. Bilateral aid on its own, or in interaction with policy, is ineffective at enhancing economic growth, regardless of whether one measures it relative to the recipients' gross domestic product or in per capita terms. The same holds for multilateral aid. This conclusion confines itself to the data at hand and thus gives no evidence about the effectiveness of the recently emerging aid modalities, which are argued to possess elements of better government accountability, better transparency and better recipient-ownership. Key words: Foreign aid, aid effectiveness, Sub-Saharan Africa, economic growth, system- GMM (system - generalized method of moments.
INTRODUCTION Foreign aid is a transfer of resources on concessional terms undertaken by official agencies in order to support the economic, social and political development of the developing world. The concessionality of the transfer is reflected in that a transfer is considered as foreign aid if it has a grant element of 25% or more (Sharma, 1997; Radelet, 2006). This definition of foreign aid more accurately reflects development aid, commonly known as Official Development Assistance (ODA hereafter). However, as (for instance) Tarnoff and Nowels (2004) discuss, the term foreign aid also includes such other resource transfers as humanitarian aid and military aid. One way to classify aid is to distinguish between aid from bilateral and multilateral sources. Bilateral aid is administered by agencies of donor governments such as USAID or JOECF. In contrast to this, multilateral assistance, while funded by contributions from wealthy countries is administered by international agencies such as UNDP and the World Bank (Boone, 1995; World Bank, 1998).
The total ODA to developing countries experienced changing trends over time. In particular, it experienced a large fall in the 1990s – after the Cold War ended (Boschini and Olófsgard, 2005; Radelet, 2006). Recently, the volume of ODA has been rising though with an enlarged number of constituents and though “the lion’s share of the increase came from debt relief grants (parti-cularly to Iraq and Nigeria), which more than tripled, and from humanitarian aid, which rose by 15.8%” (OECD, 2007:1).
The need for aid to support the development of the South was originally explained based on the gap models, which, coupled with the argument that LDCs are stuck in “poverty trap”, implies that they need a large (and aid-financed) increase in investment – a “Big Push”. As the gap models came under severe criticisms, other alter-native poverty-related explanations were put in place. In this regard, economists have postulated different reasons for the poverty of the poor (particularly Africa), which could have differing implications for designing the
802 J. Econ. Int. Finance allocation of foreign aid. However, all of these lines of reasoning led to a common inference – they all justified the necessity of foreign aid flows to third world countries. Development economists in the 1950s and 60s postulated a desirable per capita growth rate and calculated the “investment requirement” to meet this target, justifying the role of aid as a means to fill any financing gap. Another argument is derived from the endogenous growth theories in which human capital plays a prominent role in economic growth. Accordingly, poverty has resulted from low human capital (poor health and education) and infrastructure and hence, it is argued that, foreign aid is needed to improve human capital and infrastructure necessary for sustained economic growth. Some modern arguments are the reflection of the more recent weight placed on the roles of good policies and good institutions for economic growth. Accordingly, poor nations are poor, partly, because they have poor institutions and/or their governments have chosen bad policies. Hence, foreign aid is required to induce better policies and promote good institutions. These arguments are well detailed in works of Sharma (1997), Dollar and Easterly (1999), Harms and Lutz (2004), and Easterly (2005).
Although all the aforementioned arguments in favor of foreign aid were made in relation to the economic bottlenecks of the recipients, scholars witness that, in practice, aid is provided for a variety of reasons. The literature on the determinants of aid allocation identifies a multitude of factors that actually drive the aid provision and allocation decision of donors. In words of Radelet (2006: 6), “Donors have a variety of motivations for providing aid, only some are related to economic development”. Tarp (2006) discusses that the ways in which the allocations of aid have been justified include pure altruism (needs of poor countries), shared benefits of economic development in poor countries, political ideology, foreign policy and commercial interests of the donor country. Economic performance of the recipient countries has also joined these justifications as a late comer. The literature generally puts these motives under three broad categories: Donor-interest, recipient-need and recipient’s performance variables (Cooray and Shahiduzzaman, 2004).
Quite a large number of studies find that, contrary to what donors’ policy documents state and what many people might perceive, the rationale for aid is explained more by donor-interest variables than by fighting poverty (Alesina and Dollar, 1998; Neumayer, 2003; Cooray and Shahiduzzaman, 2004; Radelet, 2006; Berthèlemy, 2006). Although it seems that there is no disagreement on the dominance of donor-interest in explaining aid provision, there are differences among donor countries as well as between bilateral and multilateral donors. Alesina and Dollar (1998: 1) come up with the following evidence on what dictates aid giving: "An inefficient, economically closed, mismanaged non-democratic former
colony politically friendly to its former colonizer, receives more foreign aid than another country with similar level of poverty, a superior policy stance, but without a past as a colony". Berthèlemy (2006) points out that, even multilateral donors are not immune from the influence of donor self-interests. However, the recipient-need variables play the primary role for most multilaterals. Similarly, Harrigan et al. (2004) and Fleck and Kilby (2005) affirm that the shareholders of multilateral donors influence their aid allocation behavior.
The aforementioned arguments for continued aid flows have usually been associated with the conditions prevailing in Sub-Saharan Africa (SSA henceforth). Whether none, one, or more of the aforementioned arguments are the real causes of African poverty and whether or not the aid to the region has served the intended purpose, are areas of severe controversy as the next paragraph reveals. In fact, the effectiveness of foreign aid is one of the issues on which economists seldom agree. Even using the same data set and comparable econometric techniques of estimation, different researchers have come up with different and contrasting findings and conclusions.
Some economists praised the effectiveness of foreign aid and argued for more aid flows to developing countries. For instance, Crosswell (1998), Hansen and Tarp (2000), CFA (2005), Reddy and Minoiu (2006) and Tarp (2006), argue that aid is generally effective at meeting the objectives it has been intended for. Others like Kanbur (2000), Easterly (2003), Easterly et al. (2003), Ranis (2006), Murphy and Tresp (2006), strongly stress the complete failure of foreign aid. They argue that aid has failed to meet what it was aimed at. Still others inhabited the middle position: Aid has been effective in some cases and has failed in some others – the triumph of aid is conditional on other factors. Included in this group are World Bank (1998), Burnside and Dollar (2000), Denkabe (2003), and Collier (2006). Yet, for Moss et al. (2006), Fielding (2007) and Killick and Foster (2007), aid has not only failed but also has negatively affected the developing world via real appreciation of domestic currency and the resulting loss of competitive-ness, encouraging corruption and harming institutional development, etc.
Thus, it deserves enormous attention and endeavor to join this debate on the effectiveness of foreign aid in this era of massive aid flows to developing countries in general and to SSA in particular. A point justifying such an endeavor is the existence of emerging and hot criticisms on the studies in the area of aid effectiveness regardless of whether the findings reflected aid-pessi-mism or aid-optimism. The majority of these criticisms call attention to the weaknesses in the methodology used in the past. For instance, Harms and Lutz (2004) – after summarizing the literature on the contradicting findings of the effectiveness of foreign aid – emphasize the need for a new approach. The approach they proposed entailed
taking a more disaggregated view with regard to both the different components of aid and the various aspects of policies/institutions. Clemens et al. (2004) also come up with a similar proposal – disaggregating aid to different components, and testing a relationship between the correct component of aid and economic growth, rather than arguing that aid is effective or ineffective with analysis based on a wrong variable (usually, total ODA).
The sensitivity of the measures of aid effectiveness to changing data sets is another important problem that has motivated researchers in the area to question the techniques of analysis. An important evidence of this revolves around the pitfalls of drawing strong conclusions from cross-country regressions using interaction variables. After critically scrutinizing three papers, Pattillo et al. (2007: 11) conclude that “Where the impact on the dependent variable of one of the components of the IAV [interacting variable] is statistically dominant, the IAV may do little else than duplicate that variable, providing little or no information on the influence of the other component.” The aforementioned points of criticism call for works along new lines of research. Thus, it would be vital to assess the effectiveness of foreign aid by incorporating such criticisms and proposals. Hence, this study was carried out in light of this argument. It approached the aid effectiveness question by disaggregating aid into bilateral and multilateral components in the context of SSA. Specifically, the study took up the objective of evaluating the unconditional and conditional (on the macroeconomic policy stance) of bilateral and multilateral development aids at fostering economic growth. Given the current state of literature in the area, this study is believed to call forth such disaggregated level researches with more human and financial resources, and aiming at policy measures.
This study considered the effectiveness of only one type of aid – development aid. Besides, the study used the growth in per capita real GDP (among various measures of economic development) for testing the effectiveness of foreign aid. Moreover, the econometric analysis utilized bilateral and multilateral net aid transfers among the alternative measures of aid flows. The study covered forty-two countries in SSA for the period 1980 to 2007. The unavailability of data for some of the countries in the region has limited the number of SSA countries in the study. The questionable reliability of the data used here (mainly because of missing observations and because the data sources compile data from different ultimate sources) presented a limitation to be unveiled.
MATERIALS AND METHODS
Sample selection and data
The justification for choosing to concentrate on SSA and the specific countries to be included into the sample hinged on the conclusions of past studies on aid effectiveness. A number of
Wako 803 studies have come up with one or the other of the following two conclusions. Studies like that of Easterly (2003, 2005) point out that aid has been most ineffective in SSA. Others, who advocate the (unconditional or conditional) success of foreign aid, do accept that it has been less effective in SSA (Burnside and Dollar, 2000; World Bank, 1998). Besides, some researchers, for instance, Riddell (1999) and Collier (2006) predict that the future playfield of aid is Africa. The first study bases its prediction on the success of the other developing countries (those in Asia and Latin America) in becoming able to attract other forms of capital flow – perhaps foreign direct investment (FDI). The prediction of the second study relies on the existing political commitments, and the economic performance of the rest of the developing world with an implication of their graduation from the pool of aid recipients. Kanbur (2000) also shares the idea that SSA is the region where the issues of aid and aid effectiveness remain unsettled yet. These points demonstrate that SSA deserves to be a focus for future studies on aid-related issues. The specific countries included in the sample for this particular study were chosen based solely on availability of data.
The data utilized in this study were mainly from the World Development Indicators (WDI) and the Global Development Finance (GDF) of the World Bank (2006a), African Development Bank (2002, 2006), reports and online database of OECD, Freedom House, reports of the Commission for Africa and some articles especially those from the Center for Global Development. (The sources of data for the variables in the econometric analysis, along with short descriptions of the variables, are given in Table 2 in the Appendix).
At this point, it is worthwhile to elaborate the data on focus variables a little bit further. The data on gross official development assistance (GODA), net official development assistance (NODA) and net aid transfer (NAT) are calculated from the comma-delimited files of Roodman (2005). This source provides data by donors and recipients. Hence, the aid figures for each recipient country were aggregated over the set of donors. In addition, the data for total bilateral and multilateral aids to the sample of countries were generated by summing the figures for the individual sources. Then these data on bilateral and multilateral receipts, like the data on all other time-varying variables, were averaged over four-year periods: 1980-1983, 1984-1987, 1988-1991, 1992-1995, 1996-1999, 2000-2003 and 2004-2007. The conversion of these aid data into per capita terms and into percentages of GDP was undertaken by dividing the aid data by mid-year population and real GDP, respectively. The data on the latter two variables were obtained from World Bank (2006a), and were averaged over four-year periods. Model specification Examining the effectiveness of foreign aid (or of its components) at enhancing economic growth requires a theoretical link between the two variables – economic growth and aid. Gwartney et al. (2004) give details on the three categories of explanations that the economics literature has offered for analyzing income and growth disparities among countries. These are the production-function-based approach, the institutions approach, and the geography and location approach.
The first approach, as Gwartney et al. (2004) discuss, underscores that increasing the amount of inputs into the production process (such as labor, and physical and human capital) and shifting the production function (via technological improvements) are the means to generate higher income and growth. These scholars characterize this approach – based on the work of Solow (1956) – as the most well established explanation in the literature. This line of explanation corresponds to what Hansen and Tarp (2000) termed the ‘Second-Generation Studies’ of aid-
804 J. Econ. Int. Finance
effectiveness. These second- generation studies are based on growth regressions that include different components of investment financing (domestic savings, aid and other foreign capital inflows) as explanatory variables. These studies emphasize the aid-investment and investment-growth links, or the direct inclusion of aid in growth regressions. Like the ‘First-Generation Studies’ which consider aid-savings-growth linkages, the second generation studies consider aid as exogenous variable and most of them predict that aid is effective (Hansen and Tarp, 2000).
Works on economic growth (for instance Jones (2002), Arnold et al. (2007) and Fingleton and Fischer (2008)) confer that the neoclassical growth model – based on two basic equations, one describing production and the other capital accumulation – characterizes economic growth by the following general function:
Economic growth = f(Capital accumulation, Depreciation of capital, Technological progress, Population growth, Initial conditions) One extension of the neoclassical model is through incorporating the role of human capital. In accordance with such a consideration, capital accumulation or investment in the aforementioned equation is interpreted to include investments in both physical and human capital. Splitting investment into investment from domestic sources (domestic savings) and investment from foreign sources, the latter largely comprising of aid and FDI, yields:
Economic growth = f(Domestic savings, Aid,FDI, Depreciation of capital,Technological progress, Population growth, Initial conditions) (1) Hence, one possible way to analyze the effectiveness of foreign aid is to regress a variant of the general function in Equation (1). Such a framework was particularly dominant before the 1990s. Other lines of explaining cross-country income and growth differences have emerged since 1990s (Hansen and Tarp, 2000; Gwartney et al., 2004).
The second approach, Gwartney et al. (2004) carry on, builds on the idea that the institutional and policy environments influence the availability and productivity of resources. Hence, this approach advised governments to follow actions supporting secure property rights and freedom of exchange, to make convincing and credible policy commitments, and to strengthen the role of legal and political institutions, among others. According to Hansen and Tarp (2000), this approach of growth explanations – corresponding to the ‘Third-Generation Studies’ of aid-effectiveness – has emerged recently with a number of advancements over earlier works. Among these improvements are: Working with panel data, direct inclusion of institutional environment and economic policy in the reduced form growth regressions, recognizing the endogeneity of aid and other variables, and explicit recognition of non-linearity in aid-growth relationship.
Studies in line with this second approach went beyond the explanatory variables derived from the Solow type models and looked for variables influencing such items as domestic saving and investment, FDI (and along with it, technological transfer), and resource accumulation and productivity in general. The explanatory variables in this approach included policy variables like macroeconomic stability, institutional factors comprising of such components as property rights and the rule of law, financial deepening, and political instability. Burnside and Dollar (1997, 2000), Daglaard and Hansen (2000), Easterly (2003), and Fielding and Knowles (2007) represent some of the studies along such lines.
The third approach focused on the importance of ‘geographic- locational factors’ – the term used by Gwartney et al. (2004) – as
the main determinants of variations in income and growth across economies. These factors, Gwartney et al. (2004) discuss, include such variables as tropical climate, access to an ocean port, and distance from the world’s major trading centers. A tropical climate is associated with diseases such as malaria and the negative impact of hot-and-humid climate on labor productivity. The lack of access to an ocean port results in higher transaction costs and less international trade. Finally, reduced trade characterizes locations that are distant from the world’s major trading centers. According to Gwartney et al. (2004), less trade in turn has the implication of reduced gains from division of labor, specialization and economies of scale. Besides location in the tropics, landlockedness and longer distance from the world’s major trade centers could all retard the attractiveness of a nation as a base for production and conse-quently retard the inflow of FDI.
While Gwartney et al. (2004) have tested the explanatory power of the three categories of variables separately, they have also enlightened that there is no inconsistency among these approaches and that the models could be reinforcing each other. Particularly, the second and the third classes of variables are the deep parameters of economic growth as they affect variables claimed to be determinants of growth in usual growth theories. Aid was included to the set of these explanatory variables following the justification for aid flow as a means to tackle the institutional and infrastructural bottlenecks of LDCs. The inclusion of initial conditions and aid into growth regressions along with the combination of the aforementioned two sets of variables gives the general function as follows:
Economic growth = f(Financial deepening, Institutional quality, Policy, Political stability, Aid, Geographic location, Initial conditions) (2) The models in Equations (1) and (2) are so general that quantifiable proxies should replace the variables in these equations. One amendment made to both equations was the splitting of aid into bilateral and multilateral components. In this study, each of these two components was captured by net aid transfers (NAT) of its type relative to the recipient’s GDP. The use of NAT instead of other measures of aid such as GODA and NODA drew from the extensive criticism of these alternative measures notably by Roodman (2006a). According to Roodman (2006a), GODA, which treats all grants and ODA loans extended as aid, includes such items as debt forgiveness grants (cancellations of non-ODA loans called “Other Official Finance” loans). These items, Roodman (2006a) argues, either lack enough concessionality or are originally provided to assist a non-developmental purpose. In addition, as “the capitalization of interest arrears” accompanying debt rescheduling does not imply any actual movement of money, its treatment as a new aid flow overstates the true value of development aid. Netting the (principal and net interest) repayments on ODA in addition to rescheduled debts and debt forgiveness grants out of GODA, gives NAT. The other alternative – NODA – which nets out principal repayments out of GODA is criticized for neglecting the netting out of interest repayments. In words of Roodman (2006a), “To the extent that donors are lending to cover interest payments they receive on concessional loans, net ODA counts makes the circulation of money on paper look like an aid increase.”
In order to check the robustness of the coefficients of the two aid types to alternative definitions, (multilateral and bilateral) aid per capita were used as alternatives to aid-to-GDP ratios. This consideration of alternative measures was motivated by the work of Fielding and Knowles (2007: 5) which – after discussing the plausibility of using both measures – asserts that, “the sign and significance of coefficients on foreign aid variables in cross-country panel growth regressions is very sensitive to the way that aid is measured.” The second amendment to the general equations above
Wako 805 above was the substitution of period for technological progress. While variables like openness to the rest of the world and access to oceanic ports could be candidate proxies for technological progress, a deterministic trend or time variable is empirically found to capture it well (Fingleton and Fischer, 2008). Thirdly, the net national savings (as a percentage of GDP) was used to capture two variables in equation (1). It refers to the difference between the gross domestic savings plus net income and net current transfers from abroad, and the rate of depreciation. As the net national savings (from WB, 2006a) is not adjusted for the accumulation of human capital, a separate proxy for human capital was included. With the assumption that investment in human capital in general raises labor efficiency and thus positively contributes to economic growth – the centerpiece of endogenous growth theories – life expectancy at birth was included as a proxy for human capital. The use of this variable was justified on grounds of data availability; data on alternative proxies (like school enrolment ratios or expenditure shares of education and heath) were not available on continuous basis.
Tuning to the empirical specification of a model matching up equation (2), a short explanation of the variables follows. The ratio of broad money to GDP, M2/GDP, was used as a proxy for the economy’s level of financial development. Following the literature (for instance, Denkabe, 2003; Easterly, 2003; Clemens et al., 2004; Murphy and Tresp, 2006), this proxy was used as its value lagged one period.
Secondly, the simple average of the political rights and the civil liberties components of country rating from the Economic Freedom of the World (EFW) were used as indicators of institutional quality. This rating of the Freedom House is based on five areas and is indexed from 1 (the best) to 7 (the worst). The areas are government size; legal structure and security of property rights; access to sound money; freedom to trade internationally; and regulation of credit, labor, and business (Gwartney et al., 2007). An alternative measure of institutional quality based on hundreds of individual indicator variables and a variety of sources is provided by the Worldwide Governance Indicators (WGI) research project (Kaufmann et al., 2007). The former index was used because WGI is available only since 1996 while the first is there since 1972.
Thirdly, following the works of Burnside and Dollar (1997, 2000) and most subsequent studies on foreign aid such as Daglaard and Hansen (2000), Easterly (2003) and Roodman (2005), the policy index was constructed from measures of budget surplus (for fiscal policy), inflation (for monetary policy) and openness (for external policy). Budget surplus was measured as a percentage of GDP, and inflation as the percentage change in GDP deflator. Openness was measured as the share of trade (exports plus imports) in GDP. Compared to the variables seen so far, it seems that geographical factors appear less frequently in growth regressions. In cases where such factors have been explicitly considered, their impacts on economic growth have been found crucial. For instance, Gallup et al. (1998), McCarthy et al. (2000), Sachs (2003), and Gwartney et al. (2004) all witness the vital role such variables play. In addition to location in the tropics and access to oceanic ports, malaria prevalence (which is associated with tropical location) has been claimed to have a negative and robust effect on economic growth. Particularly, McCarthy et al. (2000) and Sachs (2003) present two empirical works, which detect such a robust impact of malaria on economic growth. This study used the prevalence of malaria to proxy the growth impacts of geographical factors. Summing up the discussion of model specification so far yields an empirical model in Equation (3), which encompasses the earlier models in Equations (1) and (2): Growth rate of real GDP per capita = f(Net national savings, FDI, Period, Population growth rate, Life expectancy at birth, Bilateral aid, Multilateral aid, Policy, Prevalence of Malaria,Assassinations, Initial GDP per capita) (3)
In order to account for the possibility of diminishing returns to an explanatory variable in general and aid in particular, and to allow for non-linear relationship between economic growth and the explanatory variables, polynomials such as aid-squared, policy-squared, and interaction variables like (aid)x(policy) are included in most of the empirical works described previously. Therefore, such variables were also incorporated into the models of this study. Estimation technique The model specification being done with, the estimation techniques used come next. The advantages of panel of using panel data over the usage of time-series and cross-sectional data have been covered in a number of recent works. Some of the major advantages data are the possibility of parameter identification in the presence of endogenous regressors or measurement error, the robustness of panel-data-based models to omitted variables, and the efficiency of parameter estimates because of the larger sample size with explanatory variables changing over two dimensions (Verbeek, 2000). In line with these advantages of panel data over the other types, this study chose to rely on panel data in examining aid effectiveness.
Works on the econometric techniques of estimation largely criticize the adoption of OLS in panel data analysis – particularly where the lagged dependent variable enters the set of explanatory variables. For instance, Bond et al. (2001), Bond (2002) and Roodman (2006b) discuss that the correlation between the lagged value of the dependent variable or any endogenous explanatory variable and the individual-specific, time-invariant effect(s) makes the OLS estimates biased and inconsistent. It is also pointed out that this inconsistency of pooled OLS persists even if serial correlation of the error term is assumed away (Bond, 2002). To allow for country-specific heterogeneity and considering the potential gain in efficiency, many research works employ the fixed effects, the between effects and the random effects models. However, while the transforming techniques of these static panel data techniques could provide lags of the variables as their instruments and imply the consistency of such estimates, such a consistency is not applicable to short panels – panels with many individuals (large N) observed over short periods (small T) (Bond, 2002; Buhai, 2003). Besides, while the use of the Within Groups estimation eliminates individual heterogeneity, it does not account for the issue of dynamism/persistency of the dependent variable (growth rate of GDP per capita in this case) (Bond, 2002; Buhai, 2003). Thus, regressing the models specified earlier requires a better method of estimation in situations where regressors could be endogenous, where individual-specific patterns of heteroske-dasticity and serial correlation of idiosyncratic disturbances (part of the error term that varies both over time and across individuals) are likely, where the time dimension of the panel data is small, and where there is no much hope for good exogenous instruments. As Roodman (2006b) explains in detail, the differenced-GMM and the system-GMM estimators are developed to suit panel data analysis under such conditions. System-GMM is argued, for instance, in Bond et al. (2001), Bond (2002) and Roodman (2006b), to fit growth regressions better than the differenced-GMM, particularly with near unit-root series. Hence, this study applied the estimation technique of system-GMM to variants of the above model. Estimation of the models were handled using the statistical software STATA version 11.
RESULTS AND DISCUSSION The investigation here begins with sketching out the history of aid profile to SSA and touching up on issues of
806 J. Econ. Int. Finance inflow trends, shares of aid from bilateral and multilateral sources, major bilateral and multilateral donors, major recipients. It then presents the descriptive analysis of the relationship between aid flow and economic performance of the sample countries and finally tests for the effectiveness of foreign aid at enhancing economic growth of these countries.
Profile of aid flow to Sub-Saharan Africa
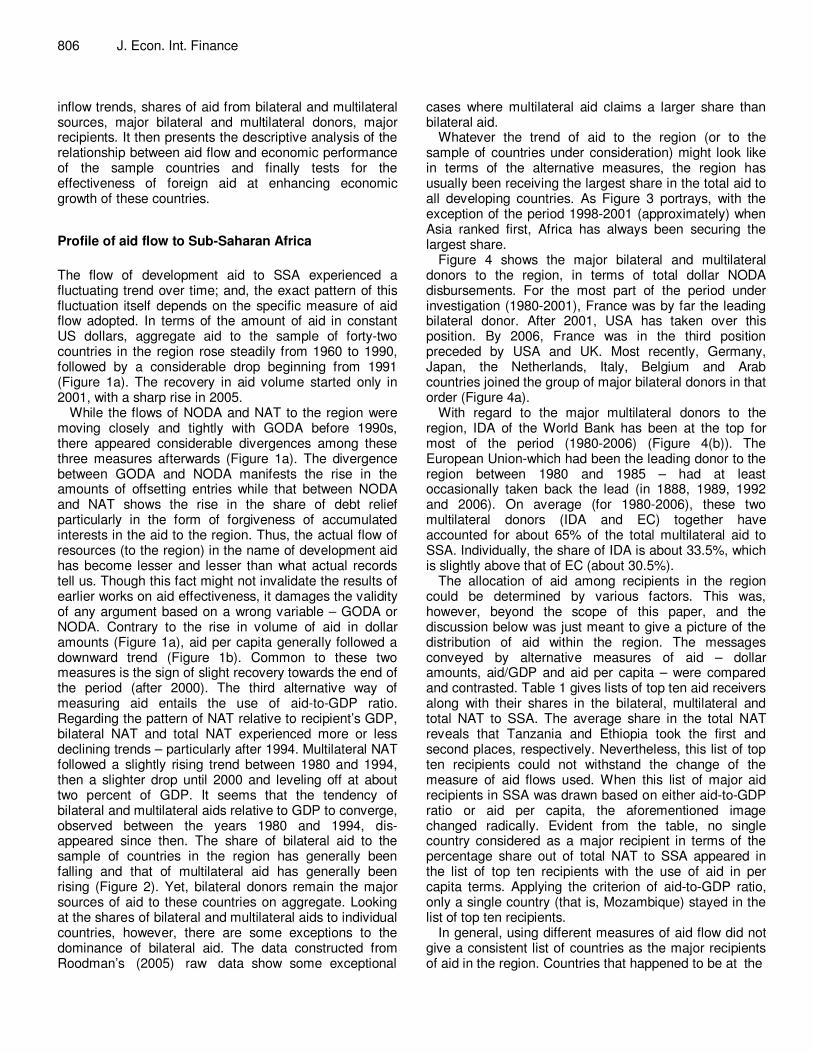
The flow of development aid to SSA experienced a fluctuating trend over time; and, the exact pattern of this fluctuation itself depends on the specific measure of aid flow adopted. In terms of the amount of aid in constant US dollars, aggregate aid to the sample of forty-two countries in the region rose steadily from 1960 to 1990, followed by a considerable drop beginning from 1991 (Figure 1a). The recovery in aid volume started only in 2001, with a sharp rise in 2005.
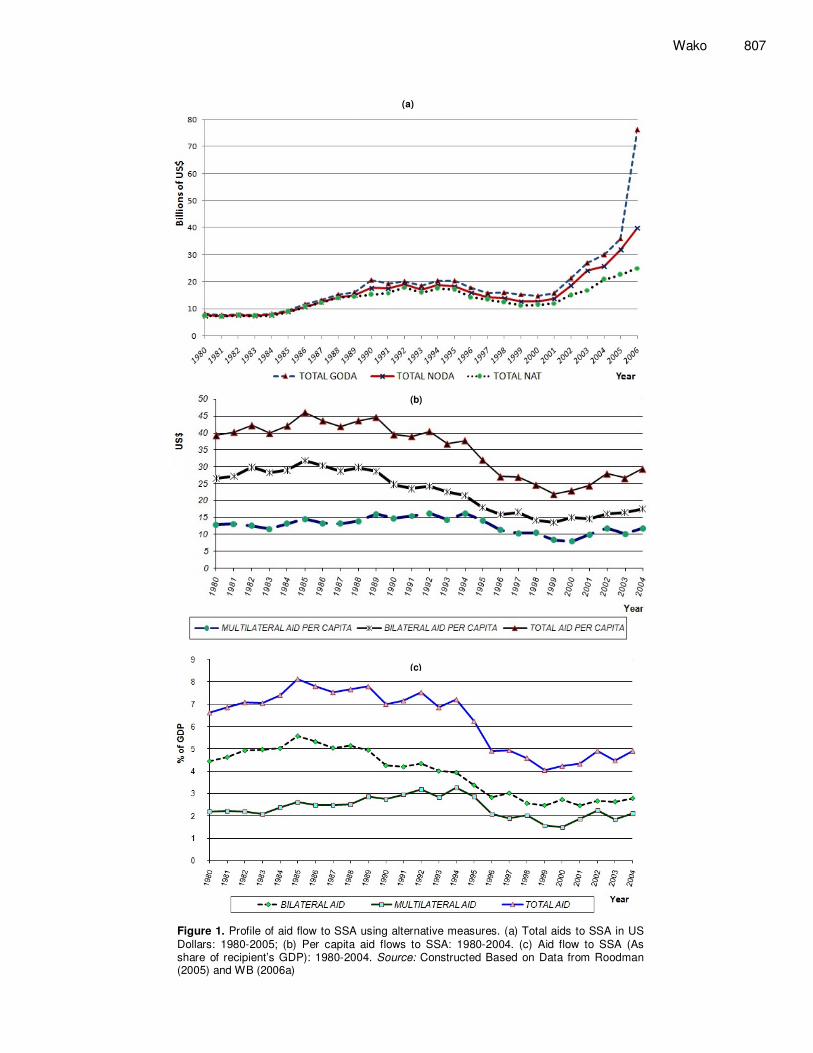
While the flows of NODA and NAT to the region were moving closely and tightly with GODA before 1990s, there appeared considerable divergences among these three measures afterwards (Figure 1a). The divergence between GODA and NODA manifests the rise in the amounts of offsetting entries while that between NODA and NAT shows the rise in the share of debt relief particularly in the form of forgiveness of accumulated interests in the aid to the region. Thus, the actual flow of resources (to the region) in the name of development aid has become lesser and lesser than what actual records tell us. Though this fact might not invalidate the results of earlier works on aid effectiveness, it damages the validity of any argument based on a wrong variable – GODA or NODA. Contrary to the rise in volume of aid in dollar amounts (Figure 1a), aid per capita generally followed a downward trend (Figure 1b). Common to these two measures is the sign of slight recovery towards the end of the period (after 2000). The third alternative way of measuring aid entails the use of aid-to-GDP ratio. Regarding the pattern of NAT relative to recipient’s GDP, bilateral NAT and total NAT experienced more or less declining trends – particularly after 1994. Multilateral NAT followed a slightly rising trend between 1980 and 1994, then a slighter drop until 2000 and leveling off at about two percent of GDP. It seems that the tendency of bilateral and multilateral aids relative to GDP to converge, observed between the years 1980 and 1994, dis-appeared since then. The share of bilateral aid to the sample of countries in the region has generally been falling and that of multilateral aid has generally been rising (Figure 2). Yet, bilateral donors remain the major sources of aid to these countries on aggregate. Looking at the shares of bilateral and multilateral aids to individual countries, however, there are some exceptions to the dominance of bilateral aid. The data constructed from Roodman’s (2005) raw data show some exceptional
cases where multilateral aid claims a larger share than bilateral aid.
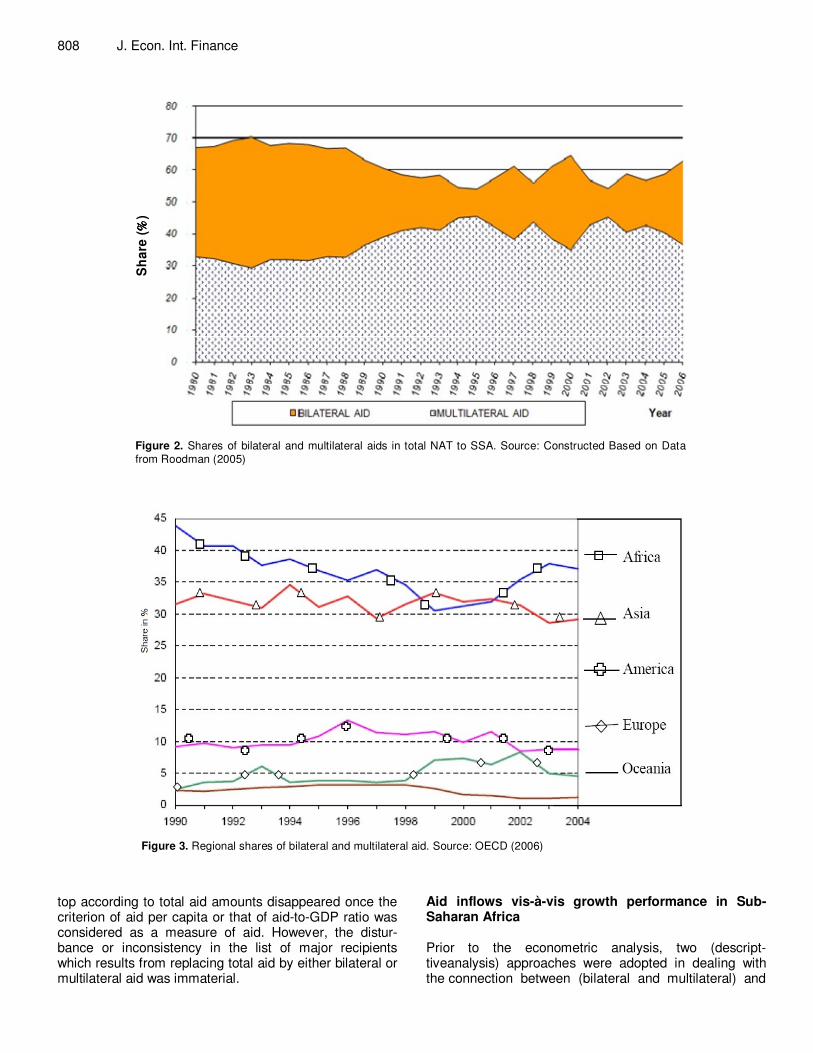
Whatever the trend of aid to the region (or to the sample of countries under consideration) might look like in terms of the alternative measures, the region has usually been receiving the largest share in the total aid to all developing countries. As Figure 3 portrays, with the exception of the period 1998-2001 (approximately) when Asia ranked first, Africa has always been securing the largest share.
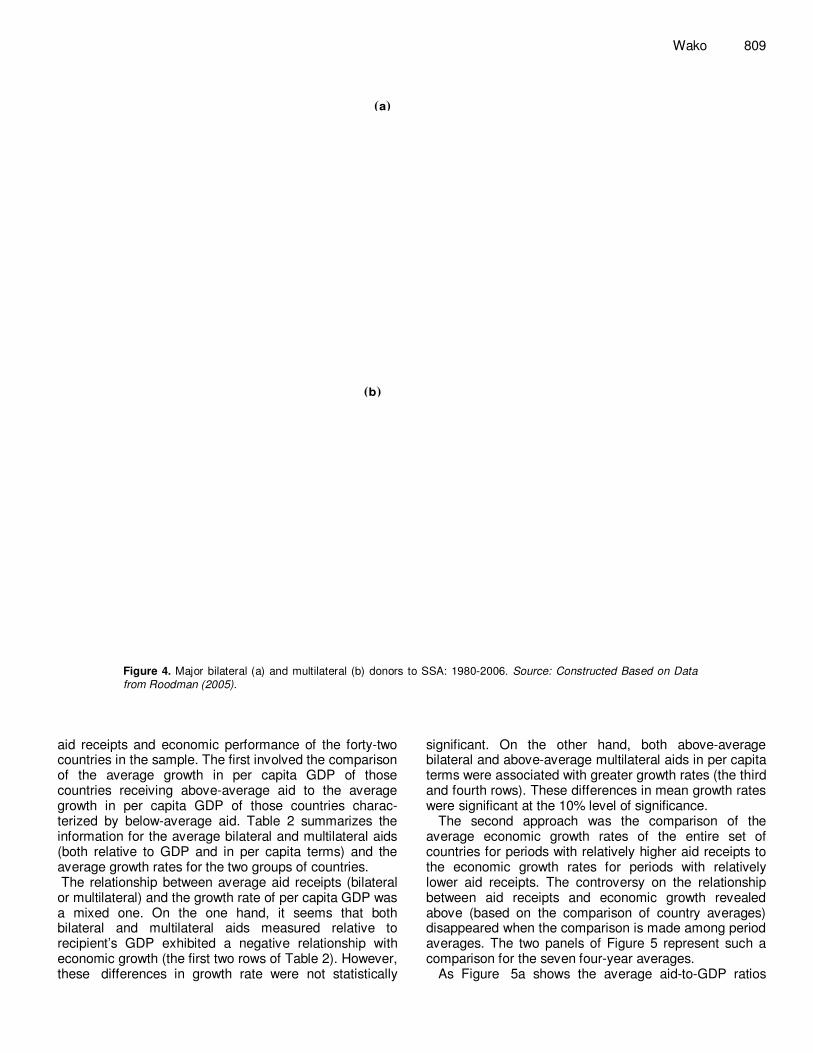
Figure 4 shows the major bilateral and multilateral donors to the region, in terms of total dollar NODA disbursements. For the most part of the period under investigation (1980-2001), France was by far the leading bilateral donor. After 2001, USA has taken over this position. By 2006, France was in the third position preceded by USA and UK. Most recently, Germany, Japan, the Netherlands, Italy, Belgium and Arab countries joined the group of major bilateral donors in that order (Figure 4a).
With regard to the major multilateral donors to the region, IDA of the World Bank has been at the top for most of the period (1980-2006) (Figure 4(b)). The European Union-which had been the leading donor to the region between 1980 and 1985 – had at least occasionally taken back the lead (in 1888, 1989, 1992 and 2006). On average (for 1980-2006), these two multilateral donors (IDA and EC) together have accounted for about 65% of the total multilateral aid to SSA. Individually, the share of IDA is about 33.5%, which is slightly above that of EC (about 30.5%).
The allocation of aid among recipients in the region could be determined by various factors. This was, however, beyond the scope of this paper, and the discussion below was just meant to give a picture of the distribution of aid within the region. The messages conveyed by alternative measures of aid – dollar amounts, aid/GDP and aid per capita – were compared and contrasted. Table 1 gives lists of top ten aid receivers along with their shares in the bilateral, multilateral and total NAT to SSA. The average share in the total NAT reveals that Tanzania and Ethiopia took the first and second places, respectively. Nevertheless, this list of top ten recipients could not withstand the change of the measure of aid flows used. When this list of major aid recipients in SSA was drawn based on either aid-to-GDP ratio or aid per capita, the aforementioned image changed radically. Evident from the table, no single country considered as a major recipient in terms of the percentage share out of total NAT to SSA appeared in the list of top ten recipients with the use of aid in per capita terms. Applying the criterion of aid-to-GDP ratio, only a single country (that is, Mozambique) stayed in the list of top ten recipients.
In general, using different measures of aid flow did not give a consistent list of countries as the major recipients of aid in the region. Countries that happened to be at the
Wako 807
Figure 1. Profile of aid flow to SSA using alternative measures. (a) Total aids to SSA in US Dollars: 1980-2005; (b) Per capita aid flows to SSA: 1980-2004. (c) Aid flow to SSA (As share of recipient’s GDP): 1980-2004. Source: Constructed Based on Data from Roodman (2005) and WB (2006a)
(a)
(c)
(b)
808 J. Econ. Int. Finance
Figure 2. Shares of bilateral and multilateral aids in total NAT to SSA. Source: Constructed Based on Data
from Roodman (2005)
Figure 3. Regional shares of bilateral and multilateral aid. Source: OECD (2006)
top according to total aid amounts disappeared once the criterion of aid per capita or that of aid-to-GDP ratio was considered as a measure of aid. However, the distur-bance or inconsistency in the list of major recipients which results from replacing total aid by either bilateral or multilateral aid was immaterial.
Aid inflows vis-à-vis growth performance in Sub-Saharan Africa Prior to the econometric analysis, two (descript-tiveanalysis) approaches were adopted in dealing with the connection between (bilateral and multilateral) and
Sh
are
(%% %%
)
Wako 809
Figure 4. Major bilateral (a) and multilateral (b) donors to SSA: 1980-2006. Source: Constructed Based on Data
from Roodman (2005).
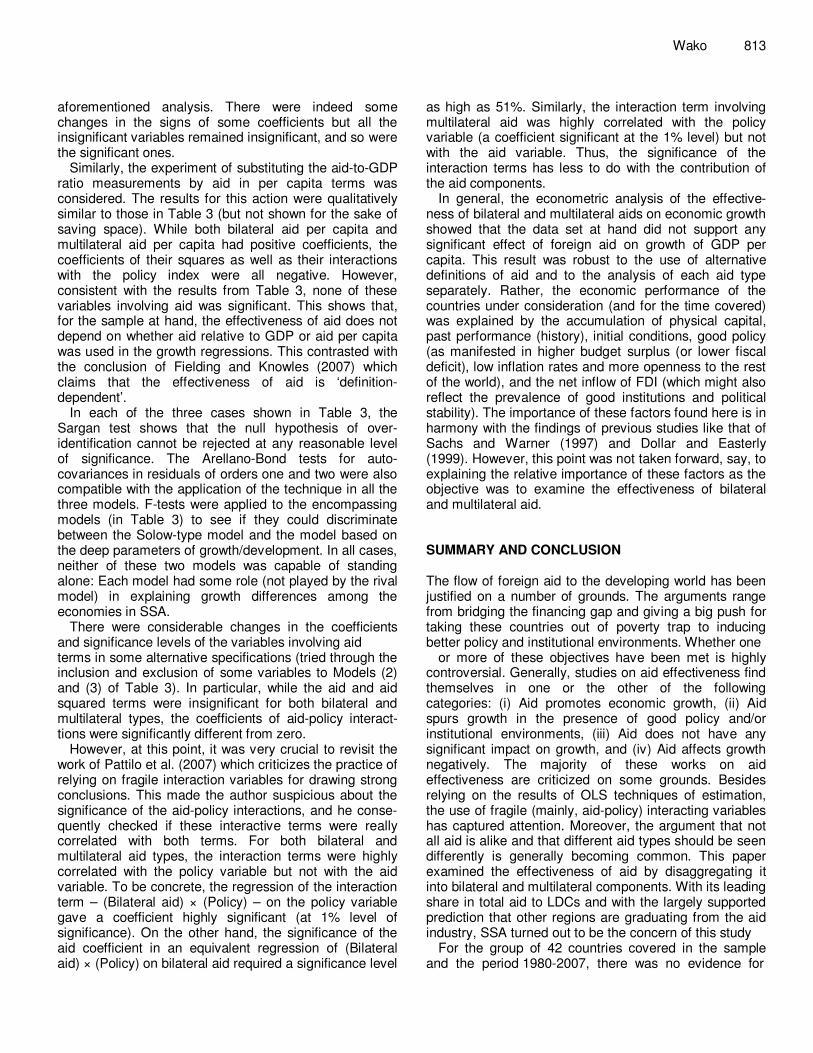
aid receipts and economic performance of the forty-two countries in the sample. The first involved the comparison of the average growth in per capita GDP of those countries receiving above-average aid to the average growth in per capita GDP of those countries charac-terized by below-average aid. Table 2 summarizes the information for the average bilateral and multilateral aids (both relative to GDP and in per capita terms) and the average growth rates for the two groups of countries. The relationship between average aid receipts (bilateral or multilateral) and the growth rate of per capita GDP was a mixed one. On the one hand, it seems that both bilateral and multilateral aids measured relative to recipient’s GDP exhibited a negative relationship with economic growth (the first two rows of Table 2). However, these differences in growth rate were not statistically
significant. On the other hand, both above-average bilateral and above-average multilateral aids in per capita terms were associated with greater growth rates (the third and fourth rows). These differences in mean growth rates were significant at the 10% level of significance.
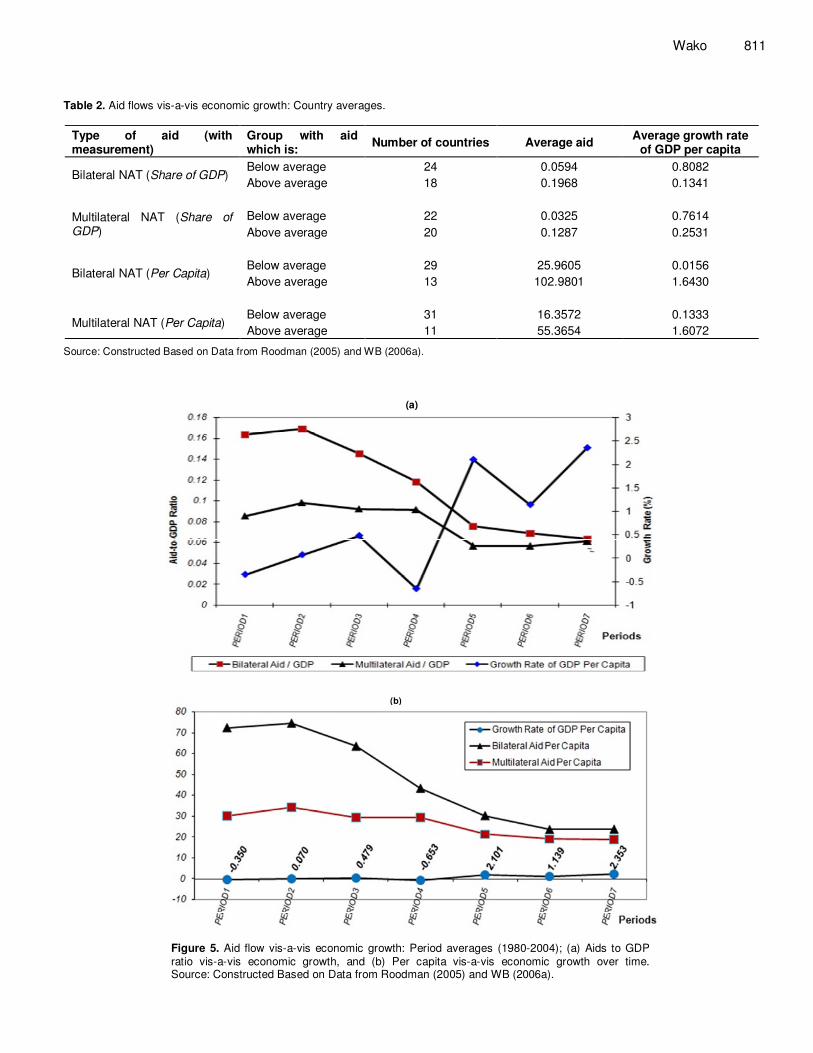
The second approach was the comparison of the average economic growth rates of the entire set of countries for periods with relatively higher aid receipts to the economic growth rates for periods with relatively lower aid receipts. The controversy on the relationship between aid receipts and economic growth revealed above (based on the comparison of country averages) disappeared when the comparison is made among period averages. The two panels of Figure 5 represent such a comparison for the seven four-year averages.
As Figure 5a shows the average aid-to-GDP ratios
(b)
(a)

810 J. Econ. Int. Finance
Table 1. Major aid recipients in SSA.
Aid Rank 1 2 3 4 5 6 7 8 9 10
Bilateral NAT Country Tanzania Mozambique Sudan Ethiopia Kenya Senegal Zambia Uganda South Africa Mali
% of SSA 7.4683 5.9213 5.8219 4.9917 4.4370 3.8871 3.6016 3.3006 3.0453 2.9792
Multilateral NAT Country Ethiopia Tanzania Uganda Ghana Mozambique Sudan South Africa Zambia Kenya Malawi
% of SSA 7.7316 5.6720 4.9309 4.7917 4.6964 4.5184 3.9148 3.7431 3.7179 3.3782
Total NAT Country Tanzania Ethiopia Mozambique Sudan Kenya Uganda Zambia Senegal Ghana South Africa
% of SSA 6.8074 5.9985 5.4727 5.3395 4.1725 3.9008 3.6555 3.6042 3.5381 3.3005
Bilateral NAT per capita
Country Seychelles Cape Verde Gabon Mauritania Comoros Botswana Equatorial Guinea Guinea Bissau Senegal Gambia
USD 292.7919 264.0130 98.4314 87.0647 85.1546 84.3444 76.1836 72.1945 59.4264 57.8850
Multilateral NAT per capita
Country Cape Verde Seychelles Mauritania Comoros Guinea Bissau Gambia Equatorial Guinea Lesotho Zambia Swaziland
USD 109.6341 98.3815 64.9291 62.1962 50.5026 50.1922 49.0410 39.5509 29.9595 27.6676
Total NAT per capita
Country Seychelles Cape Verde Mauritania Comoros Equatorial Guinea Guinea Bissau Gabon Botswana Gambia Lesotho
USD 391.1992 373.6671 151.9626 147.3201 125.2308 122.6696 112.9733 110.0021 108.0233 95.0764
Bilateral NAT/GDP
Country Guinea Bissau Cape Verde Mozambique Mauritania Comoros Mali Burundi Gambia Malawi Rwanda
Ratio 0.4244 0.3036 0.2808 0.2456 0.2068 0.2021 0.1894 0.1793 0.1740 0.1710
Multilateral NAT/GDP
Country Guinea Bissau Malawi Mauritania Burundi Gambia Comoros Cape Verde Mozambique Mali Rwanda
Ratio 0.2996 0.1815 0.1781 0.1750 0.1559 0.1516 0.1192 0.1166 0.1117 0.1104
Total NAT/GDP Country Guinea Bissau Mauritania Cape Verde Mozambique Burundi Comoros Malawi Gambia Mali Rwanda
Ratio 0.7238 0.4236 0.4228 0.3974 0.3643 0.3583 0.3551 0.3349 0.3137 0.2814
Source: Constructed Based on Data from Roodman (2005) and WB (2006a)
for both bilateral and multilateral flows had declined as time passes. In contrast, the average growth rate of per capital GDP (for the sample of countries) had shown an upward move though with irregularities. Figure 5b depicts a similar relationship between the period-average bilateral and multilateral aid receipts, this time in per capita terms, on the one hand and economic growth on
the other. Unlike the country-average based comparison
(Table2) which resulted in contrasting images, the period-average based comparison gave a consistent outcome. In this later case, periods with lower average aid inflows were generally associated with higher growth rates according to both aid-to-GDP ratio and per capita criteria of
measuring aid receipts. An inverse association between aid receipts and
economic growth could possibly mean that slower economic growth has attracted more bilateral and/or multilateral aids to the region, or could equally possibly mean that lowering the aid receipts has enhanced economic growth. Given the possibility of reverse causality – aid flow
Wako 811 Table 2. Aid flows vis-a-vis economic growth: Country averages.
Type of aid (with measurement)
Group with aid which is:
Number of countries Average aid Average growth rate
of GDP per capita
Bilateral NAT (Share of GDP) Below average 24 0.0594 0.8082
Above average 18 0.1968 0.1341
Multilateral NAT (Share of GDP)
Below average 22 0.0325 0.7614
Above average 20 0.1287 0.2531
Bilateral NAT (Per Capita) Below average 29 25.9605 0.0156
Above average 13 102.9801 1.6430
Multilateral NAT (Per Capita) Below average 31 16.3572 0.1333
Above average 11 55.3654 1.6072
Source: Constructed Based on Data from Roodman (2005) and WB (2006a).
Figure 5. Aid flow vis-a-vis economic growth: Period averages (1980-2004); (a) Aids to GDP
ratio vis-a-vis economic growth, and (b) Per capita vis-a-vis economic growth over time. Source: Constructed Based on Data from Roodman (2005) and WB (2006a).
(a)
(b)
812 J. Econ. Int. Finance Table 3. Results of system-GMM applied to variants of Equation (3).
Dependent variable: Growth rate of GDP per capita, that is, differenced ln (GDP per capita)
Explanatory variable Model(1) Model (2) Model (3)
Coefficient p-Value Coefficient p-Value Coefficient p-Value
LD.lgdppc 0.25439 0.0230 0.2765266 0.011 0.3251629 0.002
Initial condition - 0.05188 0.1060 -0.0255703 0.544 -0.0528707 0.089
Bilateral/GDP 0.07365 0.8980 -0.4065441 0.309
Bilateral2 0.02530 0.9750 0.9744455 0.191
Bilateral × policy - 0.02650 0.2320 -0.0094723 0.558
Multilateral/GDP - 0.47855 0.4670 -0.5692491 0.332
Multilateral2 0.92620 0.6660 1.576536 0.467
Multilateral × policy 0.01749 0.3820 -0.0111489 0.553
FDI 0.01809 0.0000 0.0187912 0.000 0.0182118 0.000
Population growth 0.00070 0.9370 -0.0021662 0.802 -0.0054218 0.613
Net national savings 0.00010 0.0000 0.0000869 0.000 0.0000776 0.001
Human capital 0.02115 0.8150 -0.0254568 0.770 0.0158769 0.884
Institutional quality - 0.01251 0.2160 -0.0072948 0.553 -.0125216 0.280
Policy 0.00228 0.0040 0.002109 0.002 .0018081 0.000
Policy2 1.09×10
6 0.0000 1.02×10
6 0.000 8.35×10
7 0.000
Geographic location - 0.00016 0.7740 0.0001906 0.791 0.0000494 0.931
Political instability - 0.18563 0.6560 -0.6117858 0.278 -0.4317014 0.420
p-value (Sargan’s test of over-identification)
0.7493
0.8408
0.7583
p-Value (AB autocorrelation test of order
1 0.0170 0.0314 0.0243
2 0.9949 0.7462 0.9660
influencing economic performance or vice versa – one could not and should not take the analysis so far as establishing any causal relationship. It, however, serves as a frame of reference for the results of the econometric analysis subsequently.
Before running an econometric model of ultimate goal (that is, Equation (3)), the policy index needs to be constructed. In line with previous discussion in materials and methods, this index was constructed from three variables: Fiscal balance (budget surplus), inflation and openness. To this end, the partial correlation coefficients of the growth rate of real GDP per capita with fiscal balance (= 0.2413), with inflation (= – 0.1403) and with openness (= 0.3176) were used. Each of these coefficients was divided by the sum of the absolute value of the coefficients (= 0.6992). Accordingly, the policy index is: Policy = 0.3451087*(Fiscal Balance)–0.20065789*(Inflation)+0.45423341*(Openness). The policy index constructed in this way was then used in the regressions of ultimate objective.
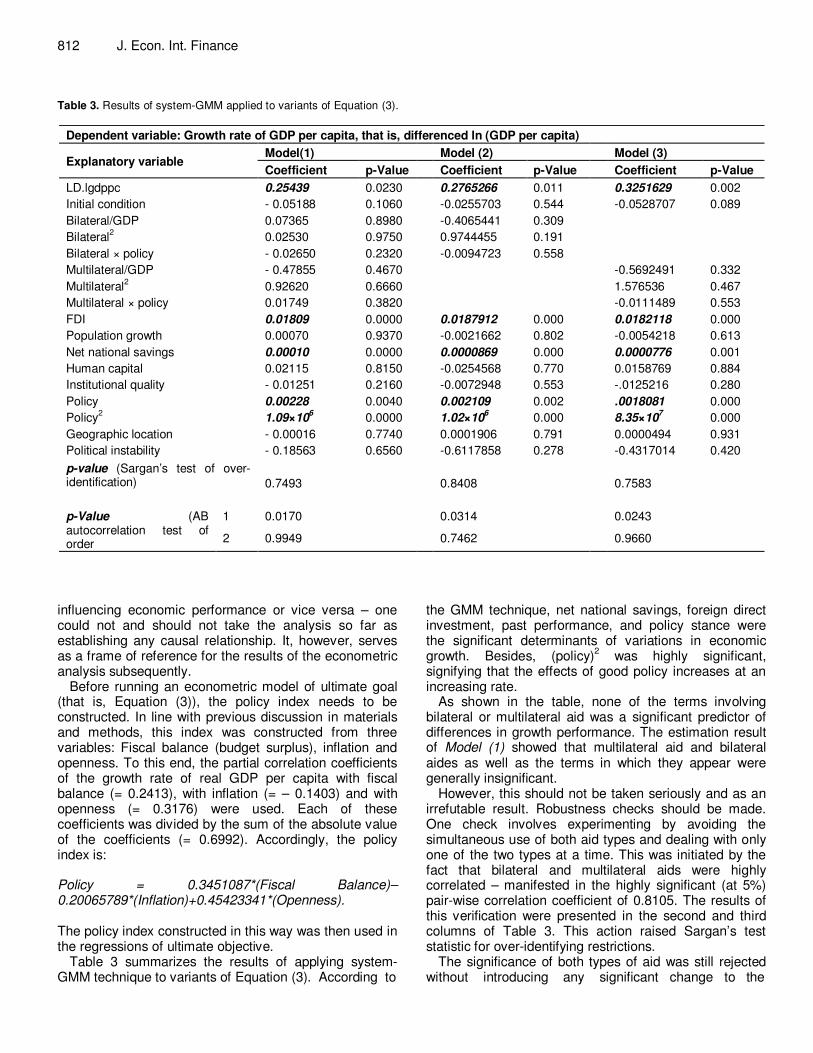
Table 3 summarizes the results of applying system- GMM technique to variants of Equation (3). According to
the GMM technique, net national savings, foreign direct investment, past performance, and policy stance were the significant determinants of variations in economic growth. Besides, (policy)
2 was highly significant,
signifying that the effects of good policy increases at an increasing rate.
As shown in the table, none of the terms involving bilateral or multilateral aid was a significant predictor of differences in growth performance. The estimation result of Model (1) showed that multilateral aid and bilateral aides as well as the terms in which they appear were generally insignificant.
However, this should not be taken seriously and as an irrefutable result. Robustness checks should be made. One check involves experimenting by avoiding the simultaneous use of both aid types and dealing with only one of the two types at a time. This was initiated by the fact that bilateral and multilateral aids were highly correlated – manifested in the highly significant (at 5%) pair-wise correlation coefficient of 0.8105. The results of this verification were presented in the second and third columns of Table 3. This action raised Sargan’s test statistic for over-identifying restrictions.
The significance of both types of aid was still rejected without introducing any significant change to the
aforementioned analysis. There were indeed some changes in the signs of some coefficients but all the insignificant variables remained insignificant, and so were the significant ones.
Similarly, the experiment of substituting the aid-to-GDP ratio measurements by aid in per capita terms was considered. The results for this action were qualitatively similar to those in Table 3 (but not shown for the sake of saving space). While both bilateral aid per capita and multilateral aid per capita had positive coefficients, the coefficients of their squares as well as their interactions with the policy index were all negative. However, consistent with the results from Table 3, none of these variables involving aid was significant. This shows that, for the sample at hand, the effectiveness of aid does not depend on whether aid relative to GDP or aid per capita was used in the growth regressions. This contrasted with the conclusion of Fielding and Knowles (2007) which claims that the effectiveness of aid is ‘definition-dependent’.
In each of the three cases shown in Table 3, the Sargan test shows that the null hypothesis of over-identification cannot be rejected at any reasonable level of significance. The Arellano-Bond tests for auto-covariances in residuals of orders one and two were also compatible with the application of the technique in all the three models. F-tests were applied to the encompassing models (in Table 3) to see if they could discriminate between the Solow-type model and the model based on the deep parameters of growth/development. In all cases, neither of these two models was capable of standing alone: Each model had some role (not played by the rival model) in explaining growth differences among the economies in SSA.
There were considerable changes in the coefficients and significance levels of the variables involving aid terms in some alternative specifications (tried through the inclusion and exclusion of some variables to Models (2) and (3) of Table 3). In particular, while the aid and aid squared terms were insignificant for both bilateral and multilateral types, the coefficients of aid-policy interact-tions were significantly different from zero.
However, at this point, it was very crucial to revisit the work of Pattilo et al. (2007) which criticizes the practice of relying on fragile interaction variables for drawing strong conclusions. This made the author suspicious about the significance of the aid-policy interactions, and he conse-quently checked if these interactive terms were really correlated with both terms. For both bilateral and multilateral aid types, the interaction terms were highly correlated with the policy variable but not with the aid variable. To be concrete, the regression of the interaction term – (Bilateral aid) × (Policy) – on the policy variable gave a coefficient highly significant (at 1% level of significance). On the other hand, the significance of the aid coefficient in an equivalent regression of (Bilateral aid) × (Policy) on bilateral aid required a significance level
Wako 813
as high as 51%. Similarly, the interaction term involving multilateral aid was highly correlated with the policy variable (a coefficient significant at the 1% level) but not with the aid variable. Thus, the significance of the interaction terms has less to do with the contribution of the aid components.
In general, the econometric analysis of the effective-ness of bilateral and multilateral aids on economic growth showed that the data set at hand did not support any significant effect of foreign aid on growth of GDP per capita. This result was robust to the use of alternative definitions of aid and to the analysis of each aid type separately. Rather, the economic performance of the countries under consideration (and for the time covered) was explained by the accumulation of physical capital, past performance (history), initial conditions, good policy (as manifested in higher budget surplus (or lower fiscal deficit), low inflation rates and more openness to the rest of the world), and the net inflow of FDI (which might also reflect the prevalence of good institutions and political stability). The importance of these factors found here is in harmony with the findings of previous studies like that of Sachs and Warner (1997) and Dollar and Easterly (1999). However, this point was not taken forward, say, to explaining the relative importance of these factors as the objective was to examine the effectiveness of bilateral and multilateral aid. SUMMARY AND CONCLUSION The flow of foreign aid to the developing world has been justified on a number of grounds. The arguments range from bridging the financing gap and giving a big push for taking these countries out of poverty trap to inducing better policy and institutional environments. Whether one
or more of these objectives have been met is highly controversial. Generally, studies on aid effectiveness find themselves in one or the other of the following categories: (i) Aid promotes economic growth, (ii) Aid spurs growth in the presence of good policy and/or institutional environments, (iii) Aid does not have any significant impact on growth, and (iv) Aid affects growth negatively. The majority of these works on aid effectiveness are criticized on some grounds. Besides relying on the results of OLS techniques of estimation, the use of fragile (mainly, aid-policy) interacting variables has captured attention. Moreover, the argument that not all aid is alike and that different aid types should be seen differently is generally becoming common. This paper examined the effectiveness of aid by disaggregating it into bilateral and multilateral components. With its leading share in total aid to LDCs and with the largely supported prediction that other regions are graduating from the aid industry, SSA turned out to be the concern of this study
For the group of 42 countries covered in the sample and the period 1980-2007, there was no evidence for
814 J. Econ. Int. Finance claiming. a link between bilateral or multilateral aid on the one hand and economic growth on the other. Specifically, the analysis in this paper did not show any positive or negative link between aid (bilateral or multilateral) and growth. The insignificance of the aid-growth relationship was robust to two alternative measures of aid – aid-to-GDP ratio and aid per capita. Exceptionally, the experiment of treating bilateral and multilateral aids (both relative to GDP) separately happened, at times, to yield significant aid-policy interacting variables. However, assessing the behavior of these interacting variables showed that the contributions of the aid components to the interacting variables were immaterial. Even if one were to take the interacting terms as healthy, this exceptional result tended to support the view that aid undermines the growth effectiveness of good policy. In general, disaggregating aid into bilateral and multilateral components did not show a difference between the effectiveness of these two types. The effect-tiveness of aid from bilateral and multilateral sources was the same: Both types were insignificant determinants of economic growth.
However, this did not put the debate on aid effectiveness to an end. In the literature, there is an indication that the behavior of donor countries vary significantly. For instance, Roodman (2005, 2006a) gives rankings of donors according to their commitment to development. Hence, research on aid effectiveness remains to be extended along such high level of disaggregating. In addition, new approaches for deli-vering aid, which (as some argue) possess elements of better government accountability, better transparency and better recipient-ownership, have been designed. Whether such attempts make any difference or not is yet to be tested. The concluding point of this study, that both bilateral and multilateral aids were ineffective at influen-cing economic growth, was confined to the data at hand and thus gave no evidence about the effectiveness of the recently emerging aid modalities. REFERENCES African Development Bank (2002). Selected Statistics on African
Countries. Statistics Division. Tunis: Development Research Department. Volume XXI.
African Development Bank (2006). Selected Statistics on African Countries. Statistics Division. Tunis: Development Research Department. Volume XXV.
Alesina A, Dollar D (1998). Who Gives Foreign Aid to Whom and Why? Cambridge. NBER Working p. 6612.
Arnold J, Bassanini A, Scarpetta S (2007). Solow or Lucas? Testing Growth Models Using Panel Data from OECD Countries. Paris: OECD Publishing, p. 592.
Berthélemy J (2006). Aid Allocation: Comparing Donors’ Behaviour. University Paris 1 Panthéon Sorbonne. EUDN/WP, p. 14.
Bond S (2002). Dynamic Panel Data Models: A Guide to Micro Data Methods and Practice. Cemmap Working Paper, CWP 09/02.
Bond S, Hoeffler A, Temple J (2001). GMM Estimation of Empirical Growth Models. CEPR Discussion Paper no. 3048. London. Retrieved from www.nuff.ox.ac.uk/Economics/Papers/2001/w21/ bth10.pdf.
Boone P (1995). Politics and the Effectiveness of Foreign Aid. NBER
Working Paper Series, Working Paper 5308, Cambridge. Boschini A, Olofsgard A (2005). Foreign Aid: An Instrument for Fighting
Communism? Retrieved from: http://info.worldbank.org/etools/docs/voddocs/155/336/olofsgard.pdf
Buhai S (2003). Note on Panel Data Econometrics. Retrieved from:http://www.tinbergen.nl/~buhai/papers/publications/panel_data_econometrics.
Burnside C, Dollar D (1997). Aid, Policies and Growth. Policy Research Working Paper, 1777.
Burnside C, Dollar D (2000). Aid, Policies, and Growth. Am. Econ. Rev., (90) 4: 847-868.
CFA (Commission for Africa) (2005). Our Common Interest. Report of the Commission for Africa, 13: 169-197.
Clemens M, Radelet S, Bhavnani R (2004). Counting Chickens When They Hatch: the Short Term Effect of Aid on Growth. Centre for Global Development, p. 44.
Collier P (2006). Assisting Africa to Achieve Decisive Change, Swedish Econ. Policy Rev., 13(2): 169-197.
Cooray N, Shahiduzzaman M (2004). Determinants of Japanese Aid Allocation: An Econometric Analysis. IUJ Research Institute, p. 4.
Crosswell M (1998). The Development Record and the Effectiveness of Foreign Aid. USAID, Bureau for Policy and Program Coordination, Staff Discussion, p. 1.
Daglaard C, Hansen H (2000). On Aid, Growth, and Good Policies. CREDIT Research Paper, No. 00/17.
Denkabe P (2003). Policy, Aid and Growth: A Threshold Hypothesis. New York University, Department of Economics.
Dollar D, Easterly W (1999). The Search for the Key: Aid, Investment, and Policies in Africa. Policy Research Working Paper 2070. Washington, D. C. The World Bank Development Research Group.
Easterly W, Levine R (1997). Africa’s Growth Tragedy: Policies and Ethnic Divisions. Policies and Ethnic Divisions, p. 536.
Easterly W (2003). Can Foreign Aid Buy Growth. J. Econ. Perspectives, 3(17): 23-48.
Easterly W, Levine R, Roodman D (2003). New Data, New Doubts: Revisiting “Aid, Policies, and Growth”, p. 26.
Easterly W (2005). Can Aid Save Africa? Clemens Lecture Series 17.
Saint John’s University. Fielding D (2007). Aid and Dutch Disease in the South Pacific. New
Zealand: University of Otago. Economics Discussion Papers, p. 0703.
Fielding D, Knowles S (2007). Measuring Aid Effectively in Tests of Aid Effectiveness. New Zealand: University of Otago, Economics Discussion Paper, p. 0704.
Fingleton B, Fischer M (2008). Neoclassical Theory versus New Economic Geography. Competing Explanations of Cross-Regional Variation in Economic Development. Retrieved from: http://ssrn.com/abstract=1111590.
Fleck R, Kilby C (2005). World Bank Independence: A Model and Statistical Analysis of U.S. Influence. Vecas College Economics Working Paper, p. 53.
Gallup J, Sachs J, Mellinger A (1998). Geography and economic development. Cambridge. NBER Working Paper Series Working Paper, 6849.
Gwartney J, Holcombe R, Lawson R (2004). Economic Freedom, Institutional Quality, and Cross-Country Differences in Income and Growth. Cato Instit. Cato J., 3(24).
Gwartney J, Lawson R (2007). with the assistance of J. Hall with R. Sobel and P. Leeson Economic Freedom of the World. Annual Report.
Hansen H, Tarp F (2000). Aid Effectiveness Disputed. J. Int. Develop., (12): 375-398.
Harrigan J, Wang C, El-Said H (2004). The Economic and Political Determinants of IMF and World Bank Lending in the Middle East and North Africa. School of Economics, The University of Manchester. Discussion Paper 0411.
Harms P, Lutz M (2004). The Macroeconomic Effects of Foreign Aid: A Survey. University of St. Gallen, Department of Economics, p. 11.
Jones C (2002). Introduction to Economic Growth. Second edition. New York, London: WW Norton.
Kanbur R (2000). Aid, Conditionality and Debt in Africa. In F. Tarp (Ed),
Foreign Aid and Development: Lessons Learnt and Directions for
the Future. Routledge. Kaufmann D, Kraay A, Mastruzzi M (2007). Governance Matters VI:
Aggregate and Individual Governance Indicators 1996-2006. Washington D.C. WPS, p. 4280.
Killick T, Foster M (2007). The Macroeconomics of Doubling Aid to Africa and the Centrality of the Supply Side. Development Policy Review, Cambridge. NBER Working Paper 9490, 2(25): 167-192.
McCarthy F, Wolf H, Wu Y (2000). The Growth Costs of Malaria. Cambridge. NBER Working Paper Series Working Paper 7541.
Moss T, Pettersson G, Walle N (2006). An Aid-Institutions Paradox? A Review Essay on Aid Dependency and State Building in Sub Saharan Africa. Centre for Global Development, p. 74.
Murphy R, Tresp N (2006). Government Policy and the Effectiveness of Foreign Aid. Working Papers in Economics, Boston College,
Department of Economics. Neumayer E (2003). The Determinants of Aid Allocation by Regional
Multilateral Development Banks and United Nations Agencies. London: LSE Research Online. Retrieved from:
http://eprints.lse.ac.uk/archive/00000579. OECD (Organization for Economic Cooperation and Development)
(2006). Development Aid at a Glance: Statistics by Region. Paris. http://www.sourceoecd.org/develpomentreport
OECD (2007). Development Co-operation Report 2006: Summary. Retrieved from: http://www.sourceoecd.org/develpomentreport .
Pattillo C, Polak J, Joydeep R (2007). Measuring the Effects of Foreign Aid on Growth and Poverty Reduction or the Pitfalls of Interaction Variables. IMF Working Paper, WP/07/145.
Radelet S (2006). A Primer on Foreign Aid. Centre for Global Development, p. 92.
Ranis G (2006). Toward the Enhanced effectiveness of foreign aid. New Haven: Economic Growth Center, p. 938.
Reddy S, Minoiu C (2006). Development Aid and Economic Growth: A Positive Long-Run Relation.
Wako 815 Riddell R (1999). The End of Foreign Aid to Africa? Concerns about
Donor Policies. African Affairs, 98 392. pp. 309-335. Roodman D (2005). An Index of Donor Performance. Center for Global
Development, p. 67. Roodman D (2006a). An Index of Donor Performance. November 2006
edition. Center for Global Development, p. 67. Roodman D (2006b). How to Do xtabond2: An Introduction to
“Difference” and “System” GMM in Stata. Center for Global Development Working Paper Number 103.
Sachs J (2003). Institutions Don’t Rule: Direct Effects of Geography on Per Capita Income. NBER Working Paper Series, Vol. w9490.
Sachs J, Warner A (1997). Sources of Slow Growth in African Economies. J. Afr. Econ., (6) 3: 335-376.
Sharma S (1997). Changing Pattern of External Resource Flows. Social Scientist, 11/12(25): 48-63.
Tarnoff C, Nowels L (2004). Foreign Aid: An Introductory Overview of U.S. Programs and Policy. Congressional Research Services (CRS) Report for Congress.
Tarp F (2006). Aid and Development. University of Copenhagen, Department of Economics. pp. 6-12.
Verbeek M (2000). A Guide to Modern Econometrics. Wiley & Sons,
Ltd. 2nd edition, p.385. WB (1998). Assessing Aid: What Works, What Doesn't and Why.
Washington D.C. The World Bank. WB (2006a). World Development Indicators (WDI) and Global
Development Finance (GDF). CD-Rom. Washington D.C. The World Bank.
WB (2006b). African Development Indicators (2006b). Washington D.C. The World Bank.
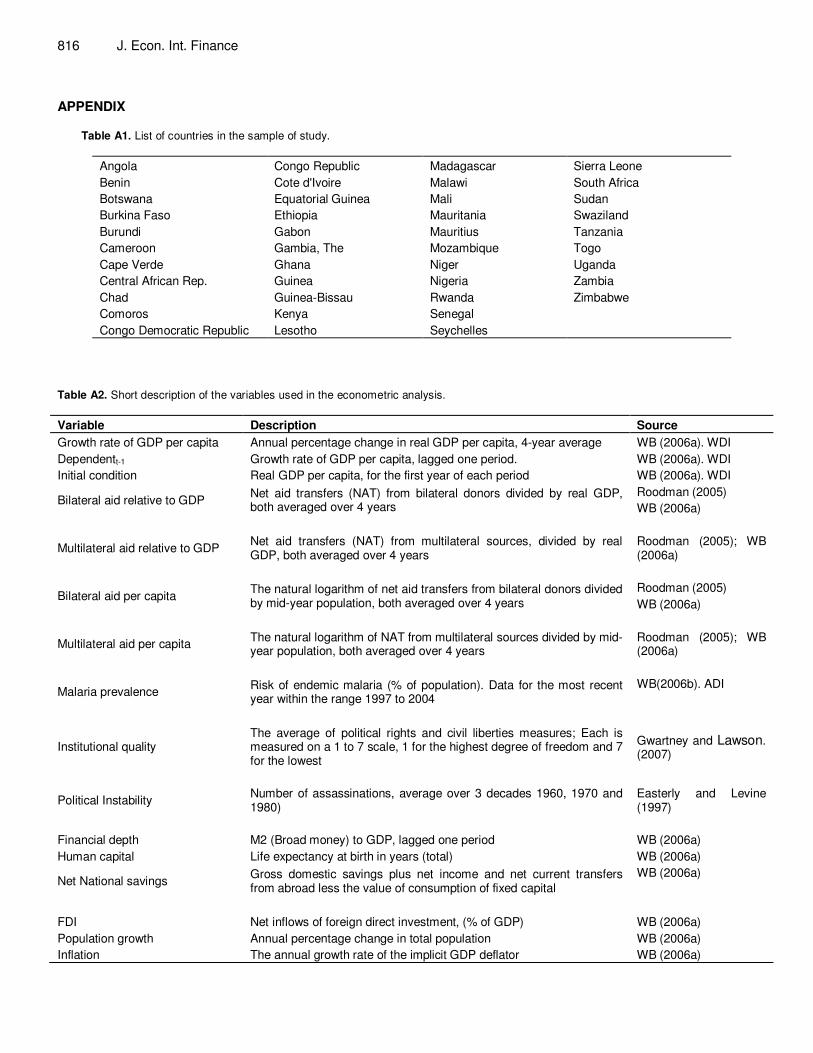
816 J. Econ. Int. Finance APPENDIX
Table A1. List of countries in the sample of study.
Angola Congo Republic Madagascar Sierra Leone
Benin Cote d'Ivoire Malawi South Africa
Botswana Equatorial Guinea Mali Sudan
Burkina Faso Ethiopia Mauritania Swaziland
Burundi Gabon Mauritius Tanzania
Cameroon Gambia, The Mozambique Togo
Cape Verde Ghana Niger Uganda
Central African Rep. Guinea Nigeria Zambia
Chad Guinea-Bissau Rwanda Zimbabwe
Comoros Kenya Senegal
Congo Democratic Republic Lesotho Seychelles
Table A2. Short description of the variables used in the econometric analysis.
Variable Description Source
Growth rate of GDP per capita Annual percentage change in real GDP per capita, 4-year average WB (2006a). WDI
Dependentt-1 Growth rate of GDP per capita, lagged one period. WB (2006a). WDI
Initial condition Real GDP per capita, for the first year of each period WB (2006a). WDI
Bilateral aid relative to GDP Net aid transfers (NAT) from bilateral donors divided by real GDP, both averaged over 4 years
Roodman (2005)
WB (2006a)
Multilateral aid relative to GDP Net aid transfers (NAT) from multilateral sources, divided by real GDP, both averaged over 4 years
Roodman (2005); WB (2006a)
Bilateral aid per capita The natural logarithm of net aid transfers from bilateral donors divided by mid-year population, both averaged over 4 years
Roodman (2005)
WB (2006a)
Multilateral aid per capita The natural logarithm of NAT from multilateral sources divided by mid-year population, both averaged over 4 years
Roodman (2005); WB (2006a)
Malaria prevalence Risk of endemic malaria (% of population). Data for the most recent year within the range 1997 to 2004
WB(2006b). ADI
Institutional quality The average of political rights and civil liberties measures; Each is measured on a 1 to 7 scale, 1 for the highest degree of freedom and 7 for the lowest
Gwartney and Lawson. (2007)
Political Instability Number of assassinations, average over 3 decades 1960, 1970 and 1980)
Easterly and Levine (1997)
Financial depth M2 (Broad money) to GDP, lagged one period WB (2006a)
Human capital Life expectancy at birth in years (total) WB (2006a)
Net National savings Gross domestic savings plus net income and net current transfers from abroad less the value of consumption of fixed capital
WB (2006a)
FDI Net inflows of foreign direct investment, (% of GDP) WB (2006a)
Population growth Annual percentage change in total population WB (2006a)
Inflation The annual growth rate of the implicit GDP deflator WB (2006a)

Wako 817 Table A2. Cont’d
Openness to the rest of the world Trade (the sum of exports and imports of goods and services) measured as a percentage share of gross domestic product.
WB (2006a)
Fiscal Balance (Budget Surplus) Total revenue and grants received less total expenditure and net lending as a percentage share of gross domestic product.
ADB (2002,2006)
Related Documents