healthcare Article Effectiveness of a Lifestyle Intervention in Patients with Type 2 Diabetes: The Physical Activity and Nutrition for Diabetes in Alberta (PANDA) Trial Ghada Asaad 1 , Diana C. Soria-Contreras 1 , Rhonda C. Bell 1 and Catherine B. Chan 1,2,3, * 1 Department of Agricultural, Food and Nutritional Science, University of Alberta, Edmonton, AB T6G 2R3, Canada; [email protected] (G.A.); [email protected] (D.C.S.-C.); [email protected] (R.C.B.) 2 Department of Physiology, University of Alberta, Edmonton, AB T6G 2R3, Canada 3 Diabetes, Obesity and Nutrition Strategic Clinical Network, Alberta Health Services, Edmonton, AB T6G 2R3, Canada * Correspondence: [email protected]; Tel.: +1-780-492-9939 Academic Editor: Sampath Parthasarathy Received: 16 August 2016; Accepted: 21 September 2016; Published: 27 September 2016 Abstract: Type 2 diabetes (T2D) patients often find integrating a new dietary pattern into their lifestyle challenging; therefore, the PANDA (Physical Activity and Nutrition for Diabetes in Alberta) menu plan intervention was developed to help people incorporate the Canadian Diabetes Association (CDA) nutrition therapy guidelines into their daily lives. The menu plan focused on recipes and foods that were accessible, available and acceptable to Albertans. The objective was to evaluate the effectiveness of the intervention on blood glucose control and dietary adherence and quality among patients with T2D. Participants with T2D (n = 73) enrolled in a single-arm incorporating interactive education based on a four-week menu plan that incorporated the recommendations of the CDA nutrition therapy guidelines. Post-intervention follow-up was conducted at three and six months. After three months, there were beneficial changes in A1c (-0.7%), body mass index (BMI, -0.6 kg/m 2 ), diastolic blood pressure (-4 mmHg), total cholesterol (-63 mg/dL), HDL- (+28 mg/dL) and LDL-cholesterol (-89 mg/dL), Healthy Eating Index (+2.1 score) and perceived dietary adherence (+8.5 score) (all p < 0.05). The significant improvements in A1c, BMI and lipids were maintained at six months. The PANDA menu plan intervention was effective in improving glycemic control and diet quality. The results suggest that a dietary intervention incorporating interactive education sessions focused on menu planning with familiar, accessible foods may be effective for diabetes management. Keywords: type 2 diabetes; intervention; menu plan; glycemic control; dietary adherence; diet quality 1. Introduction Diabetes is a major global health issue with over 0.5 billion individuals projected to be diagnosed by 2030 [1]. In Canada, by 2019–2020 the number is expected to reach 3.7 million, approximately 10% of the population [2] with an estimated cost of $16.9 billion [3] to the Canadian health care system. The Canadian Diabetes Association (CDA) Clinical Practice Guidelines (CPG) provide evidence-based recommendations for nutrition therapy as part of effective diabetes management [4]. Nutrition therapy can reduce glycated hemoglobin (A1c) by 1%–2%, improve serum cholesterol levels and facilitate weight management [4]. Despite these benefits, diabetic patients find it difficult to integrate a dietary pattern consistent with the recommendations into their lifestyle [5,6]. Thus, not surprisingly, type 2 diabetes (T2D) patients have poor adherence to dietary recommendations [7,8]. Personal factors that may be barriers to adherence include language and communication skills, lack of knowledge or motivation, taste preferences and cravings, cooking skills, and lack of family and social support [9,10]. Acculturation, lack of cultural acceptability of recommended diets and the cost of recommended Healthcare 2016, 4, 73; doi:10.3390/healthcare4040073 www.mdpi.com/journal/healthcare

Welcome message from author
This document is posted to help you gain knowledge. Please leave a comment to let me know what you think about it! Share it to your friends and learn new things together.
Transcript
healthcare
Article
Effectiveness of a Lifestyle Intervention in Patientswith Type 2 Diabetes: The Physical Activity andNutrition for Diabetes in Alberta (PANDA) TrialGhada Asaad 1, Diana C. Soria-Contreras 1, Rhonda C. Bell 1 and Catherine B. Chan 1,2,3,*
1 Department of Agricultural, Food and Nutritional Science, University of Alberta, Edmonton, AB T6G 2R3,Canada; [email protected] (G.A.); [email protected] (D.C.S.-C.); [email protected] (R.C.B.)
2 Department of Physiology, University of Alberta, Edmonton, AB T6G 2R3, Canada3 Diabetes, Obesity and Nutrition Strategic Clinical Network, Alberta Health Services, Edmonton,
AB T6G 2R3, Canada* Correspondence: [email protected]; Tel.: +1-780-492-9939
Academic Editor: Sampath ParthasarathyReceived: 16 August 2016; Accepted: 21 September 2016; Published: 27 September 2016
Abstract: Type 2 diabetes (T2D) patients often find integrating a new dietary pattern into theirlifestyle challenging; therefore, the PANDA (Physical Activity and Nutrition for Diabetes in Alberta)menu plan intervention was developed to help people incorporate the Canadian Diabetes Association(CDA) nutrition therapy guidelines into their daily lives. The menu plan focused on recipes andfoods that were accessible, available and acceptable to Albertans. The objective was to evaluatethe effectiveness of the intervention on blood glucose control and dietary adherence and qualityamong patients with T2D. Participants with T2D (n = 73) enrolled in a single-arm incorporatinginteractive education based on a four-week menu plan that incorporated the recommendations ofthe CDA nutrition therapy guidelines. Post-intervention follow-up was conducted at three and sixmonths. After three months, there were beneficial changes in A1c (−0.7%), body mass index (BMI,−0.6 kg/m2), diastolic blood pressure (−4 mmHg), total cholesterol (−63 mg/dL), HDL- (+28 mg/dL)and LDL-cholesterol (−89 mg/dL), Healthy Eating Index (+2.1 score) and perceived dietary adherence(+8.5 score) (all p < 0.05). The significant improvements in A1c, BMI and lipids were maintained at sixmonths. The PANDA menu plan intervention was effective in improving glycemic control and dietquality. The results suggest that a dietary intervention incorporating interactive education sessionsfocused on menu planning with familiar, accessible foods may be effective for diabetes management.
Keywords: type 2 diabetes; intervention; menu plan; glycemic control; dietary adherence; diet quality
1. Introduction
Diabetes is a major global health issue with over 0.5 billion individuals projected to be diagnosedby 2030 [1]. In Canada, by 2019–2020 the number is expected to reach 3.7 million, approximately 10%of the population [2] with an estimated cost of $16.9 billion [3] to the Canadian health care system.The Canadian Diabetes Association (CDA) Clinical Practice Guidelines (CPG) provide evidence-basedrecommendations for nutrition therapy as part of effective diabetes management [4]. Nutrition therapycan reduce glycated hemoglobin (A1c) by 1%–2%, improve serum cholesterol levels and facilitateweight management [4]. Despite these benefits, diabetic patients find it difficult to integrate a dietarypattern consistent with the recommendations into their lifestyle [5,6]. Thus, not surprisingly, type 2diabetes (T2D) patients have poor adherence to dietary recommendations [7,8]. Personal factorsthat may be barriers to adherence include language and communication skills, lack of knowledge ormotivation, taste preferences and cravings, cooking skills, and lack of family and social support [9,10].Acculturation, lack of cultural acceptability of recommended diets and the cost of recommended
Healthcare 2016, 4, 73; doi:10.3390/healthcare4040073 www.mdpi.com/journal/healthcare

Healthcare 2016, 4, 73 2 of 16
foods are also barriers to diabetic diet adherence [10,11]. Diabetes educators recognize that clients’ability to incorporate recommendations is affected by these factors but that many clients may not havestrategies and tools to overcome these barriers [12]. People with T2D identified ongoing professionaland peer support and multi-level programming as potential solutions to address barriers to behaviorchange [12].
Environmental barriers also affect dietary adherence. The 4-A Framework, derived from the foodsecurity literature [13], suggests that foods recommended in nutrition programs should be adequate,accessible, acceptable and available. Adequacy means the diet meets guidelines that lead to betterprimary (blood glucose control) and secondary outcomes (reduce complications). Accessible refers tofinancial and physical accessibility of foods. Foods must be acceptable from multiple perspectives:hedonic qualities, culture, traditions and usual consumption habits. Finally, foods must be generallyavailable to the consumer population of interest, e.g., locally grown or regularly imported [11].
Another challenge for T2D patients is translating nutrition recommendations into concreteoperational plans such as food procurement, recipe selection, managing time to include foodpreparation, and budgeting [14]. Menu plan and grocery list interventions were effective strategiesfor weight control as well as diabetes management [15,16] but did not incorporate elements of the4-A Framework. However, addressing environmental barriers may facilitate patient adoption of andadherence to dietary recommendations. To address this, a four-week menu plan based on the principlesof the 4-A Framework was developed [17] to meet the CDA nutrition therapy guidelines [4]. A phase 1pilot-test of 15 participants conducted to test its feasibility and efficacy to improve diabetes outcomesfound reductions (p < 0.05) in A1c (−1%), weight (−2.6 kg) and improvement in HDL-cholesterol(HDL-C) (+0.2 mmol/L) after three months [17]. Focus group interviews conducted to qualitativelyassess facilitators and barriers to implementing the menu plan showed that the menu plan wasacceptable and useful for the participants [17,18]. Hence, results of the pilot study justified a larger trial,this time incorporating a structured education program with multiple opportunities for skill-buildingand increasing knowledge, as well as peer support. The objective of this study was to evaluate theeffectiveness of the menu plan plus education sessions among people with T2D in improving glycemiccontrol and promoting dietary changes.
2. Materials and Methods
2.1. Participants
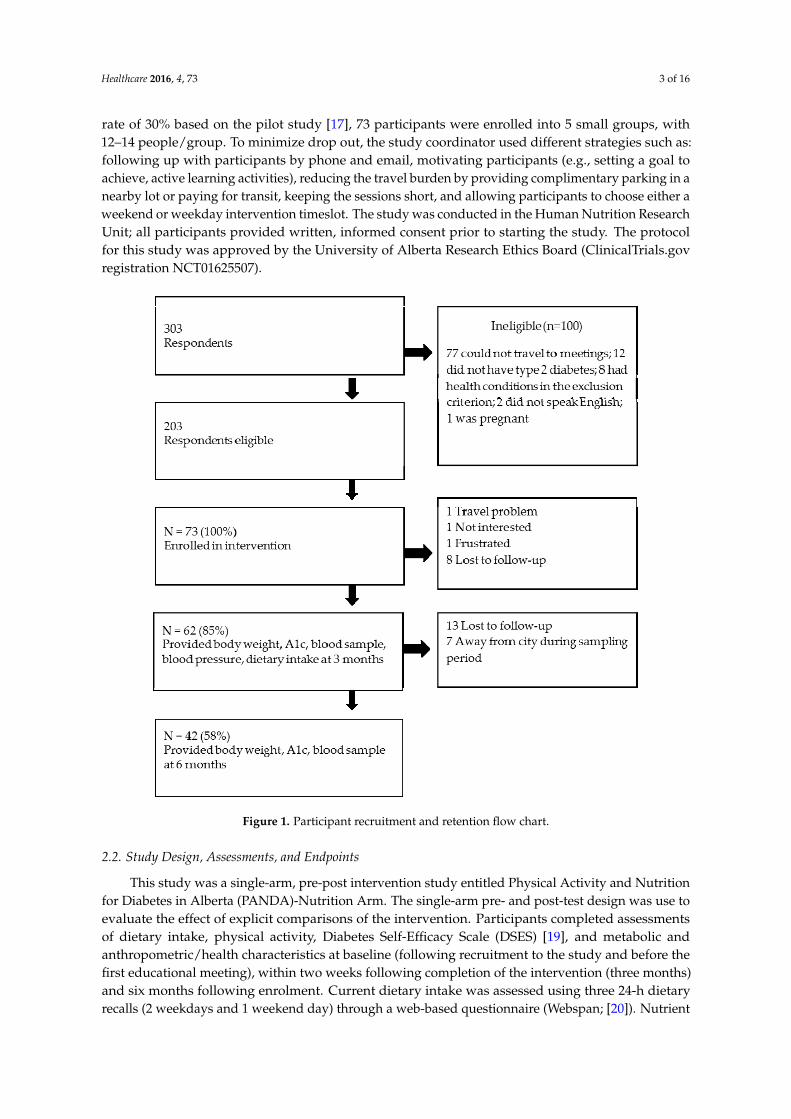
Participants were recruited for this study using posters hung in public places at the University ofAlberta in Edmonton, word-of-mouth, email invitations sent to a contact list of potential participantsmaintained by the Alberta Diabetes Institute, and publicity by local media. There were 303 respondentswho expressed interest in participating in this study (Figure 1), of whom 203 were deemed eligiblebased on a brief telephone interview. A personal screening interview was conducted to obtaindemographic and baseline information. Respondents met the inclusion criteria if they self-identified ashaving T2D, could speak and write English, and had attended an Alberta Health Services-conducteddiabetes education session. The exclusion criteria were: concomitant diseases or conditions that wouldpreclude them following the menu plan, or having type 1 diabetes, severe diabetes complicationssuch as kidney failure or being pregnant. The selection criteria were: subjects who met the inclusioncriteria, were able to commit time to the study and able and willing to travel to weekly meetings(on Friday or Saturday) at the University of Alberta campus in Edmonton, Alberta, Canada. Fromeligible respondents, an approximately equal number of males and females, as well as variation inA1c (where known), age, and ethnicity of participants was selected. In the event that more than1 respondent met the selection criteria, the date of response was considered, with the earlier datepreferred. Selection ceased once the required number of subjects was reached. An initial samplesize of 51 participants was calculated (alpha = 0.05, 1 − beta = 0.8, paired t-test) with the aim ofdetecting a 0.5% change in A1c, which was selected to be clinically relevant. Assuming a drop-out
Healthcare 2016, 4, 73 3 of 16
rate of 30% based on the pilot study [17], 73 participants were enrolled into 5 small groups, with12–14 people/group. To minimize drop out, the study coordinator used different strategies such as:following up with participants by phone and email, motivating participants (e.g., setting a goal toachieve, active learning activities), reducing the travel burden by providing complimentary parking in anearby lot or paying for transit, keeping the sessions short, and allowing participants to choose either aweekend or weekday intervention timeslot. The study was conducted in the Human Nutrition ResearchUnit; all participants provided written, informed consent prior to starting the study. The protocolfor this study was approved by the University of Alberta Research Ethics Board (ClinicalTrials.govregistration NCT01625507).
Healthcare 2016, 4, 73 3 of 16
An initial sample size of 51 participants was calculated (alpha = 0.05, 1 − beta = 0.8, paired t‐test) with
the aim of detecting a 0.5% change in A1c, which was selected to be clinically relevant. Assuming a
drop‐out rate of 30% based on the pilot study [17], 73 participants were enrolled into 5 small groups,
with 12–14 people/group. To minimize drop out, the study coordinator used different strategies
such as: following up with participants by phone and email, motivating participants (e.g., setting a
goal to achieve, active learning activities), reducing the travel burden by providing complimentary
parking in a nearby lot or paying for transit, keeping the sessions short, and allowing participants to
choose either a weekend or weekday intervention timeslot. The study was conducted in the Human
Nutrition Research Unit; all participants provided written, informed consent prior to starting the
study. The protocol for this study was approved by the University of Alberta Research Ethics Board
(ClinicalTrials.gov registration NCT01625507).
Figure 1. Participant recruitment and retention flow chart.
2.2. Study Design, Assessments, and Endpoints
This study was a single‐arm, pre‐post intervention study entitled Physical Activity and
Nutrition for Diabetes in Alberta (PANDA)‐Nutrition Arm. The single‐arm pre‐ and post‐test design
was use to evaluate the effect of explicit comparisons of the intervention. Participants completed
assessments of dietary intake, physical activity, Diabetes Self‐Efficacy Scale (DSES) [19], and
metabolic and anthropometric/health characteristics at baseline (following recruitment to the study
and before the first educational meeting), within two weeks following completion of the
intervention (three months) and six months following enrolment. Current dietary intake was
assessed using three 24‐h dietary recalls (2 weekdays and 1 weekend day) through a web‐based
Figure 1. Participant recruitment and retention flow chart.
2.2. Study Design, Assessments, and Endpoints
This study was a single-arm, pre-post intervention study entitled Physical Activity and Nutritionfor Diabetes in Alberta (PANDA)-Nutrition Arm. The single-arm pre- and post-test design was use toevaluate the effect of explicit comparisons of the intervention. Participants completed assessmentsof dietary intake, physical activity, Diabetes Self-Efficacy Scale (DSES) [19], and metabolic andanthropometric/health characteristics at baseline (following recruitment to the study and before thefirst educational meeting), within two weeks following completion of the intervention (three months)and six months following enrolment. Current dietary intake was assessed using three 24-h dietaryrecalls (2 weekdays and 1 weekend day) through a web-based questionnaire (Webspan; [20]). Nutrient
Healthcare 2016, 4, 73 4 of 16
intake was determined by linking the food intake data to the Canadian Nutrient File [21] afterthe food intake data had been carefully reviewed and cleaned to remove duplicate or implausibleentries. Implausible total energy was considered to be outside the range of 500–3500 kcal/day forwomen and 800–4000 kcal/day for men [22]; however, none of the participants reported implausibletotal energy. Estimated energy requirement (EER) for each participant was calculated by using theInstitute of Medicine method [23] with physical activity level estimated by converting steps/dayfrom pedometer readings (see below) to categories from sedentary (<5000 steps/day) to highly active(≥12,500 steps/day) [24]. The Goldberg cut-off was used to identify under-reported energy intake [25].Diet quality was assessed by calculating the Healthy Eating Index (HEI) adapted to the Canadianpopulation [26]. Participants’ perceptions of their dietary adherence to CDA Nutrition TherapyGuidelines were assessed by the Perceived Dietary Adherence Questionnaire (PDAQ) [27]. Prior toand post-intervention, participants were asked to report all the medications that they used (name ofdrug, frequency of use and dose) as a potential confounder of intervention outcomes.
Physical activity was assessed by a pedometer for three consecutive days. Instructions regardinguse of the pedometer were given by the research coordinator at the time of the first meeting, and asealed pedometer was provided to each participant at the first and seventh meetings. The pedometerwas attached to the belt or waistband of the participant’s clothing. Participants wore the pedometersfrom the time of rising in the morning until bedtime during the monitoring period. Pedometerswere removed during water-related activities (e.g., swimming, showering). After 3 days, participantswere instructed to remove the seal and to email the study coordinator the total number of steps.The pedometers were retrieved from the participants at the second and eighth meeting. The DSESwas used to measure participants’ perceived confidence in performing self-care activities related tonutrition, exercise, glucose control and diabetes-related decision-making [19]. Changes in the DSESscore between baseline and post-program assessment were used to assess potential influences insuccessful behavioral change.
Glycemic control was assessed using a finger prick blood sample (DCA 2000þ Analyzer; Bayer,Tarrytown, NY, USA). Fasting (minimum 12 h since last meal or snack) venous blood samples werecollected to assess triglycerides (TG), total-C, LDL-C and HDL-C. Blood samples were centrifuged(3500 rpm), and serum was removed and frozen at −80 ◦C until analyzed using enzymatic colorimetricassays (Wako Chemicals, Richmond, VA, USA) for each metabolite except LDL-C levels weredetermined by using the subtraction method.
Body weight was measured to the nearest 0.1 kg with the participant wearing light indoor clothingand without shoes using a digital scale (Health-o-Meter Professional Series; Sunbeam, Boca Raton,FL, USA), height was measured to the nearest 0.1 cm (Heightronic Digital Stadiometer; QuickMedical,Northbend, WA, USA) and body mass index (BMI) was calculated from height and weight measures.Waist circumference was measured to the nearest 0.1 cm with the participant in a standing position, witha non-stretch tape place midway between the lateral lower ribs and the iliac crests after a moderateexpiration. Body composition was measured using air displacement plethysmography (Bod Pod;COSMED USA, Concord, CA, USA). Blood pressure was determined following a 5-min rest periodwith the participant seated by an auto-inflated digital unit (UA-767CN; LifeSource, Japan). Bloodpressure was measured 3 times, each 2 minutes apart, and the results averaged. All measurementswere taken by trained personnel following standardized procedures.
2.3. Intervention
In accordance with best practices in nutrition interventions for diabetic patients, this study usedSocial Cognitive Theory as a theoretical model to guide the overall behavior change intervention.This model emphasizes skill acquisition through practice with feedback, support and positivereinforcement [28], goal-setting, self-monitoring and problem-solving as behavior change strategies.Weekly meetings approximately 1.5–2 h in length were conducted by a facilitator with a M.Sc. in humannutrition and trained as a dietician. The study held at the Human Nutrition Research Unit in the Alberta
Healthcare 2016, 4, 73 5 of 16
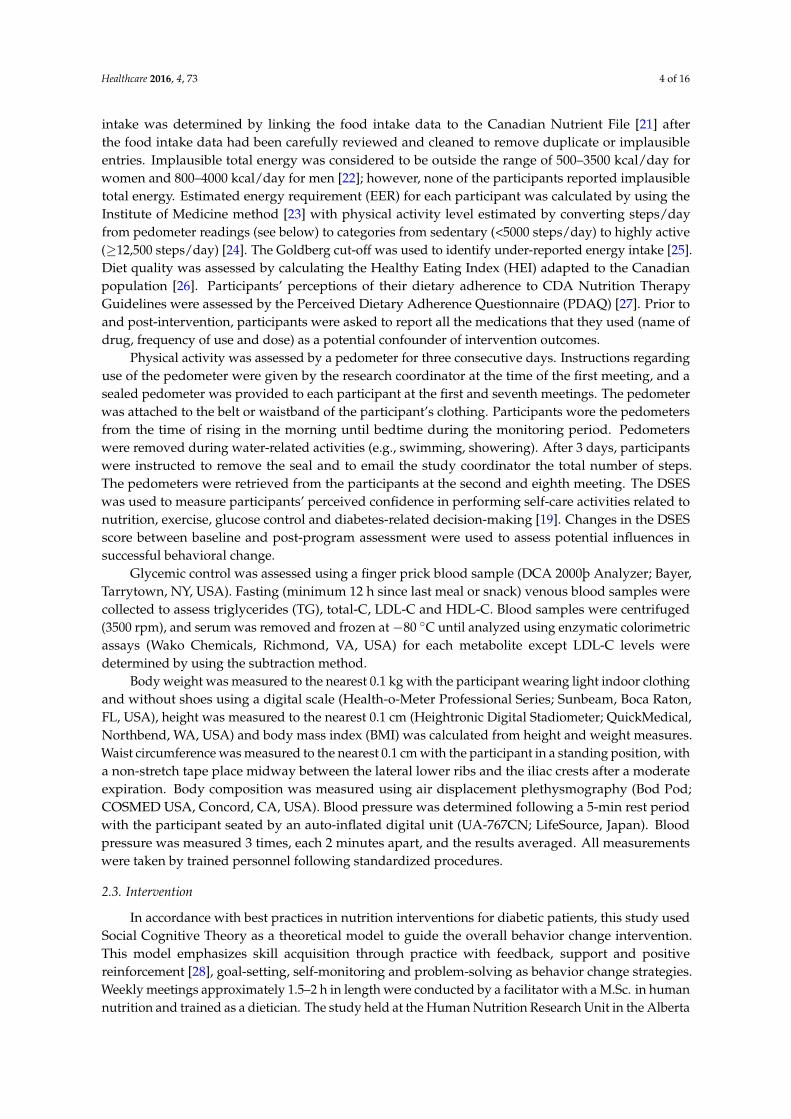
Diabetes Institute, the University of Alberta. The intervention curriculum consisted of five sessions(Figure 2, weeks 1–5): the first week focused on Canada’s Food Guide (CFG) food groups, serving sizesand number of recommended servings/day an open-ended discussion of facilitators and barriers toadhering to a dietary pattern consistent with CFG. Participants were encouraged to set individualizeddietary goals based on review of their personal baseline dietary intake data (provided during thesession) of food groups and servings. The second through fifth weeks started with a discussion ofparticipants’ experiences and reflections on attaining dietary goals and factors that contributed to theirdietary behaviors since the last session. At the end of each session, participants set new goals for theupcoming week. In week 2 of the curriculum, the menu plan was introduced. The participants wereprovided with, and based discussions on, a nutritionally adequate 4-week menu that incorporatedsuggested foods and ingredients that were locally available, financially and physically accessible,culturally acceptable and met the serving recommendations of CFG [29]. Additional information onthe menu plan is available at www.pureprairie.ca and a sample menu is provided in SupplementaryMaterials Table S1. Week 3 included activities demonstrating how the menu plan could be adapted forenergy needs, family size and cultural preferences, and included a cooking demonstration. In week4, participants discussed food choices when dining out and practiced reading food labels. In week 5,participants were provided with information and had opportunity to practice carbohydrate countingand choosing carbohydrate-rich foods with a low glycemic index. In week 8 participants toured agrocery store with a dietitian. In the week prior to the post-intervention assessment (i.e., at 11 weeks),participants completed three 24-h recalls. All participants were given a $50 gift card for a grocery storeof their choice for taking part in the study, and were reimbursed for parking or public transit expensesincurred. Finally, participants were invited to a post-intervention assessment 6 months after entry intothe study to measure the longer-term effects of the PANDA program on biological outcomes.
Healthcare 2016, 4, 73 5 of 16
five sessions (Figure 2, weeks 1–5): the first week focused on Canada’s Food Guide (CFG) food
groups, serving sizes and number of recommended servings/day an open‐ended discussion of
facilitators and barriers to adhering to a dietary pattern consistent with CFG. Participants were
encouraged to set individualized dietary goals based on review of their personal baseline dietary
intake data (provided during the session) of food groups and servings. The second through fifth
weeks started with a discussion of participants’ experiences and reflections on attaining dietary
goals and factors that contributed to their dietary behaviors since the last session. At the end of each
session, participants set new goals for the upcoming week. In week 2 of the curriculum, the menu
plan was introduced. The participants were provided with, and based discussions on, a nutritionally
adequate 4‐week menu that incorporated suggested foods and ingredients that were locally
available, financially and physically accessible, culturally acceptable and met the serving
recommendations of CFG [29]. Additional information on the menu plan is available at
www.pureprairie.ca and a sample menu is provided in Supplementary Materials Table S1. Week 3
included activities demonstrating how the menu plan could be adapted for energy needs, family size
and cultural preferences, and included a cooking demonstration. In week 4, participants discussed
food choices when dining out and practiced reading food labels. In week 5, participants were
provided with information and had opportunity to practice carbohydrate counting and choosing
carbohydrate‐rich foods with a low glycemic index. In week 8 participants toured a grocery store
with a dietitian. In the week prior to the post‐intervention assessment (i.e., at 11 weeks), participants
completed three 24‐h recalls. All participants were given a $50 gift card for a grocery store of their
choice for taking part in the study, and were reimbursed for parking or public transit expenses
incurred. Finally, participants were invited to a post‐intervention assessment 6 months after entry
into the study to measure the longer‐term effects of the PANDA program on biological outcomes.
Figure 2. Intervention timeline.
2.4. Statistical Analysis
Baseline data are reported as mean ± SD or proportions as appropriate. Baseline differences
between males and females were determined using a chi‐square test for categorical variables or
unpaired t‐test for continuous variables with p < 0.05 considered significant. Outcome analyses were
performed for those with complete data at baseline and post‐intervention using intention‐to‐treat
analysis conducted with 5 sets of multiple imputations (Amelia II package in R statistical software).
The multiple imputations generate values based on the expectation–maximization algorithm [30].
Imputation at 6 months was based on data obtained at baseline and 3 months. Differences between
baseline and post‐intervention measures were assessed and are reported as the mean difference
between baseline and post intervention values with 95% confidence intervals (CI). Pre‐post
differences were assessed by paired t‐test. Sensitivity analysis was carried out to estimate to what
the extent under‐reporting of energy intakes by participants affected nutritional intake outcomes
and effects on A1c by comparing those with under‐reported versus acceptable energy intakes
relative to EER. Pearson correlations were computed with all variables versus primary outcomes
(A1c, HEI) to identify potential determinants for linear regression modeling. Variable selection in the
Figure 2. Intervention timeline.
2.4. Statistical Analysis
Baseline data are reported as mean ± SD or proportions as appropriate. Baseline differencesbetween males and females were determined using a chi-square test for categorical variables orunpaired t-test for continuous variables with p < 0.05 considered significant. Outcome analyses wereperformed for those with complete data at baseline and post-intervention using intention-to-treatanalysis conducted with 5 sets of multiple imputations (Amelia II package in R statistical software).The multiple imputations generate values based on the expectation–maximization algorithm [30].Imputation at 6 months was based on data obtained at baseline and 3 months. Differences betweenbaseline and post-intervention measures were assessed and are reported as the mean differencebetween baseline and post intervention values with 95% confidence intervals (CI). Pre-post differenceswere assessed by paired t-test. Sensitivity analysis was carried out to estimate to what the extentunder-reporting of energy intakes by participants affected nutritional intake outcomes and effects onA1c by comparing those with under-reported versus acceptable energy intakes relative to EER. Pearsoncorrelations were computed with all variables versus primary outcomes (A1c, HEI) to identify potentialdeterminants for linear regression modeling. Variable selection in the linear regression models was

Healthcare 2016, 4, 73 6 of 16
based on literature review and bivariate correlation (p < 0.2). Multiple regression analyses were usedto examine the relationship between changes in BMI, HDL-C, total calories, HEI and PDAQ scoreswith post-intervention changes in A1c. This model was adjusted for potential confounding by age,gender, baseline physical activity, baseline HEI, baseline BMI and baseline A1c. Similarly, multiplelinear regression was used to examine the relationship between post-intervention changes in HEIscore and changes in total calories, fat intake, saturated fat intake, added sugar intake and sodiumintake as well as behavioral indicators, PDAQ and DSES. This model was adjusted for age, genderbaseline A1c, and HEI baseline. Data are reported as the change in A1c (unstandardized coefficient,B with 95% CI) predicted by a set change in the variable of interest. These analyses were conductedusing SPSS (IBM, version 22, IBM Analytics, Armonk, NY, USA); a p-value of < 0.05 was consideredstatistically significant.
3. Results
3.1. Study Participants at Baseline
Participants were older adults and had been diagnosed with T2D for approximately nine years.Similar numbers of men (n = 39) and women (n = 34) participated in this study (Figure 1 and Table 1).Eighty-five percent of participants completed the intervention and all assessments at three months,and 58% of participant returned for the assessments at six months post intervention. Men and womenin this study had similar demographic and health-related characteristics except that men had beendiagnosed with diabetes for a longer period of time, scored higher than women on the DSES, and hadhigher systolic blood pressure. The majority of participants (74%) reported taking oral medicationto control hyperglycemia. Hypertension (57.5%) and dyslipidemia (47.9%) medications were mostfrequently reported as additional medications by participants.
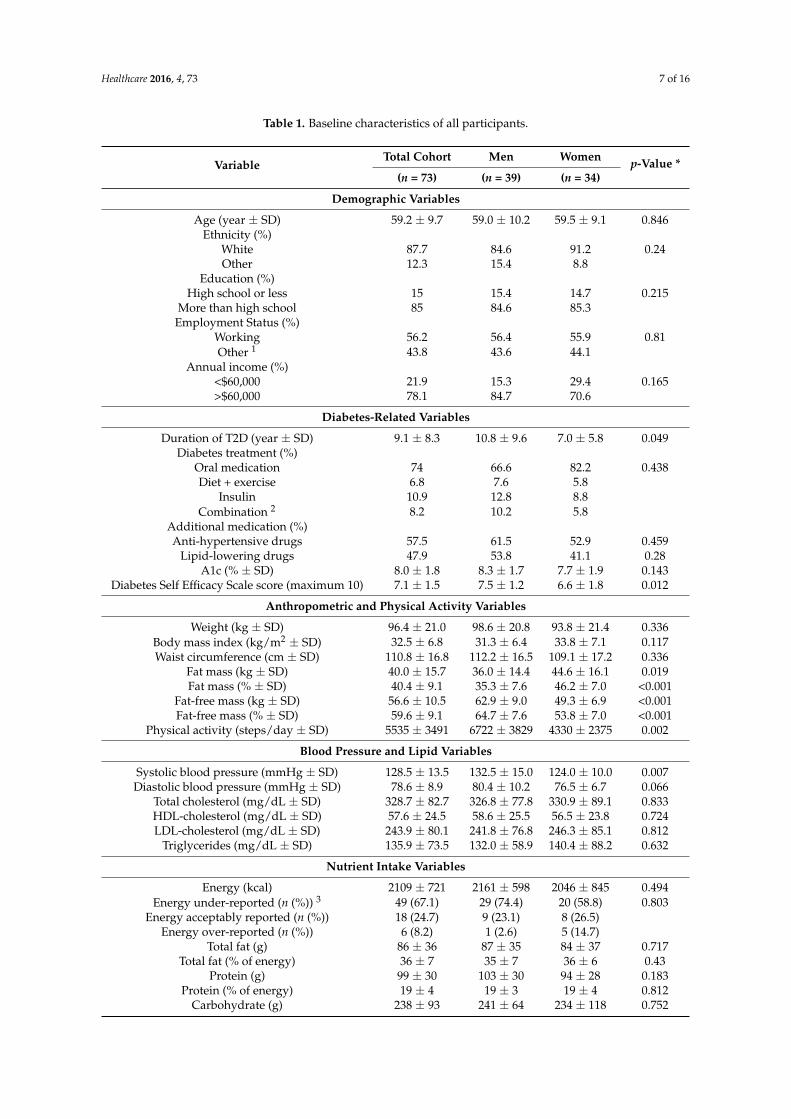
At baseline, energy intake was ~2100 kcal/day but was underestimated by two-thirds ofparticipants (Table 1). The CDA-recommended macronutrient distribution ranges for carbohydrate andprotein were met by the participants, but saturated fat (12% total energy) exceeded the recommendedcontribution to total energy (7%) and total fat was slightly higher than the recommended range(36% versus 35%). Added sugar (50 g/day) was also in the acceptable range (<10% of total energy)but fiber (22 g/day) was less than recommended (25 g/day) and sodium intake (3.4 g/day) exceededthe tolerable upper limit of 2.3 g/day. Generally, HEI scores indicated that participants “needimprovement” although two participants had poor diet quality (score <51) and eight had gooddiet quality (score >80). HEI scores correlated significantly with PDAQ scores (r = 0.418, p < 0.001).
3.2. Effect of PANDA–Nutrition Arm on A1c and Secondary Biological Outcomes
Biological outcomes for the cohort are reported in Table 2. Three months after the initiation ofthe PANDA intervention, A1c had decreased by 0.7% (95% CI 0.4% to 1.0%). Secondary outcomeswith significant improvements included: waist circumference, BMI, fat mass (kg), fat free mass (%),systolic and diastolic blood pressure, total-C, HDL-C and LDL-C. Physical activity was increased.At six-month follow-up, significant reductions in A1c, waist circumference, BMI, total-C, and LDL-Cwere still detected along with increased HDL-C (Table 2). No changes in hyperglycemia, hypertensionand dyslipidemia medications were reported by participants after the PANDA intervention. However,some participants (13.7%) did not report the frequency or dose of medications used.
Sensitivity analysis to determine the impact of under-reporting of energy intake on the primaryoutcome was conducted. A1c decreased by 0.6% (95% CI 0.3, 1.0) in individuals with under-reportedenergy compared with 1.1% (95% CI 0.5, 1.8) in those with acceptable reporting, which was notstatistically different.
Healthcare 2016, 4, 73 7 of 16
Table 1. Baseline characteristics of all participants.
VariableTotal Cohort Men Women p-Value *
(n = 73) (n = 39) (n = 34)
Demographic Variables
Age (year ± SD) 59.2 ± 9.7 59.0 ± 10.2 59.5 ± 9.1 0.846Ethnicity (%)
White 87.7 84.6 91.2 0.24Other 12.3 15.4 8.8
Education (%)High school or less 15 15.4 14.7 0.215
More than high school 85 84.6 85.3Employment Status (%)
Working 56.2 56.4 55.9 0.81Other 1 43.8 43.6 44.1
Annual income (%)<$60,000 21.9 15.3 29.4 0.165>$60,000 78.1 84.7 70.6
Diabetes-Related Variables
Duration of T2D (year ± SD) 9.1 ± 8.3 10.8 ± 9.6 7.0 ± 5.8 0.049Diabetes treatment (%)
Oral medication 74 66.6 82.2 0.438Diet + exercise 6.8 7.6 5.8
Insulin 10.9 12.8 8.8Combination 2 8.2 10.2 5.8
Additional medication (%)Anti-hypertensive drugs 57.5 61.5 52.9 0.459
Lipid-lowering drugs 47.9 53.8 41.1 0.28A1c (% ± SD) 8.0 ± 1.8 8.3 ± 1.7 7.7 ± 1.9 0.143
Diabetes Self Efficacy Scale score (maximum 10) 7.1 ± 1.5 7.5 ± 1.2 6.6 ± 1.8 0.012
Anthropometric and Physical Activity Variables
Weight (kg ± SD) 96.4 ± 21.0 98.6 ± 20.8 93.8 ± 21.4 0.336Body mass index (kg/m2 ± SD) 32.5 ± 6.8 31.3 ± 6.4 33.8 ± 7.1 0.117Waist circumference (cm ± SD) 110.8 ± 16.8 112.2 ± 16.5 109.1 ± 17.2 0.336
Fat mass (kg ± SD) 40.0 ± 15.7 36.0 ± 14.4 44.6 ± 16.1 0.019Fat mass (% ± SD) 40.4 ± 9.1 35.3 ± 7.6 46.2 ± 7.0 <0.001
Fat-free mass (kg ± SD) 56.6 ± 10.5 62.9 ± 9.0 49.3 ± 6.9 <0.001Fat-free mass (% ± SD) 59.6 ± 9.1 64.7 ± 7.6 53.8 ± 7.0 <0.001
Physical activity (steps/day ± SD) 5535 ± 3491 6722 ± 3829 4330 ± 2375 0.002
Blood Pressure and Lipid Variables
Systolic blood pressure (mmHg ± SD) 128.5 ± 13.5 132.5 ± 15.0 124.0 ± 10.0 0.007Diastolic blood pressure (mmHg ± SD) 78.6 ± 8.9 80.4 ± 10.2 76.5 ± 6.7 0.066
Total cholesterol (mg/dL ± SD) 328.7 ± 82.7 326.8 ± 77.8 330.9 ± 89.1 0.833HDL-cholesterol (mg/dL ± SD) 57.6 ± 24.5 58.6 ± 25.5 56.5 ± 23.8 0.724LDL-cholesterol (mg/dL ± SD) 243.9 ± 80.1 241.8 ± 76.8 246.3 ± 85.1 0.812
Triglycerides (mg/dL ± SD) 135.9 ± 73.5 132.0 ± 58.9 140.4 ± 88.2 0.632
Nutrient Intake Variables
Energy (kcal) 2109 ± 721 2161 ± 598 2046 ± 845 0.494Energy under-reported (n (%)) 3 49 (67.1) 29 (74.4) 20 (58.8) 0.803
Energy acceptably reported (n (%)) 18 (24.7) 9 (23.1) 8 (26.5)Energy over-reported (n (%)) 6 (8.2) 1 (2.6) 5 (14.7)
Total fat (g) 86 ± 36 87 ± 35 84 ± 37 0.717Total fat (% of energy) 36 ± 7 35 ± 7 36 ± 6 0.43
Protein (g) 99 ± 30 103 ± 30 94 ± 28 0.183Protein (% of energy) 19 ± 4 19 ± 3 19 ± 4 0.812
Carbohydrate (g) 238 ± 93 241 ± 64 234 ± 118 0.752
Healthcare 2016, 4, 73 8 of 16
Table 1. Cont.
VariableTotal Cohort Men Women p-Value *
(n = 73) (n = 39) (n = 34)
Nutrient Intake Variables
Carbohydrate (% of energy) 45 ± 7 45 ± 6 45 ± 7 0.919Fibre (g) 4 22 ± 7 21 ± 7 21 ± 7 0.888
Added sugar (g) 50 ± 47 43 ± 24 56 ± 63 0.254Added sugar (% of energy) 9 ± 5 8 ± 4 9 ± 6 0.123
Saturated fat (g) 28 ± 13 28 ± 11 27 ± 15 0.932Saturated fat (% of energy) 12 ± 3 12 ± 3 11 ± 3 0.583
MUFA (g) 30 ± 13 29 ± 12 30 ± 14 0.889MUFA (% of energy) 12 ± 3 11 ± 3 12 ± 3 0.105
PUFA (g) 15 ± 7 14 ± 7 15 ± 6 0.619PUFA (% of energy) 6 ± 2 5 ± 2 7 ± 2 0.36
Sodium (g) 3.36 ± 1.56 3.57 ± 1.50 3.11 ± 1.60 0.217Sodium density (mg/1000 kcal) 1.6 ± 0.5 1.6 ± 0.5 1.5 ± 0.4 0.284
Diet Quality and Adherence Variables
HEI score (maximum 100) 68.7 ± 8.9 68.1 ± 8.1 69.3 ± 9.8 0.533PDAQ score (maximum 63) 32.3 ± 11.3 32.9 ± 10.6 31.5 ± 12.1 0.611
Data presented based on the per-protocol analysis; * p < 0.05. Student’s unpaired t-test for continuous and X2
test for categorical variables; 1 Unemployed or retired; 2 Oral medication and insulin; 3 Estimated from theInstitutes of Medicine method [23] and the Goldberg cut off for acceptable energy intake [25]; 4 Dietary fiberonly, does not include supplements.
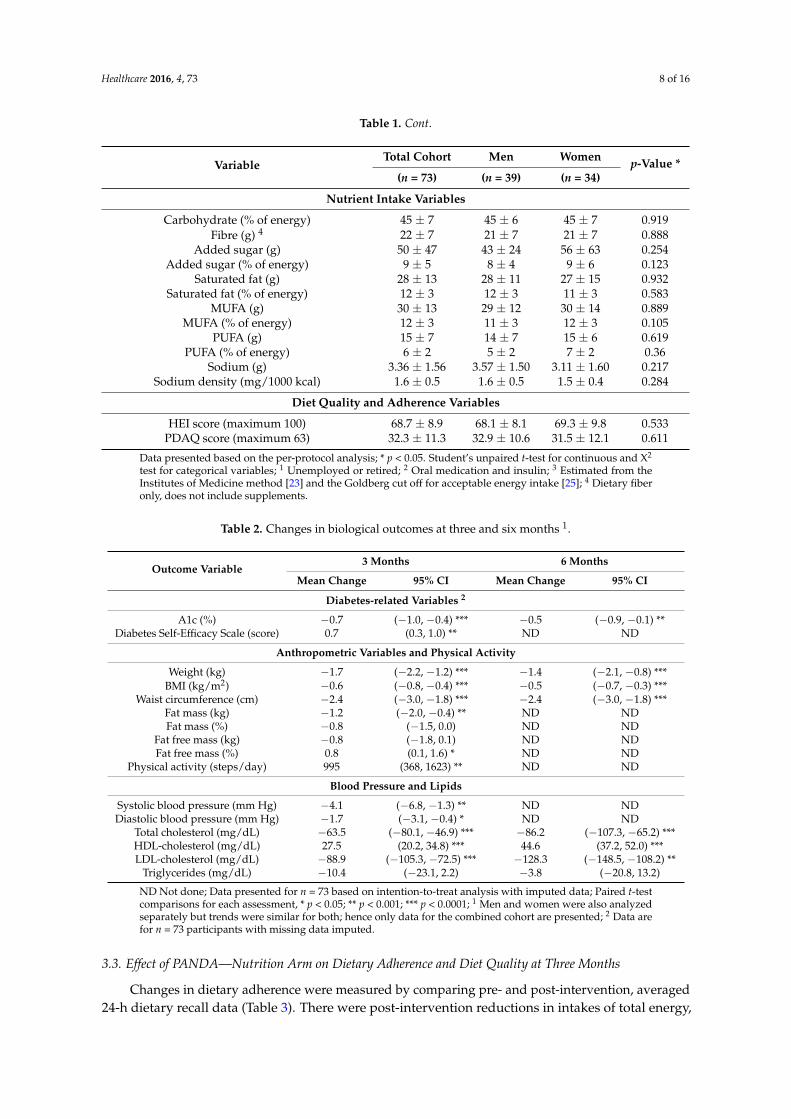
Table 2. Changes in biological outcomes at three and six months 1.
Outcome Variable3 Months 6 Months
Mean Change 95% CI Mean Change 95% CI
Diabetes-related Variables 2
A1c (%) −0.7 (−1.0, −0.4) *** −0.5 (−0.9, −0.1) **Diabetes Self-Efficacy Scale (score) 0.7 (0.3, 1.0) ** ND ND
Anthropometric Variables and Physical Activity
Weight (kg) −1.7 (−2.2, −1.2) *** −1.4 (−2.1, −0.8) ***BMI (kg/m2) −0.6 (−0.8, −0.4) *** −0.5 (−0.7, −0.3) ***
Waist circumference (cm) −2.4 (−3.0, −1.8) *** −2.4 (−3.0, −1.8) ***Fat mass (kg) −1.2 (−2.0, −0.4) ** ND NDFat mass (%) −0.8 (−1.5, 0.0) ND ND
Fat free mass (kg) −0.8 (−1.8, 0.1) ND NDFat free mass (%) 0.8 (0.1, 1.6) * ND ND
Physical activity (steps/day) 995 (368, 1623) ** ND ND
Blood Pressure and Lipids
Systolic blood pressure (mm Hg) −4.1 (−6.8, −1.3) ** ND NDDiastolic blood pressure (mm Hg) −1.7 (−3.1, −0.4) * ND ND
Total cholesterol (mg/dL) −63.5 (−80.1, −46.9) *** −86.2 (−107.3, −65.2) ***HDL-cholesterol (mg/dL) 27.5 (20.2, 34.8) *** 44.6 (37.2, 52.0) ***LDL-cholesterol (mg/dL) −88.9 (−105.3, −72.5) *** −128.3 (−148.5, −108.2) **
Triglycerides (mg/dL) −10.4 (−23.1, 2.2) −3.8 (−20.8, 13.2)
ND Not done; Data presented for n = 73 based on intention-to-treat analysis with imputed data; Paired t-testcomparisons for each assessment, * p < 0.05; ** p < 0.001; *** p < 0.0001; 1 Men and women were also analyzedseparately but trends were similar for both; hence only data for the combined cohort are presented; 2 Data arefor n = 73 participants with missing data imputed.
3.3. Effect of PANDA—Nutrition Arm on Dietary Adherence and Diet Quality at Three Months
Changes in dietary adherence were measured by comparing pre- and post-intervention, averaged24-h dietary recall data (Table 3). There were post-intervention reductions in intakes of total energy,
Healthcare 2016, 4, 73 9 of 16
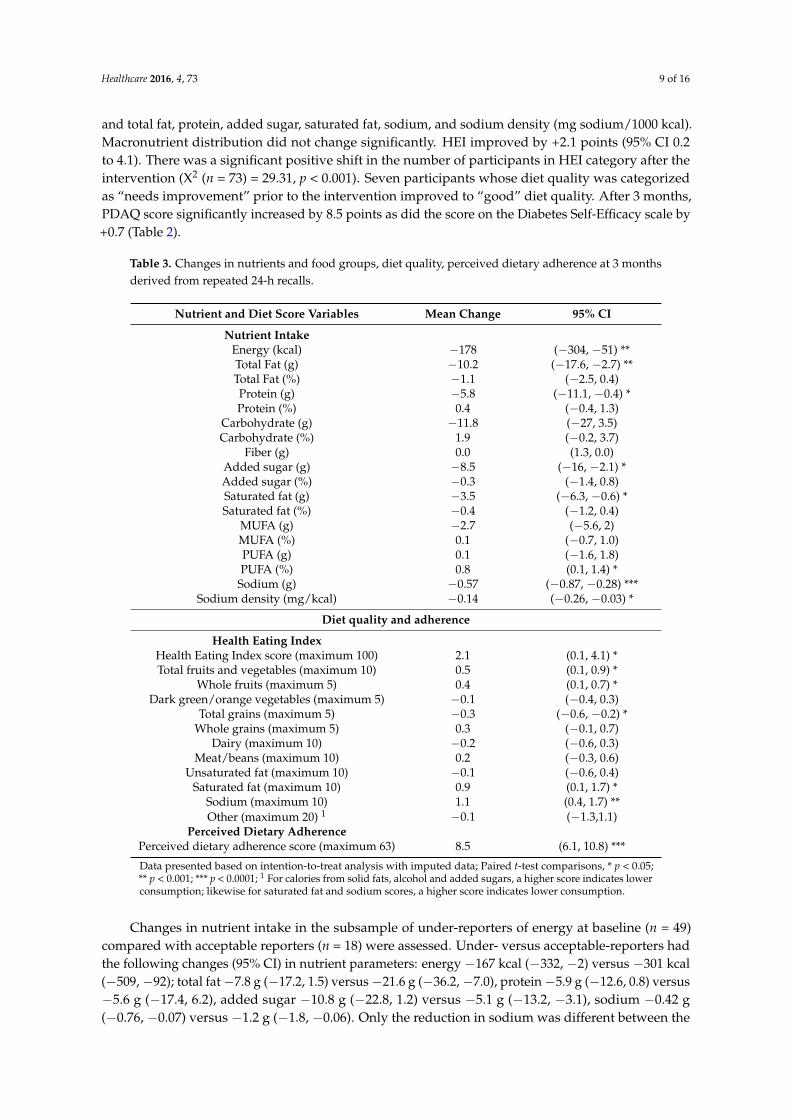
and total fat, protein, added sugar, saturated fat, sodium, and sodium density (mg sodium/1000 kcal).Macronutrient distribution did not change significantly. HEI improved by +2.1 points (95% CI 0.2to 4.1). There was a significant positive shift in the number of participants in HEI category after theintervention (X2 (n = 73) = 29.31, p < 0.001). Seven participants whose diet quality was categorizedas “needs improvement” prior to the intervention improved to “good” diet quality. After 3 months,PDAQ score significantly increased by 8.5 points as did the score on the Diabetes Self-Efficacy scale by+0.7 (Table 2).
Table 3. Changes in nutrients and food groups, diet quality, perceived dietary adherence at 3 monthsderived from repeated 24-h recalls.
Nutrient and Diet Score Variables Mean Change 95% CI
Nutrient IntakeEnergy (kcal) −178 (−304, −51) **Total Fat (g) −10.2 (−17.6, −2.7) **Total Fat (%) −1.1 (−2.5, 0.4)Protein (g) −5.8 (−11.1, −0.4) *Protein (%) 0.4 (−0.4, 1.3)
Carbohydrate (g) −11.8 (−27, 3.5)Carbohydrate (%) 1.9 (−0.2, 3.7)
Fiber (g) 0.0 (1.3, 0.0)Added sugar (g) −8.5 (−16, −2.1) *Added sugar (%) −0.3 (−1.4, 0.8)Saturated fat (g) −3.5 (−6.3, −0.6) *Saturated fat (%) −0.4 (−1.2, 0.4)
MUFA (g) −2.7 (−5.6, 2)MUFA (%) 0.1 (−0.7, 1.0)PUFA (g) 0.1 (−1.6, 1.8)PUFA (%) 0.8 (0.1, 1.4) *
Sodium (g) −0.57 (−0.87, −0.28) ***Sodium density (mg/kcal) −0.14 (−0.26, −0.03) *
Diet quality and adherence
Health Eating IndexHealth Eating Index score (maximum 100) 2.1 (0.1, 4.1) *Total fruits and vegetables (maximum 10) 0.5 (0.1, 0.9) *
Whole fruits (maximum 5) 0.4 (0.1, 0.7) *Dark green/orange vegetables (maximum 5) −0.1 (−0.4, 0.3)
Total grains (maximum 5) −0.3 (−0.6, −0.2) *Whole grains (maximum 5) 0.3 (−0.1, 0.7)
Dairy (maximum 10) −0.2 (−0.6, 0.3)Meat/beans (maximum 10) 0.2 (−0.3, 0.6)
Unsaturated fat (maximum 10) −0.1 (−0.6, 0.4)Saturated fat (maximum 10) 0.9 (0.1, 1.7) *
Sodium (maximum 10) 1.1 (0.4, 1.7) **Other (maximum 20) 1 −0.1 (−1.3,1.1)
Perceived Dietary AdherencePerceived dietary adherence score (maximum 63) 8.5 (6.1, 10.8) ***
Data presented based on intention-to-treat analysis with imputed data; Paired t-test comparisons, * p < 0.05;** p < 0.001; *** p < 0.0001; 1 For calories from solid fats, alcohol and added sugars, a higher score indicates lowerconsumption; likewise for saturated fat and sodium scores, a higher score indicates lower consumption.
Changes in nutrient intake in the subsample of under-reporters of energy at baseline (n = 49)compared with acceptable reporters (n = 18) were assessed. Under- versus acceptable-reporters hadthe following changes (95% CI) in nutrient parameters: energy −167 kcal (−332, −2) versus −301 kcal(−509, −92); total fat −7.8 g (−17.2, 1.5) versus −21.6 g (−36.2, −7.0), protein −5.9 g (−12.6, 0.8) versus−5.6 g (−17.4, 6.2), added sugar −10.8 g (−22.8, 1.2) versus −5.1 g (−13.2, −3.1), sodium −0.42 g(−0.76, −0.07) versus −1.2 g (−1.8, −0.06). Only the reduction in sodium was different between the
Healthcare 2016, 4, 73 10 of 16
groups (p < 0.001). HEI score changes were 1.3 (−0.8, 3.4) versus 4.4 (−0.6, 9.4) in under- versusacceptable-reporters, respectively. Notably, the number of participants acceptably reporting energyintake instead of under-reporting was increased by 12 individuals.
3.4. Predictors of Changes in A1c and HEI Score
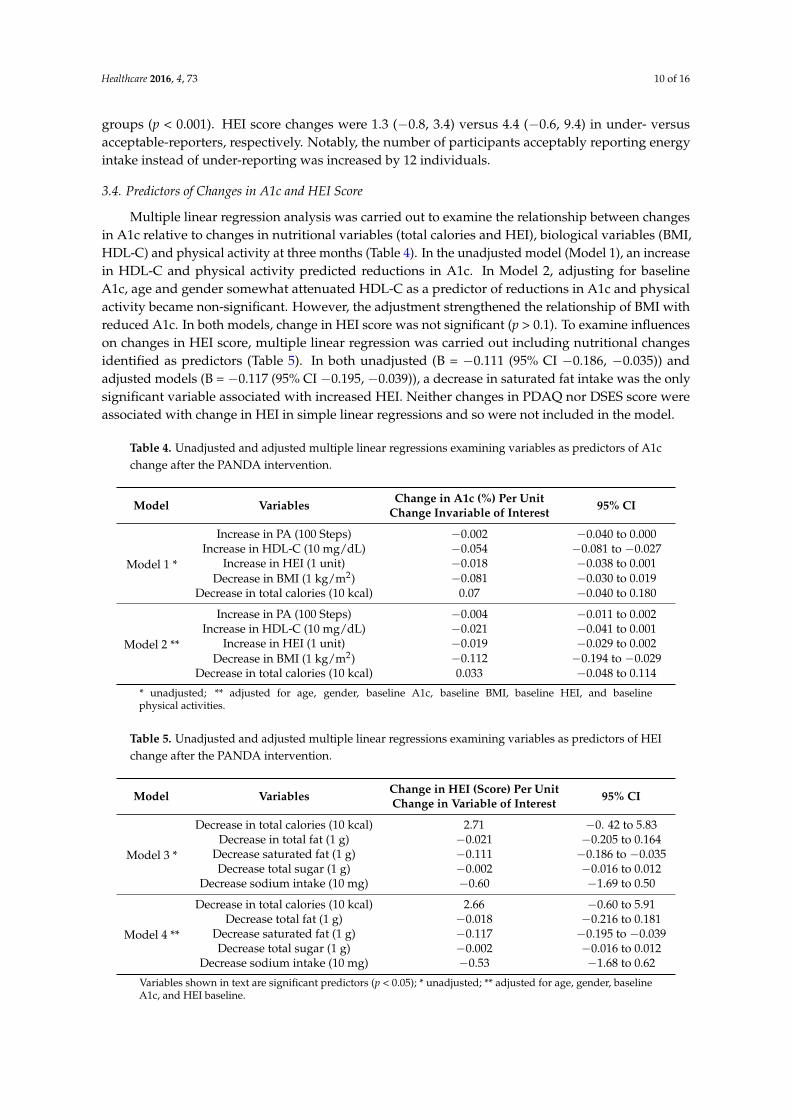
Multiple linear regression analysis was carried out to examine the relationship between changesin A1c relative to changes in nutritional variables (total calories and HEI), biological variables (BMI,HDL-C) and physical activity at three months (Table 4). In the unadjusted model (Model 1), an increasein HDL-C and physical activity predicted reductions in A1c. In Model 2, adjusting for baselineA1c, age and gender somewhat attenuated HDL-C as a predictor of reductions in A1c and physicalactivity became non-significant. However, the adjustment strengthened the relationship of BMI withreduced A1c. In both models, change in HEI score was not significant (p > 0.1). To examine influenceson changes in HEI score, multiple linear regression was carried out including nutritional changesidentified as predictors (Table 5). In both unadjusted (B = −0.111 (95% CI −0.186, −0.035)) andadjusted models (B = −0.117 (95% CI −0.195, −0.039)), a decrease in saturated fat intake was the onlysignificant variable associated with increased HEI. Neither changes in PDAQ nor DSES score wereassociated with change in HEI in simple linear regressions and so were not included in the model.
Table 4. Unadjusted and adjusted multiple linear regressions examining variables as predictors of A1cchange after the PANDA intervention.
Model Variables Change in A1c (%) Per UnitChange Invariable of Interest 95% CI
Model 1 *
Increase in PA (100 Steps) −0.002 −0.040 to 0.000Increase in HDL-C (10 mg/dL) −0.054 −0.081 to −0.027
Increase in HEI (1 unit) −0.018 −0.038 to 0.001Decrease in BMI (1 kg/m2) −0.081 −0.030 to 0.019
Decrease in total calories (10 kcal) 0.07 −0.040 to 0.180
Model 2 **
Increase in PA (100 Steps) −0.004 −0.011 to 0.002Increase in HDL-C (10 mg/dL) −0.021 −0.041 to 0.001
Increase in HEI (1 unit) −0.019 −0.029 to 0.002Decrease in BMI (1 kg/m2) −0.112 −0.194 to −0.029
Decrease in total calories (10 kcal) 0.033 −0.048 to 0.114
* unadjusted; ** adjusted for age, gender, baseline A1c, baseline BMI, baseline HEI, and baselinephysical activities.
Table 5. Unadjusted and adjusted multiple linear regressions examining variables as predictors of HEIchange after the PANDA intervention.
Model Variables Change in HEI (Score) Per UnitChange in Variable of Interest 95% CI
Model 3 *
Decrease in total calories (10 kcal) 2.71 −0. 42 to 5.83Decrease in total fat (1 g) −0.021 −0.205 to 0.164
Decrease saturated fat (1 g) −0.111 −0.186 to −0.035Decrease total sugar (1 g) −0.002 −0.016 to 0.012
Decrease sodium intake (10 mg) −0.60 −1.69 to 0.50
Model 4 **
Decrease in total calories (10 kcal) 2.66 −0.60 to 5.91Decrease total fat (1 g) −0.018 −0.216 to 0.181
Decrease saturated fat (1 g) −0.117 −0.195 to −0.039Decrease total sugar (1 g) −0.002 −0.016 to 0.012
Decrease sodium intake (10 mg) −0.53 −1.68 to 0.62
Variables shown in text are significant predictors (p < 0.05); * unadjusted; ** adjusted for age, gender, baselineA1c, and HEI baseline.
Healthcare 2016, 4, 73 11 of 16
4. Discussion
The results of this study indicate that the PANDA Nutrition Arm effectively improved clinicaloutcomes and dietary adherence in T2D participants. The menu plan was based on the 4-A Frameworkfor content and the intervention education utilized Social Cognitive Theory for process. Significantimprovements were found across A1c, anthropometric variables and lipid profile variables after threemonths and sustained at six months. Effectiveness and sustainability of the menu plan programto improve clinical outcomes occurred despite the fact that the intervention focused on nutritioneducation and healthy eating patterns, not weight loss.
We observed important changes in participants’ eating patterns following the PANDA program.Diet quality (HEI score) improved modestly after three months. The improved total score wasattributable to increased whole fruit intake along with decreased saturated fat and sodium sub-scores.A meta-analysis of 15 cohort studies reported that diet quality was associated with reduced risk ofall-cause mortality, CVD, cancer and T2D [31]. Therefore, improvement of diet quality may havepositive consequences in the risk of further complications for people with T2D. Although only amodest improvement in HEI score was recorded, reductions in total energy, total fat, and sodiumintake were achieved. Total energy is important in terms of glycemic control. Some studies haveshown improved in glycemic control when total energy is restricted [32,33]. Fat intake may alsoaffect glycemic control. A low-fat calorie-restricted diet can improve glycemic control among in T2Dpatients [34]. The HEI score does not take into account caloric reduction or all aspects of a diabetesdiet, for example recommendations to consume low glycemic index foods and may underestimatedietary changes in this population.
The biggest change in diet was a reduction in sodium intake that persisted after adjusting forenergy intake. This improved sodium consumption pattern may reflect changes in eating habitsof study participants, for example eating more food cooked from scratch vs. restaurant meals [35].A study of the DASH diet showed that limiting sodium intake to <2300 mg/day predicted reducedblood pressure [36]. Elsewhere, a 24-week meal preparation intervention was conducted in T2Dpatients. The program successfully reduced weight, A1c, and there was a trend toward lower bloodpressure but sodium intake was not documented [37]. Our study showed a significant reduction insystolic blood pressure by 4.1 mm Hg and diastolic blood pressure by 1.7 mm Hg. Therefore, thePANDA intervention menu plan led to overall improved diet quality, which may have contributed toimproved blood pressure control.
Adherence to the Canadian nutrition recommendations for diabetes was assessed by the PDAQ.We found a significant improvement in the PDAQ score after three months (+8.5 points), which impliesthat the PANDA Nutrition Arm is feasible for helping people with diabetes to follow the dietaryrecommendations, and possibly more sensitive to behavioral change than assessment of dietary intakeor the HEI score because it asked specific questions about diabetes nutrition recommendations, fiberintake and low glycemic foods for example.
The PANDA Nutrition Arm led to a significant improvement in A1c at three months (−0.7%)that was sustained six months after the program. This change in A1c is greater than found in severalother nutrition interventions [16,38]. The change in A1c, although modest, is considered clinicallyrelevant and can reduce the risk of long-term diabetes complications [39,40]. However, it is not clearwhether improvement in A1c was related to diet or physical activity changes since neither emergedas a strong predictor in the linear regression models and both can lead to weight loss [41]. In ourstudy, weight loss was the strongest predictor of improved A1c, with −1 kg/m2 predicting a 0.1%reduction in A1c. A confounder was revealed through categorization of participants as acceptableor under-reporters of energy intake because the number of acceptable reporters increased from 18 to30 from baseline to three months. Therefore, changes in energy intake and other nutrient variableswere underestimated, which may have contributed to lack of significance in the models. Our resultsare consistent with the Look AHEAD cohort, which showed that a modest weight loss of 2%–5%was associated with significant improvement in A1c (1.80% (95% CI 1.44–2.24)), and other CVD risk
Healthcare 2016, 4, 73 12 of 16
factors [42]. We also observed significant changes in fat mass and waist circumference similar inmagnitude to those observed in the Look AHEAD trial [43]. The inverse relationship between changesin A1c and serum HDL-C shown in the PANDA intervention has been reported by others [44,45] but isnot as well established as that between A1c and BMI and is not seen in all studies [46,47]. However,a prospective trial demonstrated that low baseline HDL-C predicted more rapid long-term progressionof T2D [46]. HDL-C promotes insulin secretion and protection from apoptosis of beta-cells [48],which may be related to HDL-C-mediated anti-oxidative and cellular cholesterol efflux activities [49].HDL-C also improves insulin-independent glucose uptake into skeletal muscle [50]. Thus, someauthors recommend that increasing HDL-C be considered an important strategy to improve glycemiccontrol [51].
Cardiovascular disease (CVD) is the leading cause of death among diabetic patients. Lifestyleinterventions have the potential to improve several risk factors for CVD such as glycemic control,blood pressure and lipids [4,17,52]. After the PANDA program, we observed improvements in total-C,HDL-C and LDL-C at three and six months. Moreover, consistent with our pilot study [17], a significantreduction in blood pressure was found. The significant changes in clinical outcomes documented afterthe PANDA intervention, if sustained over the long-term, may lower risk of future CVD.
One major difference between the PANDA nutrition intervention and other similar programsis our emphasis on the 4-A Framework. We propose that focusing on the 4-A Framework for thediabetes menu plan for management helped achieve the desired effect. Providing locally grown orimported ingredients (Food Availability) may have increased feasibility for the participants to adoptthe menu plan. Most recipes used affordable ingredients [53] to help overcome the barrier related tofood prices. The menu plan was based on culturally acceptable food for diabetic Albertan participants(Acceptable Food) and it was clear and easy to follow. Thus, the 4-A Framework underpinningthe PANDA menu plan helped to ensure adequate nutrient intake (Food Adequacy), and improvediet adherence and health outcomes among individuals with T2D. As part of the evaluation of theintervention, participants also completed pre- and post-intervention questionnaires regarding foodavailability, accessibility and acceptability, not reported here. Another benefit of the education programmay have been the emphasis on appropriate portion sizes, as evidenced by the reduction in the numberof participants who under-reported dietary intake from baseline to three months.
A strength of this study is that we translated the complex CDA nutrition recommendations,and the serving recommendations suggested in CFG, into a simple and practical menu plan, aroundwhich the theory-based education program was built. The menu plan also took into consideration the4-A Framework. Several outcomes including A1c, lipid profile and anthropometric measurementswere measured at the end of the intervention and three months after the final contact. We wereable to compare these biological outcomes to nutritional changes using a web-based 24-h recallplatform that participants readily used. The study used several strategies to increase retentionrate, including reimbursement for parking or public transit expenses and a gift card for $50 ofgroceries for participating. Telephone and email reminders were also helpful. However, duringmost trials participants are lost to follow-up. In our study, the attrition rate at three months was15% (about half that predicted from our pilot study [17]), and at six months 42%. There are variousreasons for participants not attending follow-up appointments particularly at six months such astaking holidays, lack of time, conflict with travel and lack of motivation or interest. Repeating theanalyses using a per-protocol approach yielded similar results [54]. There are several other limitationsof this study. First, the study did not include a control group and participants were self-selectedvolunteers, which may affect overall motivation. Not having a control group may be a weaknessbut disadvantages of randomized controlled trials for dietary interventions, particularly those thatelicit variable behavior changes in participants, have been noted [55]. A recent meta-analysis foundthat behavioral interventions consistently result in lowering of BMI and A1c superior to controlsin trials with randomization [38]. The majority of the participants were Caucasian; therefore, wecannot generalize the results to all ethnicities. Even though dietary intakes were assessed with a
Healthcare 2016, 4, 73 13 of 16
validated internet-based questionnaire, measurement error may occur due to inaccurate reporting byparticipants. In addition, the platform could not distinguish between home-cooked or restaurant meals,such details as types of oil in salad dressings or homemade vs. canned soup, which may thereforeunder-estimate shifts in consumption patterns. Therefore, changes in biological variables may moreaccurately reflect the effectiveness of the program than analysis of dietary intake. In addition, the studydid not assess dietary adherence in the follow-up assessment. Medication use can affect the biologicaloutcomes we measured; although no changes in medication were reported, missing data from 14% ofparticipants limited our ability to analyze changes in drug regimens as a potential confounder.
5. Conclusions
In summary, the menu plan delivered as part of an education program led to significantimprovements in glycemic control, lipid profile, and anthropometric measurements that were sustainedover six months. In addition, positive changes in dietary habits, including reduced sodium intakewere documented. The PANDA Nutrition Arm was shown to be effective and feasible for improvingclinical outcomes in diabetic patients. Further research is warranted to examine its delivery in acommunity-based model.
Supplementary Materials: The following are available online at www.mdpi.com/2227-9032/4/4/73/s1, Table S1:A one-day sample menu.
Acknowledgments: Research funding was from Alberta Diabetes Institute (translational grant), Universityof Alberta. Ghada Asaad received personal funding from the Ministry for Higher Education, Kingdom ofSaudi Arabia.
Author Contributions: The authors’ responsibilities were as follows: Catherine B. Chan and Rhonda C. Belldesigned the menu plan, the PDAQ and the intervention trial. Ghada Asaad and Diana C. Soria-Contreras carriedout the participant recruitment and data collection. Diana C. Soria-Contreras conducted the intervention sessions.Ghada Asaad entered and analyzed the data and wrote the manuscript. Catherine B. Chan provided criticalfeedback and edits on data analysis, data interpretation, and manuscript presentation. All authors reviewed themanuscript, provided their feedback and approval of its submission.
Conflicts of Interest: The authors declare no conflict of interest.
References
1. International Diabetes Federation. Diabetes Atlas, 6th ed. Available online: http://www.idf.org/sites/default/files/EN_6E_Atlas_Full_0.pdf (accessed on 21 May 2016).
2. Public Health Agency of Canada. Diabetes in Canada: Facts and Figures from a Public Health Perspective.Available online: http://www.phac-aspc.gc.ca/cd-mc/publications/diabetes-diabete/facts-figures-faits-chiffres-2011/index-eng.php (accessed on 21 May 2016).
3. Canadian Diabetes Association. An Economic Tsunami: The Cost of Diabetes in Canada 2009.Available online: https://www.diabetes.ca/CDA/media/documents/publications-and-newsletters/advocacy-reports/economic-tsunami-cost-of-diabetes-in-canada-english.pdf (accessed on 21 May 2016).
4. Dworatzek, P.D.; Arcudi, K.; Gougeon, R.; Husein, H.; Sievenpiper, J.L.; Williams, S.L. Canadian DiabetesAssociation 2013 Clinical Practice Guidelines for the Prevention and Management of Diabetes in Canada:Nutrition therapy. Can. J. Diabetes 2013, 37, S45–S55. [CrossRef] [PubMed]
5. Nagelkerk, J.; Reick, K.; Meengs, L. Perceived barriers and effective strategies to diabetes self-management.J. Adv. Nurs. 2006, 54, 151–158. [CrossRef] [PubMed]
6. Assad, G.; Chan, C.B. Relationship of diet quality to food security and nutrition knowledge in low-income,community-dwelling elders with type 2 diabetes mellitus: A pilot study. Can. J. Diabetes 2012, 36, 310–313.[CrossRef]
7. Jarvandi, S.; Gougeon, R.; Bader, A.; Dasgupta, K. Differences in food intake among obese and nonobesewomen and men with type 2 diabetes. J. Am. Coll. Nutr. 2011, 30, 225–232. [CrossRef] [PubMed]
8. Munoz-Pareja, M.; Leon-Munoz, L.M.; Guallar-Castillon, M.; Graciani, A.; López-García, E.; Banegas, J.R.;Rodríguez-Artalejo, F. The diet of diabetic patients in Spain in 2008–2010: Accordance with the main dietaryrecommendations: A cross-sectional study. PLoS ONE 2012, 7. [CrossRef] [PubMed]
Healthcare 2016, 4, 73 14 of 16
9. Berry, T.R.; Anders, S.; Chan, C.B.; Bell, R.C. Communicating diabetes best practices to clients: A preliminaryinvestigation of educator perspectives. Health Promot. Pract. 2012, 3, 388–394. [CrossRef] [PubMed]
10. Aitaoto, N.; Campo, S.; Snetselaar, L.G.; Janz, K.F.; Farris, K.B.; Parker, E.; Belyeu-Camacho, T.; Jimenez, R.P.Formative research to inform nutrition interventions in Chuuk and the US Pacific. J. Acad. Nutr. Diet. 2015, 6,947–953. [CrossRef] [PubMed]
11. Deng, F.; Zhang, A.; Chan, C. Acculturation, dietary acceptability, and diabetes management among Chinesein North America. Front. Endocrinol. 2013, 4, 1–7. [CrossRef] [PubMed]
12. Berry, T.; Chan, C.; Bell, R.; Walker, J. Collective knowledge: Using a consensus conference approach todevelop recommendations for physical activity and nutrition programs for persons with type 2 diabetes.Front. Endocrinol. 2012, 3, 1–5. [CrossRef] [PubMed]
13. US Aid. Food Security Indicators and Framework for Use in the Monitoring and Evaluation of FoodAid Programs 1999. Available online: http://pdf.usaid.gov/pdf_docs/PNACG170.pdf (accessed on21 May 2016).
14. Ross, T.; Geil, P. Healthy eating on a lean budget: Diabetes meals for less. Diabetes Spectr. 2010, 2, 120–123.[CrossRef]
15. Cunningham, C.; Johnson, S.; Cowell, B.; Soroudi, N.; Isaacson, S.; Davis, N.; Wylie-Rosett, J. Menu plans in adiabetes self-management weight loss program. J. Nutr. Educ. Behav. 2006, 38, 264–266. [CrossRef] [PubMed]
16. Bader, A.; Gougeon, R.; Joseph, L.; Da Costa, D.; Dasgupta, K. Nutritional education throughinternet-delivered menu plans among adults with type 2 diabetes mellitus: Pilot study. JMIR Res. Protoc.2013, 2, e41–e46. [CrossRef] [PubMed]
17. Soria-Contreras, D.; Bell, R.; McCargar, L.; Chan, C. Feasibility and efficacy of menu planning combined withindividual counselling to improve health outcomes and dietary adherence in people with type 2 diabetes:A pilot study. Can. J. Diabetes 2014, 38, 320–325. [CrossRef] [PubMed]
18. Soria-Contreras, D.; Berry, T.R.; Chan, C.B. Using focus group interviews to develop a menu plan to improvedietary adherence in type 2 diabetes. Unpublished Work.
19. Toobert, D.J.; Hampson, S.E.; Glasgow, R.E. The summary of diabetes self-care activities measure: Resultsfrom 7 studies and a revised scale. Diabetes Care 2000, 23, 943–950. [CrossRef] [PubMed]
20. Storey, K.; McCargar, L. Reliability and validity of Web-SPAN, a web-based method for assessing weightstatus, diet and physical activity in youth. J. Hum. Nutr. Diet. 2012, 25, 59–68. [CrossRef] [PubMed]
21. Nutrition Research Division, Health Canada. Canadian Nutrient File 2001b. Available online:http://www.hc-sc.gc.ca/fn-an/nutrition/fiche-nutri-data/index-eng.php (accessed on 21 May 2016).
22. Willet, W. Nutritional Epidemiology, 2nd ed.; Oxford University Press: New York, NY, USA, 1998.23. Food and Nutrition Board, Institute of Medicine, National Academy of Sciences. Dietary Reference Intakes:
Applications in Dietary Planning; National Academies Press: Washington, DC, USA, 2003.24. Tudor-Locke, C.; Bassett, D.R., Jr. How many steps/day are enough? Preliminary pedometer indices for
public health. Sport. Med. 2004, 34, 1–8. [CrossRef]25. Black, A.E. Critical evaluation of energy intake using the Goldberg cut-off for energy intake: Basal metabolic
rate. A practical guide to its calculation, use and limitations. Int. J. Obes. 2000, 24, 1119–1130. [CrossRef]26. Garriguet, D. Diet quality in Canada. Health Rep. 2009, 2, 41–52.27. Asaad, G.; Sadegian, M.; Lau, R.; Xu, Y.; Soria-Contreras, D.C.; Bell, R.C.; Chan, B.C. The reliability and
validity of the perceived dietary adherence questionnaire for people with type 2 diabetes. Nutrtients 2015, 7,5484–5496. [CrossRef] [PubMed]
28. Bandura, A. Social Foundation of Thought and Action: A Social Cognitive Theory; Prentice Hall: EnglewoodCliffs, NJ, USA, 1986.
29. Health Canada. Eating Well with Canada’s Food Guide. Available online: http://www.hcsc.gc.ca/fn-an/food-guide-aliment/index-eng.php (accessed on 21 May 2016).
30. The Comprehensive R Archive Network. Available online: https://cran.r-project.org/web/packages/Amelia/vignettes/amelia.pdf (accessed on 2 September 2016).
31. Schwingshackl, L.; Hoffmann, G. Diet quality as assessed by the Healthy Eating Index, the Alternate HealthyEating Index, the Dietary Approaches to Stop Hypertension Score, and health outcomes: A systematic reviewand meta-analysis of cohort studies. J. Acad. Nutr. Diet. 2015, 5, 780–800. [CrossRef] [PubMed]
Healthcare 2016, 4, 73 15 of 16
32. Bell, R.A.; Summerson, J.H.; Konen, J.C. Dietary intakes by levels of glycemic control for black and whiteadults with non-insulin dependent diabetes mellitus (NIDDM). J. Am. Coll. Nutr. 1995, 14, 144–151.[CrossRef] [PubMed]
33. Heilbronn, L.K.; Noakes, M.; Clifton, P.M. Effect of energy restriction, weight loss, and diet compositionon plasma lipids and glucose in patients with type 2 diabetes. Diabetes Care 1999, 22, 889–895. [CrossRef][PubMed]
34. Davis, N.J.; Tomuta, N.; Schechter, C.; Isasi, C.R.; Segal-Isaacson, C.J.; Stein, D.; Zonszein, J.; Wylie-Rosett, J.Comparative study of the effects of a 1-year dietary intervention of a low-carbohydrate diet versus a low-fatdiet on weight and glycemic control in type 2 diabetes. Diabetes Care 2009, 7, 1147–1152. [CrossRef] [PubMed]
35. Wang, J.; Olendzki, B.; Wedick, N.; Persuitte, G.; Culver, A.; Li, W.; Ma, Y. Challenges in sodium intakereduction and meal consumption patterns among participants with metabolic syndrome in a dietary trial.Nutr. J. 2013, 12, 162–171. [CrossRef] [PubMed]
36. Blumenthal, J.A.; Babyak, M.A.; Hinderliter, A.; Watkins, L.L.; Craighead, L.; Li, P.; Sherwood, A. Effects ofthe DASH diet alone and in combination with exercise and weight loss on blood pressure and cardiovascularbiomarkers in men and women with high blood pressure: The ENCORE study. Arch. Intern. Med. 2010, 170,126–135. [CrossRef] [PubMed]
37. Dasgupta, K.; Hajna, S.; Joseph, L.; Da Costa, D.; Christopoulos, S.; Gougeon, R. Effects of meal preparationtraining on body weight, glycemia, and blood pressure: Results of a phase 2 trial in type 2 diabetes. Int. J.Behav. Nutr. Phys. Act. 2012, 9, 125–135. [CrossRef] [PubMed]
38. Chen, L.; Pei, J.; Kuang, J.; Chen, H.; Chen, Z.; Li, Z.; Yang, H. Effect of lifestyle intervention in patients withtype 2 diabetes: A meta-analysis. Metab. Clin. Exp. 2015, 64, 338–347. [CrossRef] [PubMed]
39. The Diabetes Control and Complications Trial Research Group. The effect of intensive treatment of diabeteson the development and progression of long-term complications in insulin-dependent diabetes mellitus.N. Engl. J. Med. 1993, 329, 977–986.
40. UK Prospective Diabetes Study Group. Intensive blood-glucose control with sulphonylureas or insulincompared with conventional treatment and risk of complications in patients with type 2 diabetes. Lancet1998, 352, 837–853.
41. Elfhag, K.; Rössner, S. Who succeeds in maintaining weight loss? A conceptual review of factors associatedwith weight loss maintenance and weight regain. Obes. Rev. 2005, 6, 67–85. [CrossRef] [PubMed]
42. Wing, R.; Lang, W.; Wadden, T.; Safford, M.; Knowler, W.; Bertoni, A.; Wagenknecht, L. Benefits of modestweight loss in improving cardiovascular risk factors in overweight and obese individuals with type 2diabetes. Diabetes Care 2011, 34, 1481–1486. [CrossRef] [PubMed]
43. Gallagher, D.; Heshka, S.; Kelley, D.E.; Thornton, J.; Boxt, L.; Pi-Sunyer, F.X.; Clark, J.M. Changes in adiposetissue depots and metabolic markers following a 1-year diet and exercise intervention in overweight andobese patients with type 2 diabetes. Diabetes Care 2014, 37, 3325–3332. [CrossRef] [PubMed]
44. Khan, H. Clinical significance of HbA(1c) as a marker of circulating lipids in male and female type 2 diabeticpatients. Acta Diabetol. 2007, 4, 193–200. [CrossRef] [PubMed]
45. Gatti, A.; Maranghi, M.; Bacci, S.; Carallo, C.; Gnasso, A.; Mandosi, E.; Filetti, S. Poor glycemic control isan independent risk factor for low HDL cholesterol in patients with type 2 diabetes. Diabetes Care 2009, 8,1550–1552. [CrossRef] [PubMed]
46. Waldman, B.; Jenkins, A.J.; Davis, T.E.; Taskinen, M.; Scott, R.; O’Connell, R.L.; Keech, A.C. HDL-C andHDL-C/ApoA-I predict long-term progression of glycemia in established type 2 diabetes. Diabetes Care 2014,8, 2351–2358. [CrossRef] [PubMed]
47. Lee, H.; Yim, J.; Kim, Y.; Choue, R. Moderate diet-induced weight loss is associated with improved insulinsensitivity in middle-aged healthy obese Korean women. Nutr. Res. Pract. 2014, 4, 469–475. [CrossRef][PubMed]
48. Rutti, S.; Ehses, J.; Sibler, R.; Prazak, R.; Rohrer, L.; Georgopoulos, S.; von Eckardstein, A. Low- andhigh-density lipoproteins modulate function, apoptosis, and proliferation of primary human and murinepancreatic beta-cells. Endocrinology 2009, 10, 4521–4530. [CrossRef] [PubMed]
49. Dullaart, R.; Annema, W.; de Boer, J.; Tietge, U. Pancreatic β-cell function relates positively to HDLfunctionality in well-controlled type 2 diabetes mellitus. Atherosclerosis 2012, 2, 567–573. [CrossRef] [PubMed]
Healthcare 2016, 4, 73 16 of 16
50. Drew, B.; Duffy, S.; Formosa, M.; Natoli, A.; Henstridge, D.; Penfold, S.; Kingwell, B. High-density lipoproteinmodulates glucose metabolism in patients with type 2 diabetes mellitus. Circulation 2009, 15, 2103–2111.[CrossRef] [PubMed]
51. Waldman, B.; Jenkins, A.; Sullivan, D.; Ng, M.; Keechm, A. HDL as a target for glycemic control.Curr. Drug Target 2015, 16. [CrossRef]
52. Maahs, D.M.; Daniels, S.R.; De Ferranti, S.D.; Dichek, H.L.; Flynn, J.; Goldstein, B.I.; Urbina, E. Cardiovasculardisease risk factors in youth with diabetes mellitus: A scientific statement from the American HeartAssociation. Circulation 2014, 130, 1532–1558. [CrossRef] [PubMed]
53. Chan, C.B.; Bell, R.C. Food Accessibility. Unpublished Work.54. Asaad, G.; Bell, R.C.; Chan, C.B. Outcomes of the PANDA-Nutrition Arm Trial Assessed Using Per-Protocol
Criteria. Unpublished work.55. Hébert, J.R.; Frongillo, E.A.; Adams, S.A.; Turner-McGrievy, G.M.; Hurley, T.G.; Miller, D.R.; Ockene, I.S.
Perspective: Randomized controlled trials are not a panacea for diet-related research. Adv. Nutr. 2016, 7,423–432. [CrossRef] [PubMed]
© 2016 by the authors; licensee MDPI, Basel, Switzerland. This article is an open accessarticle distributed under the terms and conditions of the Creative Commons Attribution(CC-BY) license (http://creativecommons.org/licenses/by/4.0/).
Related Documents


