SAN DIEGO SUPERCOMPUTER CENTER at the UNIVERSITY OF CALIFORNIA; SAN DIEGO Making effective use of HPC systems August 4-8, 2014 SDSC Summer Institute Robert Sinkovits

Welcome message from author
This document is posted to help you gain knowledge. Please leave a comment to let me know what you think about it! Share it to your friends and learn new things together.
Transcript

SAN DIEGO SUPERCOMPUTER CENTER
at the UNIVERSITY OF CALIFORNIA; SAN DIEGO
Making effective use of HPC systems
August 4-8, 2014 SDSC Summer Institute
Robert Sinkovits"

SAN DIEGO SUPERCOMPUTER CENTER
at the UNIVERSITY OF CALIFORNIA; SAN DIEGO
How do I know that I’m making effective use of my hardware?!
!We always want to know if we’re making effective use of our hardware. This applies to your own workstation or private cluster, but even more when you’re using high-end, shared resources.!This presentation won’t cover everything, but it will hopefully give you an introduction to some important topics and an awareness of what’s going on ‘under the hood’ !!Focus will be on a few of the standard and widely available, yet powerful tools and utilities. We’ll consider top, gprof and iostat along with the /proc and /sys pseudo file systems. We’ll also discuss scalability and Amdahl’s law.!

SAN DIEGO SUPERCOMPUTER CENTER
at the UNIVERSITY OF CALIFORNIA; SAN DIEGO
Obtaining hardware info – why should I care?!!
• You may be asked to report the details of your hardware in a manuscript or presentation, especially if you’re discussing application performance !
• You’ll know exactly what you’re running on. Can answer questions like “Is the login node the same as the compute nodes?”!
!• It will give you a way of estimating performance, or at least bounds on
performance, on another system. All else being equal, jobs will run at least as fast on hardware that has!• Faster CPU clock speeds!• Larger caches!• Faster local drives!
• You’ll sound smart when you talk to other technical people!• You: “I’m running on a dual socket node with 8-core Intel ES-2670
processors clocked at 2.6 GHz with 64 GB of DDR3-1333”!• Your colleague: “Wow!”!

SAN DIEGO SUPERCOMPUTER CENTER
at the UNIVERSITY OF CALIFORNIA; SAN DIEGO
Getting processor information (/proc/cpuinfo)!!On Linux machines, the /proc/cpuinfo pseudo-file lists key processor information.
Mostly cryptic hardware details, but also some very helpful data!
processor : 0 (processor number, actually refers to core)!vendor_id! : GenuineIntel!cpu family : 6!model : 45!model name : Intel(R) Xeon(R) CPU E5-2670 0 @ 2.60GHz (processor type)!stepping : 6!cpu MHz : 2593.576 (nominal clock speed)!cache size : 20480 KB!physical id : 0!siblings : 8!core id : 0!cpu cores : 8 (number of cores in processor)!apicid : 0!initial apicid : 0!fpu : yes!fpu_exception : yes!cpuid level : 13!wp : yes!flags : fpu vme de … avx … (AVX capable processor)!!!

SAN DIEGO SUPERCOMPUTER CENTER
at the UNIVERSITY OF CALIFORNIA; SAN DIEGO
What do we mean by a pseudo-file system?!!/proc and /sys are not real file systems. Instead, they’re just interfaces to Linux
kernel data structures in a convenient and familiar file system format.!
$ ls -l /proc/cpuinfo !-r--r--r-- 1 root root 0 Aug 3 20:45 /proc/cpuinfo![sinkovit@gcn-18-32 ~]$ head /proc/cpuinfo !processor!: 0!vendor_id!: GenuineIntel!cpu family !: 6!model ! !: 45!model name !: Intel(R) Xeon(R) CPU E5-2670 0 @ 2.60GHz!stepping !: 6!cpu MHz ! !: 2593.861!cache size !: 20480 KB!physical id !: 0!siblings !: 8!!!

SAN DIEGO SUPERCOMPUTER CENTER
at the UNIVERSITY OF CALIFORNIA; SAN DIEGO
Advanced Vector Extensions (AVX)!!• The Advanced Vector Extensions (AVX) are an extension to the x86
microprocessor architecture that allows a compute core to perform up to 8 floating point operations per cycle. Previous limit was 4/core/cycle!
• Partial response to challenges in increasing clock speed (we’re now stuck around 2.5 – 3.0 GHz)!
1996 Intel Pentium 150 MHz!

SAN DIEGO SUPERCOMPUTER CENTER
at the UNIVERSITY OF CALIFORNIA; SAN DIEGO
Advanced Vector Extensions (AVX)!!• Keeping to the theme of “Am I making effective use of hardware?”,
should ideally observe a 2x speedup when going from a non-AVX processor to an AVX capable processor (all else being equal)!
• If not, you’re not making very effective use of your hardware and you can run just as well on a less expensive non-AVX CPU.!
• Newer generations of processors are expected to have the AVX2 instructions. As you might have guessed, AVX2 cores will be capable of 16 floating point operations per cycle per core.!
• Don’t get too excited. It’s difficult enough to make good use of AVX and even harder to make good use of AVX2. Need long loops with vectorizable content. Memory bandwidth not keeping up with gains in computing power.!
...!flags : fpu vme de … avx2 … (AVX2 capable processor)!...!!
SAN DIEGO SUPERCOMPUTER CENTER
at the UNIVERSITY OF CALIFORNIA; SAN DIEGO
Getting processor information (/proc/cpuinfo)!!Confirming number of compute cores on a node. Note that this will report virtual cores
if features such as hyper-threading are enabled (not done on SDSC machines)!
[sinkovit@gordon-ln2 ~]$ grep processor /proc/cpuinfo!processor!: 0!processor!: 1!processor!: 2!processor!: 3!processor!: 4!processor!: 5!processor!: 6!processor!: 7!processor!: 8!processor!: 9!processor!: 10!processor!: 11!processor!: 12!processor!: 13!processor!: 14!processor!: 15!!!

SAN DIEGO SUPERCOMPUTER CENTER
at the UNIVERSITY OF CALIFORNIA; SAN DIEGO
Getting processor information (/proc/cpuinfo)!!Confirming number of sockets (processors) on a node. Each processor will be labeled
with a unique ‘physical id’ !
[sinkovit@gordon-ln2 ~]$ grep 'physical id' /proc/cpuinfo !physical id !: 0!physical id !: 0!physical id !: 0!physical id !: 0!physical id !: 0!physical id !: 0!physical id !: 0!physical id !: 0!physical id !: 1!physical id !: 1!physical id !: 1!physical id !: 1!physical id !: 1!physical id !: 1!physical id !: 1!physical id !: 1!!

SAN DIEGO SUPERCOMPUTER CENTER
at the UNIVERSITY OF CALIFORNIA; SAN DIEGO
Getting memory information (/proc/meminfo)!!
MemTotal: 66055696 kB !(total physical memory)!MemFree: 3843116 kB!Buffers: 6856 kB!Cached: 31870056 kB!SwapCached: 1220 kB!Active: 7833904 kB!Inactive: 25583720 kB!Active(anon): 593252 kB!Inactive(anon): 949000 kB!Active(file): 7240652 kB !(pretty good approximation to used memory)!Inactive(file): 24634720 kB!Unevictable: 0 kB!Mlocked: 0 kB!SwapTotal: 2097144 kB!SwapFree: 902104 kB!Dirty: 17772 kB!Writeback: 32 kB!AnonPages: 1540768 kB!...!
On Linux machines, the /proc/meminfo pseudo-file lists key memory specs. More information than you probably want, but at least one bit of useful data!
For more details, see http://www.redhat.com/advice/tips/meminfo.html!

SAN DIEGO SUPERCOMPUTER CENTER
at the UNIVERSITY OF CALIFORNIA; SAN DIEGO
Getting memory information (/proc/meminfo)!!
#!/usr/bin/perl !use strict;!use warnings;!my $count = 0;!print (" time(s) Memory (GB)\n");!while(1) {! sleep(1);! $count++;! open(MI, "/proc/meminfo");! while(<MI>) {! if (/Active:/) {! my (undef, $active, undef) = split();! $active = $active / !1048576.0;! printf("%6d %f\n", $count, $active);! }! }! close(MI);!}!
Using a simple script, you can monitor total memory usage for all processes as a function of time. Note that there is a lot of discussion on how to precisely measure memory (http://stackoverflow.com/search?q=measuring+memory+usage). The following should be good enough if you’re on a dedicated node.!

SAN DIEGO SUPERCOMPUTER CENTER
at the UNIVERSITY OF CALIFORNIA; SAN DIEGO
Finding cache information!!On Linux systems, can obtain cache properties through the /sys pseudo filesystem.
Details may vary slightly by O/S version and vendor, but basic information should be consistent !
$ pwd!/sys/devices/system/cpu!!$ ls!cpu0 cpu12 cpu2 cpu6 cpufreq online probe!cpu1 cpu13 cpu3 cpu7 cpuidle perf_events release!cpu10 cpu14 cpu4 cpu8 kernel_max possible sched_mc_power_savings!cpu11 cpu15 cpu5 cpu9 offline present sched_smt_power_savings!!$ cd cpu0/cache!$ ls!index0 index1 index2 index3!!$ cd index0!$ ls!coherency_line_size physical_line_partition size!level shared_cpu_list type!number_of_sets shared_cpu_map ways_of_associativity!!!!

SAN DIEGO SUPERCOMPUTER CENTER
at the UNIVERSITY OF CALIFORNIA; SAN DIEGO
Cache properties – Intel Sandy Bridge!(Intel Xeon E5-2670)!
!!
High end processor used in many Top500 supercomputers, including SDSC’s Gordon system and TACC’s Stampede!!L1 and L2 caches are per core!L3 cache shared between all 8 cores in socket!!sanity check: line size x sets x associativity = size!L2 cache size = 64 x 512 x 8 = 262144 = 256 K !
level! type! line size! sets! associativity! size (KB)!
L1! data! 64! 64! 8! 32!
L1! instruction! 64! 64! 8! 32!
L2 ! unified! 64! 512! 8! 256!
L3! unified! 64! 16384! 20! 20480!
SAN DIEGO SUPERCOMPUTER CENTER
at the UNIVERSITY OF CALIFORNIA; SAN DIEGO
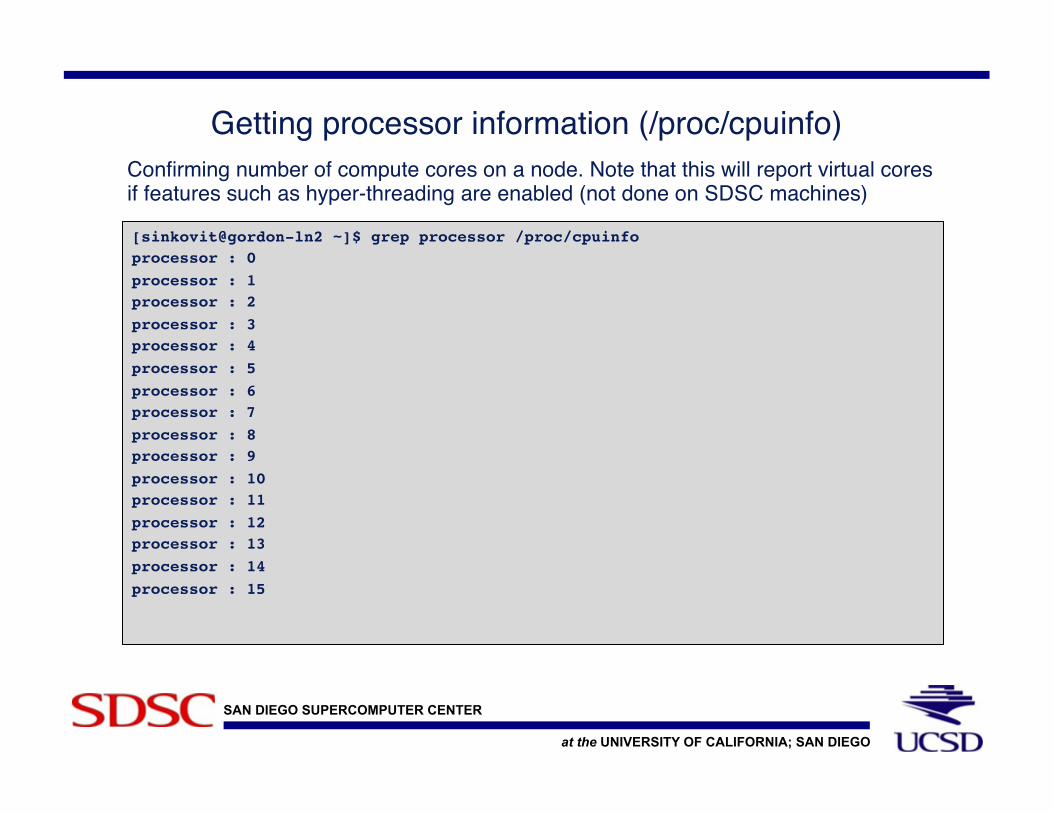
Cache properties – AMD Magny-Cours!(AMD Opteron Processor 6136)!
!!
Previous generation AMD enterprise level processor, used in SDSC’s Trestles system (currently used as capacity HPC resource)!!L1 and L2 caches are per core!L3 cache shared between all 8 cores in socket!!sanity check: line size x sets x associativity = size!L2 cache size = 64 x 512 x 16 = 524288= 512K !
level! type! line size! sets! associativity! size (KB)!
L1! data! 64! 512! 2! 64!
L1! instruction! 64! 512! 2! 64!
L2 ! unified! 64! 512! 16! 512!
L3! unified! 64! 1706! 48! 5118!
SAN DIEGO SUPERCOMPUTER CENTER
at the UNIVERSITY OF CALIFORNIA; SAN DIEGO
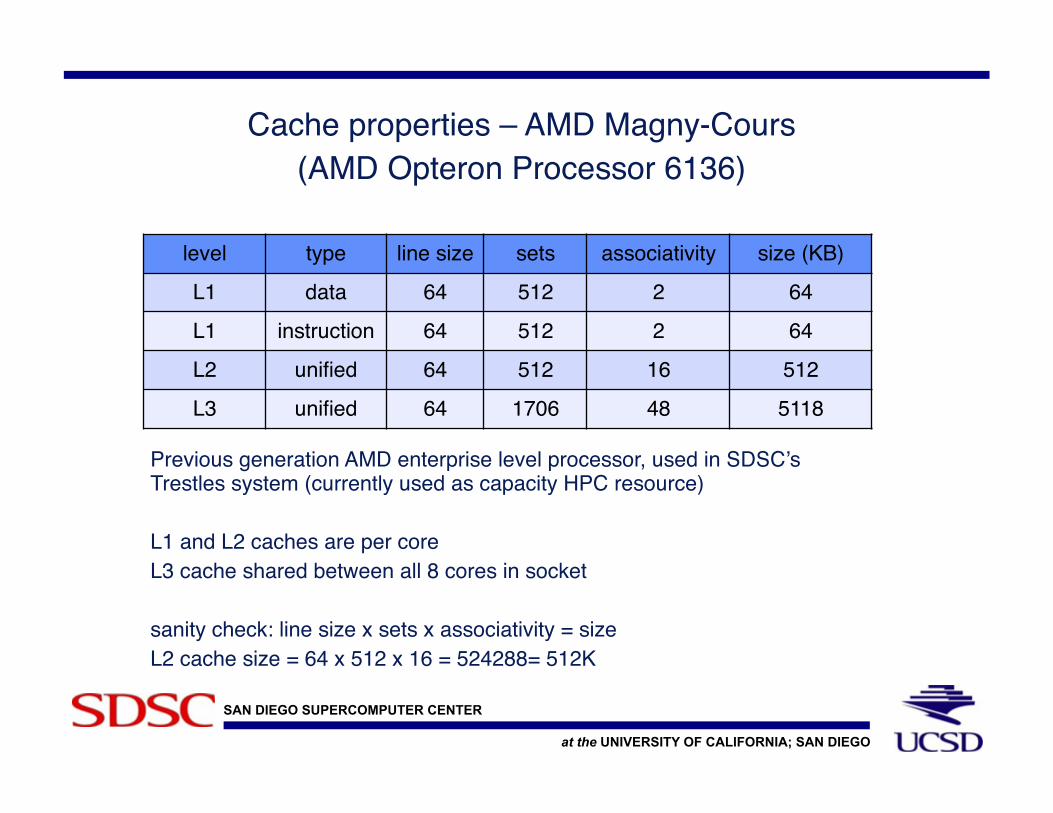
Impact of cache size on performance!!Based on the clock speed and instruction set, program run on single core of Gordon
should be 2.26x faster than on Trestles. The larger L1 and L2 cache sizes on Trestles mitigate performance impact for very small problems.!
N! t (Trestles)! t (Gordon)! ratio! KB!
62! 0.000117! 0.000086! 1.36! 30!
125! 0.000531! 0.000384! 1.38! 122!
250! 0.002781! 0.001542! 1.80! 488!
500! 0.016313! 0.007258! 2.24! 1953!
1000! 0.107222! 0.046252! 2.31! 7812!
2000! 0.744837! 0.331818! 2.24! 31250!
4000! 5.489990! 2.464218! 2.23! 125000!
DGSEV (Ax=b) wall times as function of problem size!

SAN DIEGO SUPERCOMPUTER CENTER
at the UNIVERSITY OF CALIFORNIA; SAN DIEGO
Finding SCSI device information!!SCSI (Small Computer System Interface) is a common interface for mounting
peripheral, such as hard drives and SSDs. The /proc/scsi/scsi file will provide info on SCSI devices!
// Gordon login node!$ cat /proc/scsi/scsi !Attached devices:!Host: scsi0 Channel: 00 Id: 00 Lun: 00! Vendor: ATA Model: INTEL SSDSA2CW08 Rev: 4PC1! Type: Direct-Access ANSI SCSI revision: 05!

SAN DIEGO SUPERCOMPUTER CENTER
at the UNIVERSITY OF CALIFORNIA; SAN DIEGO
Finding network information!!The ip command (/sbin/ip) is normally used by sys admins, but regular users can
use it to learn about networking information !
$ /sbin/ip link!1: lo: <LOOPBACK,UP,LOWER_UP> mtu 16436 qdisc noqueue state UNKNOWN ! link/loopback 00:00:00:00:00:00 brd 00:00:00:00:00:00!2: eth0: <BROADCAST,MULTICAST,UP,LOWER_UP> mtu 1500 qdisc mq state UP qlen 1000! link/ether 00:1e:67:29:5f:02 brd ff:ff:ff:ff:ff:ff!3: eth1: <BROADCAST,MULTICAST,UP,LOWER_UP> mtu 1500 qdisc mq state UP qlen 1000! link/ether 00:1e:67:29:5f:03 brd ff:ff:ff:ff:ff:ff!4: ib0: <BROADCAST,MULTICAST,UP,LOWER_UP> mtu 1500 qdisc pfifo_fast state UP qlen 256! link/infiniband 80:00:00:48:fe:80:00:0a:aa:aa:aa:aa:00:1e:67:03:00:29:5f:07 brd 00:ff:ff:ff:ff:12:40:1b:ff:ff:00:00:00:00:00:00:ff:ff:ff:ff!5: ib1: <BROADCAST,MULTICAST,UP,LOWER_UP> mtu 1500 qdisc pfifo_fast state UP qlen 256! link/infiniband 80:00:00:48:fe:8b:bb:bb:bb:bb:bb:b1:00:02:c9:03:00:2f:7b:21 brd 00:ff:ff:ff:ff:12:40:1b:ff:ff:00:00:00:00:00:00:ff:ff:ff:ff!

SAN DIEGO SUPERCOMPUTER CENTER
at the UNIVERSITY OF CALIFORNIA; SAN DIEGO
Machine info - overkill?!!• We’ve probably gone a little deeper than is necessary for you to be an
effective supercomputer user.!
• Think of this as a way to round out your HPC knowledge. You’re learning a little bit about the tools of the trade, getting comfortable poking around on a system, acquiring the knowledge that will make it easier to work with your sys admin and picking up the background that will help you to make intelligent decisions in the future.!

SAN DIEGO SUPERCOMPUTER CENTER
at the UNIVERSITY OF CALIFORNIA; SAN DIEGO
Using the Linux top utility!!The top utility is found on all Linux systems and provides a high level view
of running processes. Does not give any information at the source code level (profiling), but can still be very useful for answering questions such as !!• How many of my processes are running?!• What are the states of the processes (running, sleeping, etc.)?!• Which cores are being utilized?!• Are there any competing processes that may be affecting my
performance?!• What fraction of the CPU is each process using?!• How much memory does each process use?!• Is the memory usage growing over time? (Useful for identifying memory
leaks)!• How many threads are my processes using?!!

SAN DIEGO SUPERCOMPUTER CENTER
at the UNIVERSITY OF CALIFORNIA; SAN DIEGO
Customizing top!!Top has the following defaults, but is easily customizable !
!• Processes only (no threads)!• To toggle threads display, type “H” while top is running!
• Information for all users!• Can restrict to a single user by launching with “top -u username”!
• Process ID, priority, ‘nice’ level, virtual memory, physical memory, shared memory, state, %CPU, %memory, CPU time, command!
• To modify, type “f” while top is running and toggle fields using letters!
• Update information every 3 seconds!• Change refresh rate by launching with “top -d n”!
• Ordered by CPU usage!• Type “M” to order by memory usage!

SAN DIEGO SUPERCOMPUTER CENTER
at the UNIVERSITY OF CALIFORNIA; SAN DIEGO
16 processes, each using anywhere from 21.3% to 100% of a compute core.!!Memory footprint (RES) is minimal, with each process only using up to 76 MB.!CPU times ranging from 0.11s (just started) to 1:31!
Non-threaded code!!

SAN DIEGO SUPERCOMPUTER CENTER
at the UNIVERSITY OF CALIFORNIA; SAN DIEGO
Threaded code with thread display toggled to the “off” position. Note the heavy CPU usage, very close to 1600%!
Threaded code (thread display off)!!

SAN DIEGO SUPERCOMPUTER CENTER
at the UNIVERSITY OF CALIFORNIA; SAN DIEGO
16 threads, with only one thread making good use of CPU !Total memory usage 5.8 GB (9.2% of available)!
Threaded code (thread display on)!!

SAN DIEGO SUPERCOMPUTER CENTER
at the UNIVERSITY OF CALIFORNIA; SAN DIEGO
16 threads, all making good (but not ideal) use of the compute cores!
Threaded code (thread display on)!!
SAN DIEGO SUPERCOMPUTER CENTER
at the UNIVERSITY OF CALIFORNIA; SAN DIEGO
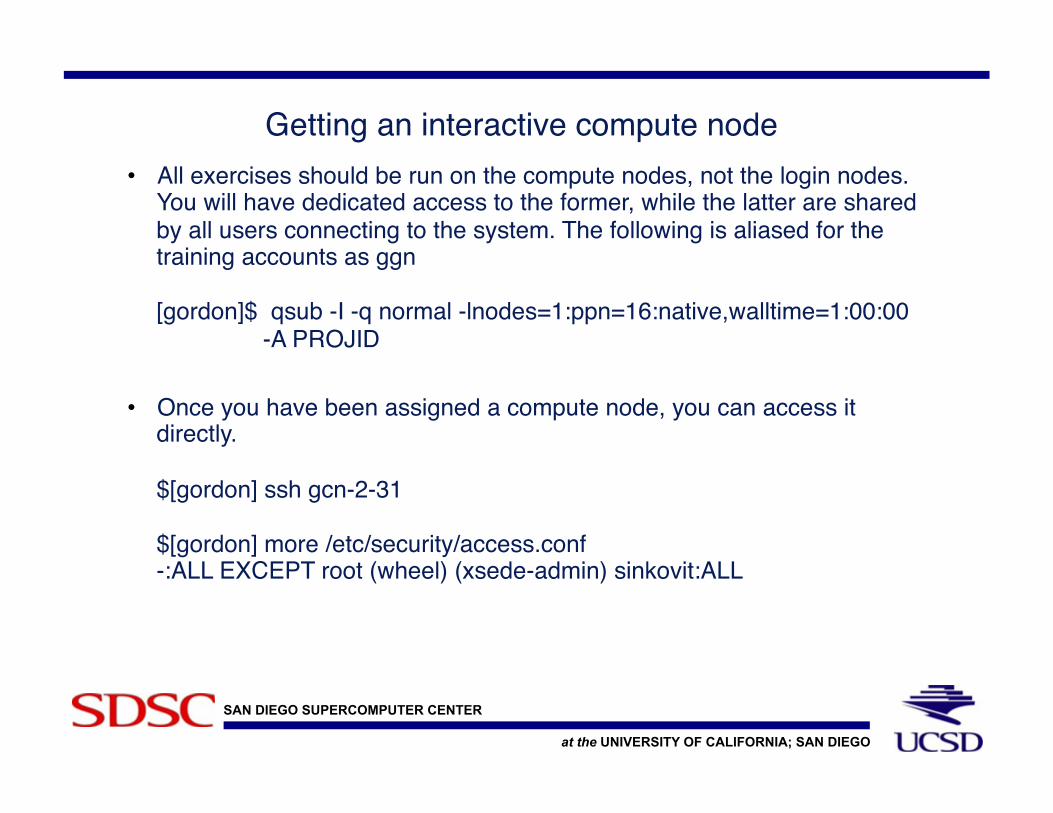
Getting an interactive compute node!!• All exercises should be run on the compute nodes, not the login nodes.
You will have dedicated access to the former, while the latter are shared by all users connecting to the system. The following is aliased for the training accounts as ggn [gordon]$ qsub -I -q normal -lnodes=1:ppn=16:native,walltime=1:00:00 -A PROJID !
• Once you have been assigned a compute node, you can access it directly.$[gordon] ssh gcn-2-31 $[gordon] more /etc/security/access.conf -:ALL EXCEPT root (wheel) (xsede-admin) sinkovit:ALL!

SAN DIEGO SUPERCOMPUTER CENTER
at the UNIVERSITY OF CALIFORNIA; SAN DIEGO
Top example!!• Copy the lineq_top.c file to your home directory. The program
generates a random vector and matrix of rank N, calls the linear solver DGESV (Ax=b) then reports run time. Does this for 10 matrices!
• Compile using the following commandsicc -O3 -o lineq_top lineq_top.c -mkl!
• Grab an interactive Gordon compute node!• Open a second terminal, login directly to compute node and launch top
For example: ssh gcn-4-68!• On the first terminal, run program with different matrix sizes
./lineq_top 5000
./lineq_top 10000!• Monitor CPU and memory usage. Do you notice anything funny? If so,
see if you can fix the problem.!

SAN DIEGO SUPERCOMPUTER CENTER
at the UNIVERSITY OF CALIFORNIA; SAN DIEGO
Profiling your code with gprof!!
gprof is a profiling tool for UNIX/Linux applications. First developed in 1982, it is still extremely popular and very widely used. It is always the first tool that I use for my work.!Universally supported by all major C/C++ and Fortran compilers"Extremely easy to use"
1. Compile code with -pg option: adds instrumentation to executable!2. Run application: file named gmon.out will be created.!3. Run gprof to generate profile: gprof a.out gmon.out!
Introduces virtually no overhead"Output is easy to interpret"

SAN DIEGO SUPERCOMPUTER CENTER
at the UNIVERSITY OF CALIFORNIA; SAN DIEGO
1982!!!Worth reflecting on the fact that gprof goes back to 1982. Amazing when
considered in context of the leading technology of the day!
Michael Douglas as Gordon Gecko in Wall Street, modeling early 1980s cell phone. List price ~ $3000!
Cray X-MP with 105 MHz processor. High end configuration (four CPUs, 64 MB memory) has 800 MFLOP theoretical peak. Cost ~ $15M!

SAN DIEGO SUPERCOMPUTER CENTER
at the UNIVERSITY OF CALIFORNIA; SAN DIEGO
gprof flat profile!!The gprof flat profile is a simple listing of functions/subroutines ordered by their
relative usage. Often a small number of routines will account for a large majority of the run time. Useful for identifying hot spots in your code.!
Flat profile:!!Each sample counts as 0.01 seconds.! % cumulative self self total ! time seconds seconds calls ms/call ms/call name ! 68.60 574.72 574.72 399587 1.44 1.44 get_number_packed_data! 13.48 687.62 112.90 main! 11.60 784.81 97.19 182889 0.53 0.53 quickSort_double! 2.15 802.85 18.04 182889 0.10 0.63 get_nearest_events! 1.52 815.56 12.71 __c_mcopy8! 1.28 826.29 10.73 _mcount2! 0.96 834.30 8.02 22183 0.36 0.36 pack_arrays! 0.12 835.27 0.97 __rouexit! 0.08 835.94 0.66 __rouinit! 0.06 836.45 0.51 22183 0.02 5.58 Is_Hump! 0.05 836.88 0.44 1 436.25 436.25 quickSort!

SAN DIEGO SUPERCOMPUTER CENTER
at the UNIVERSITY OF CALIFORNIA; SAN DIEGO
gprof call graph!!The gprof call graph provides additional levels of detail such as the exclusive time
spent in a function, the time spent in all children (functions that are called) and statistics on calls from the parent(s)!
index % time self children called name![1] 96.9 112.90 699.04 main [1]! 574.72 0.00 399587/399587 get_number_packed_data [2]! 0.51 123.25 22183/22183 Is_Hump [3]! 0.44 0.00 1/1 quickSort [11]! 0.04 0.00 1/1 radixsort_flock [18]! 0.02 0.00 2/2 ID2Center_all [19]!-----------------------------------------------! 574.72 0.00 399587/399587 main [1]![2] 68.6 574.72 0.00 399587 get_number_packed_data [2]!-----------------------------------------------! 0.51 123.25 22183/22183 main [1]![3] 14.8 0.51 123.25 22183 Is_Hump [3]! 18.04 97.19 182889/182889 get_nearest_events [4]! 8.02 0.00 22183/22183 pack_arrays [8]! 0.00 0.00 22183/22183 pack_points [24]!!

SAN DIEGO SUPERCOMPUTER CENTER
at the UNIVERSITY OF CALIFORNIA; SAN DIEGO
The value of re-profiling!!After optimizing the code, we find that the function main() now accounts for 40% of
the run time and would be a likely target for further performance improvements.!
Flat profile:!!Each sample counts as 0.01 seconds.! % cumulative self self total ! time seconds seconds calls ms/call ms/call name ! 41.58 36.95 36.95 main! 26.41 60.42 23.47 22183 1.06 1.06 get_number_packed_data! 11.58 70.71 10.29 __c_mcopy8! 10.98 80.47 9.76 182889 0.05 0.05 get_nearest_events! 8.43 87.96 7.49 22183 0.34 0.34 pack_arrays! 0.57 88.47 0.51 22183 0.02 0.80 Is_Hump! 0.20 88.65 0.18 1 180.00 180.00 quickSort! 0.08 88.72 0.07 _init! 0.05 88.76 0.04 1 40.00 40.00 radixsort_flock! 0.02 88.78 0.02 1 20.00 20.00 compute_position! 0.02 88.80 0.02 1 20.00 20.00 readsource!!

SAN DIEGO SUPERCOMPUTER CENTER
at the UNIVERSITY OF CALIFORNIA; SAN DIEGO
Limitations of gprof!!• grprof only measures time spent in user-space code and does not
account for system calls or time waiting for CPU or I/O!• gprof has limited utility for threaded applications (e.g. parallelized using
OpenMP or Pthreads) and will normally only report usage for thread 0!• gprof can be used for MPI applications and will generate a gmon.out.id
file for each MPI process. But for reasons mentioned above, it will not give an accurate picture of the time spent waiting for communications!
• gprof will not report usage for un-instrumented library routines!• In the default mode, gprof only gives function level rather than
statement level profile information. Although it can provide the latter by compiling in debug mode (-g) and using the gprof -l option, this introduces a lot of overhead and disables many compiler optimizations.In my opinion, I don’t think this is such a bad thing. Once a function has been identified as a hotspot, it’s usually obvious where the time is being spent (e.g. statements in innermost loop nesting)!
!

SAN DIEGO SUPERCOMPUTER CENTER
at the UNIVERSITY OF CALIFORNIA; SAN DIEGO
gprof example1!!• Copy the gprof_ex.f file to your home directory. Compile using the
following command ifort -pg -O3 -o gprof_ex gprof_ex.f!
• Grab an interactive Gordon compute node!• Run as followstime ./gprof_ex 100000000!
• Generate profile and examine resultsgprof gprof_ex gmon.out > profile_gp!

SAN DIEGO SUPERCOMPUTER CENTER
at the UNIVERSITY OF CALIFORNIA; SAN DIEGO
gprof example 1 (examining call tree)!!
-----------------------------------------------! 0.85 5.23 1/1 MAIN__ [3]![6] 12.4 0.85 5.23 1 sub1_ [6]! 4.05 0.00 100000000/100000000 f2_ [7]! 1.18 0.00 100000000/200000000 f1_ [8]!-----------------------------------------------! 4.05 0.00 100000000/100000000 sub1_ [6]![7] 8.2 4.05 0.00 100000000 f2_ [7]!-----------------------------------------------! 1.18 0.00 100000000/200000000 sub1_ [6]! 1.18 0.00 100000000/200000000 sub2_ [9]![8] 4.8 2.36 0.00 200000000 f1_ [8]!-----------------------------------------------! 0.39 1.18 1/1 MAIN__ [3]![9] 3.2 0.39 1.18 1 sub2_ [9]! 1.18 0.00 100000000/200000000 f1_ [8]!-----------------------------------------------!
• sub1 called by MAIN once!• calls f2 10^8!• calls f1 10^8!
• f2 called by sub1 10^8!
• f1 called by sub1 10^8!• f1 called by sub2 10^8!
• sub2 called by MAIN once!• calls f1 10^8!

SAN DIEGO SUPERCOMPUTER CENTER
at the UNIVERSITY OF CALIFORNIA; SAN DIEGO
gprof example 2!!• Copy the lineq_top.c file to your home directory. Make sure that you
fixed the memory leak. Compile using the following command icc -pg -O3 -o lineq_top lineq_top.c -mkl!
• Grab an interactive Gordon compute node!• Run as followsexport OMP_NUM_THREADS=1 time ./lineq_top 5000!
• Generate profile and examine resultsgprof lineq_top gmon.out > profile_lineq!
• How does time reported by ‘time’ command compare to total time in the profile?!

SAN DIEGO SUPERCOMPUTER CENTER
at the UNIVERSITY OF CALIFORNIA; SAN DIEGO
Torque output at glance!!
PBS Job Id: 1398938.gordon-fe2.local!Job Name: lob_050610!Exec host: !gcn-17-57/0+gcn-17-57/1+gcn-17-57/2+gcn-17-57/3+gcn-17-57/4+gcn-17-57/5+gcn-17-57/6+gcn-17-57/7+gcn-17-57/8+gcn-17-57/9+gcn-17-57/10+gcn-17-57/11+gcn-17-57/12+gcn-17-57/13+gcn-17-57/14+gcn-17-57/15!Execution terminated!Exit_status=0!resources_used.cput=02:05:50!resources_used.mem=2801508kb!resources_used.vmem=48536612kb!resources_used.walltime=00:18:31!Error_Path: gordon-ln1.sdsc.edu:/oasis/projects/nsf/use310/sinkovit/MaoYe/order-book/LOBFAST/lob_050610.err!Output_Path: gordon-ln1.sdsc.edu:/oasis/projects/nsf/use310/sinkovit/MaoYe/order-book/LOBFAST/lob_050610.out!
Real memory usage!CPU time summed across all cores!
Wall clock time!
Torque output can give you a quick feel for memory footprint and core usage!For single node jobs, CPU time ideally should be equal to (wall time x cores/node)!In this case CPU time (7550 s) divided by wall x cores (17,776) is 0.42 !!

SAN DIEGO SUPERCOMPUTER CENTER
at the UNIVERSITY OF CALIFORNIA; SAN DIEGO
Manually instrumenting codes!!
• Performance analysis tools ranging from the venerable (gprof) to the modern (TAU) are great, but they all have several downsides!• May not be fully accurate!• Can introduce overhead!• Sometimes have steep learning curves!!
• Once you really know your application, your best option is to add your own instrumentation. Will automatically get a performance report every time you run the code.!
• There are many ways to do this and we’ll explore portable solutions in C/C++ and Fortran. Note that there are also many heated online discussions arguing over how to properly time codes.!

SAN DIEGO SUPERCOMPUTER CENTER
at the UNIVERSITY OF CALIFORNIA; SAN DIEGO
Linux time utility!!
$ export OMP_NUM_THREADS=16 ; time ./lineq_mkl 30000!Times to solve linear sets of equations for n = 30000!t = 70.548615!!real !1m10.733s ß wall time!user !17m23.940s ß CPU time summed across all cores!sys !0m2.225s!!
If you just want to know the overall wall time for your application, can use the Linux time utility. Reports three times!!• real – elapsed (wall clock) time for executable!• user – CPU time integrated across all cores!• sys – system CPU time!

SAN DIEGO SUPERCOMPUTER CENTER
at the UNIVERSITY OF CALIFORNIA; SAN DIEGO
Manually instrumenting C/C++ codes!!
struct timeval tv_start, tv_end;!!gettimeofday(&tv_start, NULL);!// block of code to be timed!gettimeofday(&tv_end, NULL);!!elapsed = (tv_end.tv_sec - tv_start.tv_sec) +! (tv_end.tv_usec - tv_start.tv_usec) / 1000000.0;!!
The C gettimeofday() function returns time from start of epoch (1/1/1970) with microsecond precision. Call before and after the block of code to be timed and perform math using the tv_sec and tv_usec struct elements !

SAN DIEGO SUPERCOMPUTER CENTER
at the UNIVERSITY OF CALIFORNIA; SAN DIEGO
Manually instrumenting Fortran codes!!
integer clock1, clock2;!double precision elapsed_time!!call system_clock(clock1)!// block of code to be timed!call system_clock(clock2)!!time = elapsed_time(clock1, clock2)!
The Fortran90 system_clock function returns number of ticks of the processor clock from some unspecified previous time. Call before and after the block of code to be timed and perform math using the elapsed_time function (see next slide)!

SAN DIEGO SUPERCOMPUTER CENTER
at the UNIVERSITY OF CALIFORNIA; SAN DIEGO
Manually instrumenting Fortran codes (cont)!!
double precision function elapsed_time(c1, c2)!implicit none!integer, intent(in) :: c1, c2!integer ticks, clockrate, clockmax!!call system_clock(count_max=clockmax, count_rate=clockrate)!ticks = c2-c1!if(ticks < 0) then! ticks = clockmax + ticks!endif!elapsed_time = dble(ticks)/dble(clockrate)!!return!end function elapsed_time!
Using system_clock can be a little complicated since we need to know the length of a processor cycle and have to be careful about how we handle overflows of counter. Write this once and reuse everywhere.!

SAN DIEGO SUPERCOMPUTER CENTER
at the UNIVERSITY OF CALIFORNIA; SAN DIEGO
A note on granularity!!
elapsed = 0.0;!!for (i=0; i<n; i++) {! w[i] = x[i] * y[i];! gettimeofday(&tv_start, NULL);! z[i] = sqrt(w[i]) + x[i];! gettimeofday(&tv_end, NULL);! elapsed += (tv_end.tv_sec - tv_start.tv_sec) +! (tv_end.tv_usec - tv_start.tv_usec) / 1000000.0;!}!
Don’t try to time at too small a level of granularity, such as measuring the time associated with a single statement within a loop!
Although they’re pretty lightweight, there is still a cost associated with calls to gettimeofday or system_clock. In addition, the insertion of these calls into loops can impact the flow and hamper optimizations by the compiler.!

SAN DIEGO SUPERCOMPUTER CENTER
at the UNIVERSITY OF CALIFORNIA; SAN DIEGO
Amdahl’s Law!!Amdahl’s law sets an upper limit on the speedup of a parallel code based
on the serial content.!• Let P be the fraction of the code that can be run in parallel!• Let (1-P) be the serial fraction of the code!• Let N be the number of parallel threads or processes!
S(N ) = 1(1− P)+ P / N
In reality, you will probably do a good bit worse than Amdahl’s law due to a number of factors, most importantly!• Load imbalance – processes assigned different amounts of work!• Communications overhead – latency and bandwidth!
S(∞) = 1(1− P)

SAN DIEGO SUPERCOMPUTER CENTER
at the UNIVERSITY OF CALIFORNIA; SAN DIEGO
Amdahl’s Law – kind of a big deal!!
Charlton Heston in Moses and the Ten Commandments, delivering a slightly updated version to the SDSC Summer Institute!

SAN DIEGO SUPERCOMPUTER CENTER
at the UNIVERSITY OF CALIFORNIA; SAN DIEGO
Amdahl’s Law!!The theoretical maximum speedup, running on an infinite number of
compute cores, is the inverse of the serial content. This places a very stringent bound on the benefits of parallelization!
1
2
4
8
16
32
64
128
1 4 16 64 256 1024 4096 16384 65536
speedu
p
N
S=0.01
S=0.05
S=0.2
S=0.5

SAN DIEGO SUPERCOMPUTER CENTER
at the UNIVERSITY OF CALIFORNIA; SAN DIEGO
Amdahl’s Law!!Fortunately, things aren’t as gloomy as they appear. For many applications,
there is a lot of work that can be done in parallel and the serial content is rather minimal !• Updating grid cells in discretized solutions of PDEs!• Calculating forces on particles in molecular dynamics, N-body problems!• Ensemble calculations – many repetitions of calculation with different data
sets or slightly different input parameters!!If your application falls into the last category, there is no need for you to worry about parallelization at the program level. Instead, just develop a workflow that allows you to run the serial instances of your code in parallel.!
SAN DIEGO SUPERCOMPUTER CENTER
at the UNIVERSITY OF CALIFORNIA; SAN DIEGO
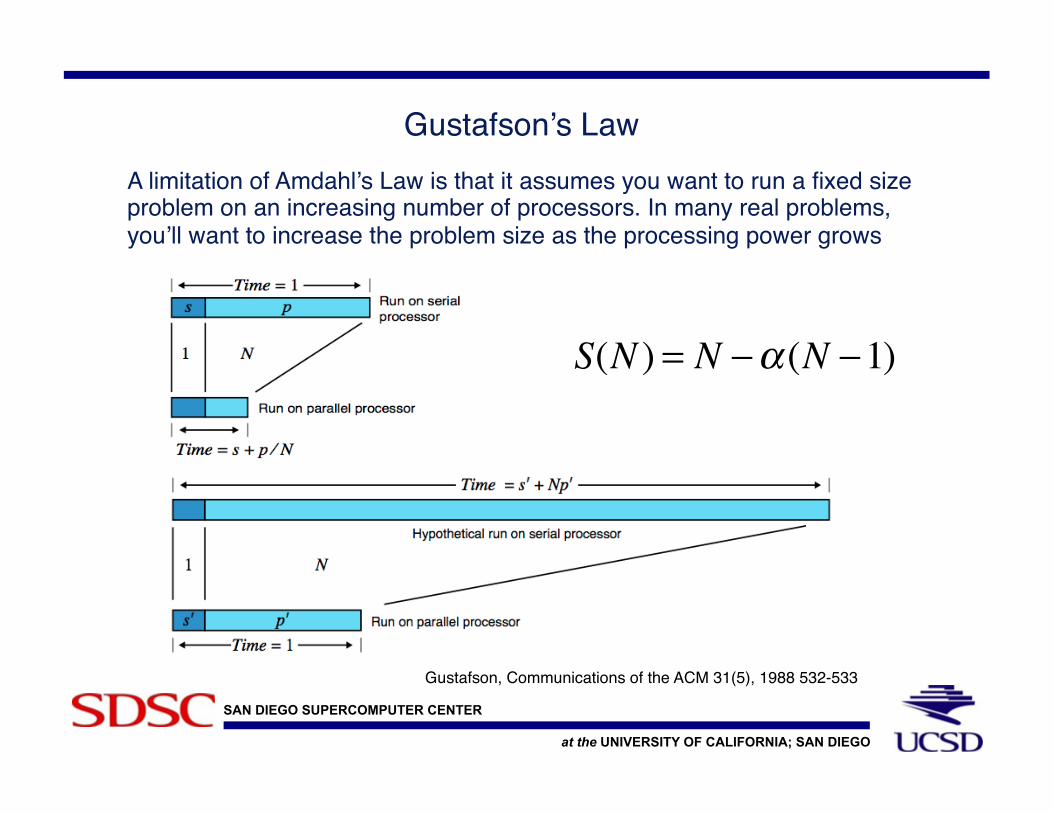
Gustafson’s Law!!A limitation of Amdahl’s Law is that it assumes you want to run a fixed size
problem on an increasing number of processors. In many real problems, you’ll want to increase the problem size as the processing power grows!
S(N ) = N −α (N −1)
Gustafson, Communications of the ACM 31(5), 1988 532-533!

SAN DIEGO SUPERCOMPUTER CENTER
at the UNIVERSITY OF CALIFORNIA; SAN DIEGO
Strong scaling vs. Weak Scaling!!The discussion of Amdahl’s Law and Gustafson’s Law segues into the topic
of strong vs. weak scaling !• Strong scaling – how does the run time scale (decline) as the number of
processors is increased? Ideally, linear speedup (t ~ 1/N)!
• Weak scaling – how does the run time vary as the work per process stays constant while the problem size grows. Ideally, t is unchanged.!

SAN DIEGO SUPERCOMPUTER CENTER
at the UNIVERSITY OF CALIFORNIA; SAN DIEGO
Scaling experiment!!• Copy the lineq_mkl.c file to your home directory. The program generates
a random vector and matrix of rank N, calls the linear solver DGESV (Ax=b) then reports run time.!
• Compile using the following commandsicc -O3 -o lineq_mkl lineq_mkl.c –mkl !
• On a Gordon compute node, run with a variety of problem sizes using 1, 2, 4, 8 and 16 threads. Note the run times and any trends in scalability as the problem size is increased from N=1000 to N=10000 export OMP_NUM_THREADS=1 ./lineq_mkl 3000export OMP_NUM_THREADS=2 ./lineq_mkl 3000export OMP_NUM_THREADS=4 ./lineq_mkl 3000!
Related Documents