T. J. Wipf, F. W. Klaiber, E. J. Raker Effective Structural Concrete Repair Volume 3 of 3 Evaluation of Repair Materials for Use in Patching Damaged Concrete March 2004 Sponsored by the Iowa Department of Transportation Highway Division and the Iowa Highway Research Board Iowa DOT Project TR - 428 Final Department of Civil, Construction and Environmental Engineering

Welcome message from author
This document is posted to help you gain knowledge. Please leave a comment to let me know what you think about it! Share it to your friends and learn new things together.
Transcript

T. J. Wipf, F. W. Klaiber, E. J. Raker
Effective Structural Concrete RepairVolume 3 of 3
Evaluation of Repair Materials for Usein Patching Damaged Concrete
March 2004
Sponsored by theIowa Department of Transportation
Highway Division and theIowa Highway Research Board
Iowa DOT Project TR - 428
Final
Department of Civil, Construction andEnvironmental Engineering
The opinions, findings, and conclusions expressed in thispublication are those of the authors and not necessarily those of
the Iowa Department of Transportation.
T. J. Wipf, F. W. Klaiber, E. J. Raker
Effective Structural Concrete RepairVolume 3 of 3
Evaluation of Repair Materials for Usein Patching Damaged Concrete
March 2004
Sponsored by theIowa Department of Transportation
Highway Division and theIowa Highway Research Board
Iowa DOT Project TR - 428
Final
Department of Civil, Construction andEnvironmental Engineering
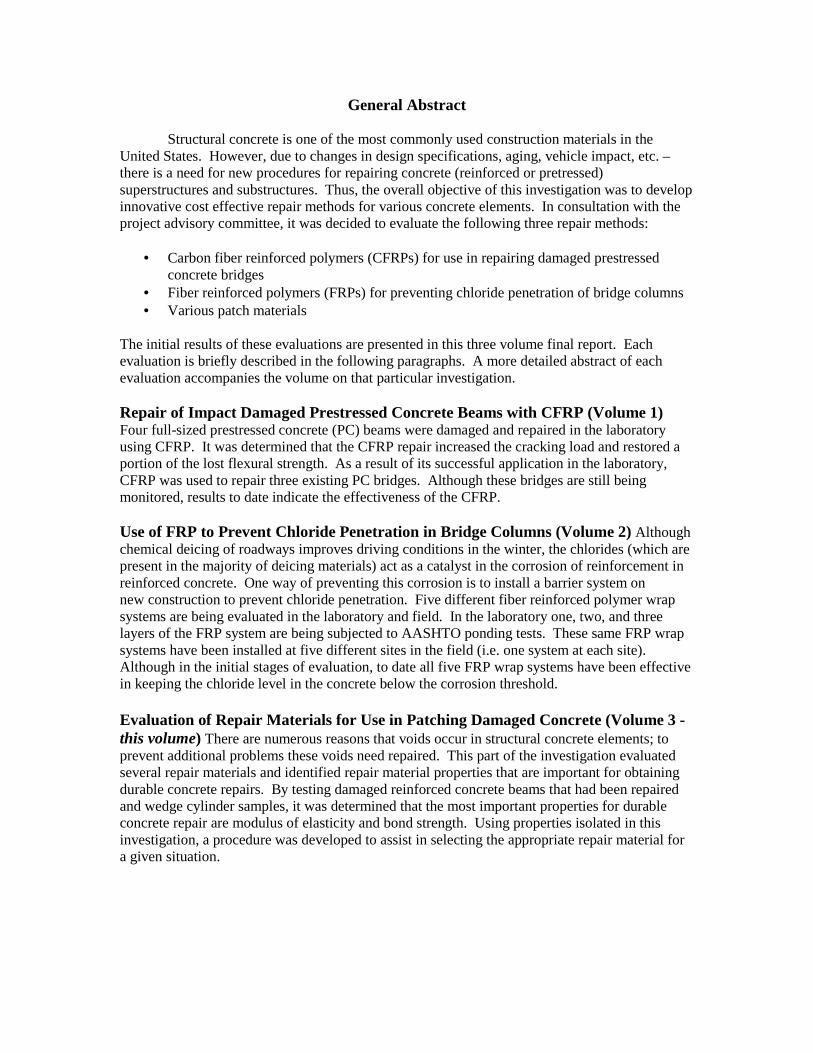
General Abstract
Structural concrete is one of the most commonly used construction materials in theUnited States. However, due to changes in design specifications, aging, vehicle impact, etc. –there is a need for new procedures for repairing concrete (reinforced or pretressed)superstructures and substructures. Thus, the overall objective of this investigation was to developinnovative cost effective repair methods for various concrete elements. In consultation with theproject advisory committee, it was decided to evaluate the following three repair methods:
• Carbon fiber reinforced polymers (CFRPs) for use in repairing damaged prestressedconcrete bridges
• Fiber reinforced polymers (FRPs) for preventing chloride penetration of bridge columns• Various patch materials
The initial results of these evaluations are presented in this three volume final report. Eachevaluation is briefly described in the following paragraphs. A more detailed abstract of eachevaluation accompanies the volume on that particular investigation.
Repair of Impact Damaged Prestressed Concrete Beams with CFRP (Volume 1)Four full-sized prestressed concrete (PC) beams were damaged and repaired in the laboratoryusing CFRP. It was determined that the CFRP repair increased the cracking load and restored aportion of the lost flexural strength. As a result of its successful application in the laboratory,CFRP was used to repair three existing PC bridges. Although these bridges are still beingmonitored, results to date indicate the effectiveness of the CFRP.
Use of FRP to Prevent Chloride Penetration in Bridge Columns (Volume 2) Althoughchemical deicing of roadways improves driving conditions in the winter, the chlorides (which arepresent in the majority of deicing materials) act as a catalyst in the corrosion of reinforcement inreinforced concrete. One way of preventing this corrosion is to install a barrier system onnew construction to prevent chloride penetration. Five different fiber reinforced polymer wrapsystems are being evaluated in the laboratory and field. In the laboratory one, two, and threelayers of the FRP system are being subjected to AASHTO ponding tests. These same FRP wrapsystems have been installed at five different sites in the field (i.e. one system at each site).Although in the initial stages of evaluation, to date all five FRP wrap systems have been effectivein keeping the chloride level in the concrete below the corrosion threshold.
Evaluation of Repair Materials for Use in Patching Damaged Concrete (Volume 3 -this volume) There are numerous reasons that voids occur in structural concrete elements; toprevent additional problems these voids need repaired. This part of the investigation evaluatedseveral repair materials and identified repair material properties that are important for obtainingdurable concrete repairs. By testing damaged reinforced concrete beams that had been repairedand wedge cylinder samples, it was determined that the most important properties for durableconcrete repair are modulus of elasticity and bond strength. Using properties isolated in thisinvestigation, a procedure was developed to assist in selecting the appropriate repair material fora given situation.

iii
Effective Structural Concrete Repair
General Introduction
Structural concrete is one of the most commonly used construction materials in the
United States. Due to changes in the design specification for bridges, increases in legal
loads, potential for over-height vehicle impacts, and general bridge deterioration, there is
need for new procedures for strengthening and/or rehabilitating existing reinforced and
prestressed concrete bridges. In this investigation, strengthening and rehabilitating are
considered to be specific means of repairing. The problems previously noted occur in the
superstructure as well as in the substructure and are commonplace for state bridge engineers,
county engineers and consultants.
In the past, several different materials and procedures have been used for
strengthening/rehabilitating structural concrete with varying degrees of success. Some of the
procedures used may be effective initially, however, they may not be effective long term
especially if the deterioration is due to chloride contamination. Thus, research was needed to
develop successful repair methods/materials for strengthening/rehabilitating various
structural concrete bridge elements.
Overall Research Objectives
The overall objective of this project was to develop innovative repair methods that
employ materials which result in the cost effective repair of structural concrete elements.
Carbon Fiber Reinforced Polymers (CFRPs) were found to be the most effective material for
long term repair. They have shown promise for use in strengthening and/or rehabilitating
iv
various bridge elements. These materials have the advantage of large strength/weight ratios,
excellent corrosion and fatigue properties, and are relatively simple to install.
To insure the success of this project, a project advising committee (PAC) consisting
of members from the Iowa DOT Office of Bridges and Structures and the Iowa County
Engineers Association was formed. The research team met with the PAC on six different
occasions. During the initial meetings, the numerous problems engineers have with
structural concrete bridge elements were discussed. In later meetings, the research team
proposed some potential solutions to the problems previously noted. The outcome of the last
PAC meeting was that the following three repair methods should be investigated:
1.) Evaluation of CFRP for use in repairing/strengthening damaged prestressed
concrete bridges,
2.) Evaluation of FRP for preventing chloride penetration into bridge columns,
3.) Evaluation of various patch materials.
This project involved a combination of laboratory and field tests. In two cases (1 and
2 noted above), there were laboratory investigations prior to investigating the
procedure/material in the field in demonstration projects. The procedures/materials used in
the demonstration projects will be periodically inspected until the end of the contract which
is Dec., 2008. A log noting the date of the inspection, condition of strengthening system, etc.
will be kept for each demonstration project. If a significant change in the strengthening
system is observed at one of the demonstrate sites, the structure could be tested if such a test
would provide additional information on the repair material/system.
v
Reports
Since there were three unique repair systems/materials investigated in this project, the
results are presented in three separate volumes. Laboratory as well as field test results are
presented in this three volume final report. Following this initial report, brief interim reports
on the demonstration projects will be submitted approximately every two years. At the
conclusion of the project (Dec. 2008), a final summary report will be submitted.
As previously noted, each volume of this final report is written independently. Thus,
the reader may read the volume of interest without knowledge of the other two volumes. To
further assist the readers in their review of this final report:
• Each volume has a unique abstract, summary, and conclusions, which are pertinent to
that part of the investigation. Application guides for installing CFRP on damaged
prestressed concrete beams and FRP on columns are presented in Volumes 1 and 2,
respectively. A general abstract briefly summarizing the entire project is presented at
the beginning of each volume. Thus, the three volume report has four abstracts.
• Each volume has a reference list that is unique to that part of the project. A limited
number of references have been cited in more than one volume of the final report.
• The three volumes have different authors – the senior members of the research team
plus the graduate research assistant(s) who worked on that part of the investigation.

Volume 3 Abstract
Due to the low tensile strength of concrete, when structural concrete elements deteriorate, are
subjected to extreme loadings, or react to corroded reinforcing steel, a portion of the concrete
separates from the component and results in a void that needs repaired. Although there have been
numerous investigations on patching damaged concrete, the majority of these focus on the high
strength and rapid set time of the patch material, neither of which guarantee the durability of a repair.
This study evaluated and identified the repair material properties that are important for
durable concrete repairs and recommended a method engineers can use to select repair materials.
To select an appropriate repair material, an engineer must be aware of two factors: the repair
material’s compatibility with the existing concrete, and the repair material application.
Manufacturers use a wide variety of tests to determine the strength of their product; this information
can often mislead engineers into using a material that is not appropriate for their situation. Therefore,
it is essential to understand the material properties that directly affect repairs and the tests used to
determine them.
To isolate the material properties that directly affect durable repairs, 36 reinforced concrete
beams were damaged and repaired. The repaired beams were loaded to failure during which time the
load/deflection behavior and the patch material’s ability to remain bonded to the beam was
determined. Wedge cylinder samples were also constructed to evaluate the bond strength and the
freeze/thaw resistance of the different repair materials.
The performance of the repair materials in the beam and cylinder tests was compared to data
reported by manufacturers. It was determined that the most important properties for durable concrete
repairs are modulus of elasticity and bond strength. Materials with high moduli of elasticity
performed better than those with lower moduli of elasticity. Materials with high bond strength and
low coefficients of thermal expansion performed the best in the cylinder tests. In all cases, materials
that had properties similar to those of the concrete being repaired performed well.
A procedure was developed to assist in selecting the appropriate repair material for any
situation. The procedure is based on key properties isolated in this investigation, and can be modified
for essentially any repair situation.
vii

ix
TABLE OF CONTENTS
LIST OF FIGURES ........................................................................................................................ xi LIST OF TABLES........................................................................................................................xiii 1. INTRODUCTION AND REVIEW ............................................................................................ 1 1.1 General Background ............................................................................................................ 1 1.2 Objective of Study ............................................................................................................... 1 1.3 Research Approach .............................................................................................................. 1 2. LITERATURE REVIEW ........................................................................................................... 3 2.1 Introduction ........................................................................................................................ 3 2.2 Reviewed Articles .............................................................................................................. 3 2.2.1 Laboratory and Field Evaluation of Required Material Properties for Concrete Repairs (1) ......................................................................................... 3
2.2.2 Repair Material Properties Which Influence Long-Term Performance of Concrete Structures (13) .................................................................................... 8 2.2.3 Factors Affecting Bond between New and Old Concrete (8) .............................. 10 2.2.4 Evaluation of Test Methods for Measuring the Bond Strength of Portland Cement Based Repair Materials to Concrete (7) ................................... 12
2.2.5 Evaluation and Repair of Impact-Damaged Prestressed Concrete Bridge Girders (2) ............................................................................................... 15
2.3 General Patch Behavior.................................................................................................... 17 2.3.1 Cleaning and Preparing Concrete Bridge Repair (19).......................................... 18 3. TEST SETUP........................................................................................................................... 23
3.1 Repair Materials .............................................................................................................. 23 3.1.1 Material A ............................................................................................................ 23 3.1.2 Material B ............................................................................................................ 23 3.1.3 Material C ............................................................................................................ 23 3.1.4 Material D ............................................................................................................ 24 3.1.5 Material E............................................................................................................. 24 3.2 Beam Specimens.............................................................................................................. 25 3.2.1 Flexural Test Specimen Construction .................................................................. 26 3.2.2 Material Application ............................................................................................ 28 3.2.3 Analysis of Flexural Test Specimens ................................................................... 36 3.2.4 Push Out Shear Test ............................................................................................. 37 3.2.5 Analysis of Push Out Shear Test Specimens ....................................................... 39 3.3 Wedge Cylinder Specimens............................................................................................. 40 3.3.1 Cylinder Construction .......................................................................................... 40 3.3.2 Addition of Repair Material to Wedges ............................................................... 43 3.3.3 Cylinder Test Analysis......................................................................................... 43
4. TEST RESULTS...................................................................................................................... 47 4.1 Beam Specimen Flexural Test ......................................................................................... 47 4.1.1 Load/Deflection Plot Information ........................................................................ 47 4.1.2 Specific Material Behavior .................................................................................. 52

x 4.2 Beam Specimen Shear Test...................................................................................................... 55 4.3 Wedge Cylinder Zero Freeze/Thaw Cycle Test Results.................................................. 56 4.4 Wedge Cylinder 110 Freeze/Thaw Cycle Results ........................................................... 62 4.5 Discussion of Test Results............................................................................................... 68 4.5.1 Flexural Test......................................................................................................... 68 4.5.2 Push Out Shear Test ............................................................................................. 76 4.5.3 Bond Strength....................................................................................................... 77 4.5.4 Bond Strength with Freeze/Thaw Cycles............................................................. 78 5. SUMMARY AND CONCLUSIONS ...................................................................................... 81 5.1 Summary.......................................................................................................................... 81 5.2 Recommendations ........................................................................................................... 83 5.2.1 Selection Algorithm ............................................................................................. 83 5.3 Conclusions ..................................................................................................................... 84 APPENDIX A: MOMENT OF INERTIA CALCULATIONS .................................................... 87 APPENDIX B: WEDGE CYLINDER FAILURE LOADS ......................................................... 97 REFERENCES .............................................................................................................................. 99 ACKNOWLEDGEMENTS......................................................................................................... 101
xi
LIST OF FIGURES
Figure 3.1 Damaged beam before repair material is added ....................................................... 25 Figure 3.2 Plaster of paris insert ................................................................................................ 27 Figure 3.3 Wetting the damaged surface of a beam specimen .................................................. 29 Figure 3.4 Application of repair Material A with a putty knife................................................. 30 Figure 3.5 Worker applying scrub coat with a brush................................................................. 32 Figure 3.6 Application of repair Material B .............................................................................. 33 Figure 3.7 Finished patch on a repaired beam specimen........................................................... 34 Figure 3.8 Push out shear test setup for one beam specimen .................................................... 38 Figure 3.9 Push out shear test specimen supported at the beam centerline ............................... 38 Figure 3.10 Assumed geometry of the patch used to calculate the shear area in the push out shear test .................................................................................................... 39 Figure 3.11 Cylinder stand used to make the wedge cylinder samples ....................................... 41 Figure 3.12 Wedge cylinder sample bonding surface.................................................................. 42 Figure 3.13 Repaired wedge cylinder before testing ................................................................... 44 Figure 4.1 Theoretical load/deflection vs. experimental load/deflection plots for the various repair materials................................................................................. 48 Figure 4.2 Material A damaged patch ....................................................................................... 52 Figure 4.3 Material C patch at ultimate load showing the failure at the patch ends.................. 53 Figure 4.4 Complete Material D patch failure........................................................................... 54 Figure 4.5 Material E patch failure along the bond line ............................................................ 55 Figure 4.6 Failure load results for the push out shear tests........................................................ 57 Figure 4.7 Experimentally determined shear strength of beam repairs ..................................... 60 Figure 4.8 Typical compressive wedge cylinder failure............................................................ 64 Figure 4.9 Typical shear wedge cylinder failure ....................................................................... 64 Figure 4.10 Failure load of Material A wedge cylinders subjected to 110-freeze/thaw cycles........................................................................................................................ 65Figure 4.11 Failure load of Material B wedge cylinders subjected to 110-freeze/thaw cycles........................................................................................................................ 66 Figure 4.12 Failure load of Material C wedge cylinders subjected to 110-freeze/thaw cycles........................................................................................................................ 67 Figure 4.13 Failure load of Material D wedge cylinders subjected to 110-freeze/thaw cycles........................................................................................................................ 67 Figure 4.14 Failure load of Material E wedge cylinders subjected to 110-freeze/thaw cycles........................................................................................................................ 69 Figure 4.15 Comparison of average wedge failure loads initially and after freeze/thaw cycles ....................................................................................................................... 69 Figure A.1 Loading system used to determine cracking moment .............................................. 93

xiii
LIST OF TABLES
Table 2.1 Typical substrate and repair material properties ......................................................... 4 Table 2.2 Typical cementitious repair material properties .......................................................... 5 Table 2.3 Comparison of repair material properties by ranking ................................................. 7 Table 3.1 Properties of repair materials used in this study reported by manufacturers ............ 24 Table 3.2 Compressive strength data of the different concrete pours ....................................... 26 Table 4.1 Comparison of Moments of Inertia determined using Method 1 and Method 2
used to calculate deflections in the repaired beams ................................................... 51 Table 4.2 Summary of experimental wedge cylinder failures ................................................... 61 Table 4.3 Comparison of experimentally determined compressive strengths and reported
compressive strengths ................................................................................................ 61 Table 4.4 Wedge cylinder compressive test results after 110-freeze/thaw cycles .................... 63 Table 4.5 Decrease in wedge cylinder strength due to 110-freeze/thaw cycles ........................ 69 Table 4.6 Experimentally determined ranking of repair materials based on all tests performed
in this study ................................................................................................................ 70 Table 4.7 Repair material rankings based on predicted flexural cracking load ........................ 71 Table 4.8 Summary of ratio of modulus of elasticity of repair material to the modulus of
elasticity of the base concrete .................................................................................... 73 Table 4.9 Comparison of experimental and theoretical uncracked load/deflection slopes ....... 74 Table 4.10 Relative rankings of repair material’s bond strength in the flexural test ................ 76 Table 4.11 Repair material ranking based on the push out shear test results ............................ 77 Table 4.12 Comparison of experimental rankings and manufacturers’ reported material property ranking of bond strength of repair materials with zero freeze/thaw cyles ......................................................................................................................... 78 Table 4.13 Ranking of bond strengths subjected to freeze/thaw cycles .................................... 79 Table 4.14 Comparison of the thermal expansion of repair material to the coefficient of thermal expansion of the repaired concrete ............................................................. 80 Table 5.1 Material ranks based on the proposed material selection algorithm ......................... 84 Table A.1 Summary of Method 1 moment of inertia calculations ............................................ 89 Table A.2 Summary of Method 2 moment of inertia calculations ............................................ 91 Table A.3 Summary of Method 1 cracking load calculations ................................................... 94 Table A.4 Summary of Method 2 cracking load calculations ................................................... 96 Table B.1 Wedge cylinder failure loads for zero freeze/thaw cylinders ................................... 98
1. INTRODUCTION AND REVIEW
1.1 General Background
Many of the bridges that are currently in service in the United States and throughout
the world have been in place for quite some time. Over the life of the bridge, the structural
concrete deteriorates due to service loads and environmental attacks. In cold weather areas,
road salts that are used to de-ice the roadway corrode steel reinforcing and cause decreased
capacity. In other cases, bridges are out of date due to the increased traffic loads or increased
vehicle sizes. Engineers are faced with the problem of making the bridge comply with
existing codes. The options are either to replace the bridge at a large cost or repair the
existing one. In some cases it is more economical to build a new structure. In other cases, if
only a small portion of the structure is inadequate it would be advantageous to have a method
to select a proper repair material. This study reviewed the material properties that are most
influential in designing a durable repair and procedures for selecting a material with the most
desirable properties.
1.2 Objective of Study
The research in this project was performed to determine the major factors that control
the effectiveness of a repair patch placed on an impact damaged concrete bridge girder or
damaged footing. The end goal is to provide engineers with a design method for selecting
the correct patch material and correct application procedures for various materials and
damaged concrete girder combinations.
1.3 Research Approach
In order to recommend specific materials for patch repairs, it was essential to
demonstrate how the material properties of the patch affected the performance of the patch.

2
To isolate the specific material properties that directly affect the effectiveness of a patch,
several damaged beams were cast and then repaired with five repair materials with a variety
of material properties. The beams were cast with an insert in the bottom of the beam to
simulate impact damage. Three additional beams cast without an insert, and used as control
beams. Half of the beams, including all of the control beams, were tested to their ultimate
capacity to determine the load/deflection behavior of the repaired beams. The other half of
the beams were loaded to a fraction of their ultimate load to simulate service conditions.
After the simulated service load was applied, the patch was loaded on its side. This load was
intended to simulate a second impact and give quantitative information about the remaining
bond strength of the patch after a service level load.
To determine how the bond between the patch material and the precast concrete is
affected during the course of its service life, cylinders were subjected to 110 freeze/thaw
cycles and then loaded axially. The precast concrete was formed in the bottom half of a
cylinder, but instead of finishing the top flat, the surface was formed at a 30 degree incline.
Then repair material was poured in the remaining portion of the cylinder. The axial failure
load and failure locations in the inclined cylinder tests were key components of this test.
Once the materials were tested the data were analyzed and a method for selecting the best
repair material was proposed.

3
2. LITERATURE REVIEW
2.1 Introduction
There have been many research articles written about patching damaged concrete in
the past several years (1-19). The articles present the virtues of high strength concrete repair
materials and their rapid set times. Unfortunately, high compressive strength and rapid set
times do not guarantee the durability of a repair.
None of the agencies that control concrete standards have any specific design
guidelines for concrete repairs. The agencies report different methods to test in-place
concrete for delamination or the pull-off strength of a patch. However, there are no industrial
standards for the design of these patches. Because of the lack of standards, and lack of the
understanding of why patches fail, many patches perform well initially, but fail after time due
to compatibility problems between the patch and the substrate. Several researchers have
started to investigate the durability of repair patches. The following summarizes the findings
of several of these articles.
2.2 Reviewed Articles
2.2.1 Laboratory and Field Evaluation of Required Material Properties for Concrete
Repairs (1)
This study investigated the material properties necessary to ensure a successful
concrete repair. The study had a laboratory portion and a field portion. The laboratory
portion focused on testing the material properties important to quality, durable concrete
repairs. For this project, the repair materials were classified according to the type of primary
binder present. There were five categories used: 1) portland cement concrete (PCC); 2)
magnesium phosphate concrete (MPC); 3) epoxy polymer concrete (Epoxy PC); 4) methyl

4
methacrylate polymer concrete (MMA PC); and 5) latex-modified concrete (LMC). Because
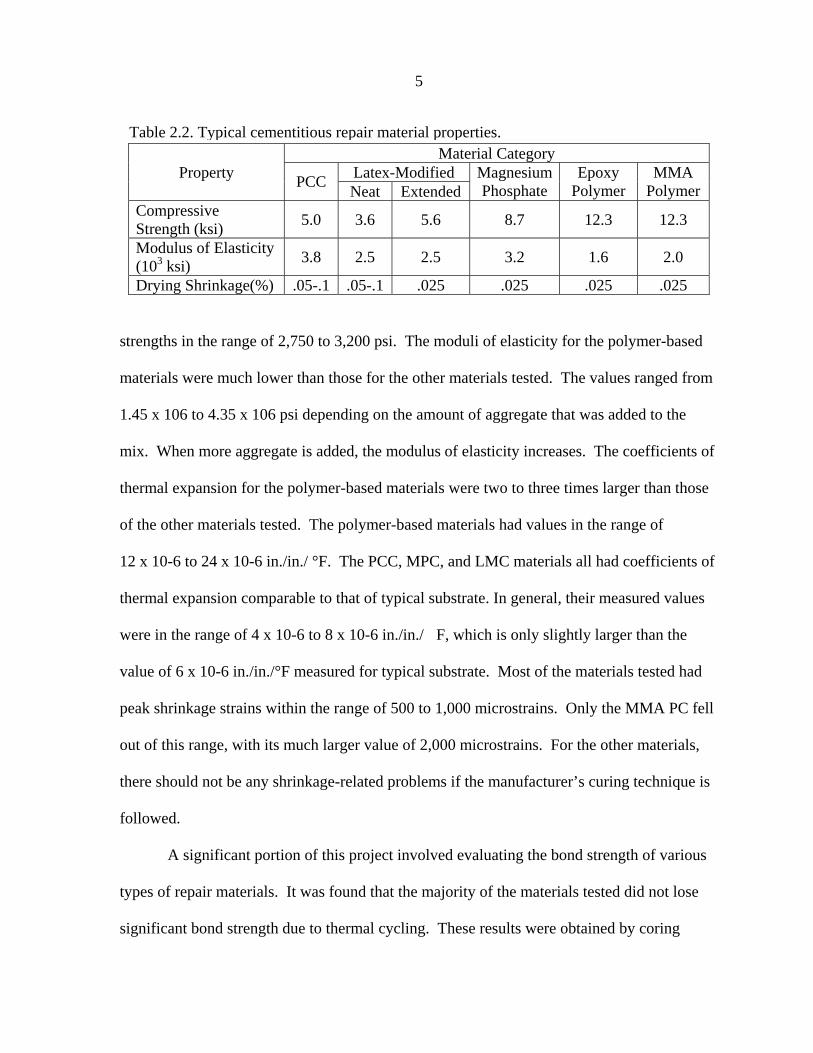
many factors have an effect on property values, Table 2.1 and Table 2.2 only represent
approximate values within each material property category. The tables show general trends
in material properties between different material categories.
Material Category Property Plain Cementitious
Mortar Polymer-Modified
Cementitious Mortar Resin Mortar
Compressive Strength (ksi) 2.9-7.3 4.4-8.7 7.3-14.5 Tensile Strength (ksi) 0.3-0.7 0.7-1.4 1.5-2.2
Modulus of Elasticity (103 ksi) 3-5 2-4 1-2 Coeff. of Thermal Exp. (10-6/°F) 10 10-20 25-30 Water Absorption (% by mass) 5-15 0.1-0.5 1-2
Compressive and flexural tests were performed when the specimens were 1, 7, and 28
days in age. The cementitious-based materials performed extremely well in comparison with
the other materials tested. The two highest 28-day compressive strengths were both neat
portland cement concretes (PCC). The polymer-based materials reached their ultimate
strengths the quickest. It took only 1 day for the MMA and 7 days for the epoxies to obtain
strengths that were extremely close to their 28-day strengths. The polymer-based materials
all had a much higher flexural strength than the other materials tested. This is especially true
for the 1-day strengths, where their flexural strengths were 3 to 4 times larger than the other
materials. For most of the PCC, MPC, and LMC materials tested, their 28-day flexural
strengths were between 1,000 and 1,600 psi, while the epoxies and MMA materials had
Table 2.1. Typical substrate and repair material properties.
5
strengths in the range of 2,750 to 3,200 psi. The moduli of elasticity for the polymer-based
materials were much lower than those for the other materials tested. The values ranged from
1.45 x 10⁶ to 4.35 x 10⁶ psi depending on the amount of aggregate that was added to the
mix. When more aggregate is added, the modulus of elasticity increases. The coefficients of
thermal expansion for the polymer-based materials were two to three times larger than those
of the other materials tested. The polymer-based materials had values in the range of
12 x 10-6 to 24 x 10-6 in./in./ °F. The PCC, MPC, and LMC materials all had coefficients of
thermal expansion comparable to that of typical substrate. In general, their measured values
were in the range of 4 x 10⁻⁶ to 8 x 10⁻⁶ in./in./�F, which is only slightly larger than the
value of 6 x 10⁻⁶ in./in./°F measured for typical substrate. Most of the materials tested had
peak shrinkage strains within the range of 500 to 1,000 microstrains. Only the MMA PC fell
out of this range, with its much larger value of 2,000 microstrains. For the other materials,
there should not be any shrinkage-related problems if the manufacturer’s curing technique is
followed.
A significant portion of this project involved evaluating the bond strength of various
types of repair materials. It was found that the majority of the materials tested did not lose
significant bond strength due to thermal cycling. These results were obtained by coring
Material Category Latex-Modified Property PCC Neat Extended
Magnesium Phosphate
Epoxy Polymer
MMA Polymer
Compressive Strength (ksi) 5.0 3.6 5.6 8.7 12.3 12.3
Modulus of Elasticity (103 ksi) 3.8 2.5 2.5 3.2 1.6 2.0
Drying Shrinkage(%) .05-.1 .05-.1 .025 .025 .025 .025
Table 2.2. Typical cementitious repair material properties.

6
samples and conducting pull-off tests after 4 to 6 weeks of thermal cycles. Even though the
materials did not lose bond strength due to thermal cycling, the bond strength did vary from
material to material. The PCC and MPC material typically had pull-off strengths of 305 psi,
while the epoxy PC, MMA, and LMC materials have initial pull-off strengths of about
508 psi. During the pull-off test, failure most commonly occurred at the bond interface. This
was explained by the fact that cracks invariably exist at the paste-coarse aggregate interface,
even in continuously moist-cured concrete. Pull-off failure also occurred within the
substrate. This occurred when the epoxy and MMA materials were used, and can be
explained by the high bond strength of these materials. The only material to fail during
thermal cycling was the Epoxy PC1 neat mix. This failure occurred after the specimen had
achieved initial bond strength of 537 psi.
The material properties that appeared to best predict bond strength are flexural
strength and modulus of elasticity. The most important findings based on the repair materials
evaluated in this project were that materials with higher bond strengths typically have lower
modulus of elasticity values and higher tensile strengths than those materials with lower bond
strength. The modulus of elasticity did not predict bond strength as well as flexural strength,
but as a general trend the materials with higher bond strengths had lower modulus of
elasticity values. It was difficult to establish a relationship for the bond strength as a function
of thermal cycles. One of the problems was the difficulty in achieving consistent pull-off
strength values due to the high variability in the results. Variability was attributed to:
1) operator error in testing, 2) variability in material strength, 3) type and quality of
equipment used to perform the tests, 4) rate the concrete was cored and the pull-off test
administered, and 5) eccentricity of the cores.

7
Material Name
Material Type
Compressive Strength (high=1)
Flexural Strength (high=1)
Modulus of Elasticity (high=1)
Coefficient of Thermal
Expansion (low=1)
Initial Bond
Strength (high=1)
PCC 1 Neat 2 13 9 4 11
PCC 1 Extended 6 10 6 9 8
PCC 2 Extended 12 11 5 3 9
PCC 3 Neat 1 7 3 5 12
MPC 1 Neat 9 12 2 1 10
Mpc 1 Extended 5 9 1 7 7
Epoxy 1 Extended 11 4 12 13 3
Epoxy 2 Extended 3 2 10 10 5
MMA 1 Neat 7 1 13 12 1
MMA 1 Extended 4 3 7 11 2
LMC 1 Neat 10 5 8 8 4
LMC 1 Extended 8 6 4 6 6
LMC 2 Neat 13 9 11 2 13
LMC
PCC
MPC
Epoxy PC
MMA
Table 2.3. Comparison of repair material properties by ranking.
Relative rankings in Table 2.3 are based on the performance of the materials in
laboratory tests, and “high” and “low” rankings are based on the desirable values of the
repair material. In order to select a suitable repair material, the rankings in each of the
critical material properties are added, and the material with the lowest total is selected.

8
2.2.2 Repair Material Properties Which Influence Long-Term Performance of Concrete
Structures (13)
Three generic repair materials labeled A, B, and C were used together with a plain
concrete mix. The repair materials are single component, bagged materials that only require
the addition of water.
Material A was a blend of portland cement, graded aggregates of maximum size 5mm
and additives which impart controlled expansion in both the plastic and hardened state while
minimizing water demand. It was characterized as high performance and non-shrinkage, and
it can be used to reinstate concrete by partial or total replacement. A water/powder ratio of
0.13 was recommended for use and the typical density of the fresh material is 129 lb/ft3.
Material B was a mineral based cementitious material with no aggregate size particles
or additives. It was relatively porous to allow leaching of salts to continue from
contaminated concrete after its repair. A water/powder ratio of 0.16 was recommended and
the typical density of the fresh material is 98 lb/ft3.
Material C was a single component cementitious mortar which incorporates advanced
cement chemistry, microsilica, fiber reinforcement and styrene acrylic copolymer
technology. The result was a rapid hardening, low density, high strength mortar with
enhanced polymer properties. The thixotropic nature of the product made trowel application
easy in structural repair of voids, rendering and reprofiling of both vertical and horizontal
surfaces. The recommended water/powder ratio is 0.16 and the fresh density of the material
is 106 lb/ft3.
Plain concrete mix used for comparison with the repair materials had constituents of
ordinary portland cement, fine aggregate, and coarse aggregates of a maximum size of 0.4 in.

9
The mix proportions (by weight) were 1:2.24:3.22, with a water:cement ratio of 0.56. The
cement content was 21.4 lb/ft3.
Compressive tests were carried out for each repair material and for the plain concrete.
Prisms were made for the compressive tests of each material. The flexural strength of prism
specimens was determined under four-point bending at the age of 28 days. Two prism
specimens of each mix were tested to determine the static modulus of elasticity at 28 days.
Prisms were used for compressive creep tests. Two creep tests were carried out for each
material at a sustained stress of 30 and 45% of the 28-day cube strength. In order to calculate
the net creep strain, shrinkage was measured on separate specimens and deducted from the
total strain measured on specimens in the creep apparatus. To measure drying shrinkage and
swelling, ten prisms were used to measure deformation. The first datum strain reading was
taken at 24 h after casting, and subsequent changes of length were monitored every 3 days
for the first 60 days and once a week thereafter. Four different curing environments of
varying temperature and humidity were used.
Material A developed strength rapidly and reached a high compressive strength at
28 days. The elastic modulus and modulus of rupture of Material A are much greater than
the respective values for the other materials. Repair Materials B, C, and the plain concrete
mix have similar elastic moduli and flexural strengths. The shapes of the compressive creep
curves for each material are similar. Materials A and B show comparatively low creep
strains. They are roughly 15% less than plain concrete. Material C shows the highest creep
strains. The creep of repair materials is more sensitive to the stress/strength ratio than plain
concrete is. The repair materials show more drying shrinkage than plain concrete. The
shrinkage curves of Materials A and B are similar in shape to plain concrete, but Material C

10
shows very rapid shrinkage for the first 20 days followed by a rate of shrinkage similar to the
other materials. Shrinkage of specimens cured in water first for 28 days, then stored in air at
62°F and 55% relative humidity is lower than specimens continuously cured at 62�F, 55%
relative humidity after demolding. Additionally, shrinkage of repair materials is much more
sensitive to relative humidity of exposure compared to plain concrete. This is especially
evident in Material C. The most permeable material was Material B. Materials A, C and the
plain concrete had similar permeability coefficients.
The long-term cracking at the repair/substrate interface and the long-term load
sharing by the repair patch will be primarily controlled by the shrinkage and creep
characteristics of the repair materials. High shrinkage repair materials are more liable to
develop shrinkage cracking at the interface with the substrate but this can be reduced if the
creep characteristics of patch repair are also high. Polymer additives in repair materials show
a small decrease in the water permeability but at the same time they increase the long-term
shrinkage and creep deformations. Compressive creep strains are greatest for the generic
repair mortar which contains styrene acrylic copolymer, compared to the other materials.
Drying shrinkage is greatest for the cementitious repair mortar that contains the styrene
acrylic copolymer despite the presence of some fiber additives. Shrinkage of repair mortars
with polymer admixtures is much more sensitive to the relative humidity than plain concrete
is. Material A, which contains aggregate particles, has less shrinkage and creep deformation
than the other repair materials without aggregates. Polymers reduced water permeability.
2.2.3 Factors Affecting Bond between New and Old Concrete (8)
The experimental investigation was used to examine the effects of the following
parameters on bond strength: (1) the water-cement ratio of a portland cement mortar

11
(consisting of equal parts by weight of dry sand and portland cement); (2) the thickness of the
bond layer; (3) the effect of various curing conditions; (4) the effect of wetting the surface of
the hardened concrete before application of the portland cement mortar bonding agent;
(5) the effect of delay between mixing a copolymer polyvinyl acetate (PVA) bonding agent
and its application to hardened concrete; and (6) the effect of painting on PVA (without
addition of aggregate and cement) against using PVA in a mortar. The bond surface was
kept dry, unless otherwise noted when the portland cement bonding agent was used; it was
wet immediately prior to the application of the PVA bond agent following the
recommendation of the manufacturer.
The most obvious fact reflected in the data is the difference in strength between the
bonds containing PVA and the bonds containing portland cement mortar. Almost all the
portland cement mortar bonds were stronger than the PVA bonds. The thickness of the layer
applied affected the bond strength. Three different thicknesses, 1/8 , 3/16, and 1/4 in., were
applied in lifts. The results show that the 1/8 and 3/16-in. layers were stronger than the
1/4 in. layer. The 1/4-in. sample failed at the bond line, while the others failed outside the
bond area. The authors offer no explanation for this phenomenon. The influence of the
water-cement ratio is less clear. The ultimate compressive stress for the 0.32 water-cement
ratio bond was on average 1,870 psi lower than for the 0.35 water-cement ratio and 1,480 psi
lower than for the 0.40 water-cement ratio. A very low water-cement ratio appears to cause a
reduction in bond strength. Prewetting the substrate prior to application of the bond layer
may be seen to improve the strength slightly. If a PVA bonding agent is used, the ultimate
compressive strength decreases by 10% when the bonding agent dries before the repair
material is applied. PVA-modified cement mortars yielded higher bond strengths. The

12
ultimate compressive strength of the mortar was highly dependent on the water-cement ratio.
When the water-cement ratio varied from the recommended ratio specified by the
manufacturer, the strength decreased drastically. Curing conditions also affected the ultimate
strength. Two different specimens were cured under different conditions. One sample was
cured for 13 days at 100 percent relative humidity and 14 days at 50 percent humidity.
Another sample was cured at 100 percent humidity for 27 days. The specimens cured at
100 percent humidity had strengths greater than 90 percent of those of the other specimens.
Thus, the curing difference affected the test strengths only to a small degree.
2.2.4 Evaluation of Test Methods for Measuring the Bond Strength of Portland Cement
Based Repair Materials to Concrete (7)
The purpose of the research was to evaluate three bond strength test methods for use
in screening and selecting repair materials used in concrete repair. Two methods of gripping
uniaxial tension specimens were investigated. Also, a modified ASTM C 882 slant shear
bond strength test method was conducted. Three repair materials were investigated: 1) 13 to
14-day-old portland cement concrete (PCC) on 80-day-old base PCC; 2) a 7-day-old latex
modified concrete (LMC) with an excessive air content on 94-day-old base PCC; and 3) a
10-day-old LMC with a normal air content on 129-day-old base PCC. The test methods were
evaluated by analyzing the failure patterns, the magnitude and relative precision of the failure
stresses and the differences in the geometry and loading conditions between the test methods.
The two tension test methods used were the friction grips method and the pipe nipple grips
method. The friction grips method holds the cylinder with the friction between the specimen
and a steel pipe that is split longitudinally and clamped tightly around the specimen. The
pipe nipple grips method holds on to the cylinder with epoxy between a steel pipe and the

13
specimen. The modified ASTM 882 test investigates the bond between two slant shear
specimens by applying a compressive load. One specimen is base concrete and the other is
the repair material being investigated.
With the slant shear test method, failure stress is based on the cross-sectional area
(7.1 in.2) and on the elliptical bond plane area (14.1 in.2). The failure bond stress based on
elliptical bond plane area was used when comparing the failure stress from the slant shear
test method with that from the tension test methods. The failure stress, based on the cross-
sectional area, was used when comparing the strength of a slant-shear specimen with the
compressive strength of a comparable control cylinder. The failure bond stress was
calculated per ASTM C 882 by dividing the failure load (P) with the elliptical bond plane
area. The nominal shear bond stress [cosine 30° x P/14.1], which acts parallel to the bond
plane, however, is lower than the ASTM stress. The percentage of failure surface area which
occurred on the bond plane was deemed “clean” when neither the repair material nor the base
concrete adhered to the other. When some material remained bonded together, an estimate
was made as to the percentage of the surface that was still bonded together.
With the 14-day-old-PCC-repair material, no common failure patterns were evident in
either the friction grips tension test methods, or the slant shear test methods. The different
failure patterns were not unexpected with the friction grips test method, since the tensile
strength of the control repair material specimens was about the same as that estimated for the
base concrete. There appeared to be a common failure pattern in the 14-day-old-repair
material in the pipe nipple grips test method. The common failure pattern was not expected,
since the tensile strength of the 14-day-old PCC repair material was about the same as that
estimated for the base concrete.

14
With all three test methods, there was a common mode of failure in the excessive air
LMC repair materials. Of the total amount of material failure, a larger percentage of the
failure occurred in the repair material than occurred at the interface between the repair
material and the base material. The failure pattern was as expected for the slant shear tests
since the average compressive strength of the excessive air LMC control repair material
cylinders was below that of the control base concrete cylinders.
There was a common mode of failure in the base concrete with the normal air LMC
repair material and with the two tension test methods, especially for the pipe nipple grips
method. With each specimen, the percentage of the failure surface which failed in the base
concrete in almost all cases exceeded the sum of the percentage which failed in the repair
material and the percentage which failed as a “clean” break. With the normal air LMC repair
material, all the slant shear specimens had a “clean” brake value of 75% or greater; which
means that 75% of the failure surface was free of repair material.
For each of the three repair materials, the failure stress in the slant shear test based on
the elliptical failure plane was substantially greater than that for the two tension tests. This
substantial difference in failure stress was attributed primarily to the different test geometry,
loading and stresses in the slant shear test as compared to the two tension tests. Values of the
ratio of the slant shear average failure stress to that of the compressive strength of the base
concrete control cylinders (about 4,900 psi) were 0.81 for the 14-day-old PCC, 0.40 for the
excessive air LMC, and 0.86 for the normal air LMC. This ratio represents the strength of
the slant shear composite specimen relative to the compressive strength of the base concrete
control cylinders. A ratio of this nature could be a useful indication of the expected
performance of the repair material in service. The average failure stress for the pipe nipple

15
grips test method exceeded that of the friction grips test method for each of the three repair
materials. This was explained by the fact that the pipe nipple test had less eccentricity.
Due to the difference in failure stresses reported by the different type of bond tests, it
is important to focus on the test data that will most likely represent the conditions that the
patch will be exposed to in its service life. The test methods chosen should have geometry,
loading conditions, and stress states that are anticipated for the in-service repair material. It
is important to remember that the repair has possible failure mechanisms in the base
concrete, repair material, and along the bond line. The slant shear test provided more
consistent data than the tension tests. The pipe nipple grips tension test method was
considered to be the more promising of the two tension test methods because of its higher
average failure stress and better relative precision. If the slant shear test is to be used as the
criteria for material selection, the actual test should be performed with caution. Both slant
shear and control specimens need to be loaded in compression at the same load rate, and the
same cross-sectional area needs to be used to calculate the stresses.
2.2.5 Evaluation and Repair of Impact-Damaged Prestressed Concrete Bridge Girders (2)
This study investigated several different methods of repair on an impact damaged
prestressed concrete girder. The damaged girder was a removed from the bridge where it
was impacted. The girder had several damaged regions that required a variety of repairs.
Although, the researchers spliced strands, performed non-destructive evaluations, and formed
and pumped some cementitious materials, this summary of the report will only pertain to
overhead repair.
Damaged portions of the girder web that consisted of fractured or delaminated
material were repaired with vertical and overhead repair mortars. The repair materials were

16
placed without forms, either by troweling, hand packing, or a combination of both. One and
two component materials were used.
Two different two-component latex-modified repair mortars were used: 1) Burke
V/O, and 2) Renderoc HB2. Each consisted of a 55-lb. package of dry components, and one
gallon of a liquid dispersion of acrylic latex used in place of mixing water. The patched
areas were 3 to 4 in. deep by 8 to 18 in. wide. Both of the materials were used to also repair
a 6-in. deep portion of the flange. The web repairs were hand-packed and then ground
smooth, while the flange repairs were performed with partial formwork in one location and
without any forms in the other location. A scrub coat was applied to the surface of the
damaged area before the material was placed. Then the mortar was either troweled or
hand-packed into the damaged area. The second type of overhead material chosen was a
single-component acrylic latex-modified repair mortar. Acrylic Patch was used on a 1/2 to
3-in. deep patch that was 60 in. by 8 in. in plan. The surface was presaturated for 4 hours and
a scrub coat was applied before the repair material was applied. The third type of material
applied was EMACO S88CA. It is a silica fume, fiber-reinforced, cementitious repair
mortar. EMACO S88CA was used to repair a 1/2 to 4-in. deep patch that was approximately
60 in. by 8 in. in plan. A scrub coat was not applied, but the beam was wet for 24 hours
before application and wet cured for 7 days.
Initially both two-component latex-modified repair materials looked similar. They
were very dry, but as the acrylic was added, the consistency became very sticky. The
researchers tried to repair the first section of the web in one lift using the Renderoc HB2.
The weight of the patch pulled it away from the substrate. The result was a 2-in. lift. The
next day they finished the repair by applying a scrub coat to the first lift and filling the

17
remainder of the damaged area. Renderoc HB2 was used to repair a portion of the flange.
Forms were used to perform this portion of the repair. The researchers were only able to get
a 2-in. lift, even with the forms. Burke V/O was used in the same situations as Renderoc
HB2. The main difference in terms of application between the Renderoc HB2 and Burke
V/O was that the Renderoc HB2 pulled away from the surface more easily, leading to thinner
lifts. Acrylic Patch was used to repair part of the web. The consistency of this material was
much thinner and less cohesive than the two-component mortars. The working time was
much less than the two-component materials (10 minutes) and the material would only stick
in lifts of 1/2 in. Cold water was used to increase the working time. EMACO S88CA was
much darker than the other materials due to the silica fume additive. When applied thicker
than 1 1/2 in., the material tended to sag. This led to single lift repairs.
There was no discussion of the performance of the different repair materials to
loading or durability. This report only focused on application techniques.
2.3 General Patch Behavior
The first step in determining the proper repair material and repair application method
is to determine the conditions that the patch and the existing concrete will experience over
the life of the structure. Important considerations are temperature range, load magnitude and
duration, chemical environment, and whether the patch is aesthetic or structural. Different
patches will perform better in different conditions depending on the material properties of the
patch material. There is no one “magical” repair material. Material selection should be a
balance between the material properties of the concrete substrate and repair material and the
service conditions the member will experience.

18
2.3.1 Cleaning and Preparing Concrete Before Repair (19)
Once the service conditions have been determined and the repair material has been
selected, the existing surface needs to be prepared so that an adequate bond can be achieved.
Different manufacturers of repair materials often have a list of “approved” contractors that
have been trained in the application of their product. Additionally, the manufacturer will
usually provide a recommended application procedure that includes surface preparations.
Whenever possible, it is recommended to use the manufacturer’s method to limit the
engineer’s liability on the project. In addition to the surface preparation instructions supplied
by the manufacturer, there are industry guides and standards that should be followed. The
following lists the appropriate standards and guidelines: (19)
• ASTM Standards forCleaning, Surface Preparation, and Testing • ASTM D 4258 Surface Cleaning Concrete for Coating • ASTM D 4259 Abrading Concrete • ASTM D 4263 Indicating Moisture in Concrete by the Plastic Sheet Method • ASTM D 4285 Indicating Oil of Water in Compressed Air • ACI Guidelines “ Guide to Durable Concrete” (ACI 201.2R) • “Causes, Evaluation and Repair of Cracks in Concrete Structures” (ACI 224.1R) • International Concrete Repair Institute Guidelines • No. 03730 Surface Preparation for the Repair of Deteriorated Concrete Resulting
from Reinforcing Steel Corrosion
The major concern of surface preparation is surface contaminants. Contaminants may
be defined as material, either liquid or solid that has the potential to cause adhesion, curing,
and/or application-related problems with coatings or patching materials as applied to
concrete (1). When dealing with impact damaged concrete beams, unsound concrete and
dust are also concerns. All unsound concrete at the surface of the patch must be removed to
insure adequate repair material bond. Damaged concrete should be removed with a hammer
and chisel (larger pieces) or a sandblaster (smaller pieces). Never use a jackhammer or a

19
scabbler because these large, heavy impact machines can cause microcracks, or bruising, in
the concrete. Loose dust or dirt on the surface is most effectively removed with vacuum
cleaning or oil-free compressed air.
At this time it is necessary to distinguish between “surface preparation” and
“cleaning”. Cleaning refers to the process of removing solvents and dust. Surface
preparation involves removing weakened surface layers, removing laitance, and applying any
bonding agent recommended by the manufacturer to provide a surface profile adequate to
achieve a good adhesive bond. Cleaning should always be performed before surface
preparation and immediately before patch material application. The procedure should be–
1) pre-clean, 2) surface preparation, and 3) final clean (19).
It is essential that the patch and existing concrete systems perform as required in the
given service environment (1). The factors that control whether the system will perform as
required are material properties and quality construction methods. As the engineer, it is our
job to select the proper repair materials based on the requirements of the patch system. Due
to the nature of the cementitious, pre-packaged repair materials on the market (high early
strength, quick set times, and easy to apply), initial application of the material is not a
problem. The key to repairing concrete is guaranteeing the durability of the repair system.
In order to do that, the engineer must select a repair material with properties compatible with
the substrate. The difficulty with determining the material properties that will insure a
durable patch is that manufacturers often do not reveal all of the constituents of the
prepackaged repair materials. This presents a problem because different constituents have
different material properties and successful repair material selection requires a compromise
between the desired material properties. The material properties in question are shrinkage,

20
coefficient of thermal expansion, modulus of elasticity, flexural strength, bond strength, and
to a much lesser degree, compressive strength.
Many repair materials are sold to repair engineers based solely on the compressive
strength and the rapid set times. This can be explained by the fact in most situations
compressive strength is the most important concrete property. However, nearly all impact
damage to concrete beams occurs on the bottom of the beam, and therefore in the portion of
the beam that is in tension. Because of the location of the damage, compressive strength of
the patch only affects the durability and overall effectiveness of the system indirectly. The
compatibility of the patch material and substrate, however, is of consequence. Compatibility
can be defined as the balance of physical, chemical and electrochemical properties and
dimensions between the repair phase and the existing substrate phase of a repair system (1).
The difficult decision is to decide what is meant by “compatible”. This thesis will not
include a discussion of the chemical properties of the repair systems, but it will include an
investigation of the thermal properties, bond strength and stiffness of concrete beams
repaired with rapid setting cementitious materials.
When there is a significant difference in the coefficient of thermal expansion between
the repair patch and the substrate, problems can occur. The problem is that the two materials
try to move relative to each other when there is a temperature change. This movement
induces internal stresses within each material. Internal stresses can cause the bond to break
and cracks in the substrate or patch. When cracking occurs, several problems arise. Cracks
in the repair system may allow water to penetrate to the reinforcement. This water, which
may contain chlorides from deicing salts, can cause two problems. Water expands when it
freezes, and when it is in concrete, may widen existing cracks. These cracks will lead to the

21
deterioration of the patch, and ultimately to its failure. Water, especially water that contains
chloride ions, will cause corrosion in the reinforcement. When the reinforcement corrodes, it
loses effective section and also expands. The loss of section obviously decreases structural
capacity. As the rust builds on the reinforcement and the reinforcement expands, cracks are
formed and the bond between the concrete and the rebar is lost.
Patch longevity is also affected by shrinkage. When the fresh patch material is
applied, the concrete substrate has achieved dimensional stability. If the patch material
shrinks too much as it cures, large internal stresses can occur. This will break the bond
between the two materials. For this reason it is desirable to use a patch material that has low
shrinkage. Proper curing can minimize shrinkage. Many manufacturers recommend either
wet curing with burlap and a moisture barrier around the patch for 2 to 7 days or a curing
compound. Some patch materials, however, are incompatible with curing compounds.
Incompatibility is also a problem when there is a mismatch in the modulus of elasticity
between the repair and substrate. This is especially critical when the repair material is stiffer
than the substrate. The stiffer patch will attract a larger portion of the load. A stiffer patch
(higher modulus of elasticity) will not deform as much as the substrate and cause
redistribution of the load. The redistribution of the load will focus the stress on the interface
between the patch and the substrate. The high stress on the interface will eventually lead to a
bond failure of the patch. Ideally, the patch should not be as stiff (lower modulus of
elasticity) as the substrate, because it will be in the tension portion of the beam. This will
allow the patch to elongate with applied load and decrease stress concentration at the
interface. However, the modulus of elasticity of the patch cannot be too low. If it is too low,
the patch may sag or creep.

22
From the above discussion it is apparent that when a repair material is selected, care
should be taken to match the material properties of the repair and the substrate. It is possible
to use a repair material that has different material properties than the substrate as long as the
bond strength is not weakened by the induced internal stresses and no durability problems
arise from cracking. The key is to ensure that the internal stresses do not exceed the tensile
stresses of the substrate, repair material, or the bond strength of the interface.

23
3. TEST SETUP
3.1 Repair Materials
All of the material properties given in Table 3.1 are directly from manufacturers’
literature. This information was used to select the different materials due to the variety of
material properties of each product. Through this thesis, repair materials are only identified
as Material A through Material E to conceal the identity of the manufacturer of the various
repair materials. The main purpose of this research was to develop a selection process for
determining which repair material to use in a given situation and to compare various repair
materials.
3.1.1 Material A
Material A repair mortar is a one-component, polymer-modified, shrinkage-
compensated product, which contains an integral corrosion inhibitor. The product is ideally
suited for patching and/or resurfacing distressed concrete. The lightweight nature of the
product allows for excellent building without sagging. The working time is 30 minutes.
3.1.2 Material B
Material B is a rheoplastic, shrinkage-compensated cement-based repair mortar. This
one-component product is enhanced with silica fume and fibers to provide high strength and
superior performance and a corrosion inhibitor. It is specially designed for structural repairs
of concrete or masonry and can be applied vertically or over-head by low-pressure spraying
or hand troweling. The reported application time is about 45 minutes.
3.1.3 Material C
Material C is a two-component, polymer-modified, Portland cement, fast setting, non-
sag mortar. It is a high performance repair mortar for vertical and overhead surfaces, and
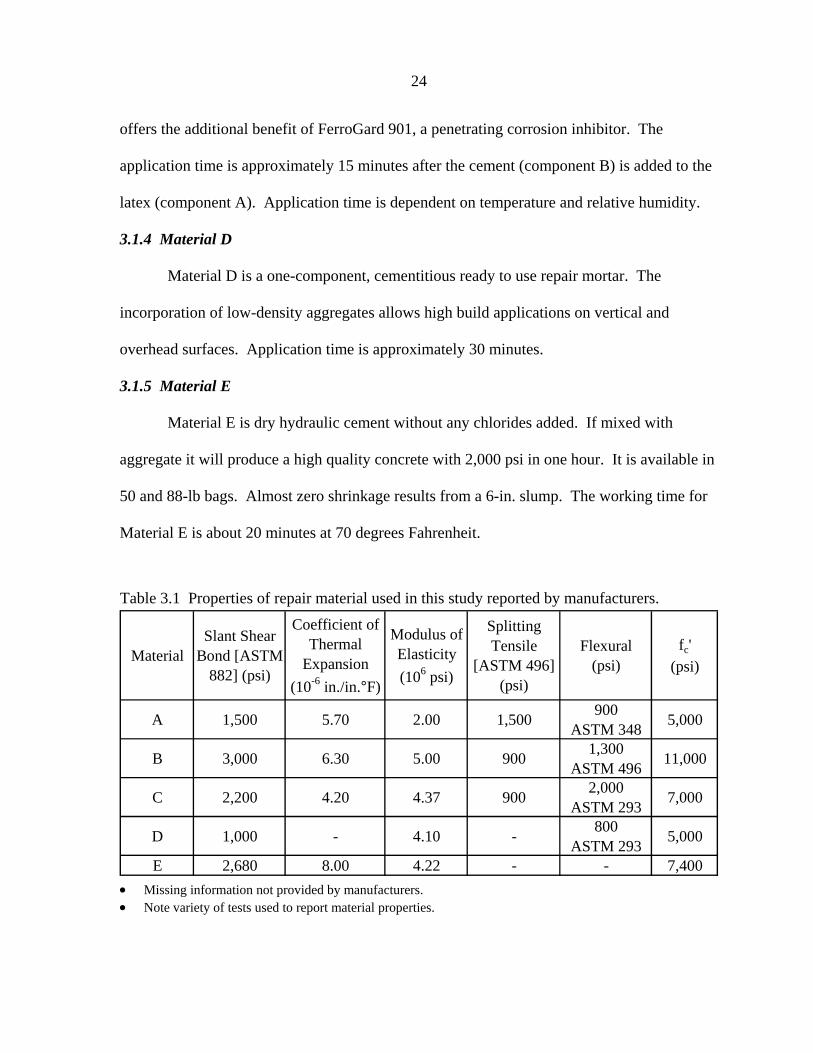
24
MaterialSlant Shear
Bond [ASTM 882] (psi)
Coefficient of Thermal
Expansion (10-6 in./in.°F)
Modulus of Elasticity (106 psi)
Splitting Tensile
[ASTM 496] (psi)
Flexural (psi)
fc' (psi)
A 1,500 5.70 2.00 1,500 900 ASTM 348 5,000
B 3,000 6.30 5.00 900 1,300 ASTM 496 11,000
C 2,200 4.20 4.37 900 2,000 ASTM 293 7,000
D 1,000 - 4.10 - 800 ASTM 293 5,000
E 2,680 8.00 4.22 - - 7,400
Table 3.1 Properties of repair material used in this study reported by manufacturers.
• Missing information not provided by manufacturers. • Note variety of tests used to report material properties.
offers the additional benefit of FerroGard 901, a penetrating corrosion inhibitor. The
application time is approximately 15 minutes after the cement (component B) is added to the
latex (component A). Application time is dependent on temperature and relative humidity.
3.1.4 Material D
Material D is a one-component, cementitious ready to use repair mortar. The
incorporation of low-density aggregates allows high build applications on vertical and
overhead surfaces. Application time is approximately 30 minutes.
3.1.5 Material E
Material E is dry hydraulic cement without any chlorides added. If mixed with
aggregate it will produce a high quality concrete with 2,000 psi in one hour. It is available in
50 and 88-lb bags. Almost zero shrinkage results from a 6-in. slump. The working time for
Material E is about 20 minutes at 70 degrees Fahrenheit.

25
Figure 3.1 Damaged beam after repair material is added.
3.2 Beam Specimens
The flexural test used in this study involved loading simulated impact damaged
concrete beams that were repaired with different repair materials. The purpose of this
portion of the study was to determine the flexural strength of the repaired beams and the
strength of the bond between the repair patch and the concrete beam. These beams were
used to determine the stiffness of the beams with different repair materials and to predict
cracking loads. Figure 3.1 shows a typical beam used in this test.
Beams tested were 6 in. x 12 in. x 8 ft in their original undamaged condition. There
were 2-#4 (1/2 in. diameter), 40 ksi steel bars running longitudinally and setting on 1 1/2-in.
chairs to ensure standard cover. The beams were cast in standard metal forms in six different
pours. The concrete (Table 3.2) used was an Iowa Department of Transportation (Iowa
DOT) bridge mix C4, which contains 3/4-in. aggregate and 5-7% air entrainment.
During each of the concrete pours, one person performed slump and air tests. Each of
the several 6-in. x 12-in. cylinders that were made for each pour were covered with a plastic
baggie and cured at room temperature. All the beams in each pour were covered with
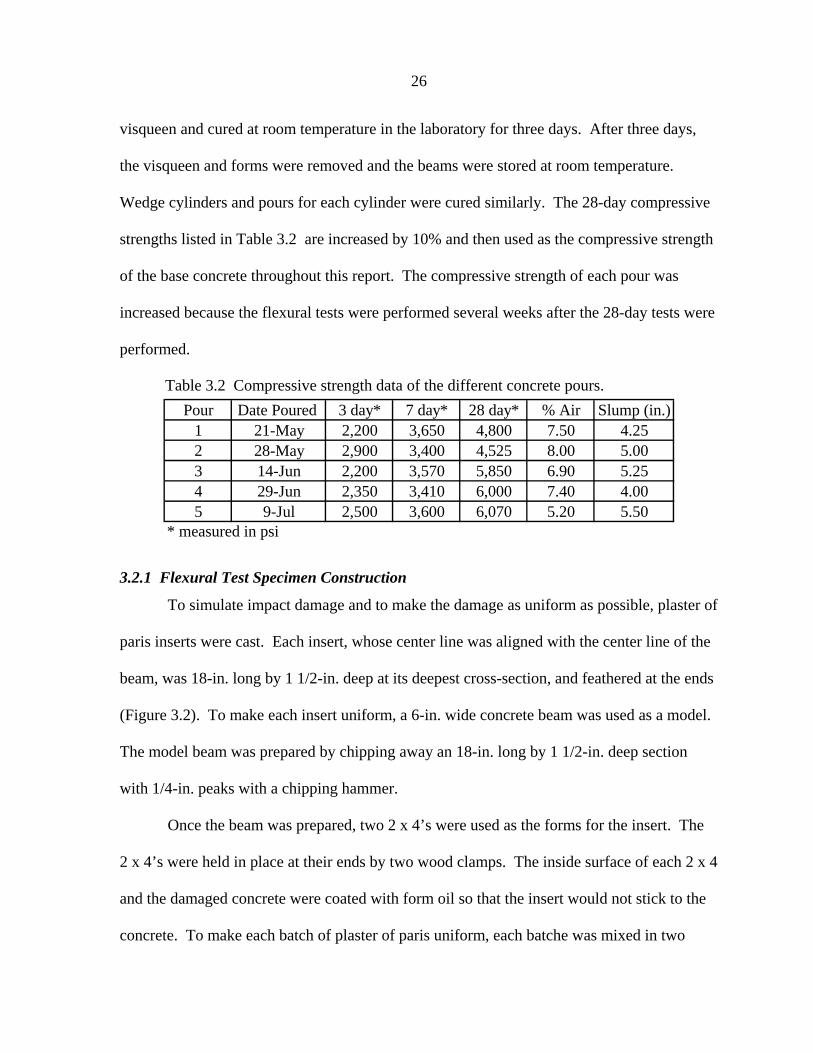
26
Pour Date Poured 3 day* 7 day* 28 day* % Air Slump (in.)1 21-May 2,200 3,650 4,800 7.50 4.252 28-May 2,900 3,400 4,525 8.00 5.003 14-Jun 2,200 3,570 5,850 6.90 5.254 29-Jun 2,350 3,410 6,000 7.40 4.005 9-Jul 2,500 3,600 6,070 5.20 5.50
* measured in psi
Table 3.2 Compressive strength data of the different concrete pours.
visqueen and cured at room temperature in the laboratory for three days. After three days,
the visqueen and forms were removed and the beams were stored at room temperature.
Wedge cylinders and pours for each cylinder were cured similarly. The 28-day compressive
strengths listed in Table 3.2 are increased by 10% and then used as the compressive strength
of the base concrete throughout this report. The compressive strength of each pour was
increased because the flexural tests were performed several weeks after the 28-day tests were
performed.
3.2.1 Flexural Test Specimen Construction
To simulate impact damage and to make the damage as uniform as possible, plaster of
paris inserts were cast. Each insert, whose center line was aligned with the center line of the
beam, was 18-in. long by 1 1/2-in. deep at its deepest cross-section, and feathered at the ends
(Figure 3.2). To make each insert uniform, a 6-in. wide concrete beam was used as a model.
The model beam was prepared by chipping away an 18-in. long by 1 1/2-in. deep section
with 1/4-in. peaks with a chipping hammer.
Once the beam was prepared, two 2 x 4’s were used as the forms for the insert. The
2 x 4’s were held in place at their ends by two wood clamps. The inside surface of each 2 x 4
and the damaged concrete were coated with form oil so that the insert would not stick to the
concrete. To make each batch of plaster of paris uniform, each batche was mixed in two

27
Figure 3.2 Plaster of paris insert.
plastic 6-in. diameter by 12-in. high cylinders. One cylinder was filled with plaster and the
other was filled with 5 in. of water. The contents of each cylinder were then poured into a 5
gallon bucket. The contents were mixed together by hand for approximately 2 1/2 minutes
until the slurry had a smooth consistency. The wet plaster of paris mix was then poured into
the mold. The sides of the beam were struck several times with a rubber mallet to vibrate the
plaster of paris mix. The top surface of the plaster of paris was finished with a hand trowel.
The plaster of paris setup in about 30 minutes. When the insert had cured, the 2 x 4 forms
were stripped. The insert was pried out of the mold with wood clamps placed on the side of
the insert. By lifting on the wood clamps, the insert was freed, after which the mold was
cleaned to remove any debris.
Before the insert could be placed in the bottom of the beam forms, the insert was
spray painted to avoid drawing moisture from the concrete in contact with the insert while
the beams cured. Often the sides of the inserts had to be filed down to fit into the forms.

28
A total of thirty-six beams were cast in the manner described above. Three of the
thirty-six beams were cast without inserts and were used as control beams to determine the
behavior of the beams without damage. Once the beams had cured for 28 days, they were
readied for repair. The patch was removed, and the surface of the damaged beams where the
patch had been, was scrubbed with a stiff metal brush to remove paint and any plaster of the
paris that adhered to the beam.
Since form oil had been applied to the plaster insert, the oil had to be removed from
the damaged surface. The oil was removed with a trisodium phosphate (TSP) mixture – 1/4
cup TSP and 1 gallon of warm water. The surface of the damaged beams was scrubbed with
the TSP solution until the surface absorbed water (19). Once the form oil was removed, the
beam was rinsed with water to remove any TSP remaining on the surface; any remaining
debris was removed with oil-free compressed air.
3.2.2 Material Application
A total of six beams were repaired with material A. The damaged surface was soaked
over night to a surface saturated dry (SSD) condition. SSD is a common condition
referenced by concrete repair material manufacturers. Three beams were positioned with the
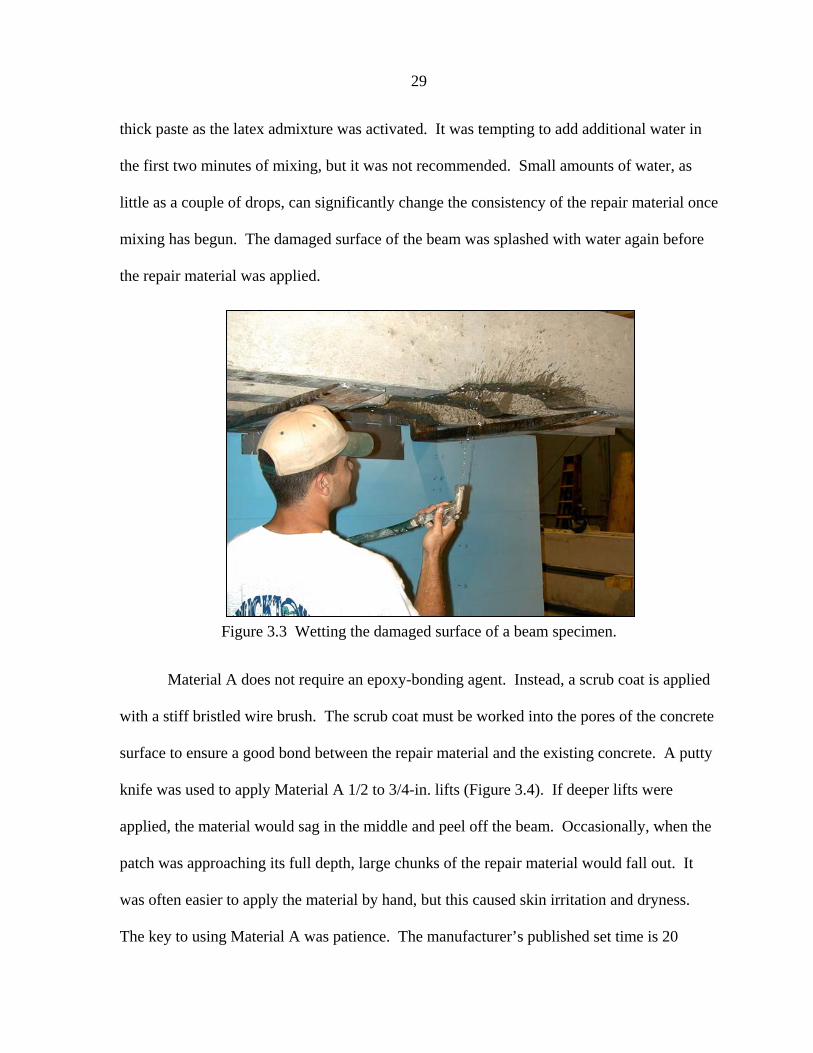
damaged portion on the bottom to simulate overhead repair conditions. Figure 3.3 shows a
worker wetting a beam in its overhead position.
Material A is provided in 55-lb bags and requires 1 gallon of water per bag. One half
of a bag was weighed and poured into a plastic 5-gallong bucket. One half gallon of water
was poured into a clean 5-gallon bucket. Material A was added at a steady rate to the water
while a paddle mixer, attached to a power drill was used to mix the two materials for
approximately three minutes. The consistency of the mixing went from a damp powder to a
29
Figure 3.3 Wetting the damaged surface of a beam specimen.
thick paste as the latex admixture was activated. It was tempting to add additional water in
the first two minutes of mixing, but it was not recommended. Small amounts of water, as
little as a couple of drops, can significantly change the consistency of the repair material once
mixing has begun. The damaged surface of the beam was splashed with water again before
the repair material was applied.
Material A does not require an epoxy-bonding agent. Instead, a scrub coat is applied
with a stiff bristled wire brush. The scrub coat must be worked into the pores of the concrete
surface to ensure a good bond between the repair material and the existing concrete. A putty
knife was used to apply Material A 1/2 to 3/4-in. lifts (Figure 3.4). If deeper lifts were
applied, the material would sag in the middle and peel off the beam. Occasionally, when the
patch was approaching its full depth, large chunks of the repair material would fall out. It
was often easier to apply the material by hand, but this caused skin irritation and dryness.
The key to using Material A was patience. The manufacturer’s published set time is 20
30
Figure 3.4 Application of repair Material A with a putty knife.
minutes, but applying lifts less than an hour apart is not recommended. Material A is a
thixotropic material, which means that if agitated, it will return to a plastic state. When the
material returns to a plastic state, the working time of the material is increased, and the
material has a tendency to peel off the beam. The manufacturer recommends scoring the
bottom of each lift to promote bond to the next lift. This was difficult to do because of the
thixotropic nature of the material. The surfaces were lightly brushed between lifts to remove
some material that had not fully hardened; it took four lifts to repair each beam. It was
possible to repair three beams and cast the 12-3-in. diameter cylinders with two bags of
material, but there was a significant amount of waste in each batch mixed because of the
short pot life and the amount of material that fell onto the ground. It took four lifts to repair
each beam.

31
Material B was the second product used to repair the beams. It also comes in 55-lb
bags, but does not have the same amount of yield per bag as Material A. It is darker when
mixed with water and had visible fibers in the paste. Like many of the repair materials, it
was difficult to determine if the material had the correct water/cement ratio. This is
important because the bond between the concrete and repair material was very sensitive to
the water/cement ratio. If the material was too dry, it setup very quickly and the batch was
lost or the repair material would not stick to the beam. A convenient method to determine if
the material was ready to be applied was to stick a putty knife into the slurry and then turn it
upside down. If the material stuck to the putty knife, it was properly mixed. If the material
did not stick, a change was made. If the material was too dry, water was added and the slurry
was mixed longer. Sometimes it was determined that there was adequate water, but that the
latex had not become active. This determination was made based on the smell of the
material. After working with each material, it was possible to identify the smell of the latex.
On some of the materials, not Material B, it was possible to add additional water, then wait
for the material to gain the consistency necessary for good bond. This increases the slump
and shrinkage of the repair material, but sometimes it was the only way to make the material
achieve a proper consistency. The high slump material worked well as a scrub coat
(Figure 3.5).
The same basic set-up was used for the Material B as was used for Material A. One
half of a bag was mixed at a time because there was concern that the power drill would not
be able to mix an entire bag. Material B has a longer pot life than Material A, so set time
was not a concern. One thousand eighteen hundred fifty milliliters of water were poured into
a 5-gallon bucket. The cement was added and mixed for approximately 3 minutes. Material
32
Figure 3.5 Worker applying scrub coat with a brush.
B was much darker and thicker than Material A and had a thick oatmeal consistency, whereas
Material A was grittier. As shown in Figure 3.5 the surface of each damaged beam was
dampened and a scrub coat was applied. Without a scrub coat many of the repair materials
did not adhere to damaged section of the beam.
It was possible to apply Material B in 1-in. lifts, as it adhered to the concrete surface
very well. Figure 3.6 shows workers applying a lift of repair material. It was possible to
work with Material B for more than 40 minutes. Because of the longer pot life, better bond,
and higher lifts, there was much less material wasted with Material B than with Material A.
One bag repaired 3 beams and all of the cylinders.
Material C, a two-component repair material, was the third product used in this study.
Instead of adding the aggregate to a given amount of water, the aggregate is added to latex.
33
Figure 3.6 Application of repair Material B.
The manufacturer provides this latex in one-gallon containers. The normal mix ratio was one
gallon of latex per bag of material. Even though Material C was a two part material, the
mixing process was nearly identical to the mixing process of the one-component materials.
Slightly less than half gallon of latex was measured out and poured into a 5-gallong bucket.
It was determined that less latex than recommended by the manufacturer was required
because of the environmental conditions in the laboratory. Half a bag of Material C was
added to the latex in the 5-gallon bucket. This mixture was stirred with a power drill and a
paddle mixer. This material adhered very well to the base concrete, but each lift did not stick
to the previous lift as well as the lifts of other materials stuck to each other. Therefore, it was
not possible to build Material C in lifts as high as some of the other materials. Material C

34
Figure 3.7 Finished patch on a repaired beam specimen.
was applied in three different lifts due to the low build capacity. See Figure 3.7 for a finished
patch.
Material D was the fourth material used and was provided from the same
manufacturer as Material C. Latex could be used instead of water, if the application required
high bond strength. At the time of repair, it was more important to make the repair as easy as
possible, instead of increasing the bond strength, so latex was not used. Material D is more
of a specialty product than Material C and is more difficult to acquire from suppliers. This is
interesting because, solely on the basis of application, this was the best material used in this
project in terms of application. It was possible to apply Material D in up to 1 1/2 in. lifts.
The only problem was that it was extremely sensitive to the water/cement ratio used during
mixing. All of these materials were very sensitive to the mixing process and amount of water

35
added, but Material D was the most sensitive. Both Material C and Material D were
extremely abrasive on the skin. The abrasive agent was probably the latex in both materials.
Workers had to use surgical latex gloves to protect their hands from serious cracking and
chafing.
Material E, the last product used, was more of a cementitious material than the other
materials used. It was more of a light tan or crème color, whereas the other materials were
more of a concrete gray. Material E was not specifically designed for over-head patching
repairs, so the recommended mix ratio on the bag which recommended adding one gallon for
each 55-lb bag was adjusted. This mix ratio was used to try to reach a 5 or 6 in. slump.
From experience with the other repair materials, it was determined that a 5 or 6 in. slump
would be too wet to hand overhead. Initially, 1/3 gallon of tap water was added to half a bag
which resulted in the same consistency as the other materials used. However, this material
dried out as mixing continued, whereas the other materials became more viscous. More
water was added, but the hydration reaction was causing so much head at this point, that the
entire batch setup in the bucket is less than 8 minutes. When the next batch was mixed, 3/4
gallon of ice water was added to 1/2 bag of material. This created a much higher slump mix,
which had a perfect consistency for a scrub coat. The material was too “runny” to apply
overhead for nearly 5 minutes. After 5 minutes, the material started to setup enough to be
applied to the beam. It had a total work time of about 15 minutes, with the first 5 minutes of
waiting included.
Material E had excellent lift capacity and this allowed the entire beam to be repaired
in one lift; it would even stick to you hands if dry. Near the last minute or two of the work
time, Material E became graining and difficult to work. Fortunately, once the material lost

36
the ability to be added to the damaged beam, the material was still plastic enough to be
finished smooth. When dried, Material E was the closes in color to the base concrete as any
of the other materials. It was possible to repair 3 beams with 1 1/2 bags.
3.2.3 Analysis of Flexural Test Specimens
In order to predict the behavior of each repair combination, two different methods
were used. The first method transformed all three materials (base concrete, reinforcing steel,
and repair material) into an equivalent material. Because the dominant material in terms of
are for any beam was the base concrete, all materials were transformed into the base
concrete. J The transformation was based on equivalent modulus of elasticity. Once the
three different materials were transformed, the moment of inertia of the transformed moment
of inertial was calculated. Detailed accounts of the calculations are shown in Appendix A,
and the results of the calculations of both methods are presented in Chapter 4.
Theoretical deflection calculations using Method 1 assume the repair material spans
the entire length of the beam. However, the patch material only spans 18 in. of the 96-in.
total length of the beam. This obviously, is not a very accurate assumption, and thus leads to
the second method of analysis. Method 2 models the beam as two materials (base concrete
and reinforcing steel) instead of the three used in Method 1. This will neglect the repair
material in the deflection calculation, but as will be shown later, this is an acceptable method
for modeling the stiffness of the beam because of the small amount of the repair material in
the beam compared to the base concrete. The only variable in Method 2 from pour to pour is
the compressive strength of the concrete.
Both methods have their flaws. Method 1 over estimates the stiffness of the beams
when the repair material has a higher modulus of elasticity than the base concrete and

37
underestimates the stiffness when the repair material has a lower modulus of elasticity than
the concrete. Due to the small percentage of the beam’s length that has repair material
instead of concrete, it would seem that Method 2 would be a better estimate of beam
stiffness.
In addition to predicting the stiffness of beams repaired with different materials, it
would be informative to have a method to predict the load that causes the beam to crack.
Again there were two methods used to determine the cracking load. Method 1 uses the three-
material model and Method 2 uses the two-material model. The calculations shown in
Appendix A are used to determine the load that causes the beam to crack. At the point on the
load/deflection plot where the beam cracks, the slop changes because the beam decreases in
stiffness due to the decrease in the moment of inertia. The modulus of rupture of the
concrete is used in the cracking moment calculation because it is assumed that the concrete
has a lower modulus. The crack was assumed to be a flexural crack in the repair material and
not a crack in the bond between the concrete beam and the repair material because the bond
strength of the repair material is much stronger than the modulus of rupture of the repair
material. This assumption was verified in the flexural tests. Vertical flexural cracks
appeared before there was any sign of the patch debonding.
3.2.4 Push Out Shear Test
The beams described for the flexural tests were also tested on their sides to test the
pure shear capacity of the patch material. In order to isolate the shear strength of the patch
material, a shear load was applied to the side of the patch. Figure 3.8 shows the test setup for
the push out shear test. The beam was supported at the ends and centerline; Figure 3.9 shows
how the channel supports the beam at the centerline. The support in the vicinity of the

38
Figure 3.8 Push out shear test setup for one beam specimen.
Channel used to support the beam
Shear force along bond between the repair material and the concrete beam
Repair patch
1/2 in. Applied Force
Concrete beam
Figure 3.9 Push out shear test specimen supported at the beam centerline.
loading point coupled with the force applied to the patch subjects the bond between the
concrete beam and the repair material to shear. A 20 kip hydraulic cylinder was used to
apply load to a 12-in. long W6 steel beam whose bottom flange was cut to a 1-in. width
which in turn applied the load to the patch. Care was taken to make sure that the load applied
to the patch was purely vertical to insure that the resulting stresses were purely shear stresses.

39
Actual Profile of patch
18 in.
37.85°
Patch Depth = 1.5 in.
Assumed arc
Arc radius, r Bottom of the patch
Figure 3.10 Assumed geometry of the patch used to calculate the shear area in the push out shear test.
All the patches in the push out shear test were exposed to flexural stresses by
applying a 6,000-pound load at the midpoint of the beam (span length = 96 in.) to simulate
service level loads before they were loaded in the push out shear test.
3.2.5 Analysis of Push Out Shear Test Specimens
As discussed earlier, the damaged area of the concrete is 18 in. long by 1 1/2 in. deep
by 6 in. wide. Each patch was made from the same mold so that the surface roughness and
overall dimensions of each patch was essentially the same. The patch has been modeled
(Figure 3.10) as an arc of a circle in profile to calculate the surface bond area.
r = = 27.75in.
c = 0.017453(r)37.85 = 18.322 in.
As = 18.32*b = 109.93 in2
where
r = radius c = arc length
As = shear area b = beam width = 6 in.
4(1.5)2 + 1 8(1.5)

40
Once the arc length has been calculated, the shear area can be evaluated. The shear area, As,
is the arc length multiplied by the beam width. Using this shear area, neglecting the
roughened surface, it is now possible to calculate the bond strength of each material in the
beam shear test.
3.3 Wedge Cylinder Specimens
In addition to simulating damage in beams, this study tested the shear strength of
cylinder samples to determine the bond strength of the repair materials after freeze/thaw
cycles. Each combination of concrete and repair material was subjected to two different
environments. Once the cylinder cured, six specimens from each repair combination were
placed in a freeze/thaw machine. Three additional cylinders from each repair combination
were tested on the day that the freeze/thaw cycles started. These provided the strengths of
the different repair combinations at zero cycles. Three of the cylinders were removed after
110 cycles and tested in compression. The remaining three cylinders from each repair
combination were removed and tested after 122 cycles. Additionally, three cylinders from
each combination were prepared without a wedge of base concrete. These three cylinders
were used to determine the compressive strength of the repair material alone on day one.
The actual curing time for each repair material differed because samples of each material
were made at different times.
3.3.1 Cylinder Construction
The cylinders were tested in compression using the slant shear test (ASTM C882-91).
The test specifies that the cylinders used should have a diagonally cast bonding area at a 30-
degree angle from vertical. Four racks (see Figure 3.11) were built to keep the cylinders at a
30-degree angle from vertical. Each rack was built with a7 in. wide, 8 ft long piece of 1/2 in.

41
Cylinder
6.0 in.
30°
3/8 in.
1.5 in.
3.0 in.
2 x 4
2 x 6
Plywood
1/2 in.
Figure 3.11 Cylinder stand used to make the wedge cylinder samples.
plywood, an 8 ft long 2 x 4, and a 2 ft long 2 x 6. The 2 x 4s were nailed to the plywood with
the 3 1/2-in. sides perpendicular to the face of the plywood. One corner of the 2 x 6 was
beveled at a 30-degreee angle from the vertical so that the plywood could be nailed to it.
Each of the concrete cylinders was rested with the circular face on the 2 x 4 so that the
cylinder made an angle of 30-degrees from the vertical. The cylinders were 3-in. in diameter
and 6-in. tall. The wedges were made in the fifty concrete pour, and the original empty
cylinders were cut with a band saw. All 90 of the cylinders were placed on the four racks.
Prior to casting the cylinders, air and slump tests were performed on the concrete. After the
tests showed that there was sufficient air entrainment (5.2%), concrete was placed in the
wedge shaped cylinders, and extra concrete was screeded off with a trowel. Striking the
corner of the cylinder on the ground while keeping the cut surface horizontal consolidated the
concrete in the cylinder. Once the concrete had been consolidated, the surfaces were scored

42
Figure 3.12 Wedge cylinder sample bonding surface.
with a trowel to simulate the roughened surface of a damaged beam. A waffle type pattern
(cylinder on the right in Figure 3.12) was scored into the future bond surface with the edge of
a concrete trowel. Workers tried to keep the grooves as uniform as possible from wedge to
wedge. The hardest part of the etching process was etching the feathered end of the wedge.
When large pieces of aggregate were in the feathered end, they were removed and the entire
process was repeated. The lack of aggregate near the feathered end of the wedge may cause
the feathered end of the wedge to be weak. To eliminate this variable in the local strength of
the wedge samples, the repaired cylinders were placed in the test machine with the concrete
wedge at the bottom and the repair material wedge at the top. The cylinders were covered
with visqueen and cured in the laboratory for one week. The first repair cylinders were made
25 days after casting the wedges.
43
3.3.2 Addition of Repair Material to Wedges
When it was time to add repair material to the concrete wedges, the wedges were
removed from the wedge shaped plastic forms by slicing the plastic form away from the
cylinder. After the concrete wedge was removed, it was placed in a new full cylinder. While
each specific repair material was being used to repair the beams, one worker placed the repair
material in the cylinder. The cylinders and the beams were repaired with the same batch of
repair material so that the repair material used in the beams and the cylinders would have the
same material properties. The only time that a repair material was prepared differently for
the beams and the cylinders was when Material E was used. Material E hardened so quickly,
even with the addition of cold water, that it was thought that the material would setup before
it could be placed. Therefore, a batch of Material E was mixed specifically to repair the
beams and a separate batch was mixed to repair the wedge cylinders.
3.3.3 Cylinder Test Analysis
Three full cylinders and three wedge cylinders of each repair material were tested in
axial compression at day zero, to test the initial compressive strength. Six cylinders of each
repair combination were then subjected to 110-freeze/thaw cycles. The freeze/thaw test was
originally intended to go for 200-freeze/thaw cycles. Upon visual inspection of the cylinders
at 110 cycles it was observed that the cylinders were starting to degrade. To ensure that the
cylinders did not disintegrate in the test machine, a decision was made to remove the
cylinders after 110 cycles.
A 2 in. x 6 in. cylinder has a cross-sectional area of 7.1 in2. A repaired wedge
cylinder (see Figure 3.13) has the same cross-section as the full cylinder and the surface area
of the interface between the repair material and base concrete is 14.1 in2. ASTM 666 C
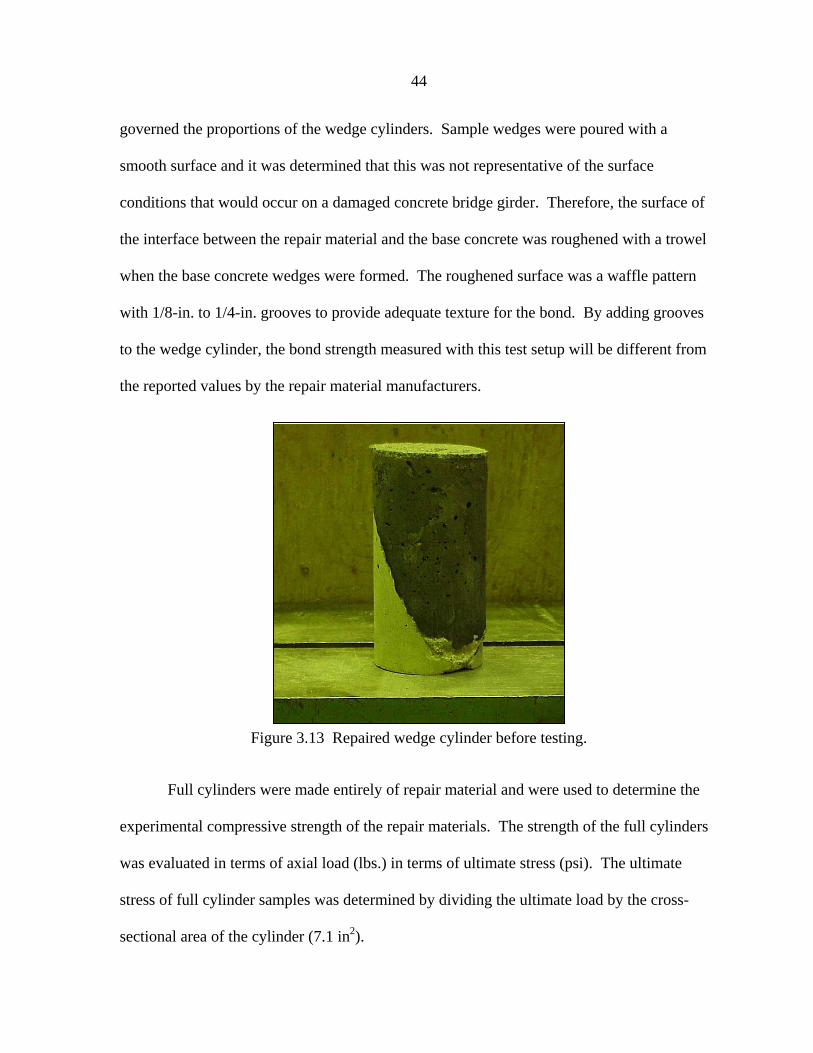
44
Figure 3.13 Repaired wedge cylinder before testing.
governed the proportions of the wedge cylinders. Sample wedges were poured with a
smooth surface and it was determined that this was not representative of the surface
conditions that would occur on a damaged concrete bridge girder. Therefore, the surface of
the interface between the repair material and the base concrete was roughened with a trowel
when the base concrete wedges were formed. The roughened surface was a waffle pattern
with 1/8-in. to 1/4-in. grooves to provide adequate texture for the bond. By adding grooves
to the wedge cylinder, the bond strength measured with this test setup will be different from
the reported values by the repair material manufacturers.
Full cylinders were made entirely of repair material and were used to determine the
experimental compressive strength of the repair materials. The strength of the full cylinders
was evaluated in terms of axial load (lbs.) in terms of ultimate stress (psi). The ultimate
stress of full cylinder samples was determined by dividing the ultimate load by the cross-
sectional area of the cylinder (7.1 in2).

45
Shear cylinders were made of a combination of repair material and concrete. The
concrete used for every shear cylinder was from the pour five (fc’ = 6,070 psi at 60 days, 5.5
in. slump and 5.2% air entrainment). The failure stresses were calculated by dividing the
ultimate load by the appropriate cylinder area. When the failure was purely compressive, the
area used was the cross-section perpendicular to the applied load (7.1 in2). When the failure
was a shear type failure, the failure occurred along the line between the concrete and the
repair material. The area used to determine the bond shear stress along the bond line is 14.2
in2.

47
4. TEST RESULTS
4.1 Beam Specimen Flexural Test
The flexural test portion of this study was performed to evaluate the performance of
repair materials used to repair damaged concrete beams. The repair materials that were
selected had various compressive strengths, modulus of elasticities, and bond strengths.
4.1.1 Load/Deflection Plot Information
Typical load/deflection plots for Materials A-E are shown in Figures 4.1a-f,
respectively. Each individual plot has three lines. One line shows the average experimental
load/deflection behavior of the three repaired beams tested for each repair material. The
other two lines are the predicted load/deflection results based on Method 1 (beams with three
materials) and Method 2 (beam with two materials), respectively, which were discussed in
Chapter 3. Figure 4.1f shows the load/deflection behavior for an unrepaired beam, which
will be referred to as the control beam. Table 4.1 presents a comparison of the moments of
inertia calculated using Methods 1 and 2. This table shows that the moment of inertia of each
beam/repair system does not vary much between the two methods (i.e. M2/M1 ratio close to
one for all materials). This is significant because it means that the repaired beams can be
analyzed with standard reinforced concrete elastic analysis techniques.
The load/deflection plots for every repair material and control beams show classic
reinforced concrete (R/C) behavior. There are two regions of behavior; the first region
shows the uncracked behavior of the beams. In the first region, the beams have not cracked,
and the deflection is inversely proportional to the uncracked moment of inertia. At the
cracking load, Pcr, and corresponding cracking moment, Mcr, which causes the extreme

48
0
5
10
15
0 0.1 0.2 0.3 0.4
Deflection, in.
Load
, kip
s
Material B Averag eMetho d 2Metho d 1
0
5
10
15
0 0.1 0.2 0.3 0.4
Deflection, in.
Load
, kip
s
Ma t e ria l A Ave ra ge
Met hod 2
Met hod 1
a.) Material A
b.) Material B
Figure 4.1 Theoretical load/deflection vs. experimental load/deflection plots for the various repair materials.

49
0
5
10
15
0 0.1 0.2 0.3 0.4Deflection, in.
Load
, kip
s
Material C AverageMethod 2Method 1
c.) Material C
0
5
10
15
0 0.1 0.2 0.3 0.4Deflection, in.
Load
, kip
s
Ma t e ria l D Ave ra ge
Me t hod 2
Me t hod 1
d.) Material D
Figure 4.1 continued.

50
0
5
10
15
0 0.1 0.2 0.3 0.4
Deflection, in.
Load
, kip
s
Ma t e r ia l E Ave ra ge
Me t hod 2
Me t hod 1
e.) Material E
0
5
10
15
0 0.1 0.2 0.3 0.4
Deflection, in.
Load
, kip
s
Co ntro l AverageMetho d 2
f.) Control Beam
Figure 4.1 continued.

51
Method 1 (M1) Method 2 (M2)A 744 862 1.16B 914 862 0.94C 887 863 0.97D 840 858 1.02E 842 857 1.02
Moment of Inertia (in4)Material
Ratio M2/M1
Table 4.1 Comparison of moments of inertia determined using Method 1 and Method 2 used to calculate deflections in the repaired beams.
fibers to reach their modulus of rupture, fr, the beam cracks. When the beam cracks, the
moment of inertia decreases due to the loss of effective section, and the beam is not as stiff.
Therefore, the slope of the load/deflection plot decreases after the beam has cracked.
The information shown in the load/deflection plots was used to predict the behavior of beams
repaired with different repair materials. Both methods, Method 1 and Method 2, seem to do
well at predicting the cracking load. When the modulus of elasticity of the repair material is
close to the modulus of elasticity of the concrete, the gross moment of inertia is very similar
in the two methods. The cracking loads are also very close when the repair material and the
concrete have similar moduli of elasticity.
The moments of inertia based on Method 1 and Method 2 respectively, theoretical
ultimate load, theoretical cracking load, and theoretical deflection at the cracking load, are
presented in Appendix A. The ultimate load for each beam with two point loads applied at
each third-point, based on strength analysis, is 6.7 kips. This corresponds to a service level
load of 3.9 kips using the American Concrete Institute (ACI) live load factor of 1.7. The
load/deflection plots presented in Figure 4.1 show the total load applied to each beam, or
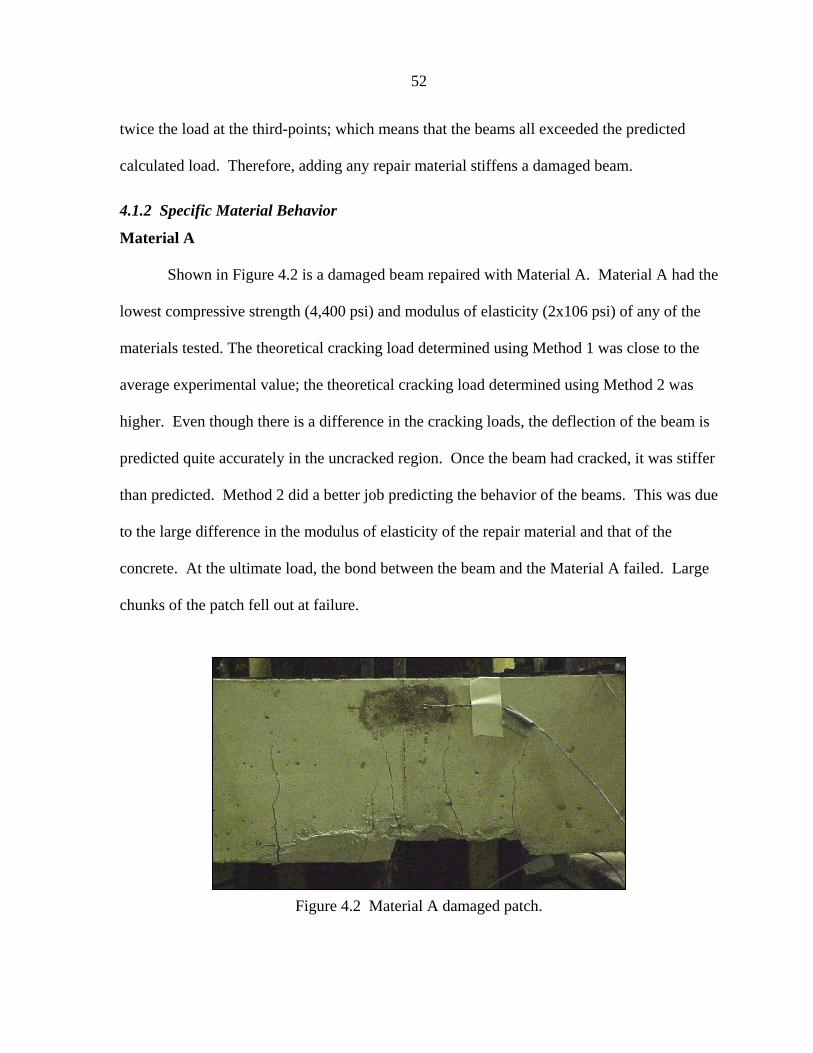
52
Figure 4.2 Material A damaged patch.
twice the load at the third-points; which means that the beams all exceeded the predicted
calculated load. Therefore, adding any repair material stiffens a damaged beam.
4.1.2 Specific Material Behavior
Material A
Shown in Figure 4.2 is a damaged beam repaired with Material A. Material A had the
lowest compressive strength (4,400 psi) and modulus of elasticity (2x10⁶ psi) of any of the
materials tested. The theoretical cracking load determined using Method 1 was close to the
average experimental value; the theoretical cracking load determined using Method 2 was
higher. Even though there is a difference in the cracking loads, the deflection of the beam is
predicted quite accurately in the uncracked region. Once the beam had cracked, it was stiffer
than predicted. Method 2 did a better job predicting the behavior of the beams. This was due
to the large difference in the modulus of elasticity of the repair material and that of the
concrete. At the ultimate load, the bond between the beam and the Material A failed. Large
chunks of the patch fell out at failure.

53
Figure 4.3 Material C patch at ultimate load showing the failure at the patch ends.
Material B
Material B was the stiffest material, and it also had the highest compressive strength
(12,340 psi). The load/deflection behavior (Figure 4.1b) is predicted well by both methods.
Even though the repair material has a compressive strength three times that of the concrete,
the modulus of elasticity is not as high proportionally. Because the models for
load/deflection behavior are not based on compressive strength, but based on modulus of
elasticity, they predict beam behavior well. Like for Material A, the cracked beam was
stiffer than predicted. Material B remained attached to the beam better at ultimate load than
Material A. There were large cracks, some debonding, but no pieces of the patch fell out.
The failure was along the bond line and not in the repair material.
Material C
Material C had approximately the same modulus of elasticity as the concrete it was
used to repair. Figure 4.3 presents a typical patch failure with Material C. Due to the
similarity in the modulus of elasticities of the repair and the damaged concrete beam,
deflections calculated using the two methods were nearly identical. Both methods also
predict the actual behavior very well. Like other materials, the cracked behavior was stiffer

54
Figure 4.4 Complete Material D patch failure.
than predicted by both methods. Unlike the other repair materials, chunks of Material C fell
out at the ends of the patch.
Material D
Again the modulus of elasticity of the repair material was nearly identical to that of
the concrete repaired, and the behavior, both cracking load and uncracked stiffness, were
predicted very well by both methods. Shown in Figure 4.4 is the complete patch failure.
Material D fell off of the beam at a lower load than other repair materials. The failure was
along the interface and there was little to no warning. Unfortunately, all Material D patches
failed similarly.
Material E
Material E has a modulus of elasticity closest to that of the repaired concrete of any of
the repair materials. Because of this similarity, Method 1 and Method 2 give results that are
nearly identical. However, both methods overestimate the cracking load of the beam, which
was common in all repair combinations. The cracking behavior of concrete is difficult to
predict due to the heterogeneous nature of the material. However, the cracking load

55
Figure 4.5 Material E patch failure along the bond line.
determined by Method 2, is within 10% of the actual value. Material E debonded from the
beam at ultimate load easier than the other repair materials. Like many of the Material D
patches, the patches fell out of the beam very cleanly. The other repair materials would fall
out of the beams after a light tapping with a hammer. The Material E patches would often
fall out at a relatively low load. Twice the patch fell out before the reinforcement in the
beam yielded. A typical Material E patch failure is shown in Figure 4.5.
4.2 Beam Specimen Shear Test
Every patch sheared from the damaged section in the concrete beam very cleanly. In
most cases, there was little concrete removed from the beam or very little repair material still
attached to the beam. If there was any concrete removed, it tended to be on the bottom of the
beam along the line between the beam and the patch. While observing the tests in which the
patches had concrete attached at failure, it was very apparent that there was some prying of
the patch away from the beam instead of “pure” shear. The prying action of the force created
tension stresses at the top of the patch and compressive stresses at the bottom of the patch.
Since concrete shear failures are essentially tensile in nature, there was sufficient net

56
compressive stress at the bond interface to eliminate the shear failure at the bond interface
and cause a shear failure in the base concrete.
Ultimate failure loads for each material tested in the push out shear test are presented
in Figure 4.6; an average ultimate failure load for each material is presented in Figure 4.6f.
The three values given for each material (in Figures 4.6a to 4.6e) show the results of the
individual push out shear tests.
The shear strength of each of the repair materials determined by the test performed in
this study are presented in Figure 4.7; it is obvious that all of the repair materials performed
much better than the plain concrete. Materials A, C, and D all had very similar shear
strength, while Material E had the highest. Material B is not included in this test because the
testing frame was damaged during the process of testing the Material B samples. The shear
stress presented in Figure 4.7 is calculated by dividing the average shear load in Figure 4.6f
by the shear area determined in Chapter 3. Because all of the beams used in the test were
constructed with patches cast from the same form, the shear area in each beam is essentially
the same. This means that the only variable that changes from test to test is the shear
strength of the material. The test used was very different from any test used by manufacturers
to report shear strength (see Table 3.1). The test used is a better indication of patch behavior
because the test setup is more like the conditions the patch would experience in service if a
lateral load accidentally struck it.
4.3 Wedge Cylinder Zero Freeze/Thaw Cycle Test Results
The results of the cylinder specimen tests at zero freeze/thaw cycles, and the control
values used in this report are presented in Table 4.2. The first column in Table 4.2 presents
the material type, the second column lists the age of the specimen when tested, the third

57
6,360 5,490 4,890
0
3,000
6,000
9,000
12,000
1 2 3
Beam
Load
, lbs
.
a.) Material A
5,970 6,150 6,110
0
3,000
6,000
9,000
12,000
1 2 3
Beam
Load
, lbs
.
b.) Material C
Figure 4.6 Failure load results for the push out shear tests.
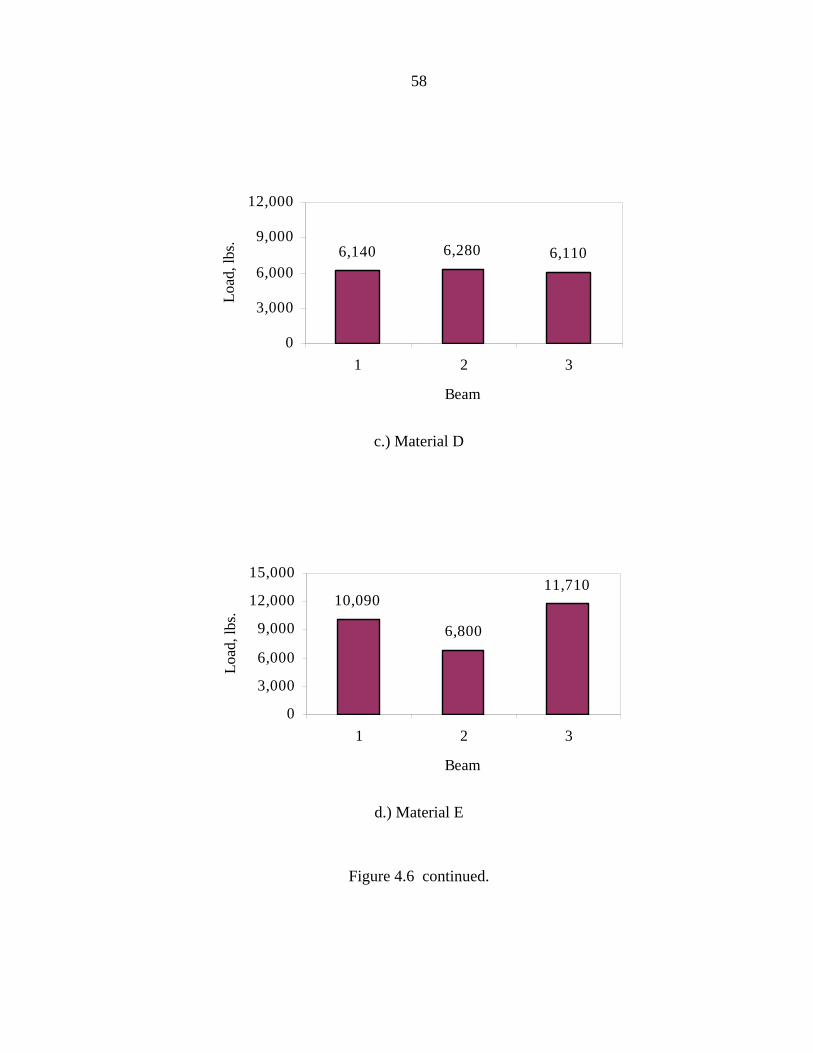
58
6,140 6,280 6,110
0
3,000
6,000
9,000
12,000
1 2 3
Beam
Load
, lbs
.
c.) Material D
10,090
6,800
11,710
0
3,000
6,000
9,000
12,000
15,000
1 2 3
Beam
Load
, lbs
.
d.) Material E
Figure 4.6 continued.

59
1,900 1,620 2,430
0
3,000
6,000
9,000
12,000
1 2 3
Beam
Load
, lbs
.
e.) Plain concrete
1,980
5,580 6,080 6,180
9,530
0
3,000
6,000
9,000
12,000
Concrete A C D E
Material
Load
, lbs
.
f.) Average beam shear load
Figure 4.6 continued.
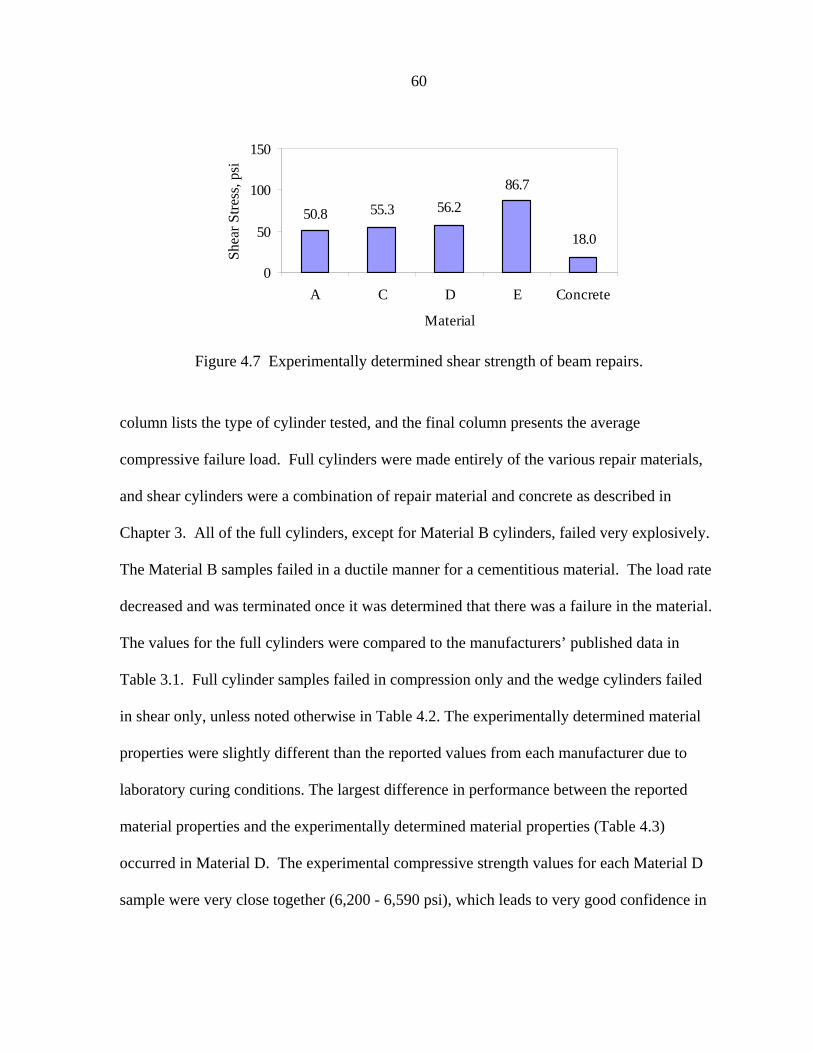
60
18.0
86.756.255.350.8
0
50
100
150
A C D E Concrete
Material
Shea
r Stre
ss, p
si
Figure 4.7 Experimentally determined shear strength of beam repairs.
column lists the type of cylinder tested, and the final column presents the average
compressive failure load. Full cylinders were made entirely of the various repair materials,
and shear cylinders were a combination of repair material and concrete as described in
Chapter 3. All of the full cylinders, except for Material B cylinders, failed very explosively.
The Material B samples failed in a ductile manner for a cementitious material. The load rate
decreased and was terminated once it was determined that there was a failure in the material.
The values for the full cylinders were compared to the manufacturers’ published data in
Table 3.1. Full cylinder samples failed in compression only and the wedge cylinders failed
in shear only, unless noted otherwise in Table 4.2. The experimentally determined material
properties were slightly different than the reported values from each manufacturer due to
laboratory curing conditions. The largest difference in performance between the reported
material properties and the experimentally determined material properties (Table 4.3)
occurred in Material D. The experimental compressive strength values for each Material D
sample were very close together (6,200 - 6,590 psi), which leads to very good confidence in

61
Material Type
Repair Material Age
(days)
Type of Cylinder
Average Failure
Load (lbs)
A 38 Full 31108 (C)A 38 Shear 27570 (S)B 31 Full 87670 (C)
B 31 Shear 33,940 (C) 34,780 (S)
C 23 Full 42420 (C)
C 23 Shear 38,670 (C) 35,070 (S)
D 15 Full 44970 (C)D 15 Shear 69140 (S)E 14 Full 53870 (C)E 14 Shear 40720 (S)
Table 4.2 Summary of experimental wedge cylinder failures.
(C) denotes compressive failure (S) denotes shear failure
Material
Experimental Coimpressive
Strengths (psi)
Reported Compressive
Strengths (psi)
% Difference
A 4,400 5,000 -12.0B 12,400 11,000 12.7C 6,000 7,000 -14.3D 6,360 5,000 27.2E 7,620 7,400 3.0
Table 4.3 Comparison of experimentally determined compressive strengths and reported compressive strengths.

62
the experimental values. Because of the difference in the reported and experimental values,
the experimental values will be used for the calculations in this report. The most important
information in the zero cycle cylinder data is the strength of the wedge samples. With no
exposure to freeze/thaw cycles, most of the cylinders failed in compression, with a few
exceptions. However, all of the Material E cylinders and one of the Material B cylinders
failed in shear. The one Material B sample that failed in shear was not properly consolidated
into the bottom of the wedge. When the repair material was not properly consolidated into
the bottom of the wedge, the effective shear area was decreased. Because the shear area of
this sample was less than that of the other samples used, it had less shear capacity. Even
though this sample was slightly different than the other samples, the information gathered
from this sample was still used in the study. Due to the small defect in this particular sample,
it is justifiable to use it in this study.
4.4 Wedge Cylinder 110 Freeze/Thaw Cycle Results
Table 4.4 presents the results of the 110 freeze/thaw cycle test results, while Figures
4.8 and 4.9 show typical freeze/thaw specimen compressive failures and shear failures,
respectively. The modulus of elasticity and coefficient of thermal expansion values shown in
Table 4.4 were reported by the manufacturers. The experimental information reported is in
terms of failure load and failure stress. The failure load is useful because it is independent of
failure mode. Failure stress is important because each manufacturer reports bond stress in
their product information.
Material A
All of the cylinders used in the 110-freeze/thaw cycle tests are the wedge type
cylinders. Shown in Figure 4.10 are the failure loads for the six Material A cylinders. The
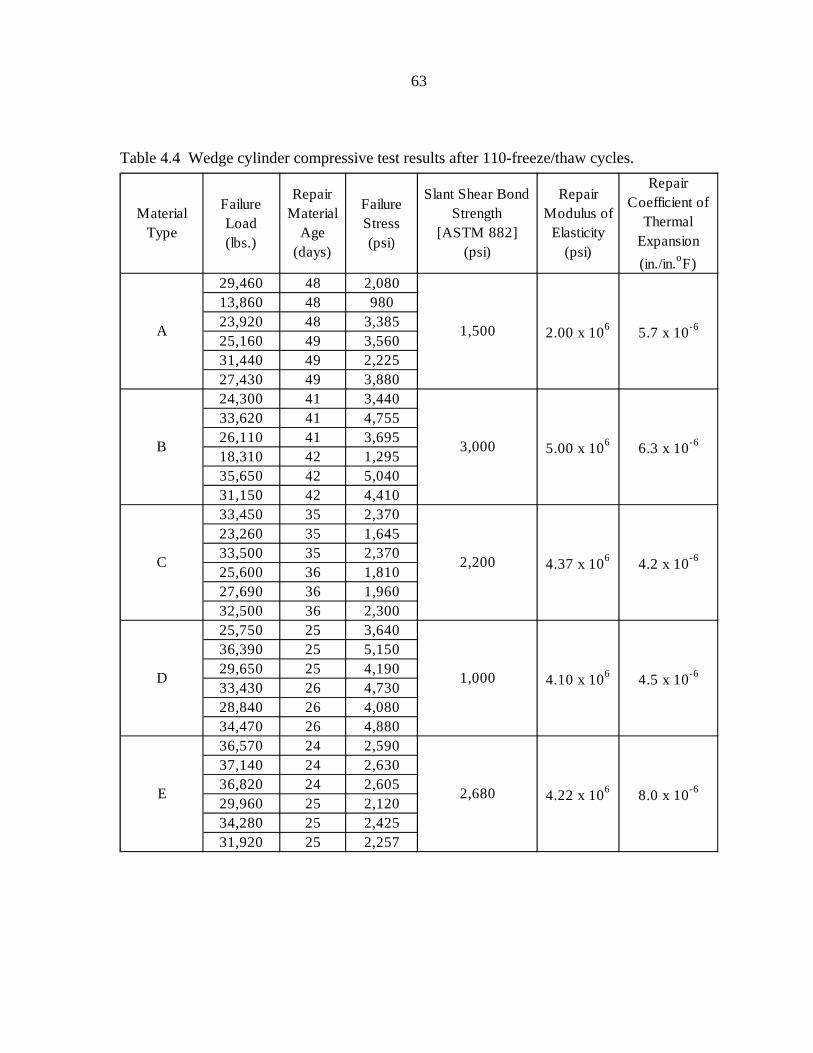
63
Material Type
Failure Load (lbs.)
Repair Material
Age (days)
Failure Stress (psi)
Slant Shear Bond Strength
[ASTM 882] (psi)
Repair Modulus of
Elasticity (psi)
Repair Coefficient of
Thermal Expansion (in./in.oF)
29,460 48 2,08013,860 48 98023,920 48 3,38525,160 49 3,56031,440 49 2,22527,430 49 3,88024,300 41 3,44033,620 41 4,75526,110 41 3,69518,310 42 1,29535,650 42 5,04031,150 42 4,41033,450 35 2,37023,260 35 1,64533,500 35 2,37025,600 36 1,81027,690 36 1,96032,500 36 2,30025,750 25 3,64036,390 25 5,15029,650 25 4,19033,430 26 4,73028,840 26 4,08034,470 26 4,88036,570 24 2,59037,140 24 2,63036,820 24 2,60529,960 25 2,12034,280 25 2,42531,920 25 2,257
2,680
1,500
3,000
2,200
4.22 x 10⁶
2.00 x 10⁶ 5.7 x 10⁻⁶
6.3 x 10⁻⁶
4.5 x 10⁻⁶
8.0 x 10⁻⁶
5.00 x 10⁶
4.37 x 10⁶
4.10 x 10⁶
4.2 x 10⁻⁶
1,000
E
A
B
C
D
Table 4.4 Wedge cylinder compressive test results after 110-freeze/thaw cycles.

64
Figure 4.8 Typical compressive wedge cylinder failure.
Figure 4.9 Typical shear wedge cylinder failure.
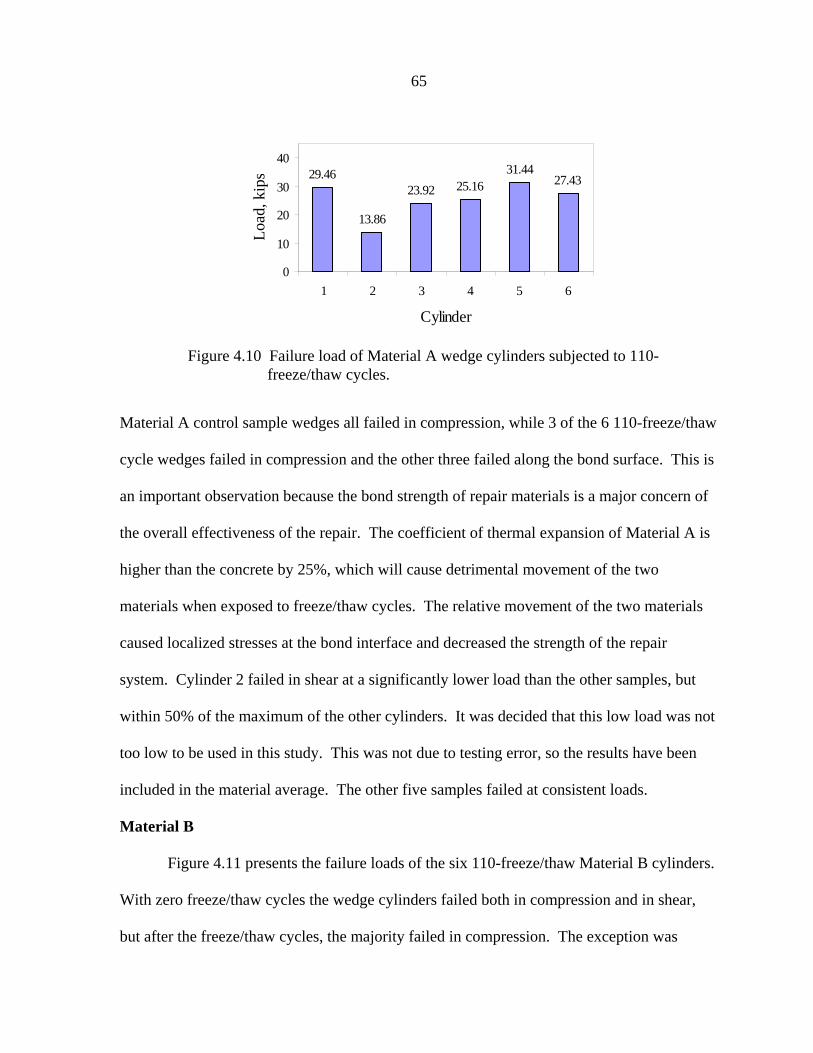
65
29.46
13.86
23.92 25.1631.44
27.43
0
10
20
30
40
1 2 3 4 5 6
Cylinder
Load
, kip
s
Figure 4.10 Failure load of Material A wedge cylinders subjected to 110-freeze/thaw cycles.
Material A control sample wedges all failed in compression, while 3 of the 6 110-freeze/thaw
cycle wedges failed in compression and the other three failed along the bond surface. This is
an important observation because the bond strength of repair materials is a major concern of
the overall effectiveness of the repair. The coefficient of thermal expansion of Material A is
higher than the concrete by 25%, which will cause detrimental movement of the two
materials when exposed to freeze/thaw cycles. The relative movement of the two materials
caused localized stresses at the bond interface and decreased the strength of the repair
system. Cylinder 2 failed in shear at a significantly lower load than the other samples, but
within 50% of the maximum of the other cylinders. It was decided that this low load was not
too low to be used in this study. This was not due to testing error, so the results have been
included in the material average. The other five samples failed at consistent loads.
Material B
Figure 4.11 presents the failure loads of the six 110-freeze/thaw Material B cylinders.
With zero freeze/thaw cycles the wedge cylinders failed both in compression and in shear,
but after the freeze/thaw cycles, the majority failed in compression. The exception was

66
24.30
33.62
26.11
18.31
35.6531.15
0
10
20
30
40
1 2 3 4 5 6
Cylinder
Load
, kip
s
Figure 4.11 Failure load of Material B wedge cylinders subjected to 110-freeze/thaw cycles.
Cylinder 4, which failed in shear at a lower load than the other cylinders. The cylinders that
failed in compression failed in the base concrete rather than in the repair material. The base
concrete was very brittle and was easy to pick apart by hand because of the freeze/thaw
cycles. Unfortunately, it is difficult to comment on the performance of Material B with
freeze/thaw cycles due to the deterioration of the base concrete. The only conclusion that
could be made was that the repair material was more durable than the base concrete. All that
can be asked of the repair material is to perform as well as the concrete that it repairs.
Material C
Figure 4.12 presents the failure loads for the six 110-freeze/thaw Material C
cylinders. All of the 110-freeze/thaw cycle samples failed in shear along the bond plane and
at reasonably similar loads. The material has a coefficient of thermal expansion similar to
the base concrete, which minimizes stresses along the bond plane during freeze/thaw cycles.
Material D
Figure 4.13 presents the results of the six 110-freeze/thaw Material D cylinders. All
of the wedges in the 110-freeze/thaw cycle tests, like the zero-freeze/thaw cycle tests, failed

67
33.45
23.26
33.50
25.60 27.6932.50
0
10
20
30
40
1 2 3 4 5 6
Cylinder
Load
, kip
s
Figure 4.12 Failure load of Material C wedge cylinders subjected to 110-freeze/thaw cycles.
Figure 4.13 Failure load of Material D wedge cylinders subjected to 110-freeze/thaw cycles.
25.75
36.3929.65
33.4328.84
34.47
0
10
20
30
40
1 2 3 4 5 6
Cylinder
Load
, kip
s
in compression. Some failures occurred in the base concrete while others occurred in the
repair material, but no failures occurred along the bond line. This observation is interesting
because according to the reported manufacturers’ information, the bond strength of Material
D is the lowest of any of the materials used in this investigation.

68
Material E
Figure 4.14 presents the results of the six 110-freeze/thaw Material E cylinders, and
shows that the failure loads are very similar. Every sample failed cleanly in shear along the
bond line with essentially no repair material remaining on the wedge after failure. There was
no deterioration in the base concrete, so all of the decrease in cylinder strength from the zero
freeze/thaw cycle cylinders to the 110-freeze/thaw cylinders was due to a decrease in the
bond strength.
Shown in Figure 4.15 is the decrease in average cylinder strengths for the various
repair materials due to the freeze/thaw cycles. This figure does not indicate the type of
failure in the cylinders (i.e. compression or shear). From the discussion of each material, it
was apparent that freeze/thaw cycles did not change the failure mode in a manner that affects
the average values, so both the shear and compressive failures are included in the average
failure values presented in Figure 4.15. Deterioration of the base concrete was more of a
factor than failure mode. Base concrete deterioration was a particular concern with Materials
B and D. It is apparent from Table 4.5 that Material A performed the best when subjected to
freeze/thaw cycles and Material C performed the worst. The percentage decreases are all
relative to the initial experimental strength of the individual repair materials.
4.5 Discussion of Test Results
4.5.1 Flexural Test
In Table 4.6, a relative ranking has been assigned to the experimentally determined
material properties evaluated in this study. The rating applied to each material in the bond
strength column is based purely on the experimentally determined bond strength values, and
is not related to the durability of the material. The application rating column in Table 4.6 is a

69
36.57 37.14 36.82
29.9634.28 31.92
0
10
20
30
40
1 2 3 4 5 6
Cylinder
Load
, kip
s
Figure 4.14 Failure load of Material E wedge cylinders subjected to 110-freeze/thaw cycles.
27.5 34
.5
36.3
34.6 40
.7
25.2 28.2
29.3
31.4 34.5
0
20
40
60
80
A B C D E
Repair Material
Load
, kip
s Failure Load Zero Cycles
Failure Load 110 Cycles
Figure 4.15 Comparison of average wedge cylinder failure loads initially and after freeze/thaw cycles.
Material % DecreaseA 8.40B 18.20C 19.20D 9.10E 15.40
Table 4.5 Decrease in wedge cylinder strength due to 110-freeze/thaw cycles.
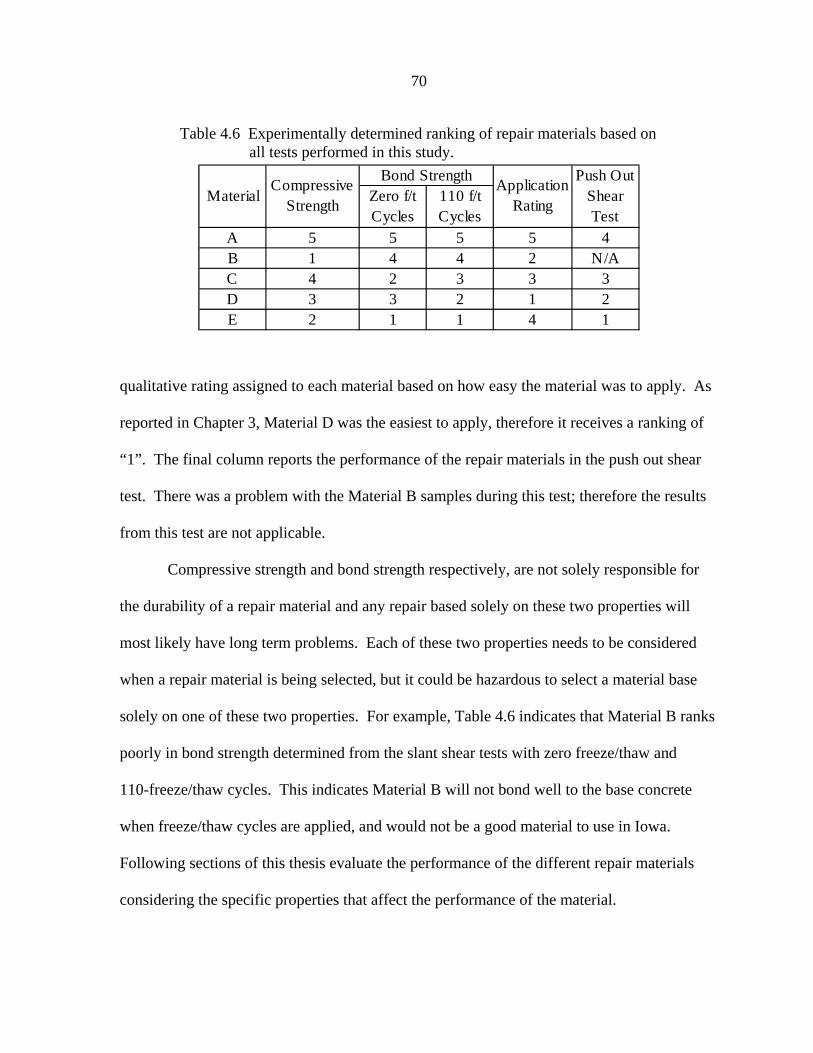
70
Zero f/t Cycles
110 f/t Cycles
A 5 5 5 5 4B 1 4 4 2 N/AC 4 2 3 3 3D 3 3 2 1 2E 2 1 1 4 1
Push Out Shear Test
Compressive Strength
Bond StrengthMaterial
Application Rating
Table 4.6 Experimentally determined ranking of repair materials based on all tests performed in this study.
qualitative rating assigned to each material based on how easy the material was to apply. As
reported in Chapter 3, Material D was the easiest to apply, therefore it receives a ranking of
“1”. The final column reports the performance of the repair materials in the push out shear
test. There was a problem with the Material B samples during this test; therefore the results
from this test are not applicable.
Compressive strength and bond strength respectively, are not solely responsible for
the durability of a repair material and any repair based solely on these two properties will
most likely have long term problems. Each of these two properties needs to be considered
when a repair material is being selected, but it could be hazardous to select a material base
solely on one of these two properties. For example, Table 4.6 indicates that Material B ranks
poorly in bond strength determined from the slant shear tests with zero freeze/thaw and
110-freeze/thaw cycles. This indicates Material B will not bond well to the base concrete
when freeze/thaw cycles are applied, and would not be a good material to use in Iowa.
Following sections of this thesis evaluate the performance of the different repair materials
considering the specific properties that affect the performance of the material.

71
A 3.92 4.80 0.82 4B 4.50 4.80 0.94 1C 2.99 4.72 0.63 5D 4.50 5.25 0.86 2E 4.50 5.34 0.84 3
Theoretical Cracking Load
(kips) Material
Experimental Average Cracking
Load (kips)
RankingPexp/Ptheo
Table 4.7 Repair material rankings based on predicted flexural cracking load.
Load/deflection behavior was discussed in the Beam Results section of this report and
a method for modeling a repaired beam was proposed. Table 4.7 shows the results of the
theoretical cracking load calculation versus the actual cracking load.
Theoretical cracking loads shown in Table 4.7 are based on the two material beam
(Method 2). Relative scores listed in the last column are based on the effectiveness of the
theoretical model to predict the cracking load of the beam. The ability to predict the cracking
load is an important consideration for engineers when repairing a concrete beam. When a
beam cracks, water and contaminants are able to migrate into the beam. If the water contains
chlorides, corrosion of the reinforcement can be accelerated beyond that of an uncracked
beam, which leads to loss of reinforcement area and debonding of the reinforcement. Even if
the water is not corrosive, it still poses a problem for the beam. If the beam is in a cold
climate, the water can freeze. When the water freezes, it expands and can cause serious
damage to the concrete.
Cracking load calculations, based on flexural stresses, are shown in Appendix A and
discussed previously in this chapter. Load/deflection behavior is a function of the depth of
the neutral axis, the modulus of rupture of the concrete, and the gross moment of inertia of

72
the repaired beam. Both the gross moment of inertia and the depth of the neutral axis are a
function of the modular ratio (Er/Ec); where Er is the modulus of elasticity of the repair
material, and Ec is the modulus of elasticity of the concrete. In order to understand why each
beam/repair material system behaves the way it does, it is useful to look at the relative ratios
of the modulus of elasticity of the repair materials and base concrete. Table 4.7 shows that
the experimentally determined cracking load for Material B is closest to the predicted value
and the experimentally determined cracking load for Material C is the farthest from the
predicted cracking load. This comparison is valid because the theoretical analysis used to
determine the cracking load was very close to the experimental cracking load as seen in
Figure 4.1a-e. If the only variable used to predict the cracking load is the ratio of the
modulus of elasticity of the repair material to the modulus of elasticity of the base concrete
(Table 4.8), it makes sense that the prediction of the cracking load is related to the modular
ratio. Table 4.8 (pour 3 was only used for the control beams) also indicates that the modular
ratio for Material B is the highest (1.24) and the modular ratio for Material A is the lowest
(.50). As the modular ratio decreases so does the ability of Method 2 to accurately predict
the cracking load. The exception is Material C. It cracks at a load much lower than
predicted. This was because there were several shrinkage cracks in the repair material before
the flexural tests started. These shrinkage cracks decrease the structural depth of the beam,
so the actual structural depth of the beam is less than the depth assumed in the model. When
the structural depth is smaller than that assumed in the theoretical model, the experimental
data are skewed. The beam is less stiff (more deflection with equal load) and cracks sooner.
This explanation is validated by Figure 4.1c. The slope of the load/deflection curve of
Material C is less than the slope predicted and the cracking load is much less than predicted.

73
A 2.00 1 4.03 0.50B 5.00 1 4.03 1.24C 4.37 2 3.95 1.11D 4.10 5 4.52 0.91E 4.22 4 4.45 0.95
Er/EcMaterialMaterial,
Er 106
(psi)
Concrete Pour
Concrete, Ec 106
(psi)
Table 4.8 Summary of ratio of modulus of elasticity of repair material to the modulus of elasticity of the base concrete.
The other materials follow the trend that varies with the modular ratio. One assumption in
this method for predicting the cracking load is that the concrete cracks before the repair
material cracks. Based purely on the simple ACI equation (fr = modulus of rupture in psi,
f’c = 28 day compressive strength in psi):
'cr f7.5f =
the modulus of rupture of the repair materials would be higher than the concrete since many
of the repair materials have additives that increase the tensile strength of the material, which
are not included in the ACI modulus of rupture relation. Other important data taken from the
flexural tests are the load/deflection curves of the repaired beams. Of particular interest is
the portion of the behavior of the beam in the uncracked region. Once the beam cracks, the
portion of the concrete in tension is obviously no longer effective structurally. In the tests
performed in this study, the patch was in the tension portion of the beam. Therefore, it does
not affect the behavior of the beams once the beam cracks. The best way to evaluate the
performance of the repair materials with respect to load/deflection behavior is to relate the
slope of the experimental load/deflection curves to the predicted load/deflection slopes (see

74
MaterialExperimental
Slope, Sexp
(lbs/in)
Theoretical Slope, Stheo
(lbs/in)Sexp/Stheo Rank
A 74,070 110,680 0.669 5B 98,180 110,680 0.887 1C 79,040 108,565 0.728 4D 94,880 121,570 0.78 2E 94,120 123,430 0.763 3
Table 4.9 Comparison of experimental and theoretical uncracked load/deflection slopes.
Table 4.9). It does not make sense to compare the stiffness of beams repaired with different
repair materials because the base concrete does not have the same strength. The theoretical
slopes of the load/deflection plots are based on theoretical behavior of a beam of two
materials (Method 2). Slopes are calculated by dividing the cracking load by the deflection
at the cracking load. Rankings are assigned to each material based on the ability of the
theoretical method to predict actual behavior. Material B’s load/deflection behavior in the
uncracked region of the load/deflection behavior is closest to the expected behavior, and was
ranked “1”. Material A was ranked “5” because its actual slope is the furthest from the
predicted slope.
Load/deflection predictions were made based on elastic beam behavior of a beam
loaded at the one-third points. The general equation for the deflection as a function of load
for each repair material is shown in Appendix A. The loads were applied at the same points
for all of the beams (32 in. from each end), which leaves the modulus of elasticity and the
moment of inertia as the only relevant variables from beam to beam. In order to make a
conclusion about the stiffness of the beams; the modulus of elasticity of the repair material
needs to be examined (Table 4.8). Again the material that performs the best is the stiffest
75
material, Material B. The material that performs the worst is Material A, which has the
lowest modulus of elasticity. The other three materials have similar modulus of elasticities.
The deflection of reinforced concrete beams is always difficult to predict due to the brittle,
heterogeneous nature of the material. All of the actual slopes are less than the predicted
theoretical slopes, which means that the beams are less stiff than theoretically predicted. A
material with a higher modulus of elasticity would behave more ideally because stiffness is
directly proportional to the modulus of elasticity.
In addition to structural behavior of repaired concrete beams, engineers are often
concerned with the ability of the patch to bond to the beam. Pieces of repair material that fall
onto a roadway may cause serious injury to vehicles and their occupants which are driving
underneath them. The final information (Table 4.10) that was obtained from the flexural
tests was the ability of the patch to adhere to the damaged concrete at the ultimate load of the
beam. There is no way to quantify the bond between the patch and the beam at the beam’s
ultimate load because some portion of the patch had debonded; therefore the rankings are
qualitative from the notes taken while the beams were tested. Material E deteriorated more
than any of the other materials at a high load. The patches completely debonded before the
beam had yielded. Failure occurred along the bond line because there was little to no
cracking in the patch itself. This suggests that the bond was very weak. On the
manufacturer’s instructions for application, moist curing is listed as required. This step was
not followed because moist curing is not used very often in the field and was not used on the
other materials. Material E was also poured very wet (almost infinite slump). When all of
the water evaporates, there is significant potential for shrinkage.

76
Material RankingA 3B 1C 2D 4E 5
Table 4.10 Relative rankings of repair material’s bond strength in the flexural test.
The combination of high slump and lack of moist curing was most detrimental to the
bond strength of Material E. The other material that performed poorly was Material D.
Material D fell out almost as easily as Material E, but not in the same manner. It fell out in
chunks from the middle, while the edges remained bonded to the beam. Material D was the
easiest material to apply because it was possible to apply the repair in one lift. Even though
the material was able to support itself in one lift, it seems that there was a lack of bond
strength at the center. The other materials performed adequately.
4.5.2 Push Out Shear Test
The push out shear test was performed to evaluate the ability of the repair materials to
remain bonded to the beam after a vertical load had been applied. The ranking of the
materials from these tests are shown in Table 4.11. The results listed in Table 4.11 show
how all of the materials performed relative to the other materials. Even though Materials A,
C, and D are ranked 4, 2, and 1, respectively, it would not have been unreasonable to give
them a ranking of 2 because Materials A, C, and D all performed very similarly. Figure 4.7
presented the experimental shear strength of all of the materials, and it can be seen that
Materials A, C, and D showed nearly identical shear strengths. Material E performed the
best by far. Most importantly, the plain concrete samples did not perform well at all. All of
the plain concrete specimens were poured very stiff and were not wet cured. This lead to

77
Material RankingA 4B N/AC 3D 2E 1
Concrete 5
Table 4.11 Repair material ranking based on the push out shear test results.
large shrinkage cracks, and because of the large amount of shrinkage the bond between the
base concrete and the patch was not very strong. All of these materials failed at a shear stress
that is much lower than any reported value listed by any manufacturer. Possible causes of
failure were the flexural shear stresses that occurred before the pure shear load and the poor
bond due to over head application. This test is not analogous to any published test, but is a
valid concern to repair engineers. There is no way to predict the pure shear strength of a
repair patch based on information provided by manufacturers.
4.5.3 Bond Strength
Table 4.12 presents the relative rank of the bond strength of each repair material
without freeze/thaw cycles. The two columns show slightly different results between the
ranking based on the manufacturers’ reported bond strengths and the experimental bond
strengths. The difference between the reported bond strengths and the experimental bond
strengths is caused by the different tests used to report bond strength. This study evaluated
bond strength using a modified ASTM 882 test; which was explained in Chapter 3. As stated
in Chapter 3, in the author’s opinion the modified ASTM 882 adequately measures the bond
strength between a repair patch and a damaged concrete surface because the surface used in
the modified test is roughened.

78
Material Experimental Bond Strength Ranking
Manufacturers' Reported Bond
Strength Ranking
A 5 4B 4 1C 2 3D 3 5E 1 2
Table 4.12 Comparison of experimental rankings and manufacturers’ reported material property ranking of bond strength of repair materials with zero freeze/thaw cycles.
4.5.4 Bond Strength with Freeze/Thaw cycles
The bond strength information that is useful for repair material selection is the
decrease in strength due to freeze/thaw cycles. Table 4.13 presents the ranking of bond
strength after 110-freeze/thaw cycles and the percentage decrease of the wedge cylinders
from the zero freeze/thaw tests. The second column in Table 4.13 shows the ranking given to
the repair materials based on the absolute value of the capacity of the cylinders. The third
column shows the percentage decrease of the wedge cylinders from the zero cycle to the
110-freeze/thaw cycle tests. The final column gives a ranking based on the durability of each
material. Rankings are based on the percentage decrease of the bond strength of each
material, not the absolute value of the bond strength. Throughout this thesis, it has been
stressed that repair patch durability should be the ultimate concern of the designing engineer.
The last column of Table 4.13 lists a key statistic for determining patch durability. The
material property that most directly influences patch durability due to freeze/thaw cycles is
the coefficient of thermal expansion. It has been stated earlier that incompatibility of the
repair material and in-place concrete with respect to thermal movement can cause large

79
A 5 8.4 1B 4 18.2 4C 3 19.2 5D 2 9.1 2E 1 15.4 3
Material
Bond Strength Ranking with
110 freeze/thaw Cycles
% Decrease from Zero freeze/thaw
Cycles
Durability Ranking
Table 4.13 Ranking of bond strengths subjected to freeze/thaw cycles.
internal stresses. Also, materials with a larger coefficient of thermal expansion do not
perform as well as materials with a lower coefficient of thermal expansion with the same
number of freeze/thaw cycles. The ratio of the coefficient of thermal expansions of each
repair material to the coefficient of thermal expansion of the concrete it was used to repair
are presented in Table 4.14. The next to last column shows the ratio of the two values. The
ratio of the two coefficients of thermal expansions is an indication of compatibility; the
closer the ratio is to one, the more compatible the repair material is thermally. It can be seen
that Material E is the least compatible because it has the highest ratio, and Material C is the
most compatible because it has the ratio closest to one. It makes no difference if the
coefficient of thermal expansion of the repair material or base concrete is the higher of the
two.
Table 4.14 supports the claim that freeze/thaw cycles affect repair material durability.
However, there was no discernable trend in the data collected in the cylinder test based on
the relative value of coefficient of thermal expansion of the repair material and that of the
beam. This is due to the fact that the cylinders were unconfined. If the materials were tested
in a freeze/thaw test where the materials were confined, like the conditions a patch material

80
Material
Coefficient of Thermal Expansion of the Repair
Material (10-6in/inoF)
Coefficient of Thermal Expansion
of Concrete (10-6in/inoF)
Ratio of Repair to Concrete
Decrease in Wedge
Capacity (%)
A 5.7 4.5 1.27 8.4B 6.3 4.5 1.40 18.2C 4.2 4.5 0.93 19.2D 5.4 4.5 1.20 9.1E 8.0 4.5 1.78 15.4
Table 4.14 Comparison of the coefficient of thermal expansion of repair material to the coefficient of thermal expansion of the repaired concrete.
would experience in a beam without feathered edges, the results would be very different. If a
patch material with a large coefficient of thermal expansion was used to repair a beam with a
low coefficient of thermal expansion, the patch would tend to move more due to temperature
changes than the beam. If the temperature decreased, this would lead to tensile stresses at the
patch edges and compressive stresses in the concrete beam along the vertical surface. The
opposite stresses would occur when the temperature decreased or the relative ratio of the
coefficient of thermal expansion in the patch and in the beam was reversed.
81
5. SUMMARY AND CONCLUSIONS
5.1 Summary Several reports have been published (1-19) that address the topic of concrete
repair, but few have taken the next step and suggested a method for selecting a repair
material. This study attempted to determine the repair material properties that are the
most important for durable concrete repairs and then suggest a method that repair
engineers can use to select a repair material.
In order to select a material to repair concrete, an engineer must be aware of two
factors: 1) the repair material’s compatibility with the existing concrete, and 2) the
application of the repair material. In general, manufacturers report both of these topics
for most materials in sales catalogs. Usually, the reported material properties in sales
catalogs are compressive strength, bond strength, and set times. Compressive strength
and set times are standard tests that do not vary from manufacturer to manufacturer.
Unfortunately, there are several ASTM standards that can be used for evaluating bond
strength. The most common is ASTM 882 because it is an easy test to perform and to
understand. When comparing the bond strength of different materials, it is important to
understand the different tests and not be misled by any large value of bond strength.
Five repair materials, with a variety of material properties and recommended by
their manufacturers for overhead use, were selected for this study. All of these materials
were cementitious materials with different chemical additives that enhanced f/t
resistance, increased bond strength, and/or decreased the material weight in comparison
to Portland concrete.
82
Beam specimens were constructed and then damaged to simulate a horizontal impact
load. These beams were repaired and then tested initially with a vertical load and then a
horizontal load to determine the strength of each of the repair materials in different loading
conditions. Cylinder specimens were also constructed to determine the pure compressive
strength and the shear bond strength of each repair material. Using a wedge test similar to
ASTM 882, the wedge cylinders were subjected to freeze/thaw cycles and an axial load to
test the shear bond strength and the durability of the bond.
The load/deflection behavior, cracking load, patch bond, and shear strength of all of
the different concrete/repair material combinations were analyzed to determine if there were
any trends in the data. It was determined that modulus of elasticity was the most influential
material property. The load/deflection behavior of beams repaired with materials a higher
modulus of elasticity than the base concrete were stiffer up to the cracking load and were in
better agreement with a simplified theoretical model.
Several different methods were used in this study to measure repair material bond.
The push out shear test measured the pure shear strength of the material. All of the repair
materials failed at a much lower stress than predicted by any of the published shear strengths.
However, all materials performed much better than plain concrete. Due to the poor
performance of the repair materials compared to the published values, it was not possible to
make any correlation between published strengths and the actual strength of the materials.
Wedge cylinders were also used to evaluate the bond strength of the repair materials. The
wedge cylinder samples were exposed to 110 freeze/thaw cycles and then axially loaded to
failure. The materials that performed the best had a coefficient of thermal expansion similar
to the base concrete.

83
5.2 Recommendations
The purpose of this report is to help engineers design effective concrete repairs for
bridges or any other situation where concrete is damaged. The preceding material has
discussed the general theory behind concrete patching and has shown laboratory tests that
proves the importance of several key repair material properties. The following section will
show how to select a repair material based on the requirements of the structural system.
5.2.1 Selection Algorithm
It has been shown that the key criteria are modulus of elasticity, bond strength,
thermal compatibility, material application and workability, and compressive strength. Of all
of these material properties modulus of elasticity and bond strength are the most important.
Any selection algorithm should weight these properties most heavily. The algorithm
described below and shown in Table 5.1 can be used to compare any prospective repair
materials.
1.) Select several repair materials.
2.) Make a table of the modulus of elasticity, bond strength, compressive
strength, thermal compatibility (use base concrete coefficient of thermal
expansion of 4.5 x 10⁻⁶ in./in.°F), and application (based on the specific
conditions required).
3.) Make a relative ranking of each material in the five categories listed in Item 2.
4.) Weigh the importance of the modulus of elasticity and the bond strength
factors. A weighting factor of two is suggested.
5.) Total the rankings.

84
A 10 8 3 4 5 30B 8 2 4 1 2 17C 6 6 1 3 3 19D 4 10 2 4 1 21E 2 4 5 2 4 17
Compressive Strength
Application Total Ranking
Material Modulus of Elasticity (x2)
Bond Strength
(x2)
Coefficient of Thermal
Expansion ratio
Table 5.1 Material ranks based on the proposed material selection algorithm.
From Table 5.1, Materials B or E would be the best repair materials and Material A
would be the worst because Materials B and E scored the lowest and Material A scored the
highest. The magnitude of the ranking number in the last column is not significant. All that
is significant is how the materials rank relative to each other. Of course if an engineer were
trying to repair a concrete member exposed to different conditions, the selection algorithm
could have different weighting factors. For instance, if compressive strength was a more
important material property for the given repair situation, it could be given a weight of 2.
5.3 Conclusions
Repair material selection is a difficult problem for any engineer due to the large
variety of repair materials available. This study has identified four material properties that
need to be investigated for durable repairs. These properties are based solely on the loading
conditions used in this study: flexural tests, push out shear tests, and slant shear tests in
which the specimens were subjected to freeze/thaw cycles. If a repair material were applied
in a different situation, like to repair a concrete column, other material properties would be
more important.

85
Most Essential Material Properties for an Effective Concrete Repair
1.) Modulus of Elasticity
2.) Bond Strength
3.) Coefficient of Thermal Expansion
4.) Compressive Strength
In order to use the information presented in this thesis effectively, it is important to
know generally how repair materials behave. The following provides some simple general
information about repair material behavior.
1.) Unless the repair specifically requires a large compressive strength, do not
select a repair material based simply on compressive strength.
2.) Select a repair material with a similar modulus of elasticity to the concrete
that is being repaired.
3.) In general, repair materials with a high coefficient of thermal expansion
degrade faster in freeze/thaw cycles than materials with a low coefficient of
thermal expansion.
4.) Understand the tests used by manufacturers to reported bond strength because
manufacturers use a variety of tests. Some of the tests are even designed by
the manufacturer themselves. For example, if bond strength is a significant
factor in selecting the repair material, make sure that the test used by the
material manufacturers to report the bond strength applies load to the repair

86
system in the same manner that load will be applied to the repair material in
the field.
In addition to the material properties of the repair material, an engineer must be aware
of the ability of the material to be placed. This study has identified several factors that
influence the behavior of material application.
1.) Make sure that the contractor hired to perform the work is familiar with rapid
setting materials and concrete repair.
2.) Mix small batches of material until sufficiently familiar with how each repair
material behaves. The five different materials used in this thesis behaved very
differently in the same laboratory conditions. The weather, especially
temperature and humidity, can change the performance and pot life of a repair
material significantly.
3.) Realize that material performance listed in sales catalogs is under laboratory
conditions. The application of the material is never as easy as is reported.
4.) Once the material is mixed with water or latex, be prepared to apply the
material because materials set up very quickly.
5.) Most manufacturers require either moist curing or a curing additive. The
curing additive acts like a seal to keep the moisture from evaporating from the
repair patch too quickly. However, in most applications, the same objective
can be achieved by moist curing the repair by covering the repair patch with
wet burlap. The wet burlap keeps the repair material moist during the critical
curing time.
87
APPENDIX A:
MOMENT OF INERTIA CALCULATIONS

88
Method 1 - Moment of Inertia Calculations: Material A and Pour No. 1: Esteel = 29,000 ksi Beam Dimensions: Erepair = 2,000 ksi b = 6.0 in. Econcrete = 4,031 ksi d = 10.25 in. As = .4 in2 (2 - #4 bars) Cover = 1.5 in.
n EE
nsteelsteel
concretesteel= = 719.
n EE
nrepairsteel
concreterepair= = 050.
Transform all areas into the base concrete: A1 = (b)(d) A1 = 61.5 in2 A2 = nsteel (As) A2 = 2.88 in2 A3 = nrepair (b)(1.5 in) A3 = 4.47 in2 Location of the Neutral Axis (before cracking):
321
321.)75.()(
2AAA
indAdAdAx
++
+++⎟⎠⎞
⎜⎝⎛
= x in= 572. .
2
1
3
212 ⎟⎠⎞
⎜⎝⎛ −+= x
dAbdIconcrete
Iconcrete = 560.2 in4
( )22
xdAIsteel
−= Isteel = 59.0 in4
2
3 2.5.1
⎥⎦
⎤⎢⎣
⎡−⎟
⎠⎞
⎜⎝⎛ += xindAI
repair Irepair = 124.5 in4

89
Table A.1 Summary of Method 1 moment of inertia calculations.
Note: Moment of inertias are calculated at the centerline of the beam.
A B C D EErepair (ksi) 2,000 5,000 4,370 4,100 4,220
Econcrete (ksi) 4,030 3,950 4,415 4,525 4,450nsteel 7.19 7.19 7.34 6.51 6.41nrepair 0.5 1.24 1.11 0.92 0.93
A1 (in2) 61.5 61.5 61.5 61.5 61.5
A2 (in2) 2.88 2.88 2.94 2.61 2.56
A3 (in2) 4.47 11.16 9.96 8.29 8.4
x (in.) 5.72 6.19 6.11 5.98 5.99Iconcrete (in
4) 560.2 608 598.6 583.6 584.1
Isteel (in4) 59.1 47.5 50.3 47.5 46.6
Irepair (in4) 124.5 258.4 237.8 208.7 211
Itotal (in4) 743.8 913.9 886.6 839.8 841.7
Variable Material

90
Method 2 - Moment of Inertia Calculations: Pour No. 1 (Used with Materials A and B) Esteel = 29,000 ksi Beam Dimensions: Erepair = 4,031 ksi b = 6 in. Econcrete = 4,031 ksi d = 10.25 in. As = .4 in2 (2 - #4 bars) Cover = 1.5 in.
n EE
nsteelsteel
concretesteel= = 719.
nE
Enrepair
repair
concreterepair= = 100.
Transform all areas into the base concrete: A1 = (b)(d) A1 = 61.5 in2 A2 = nsteel (As) A2 = 2.88 in2 A3 = nrepair (b)(1.5 in.) A3 = 9.00 in2 Location of the Neutral Axis (before cracking):
321
321)75.()(
2AAA
indAdAdAx
++
+++⎟⎠⎞
⎜⎝⎛
= x in= 6 05. .
2
1
3
212⎟⎠⎞
⎜⎝⎛ −+= xdAbdI
concrete Iconcrete = 590.7 in4
I A d xsteel = −2
2( ) Isteel = 50.8 in4
2
3 2.5.1
⎥⎦
⎤⎢⎣
⎡−⎟
⎠⎞
⎜⎝⎛ += xindAI
repair Irepair = 220.8 in4
Itotal = Iconcrete + Isteel + Irepair Itotal = 862.4 in4

91
1 2 3 4 5Erepair (ksi) 4030 3950 4415 4525 4450
Econcrete (ksi) 4030 3950 4415 4525 4450nsteel 7.19 7.34 6.57 6.41 6.51nrepair 1 1 1 1 1
A1 (in2) 61.5 61.5 61.5 61.5 61.5
A2 (in2) 2.88 2.94 2.63 2.56 2.61
A3 (in2) 9 9 9 9 9
x (in.) 6.05 6.05 6.03 6.03 6.03Iconcrete (in
4) 590.7 591.1 589.1 588.7 588.9
Isteel (in4) 50.8 51.8 46.7 45.7 46.4
Irepair (in4) 220.8 220.5 222.1 222.4 222.2
Itotal (in4) 862.4 863.4 857.9 856.8 857.5
Variable Pour
Table A.2 Summary of Method 2 moment of inertia calculations.
Note: Moment of inertias are calculated at the centerline of the beam.

92
Summary of Cracking Load Calculations: Material A f ′cr = 4,400 psi f ′cr = compressive strength of the repair material. frr = 500 psi frr = modulus of rupture of the repair material. Concrete f ′cc = 5,000 psi f ′cc = compressive strength of Pour No. 1 concrete. frc = 530 psi frc = modulus of rupture of Pour No. 1 concrete. Gross Moment of Inertia based on the transformation of all three materials into the base concrete (Method 1): Ig = 743.7 in4 Location of the Neutral axis based on the transformed area (measured from the bottom of the beam): yt = 6.28 in Calculation of the cracking moment of the beam: Based on a transformed section:
Mf Iy
Mcrrc g
tcr= = 523. ft-kip
Cracking Load for two point loading:
For two point loading: MPL
L in ft= = =3
96 8.
In this case, P, is half of the total load applied.
Therefore, P Mcr
cr=3
4 (Mcr in ft-kips) Pcr = 3.92 kip
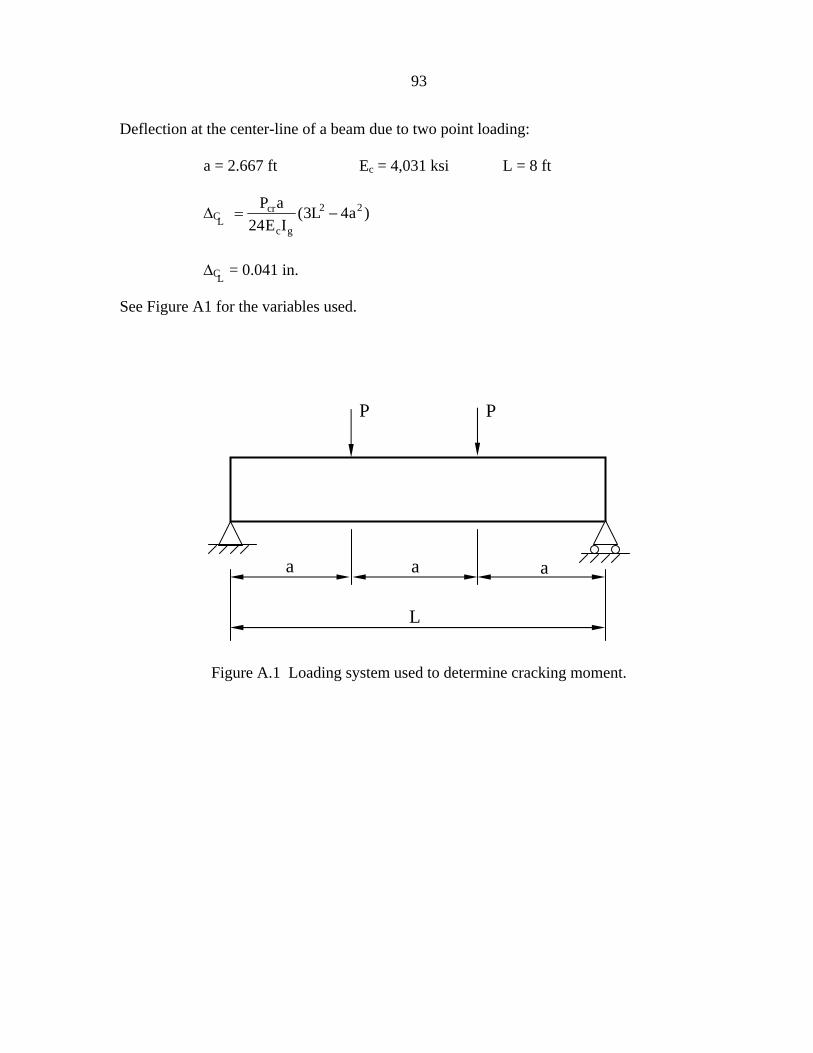
93
L
a a a
P P
Figure A.1 Loading system used to determine cracking moment.
Deflection at the center-line of a beam due to two point loading: a = 2.667 ft Ec = 4,031 ksi L = 8 ft
∆ = −P aE I
L acr
c g243 42 2( )
∆ = 0.041 in. See Figure A1 for the variables used.
C L
C L

94
Material Variable A B C D E f psicr ( ) 4,400 12,400 6,000 6,360 7,620 f psirr ( ) 500 835 580 600 655 f psicc ( ) 5,000 5,000 4,800 6,070 6,300 f psire ( ) 530 530 520 585 595 I ing ( )4 743.8 913.9 886.6 839.8 841.7 y int ( ) 6.28 5.81 5.89 6.02 6.01
Mcr (ft-kips) 5.23 6.95 6.53 6.80 6.94 P kipscr ( ) 3.92 5.21 4.90 5.10 5.21 E ksi( ) 4,030 3,950 4,415 4,525 4,450 ∆ (in.)
0.041 0.044 0.044 0.043 0.043 C L
Table A.3 Summary of Method 1 cracking load calculations.

95
Summary of Cracking Load Calculations: Pour 1 f 'cr = 5,000 psi f 'cr = compressive strength of the repair material. frr = 530 psi frr = modulus of rupture of the repair material. Concrete The "repair material" is actually the concrete. f 'cc = 5,000 psi f 'cc = compressive strength of the concrete. frc = 530 psi frc = modulus of rupture of the concrete. Gross Moment of Inertia based on the transformation of all three materials into the base concrete (Method 2): Ig = 862.4 in4 Location of the neutral axis based on the transformed area (measured from the bottom of the beam). yt = 5.95 in. Calculation of the cracking moment of the beam: Based on a transformed section
Mf Iycrrc g
t= Mcr = 6 40. ft-kip
Cracking Load for two point loading
For two point loading: MPL
=3
I = 96 in. = 8 ft
In this case, P, is half of the total load applied.
Therefore, P Mcr
cr=3
4 (Mcr in ft-kips) Pcr = 4.80 kip

96
Table A.4 Summary of Method 2 cracking load calculations.
Deflection at the center-line of a beam due to two point loading: a = 2.667 ft Ec = 4,031 ksi L = 8 ft
∆ = −P aE I
L acr
c g243 42 2( )
∆ = 0.043 in. See Figure A.1 for the variables used.
Pour Variable 1 2 3 4 5 f psicr ( ) 5,000 4,800 6,000 6,300 6,070 f psirr ( ) 530 520 580 595 585 f psicc ( ) 5,000 4,800 6,000 6,300 6,070 f psire ( ) 530 520 580 595 585 I ing ( )4 862.4 863.4 857.9 856.8 857.5 y int ( .) 5.95 5.95 5.97 5.97 5.97
Mcr (ft-kips) 6.4 6.3 7.0 7.1 7.0 P kipscr ( ) 4.8 4.7 5.2 5.3 5.3 E ksi( ) 4,030 3,950 4,415 4,525 4,450 ∆ (in.)
0.043 0.043 0.043 0.043 0.043
C L
C L
C L
97
APPENDIX B:
WEDGE CYLINDER FAILURE LOADS

98
Table B.1 Wedge cylinder failure loads for zero freeze/thaw cylinders.
Material Type
Failure Load (lbs.)
Repair Material Age
(days)
Type of Cylinder
31,220 38 Full30,620 38 Full31,410 38 Full30,930 38 Shear24,110 38 Shear4,210 38 Shear
90,790 31 Full90,870 31 Full81,610 31 Full33,860 31 Shear40,670 31 Shear28,890 31 Shear41,550 23 Full42,600 23 Full42,940 23 Full38,700 23 Shear34,060 23 Shear36,150 23 Shear44,420 15 Full46,590 15 Full43,830 15 Full30,740 15 Shear34,090 15 Shear38,860 15 Shear55,940 14 Full52,840 14 Full52,940 14 Full45,020 14 Shear43,240 14 Shear33,860 14 Shear
E
A
B
C
D
99
REFERENCES
(1.) “Laboratory and Field Evaluation of Required Material Properties for Concrete Repairs,” Report 1412-2, Center for Transportation Research, The University of Texas at Austin, October 1996.
(2.) “Evaluation and Repair of Impact-damaged Prestressed Concrete Bridge Girders,”
Report 1370-3F, Center for Transportation Research, The University of Texas at Austin, January 1997.
(3.) Emmons, Peter. “Form and Pump Method for Vertical and Overhead Repairs”
Concrete Repair Digest, August/September, pp. 138-143, 1992. (4.) Kuhlmann, L.A. “Latex Modified Concrete for the Repair and Rehabilitation of
Bridges.” Cement, Concrete and Aggregates, pp. 78-84, 1996. (5.) Johnston, Rosalie. “Mortars that Don’t Slough Off on the Job.” Concrete Repair
Digest, June/July, pp. 190-193, 1994. (6.) Bullock, R.E. “Factors Influencing Concrete Repair Materials.” Concrete
International, September, pp. 67-87, 1980. (7.) Knab, Lawrence I. and C.B. Spring, “Evaluation of Test Methods for Measuring the
Bond Strength of Portland Cement Based Repair Materials to Concrete,” Cement, Concrete and Aggregates, CCAGDP, Vol. 11, No. 1, Summer 1989, pp. 3-14.
(8.) Wall, J.S. and N.G. Shrive, “Factors Affecting Bond Between New and Old
Concrete.” ACI Materials Journal, March-April, pp.117-125, 1988. (9.) Kuhlmann, L.A., “Test Method for Measuring the Bond Strength of Latex-Modified
Concrete and Mortar.” ACI Materials Journal, July-August, pp. 387-394, 1990. (10.) Plum, D.R., “The Behaviour of Polymer Materials in Concrete Repair, and Factors
Influencing Selection.” The Structural Engineer, Vol. 68, No. 17, pp.337-345, September 4, 1990.
(11.) Emmons, P.H. and A.M. Vaysburd, “Factors Affecting the Durability of Concrete
Repair: The Contractor’s Viewpoint.” Construction and Building Materials, Vol. 8, No. 1, pp. 5-16, 1994.
(12.) Cusson, Daniel and Noel Mailvaganam, “Durability of Repair Materials.” Concrete
International, March, pp. 34-38, 1996.

100
(13.) Mangat, P.S. and M.K. Limbachiya. “Repair Material Properties with Influence Long-Term Performance of Concrete Structures.” Construction and Building Materials, Vol. 9 No.2, pp. 81-90, 1995.
(14.) “Repair Techniques and Materials.” Concrete Construction, January, pp. 31-47, 1981. (15.) “Nonshrink Hydraulic Cement Mortars and Grouts.” Concrete Construction, October,
pp. 893-898, 1984. (16.) Suprenant, Bruce A. and Myles A. Murray. “How to Place Durable Partial-Depth
Patches.” Concrete Repair Digest, October/November, pp. 251-255, 1993. (17.) McGovern, Martin S. “Evaluation Patching Materials.” Concrete Repair Digest,
October/November, pp. 139-142, 1991. (18.) McGovern, Martin S. “Cementitious Patching Materials.” Concrete Repair Digest,
October/November, pp. 139-142, 1991. (19.) Holl, Charles H. and Scott A. O’Connor. “Cleaning and Preparing Concrete before
Repair.” Concrete International, March, pp. 60-63, 1997. (20.) ACI Committee 318, Building Code Requirements for Structural Concrete (ACI 318-
95) and Commentary (ACI 318R-95), American Concrete Institute, Detroit, 1995.

101
ACKNOWLEDGMENTS
The research presented in this report was conducted by the Bridge Engineering Center
at Iowa State University and was sponsored by the Highway Division of the Iowa
Department of Transportation and the Iowa Highway Research Board and under Research
project TR-428.
The authors wish to thank the various manufactures that generously donated several
of the patch materials evaluated in this investigation.
The experimental portion of this project would not have been possible without the
significant assistance of Doug Wood, Manager of the Structural Engineering Laboratory.
Thanks are also due to the following Civil Engineering undergraduates for all of their
assistance in the laboratory: Ben Dreier, Emily Allison, Travis Hosteng, Elizabeth Kash,
Ken Hoevelkamp, Katie Bell, and Scott Ingersoll.
Related Documents