Effective Exchange Rates and the Classical Gold Standard Adjustment By LUIS A. V. CATA ˜ O AND SOLOMOS N. SOLOMOU* Using a new international dataset of trade-weighed exchange rates, this paper highlights a neglected adjustment mechanism in the classical gold standard liter- ature. Since gold-pegged countries traded extensively with economies operating more flexible monetary regimes and where parity change was a common adjustment device to systemic shocks, we show that such parity adjustments induced worldwide swings in nominal effective exchange rates. These translated into real exchange rate variations to which trade balances responded with an average elasticity of unity and in the direction of restoring external disequilibria. We conclude that some nominal exchange rate flexibility thus present in the pre-1914 system was instrumental to international payments adjustment. (JEL F31, F32, F33, N10) In these days when skepticism of fixed ex- change rates rides high in the profession, it is tempting to think of the classical gold standard as a historical counterweight that may help tem- per some of the prevailing wisdom. After all, for nearly a third of a century from the late 1870s, core sovereign nations managed to stick to a system of de facto fixed exchange rates, which not only prevented potentially destabilizing par- ity gyrations among the main international cur- rencies, but also accommodated considerable differences in economic growth across coun- tries and arguably helped foster world financial integration. 1 The feat is all the more impressive since the system worked in the absence of cap- ital controls, nontariff trade restrictions, or mas- sive central bank interventions, and was only interrupted by a world war. Attempts to explain such long-lasting stabil- ity have produced a voluminous literature, which highlights four main factors. One was the limited resort to sterilization policies, which facilitated the automatic working of the specie- flow mechanism of balance-of-payments adjust- ment. To the extent that this mitigated persistent asymmetric accumulation of trade surpluses and foreign exchange reserves in any one country, it clearly contributed to the sustainability of the various gold pegs. 2 A second factor, empha- sized by Michael D. Bordo and Hugh Rockoff (1996), was the degree of credibility underpin- ning central bank interventions. Since adher- ence to gold was widely perceived as a “good housekeeping seal of approval” which facili- tated access to capital markets, the system provided a clear incentive for the pursuit of time-consistent policies which helped back the * Cata ˜o: Research Department, International Monetary Fund, Washington, DC 20431 (e-mail: [email protected]); Solomou: Faculty of Economics, University of Cambridge, Cambridge, CB3 9DD, UK (e-mail: [email protected]). We thank Tam Bayoumi, Michael Bordo, Marc Flandreau, Paolo Mauro, Chris Meissner, Ken Rogoff, and two anon- ymous referees, as well as seminar participants at the Rut- gers University, UCLA, and Universidad Carlos III for comments on an earlier draft. We would also like to thank innumerous colleagues on both sides of the Atlantic for invaluable help in tracking some national data sources, and in particular George Kostelenos, Leandro Prados, and Jef- frey Williamson for sharing with us some of their unpub- lished data. Solomou gratefully acknowledges the support of the UK ESRC scheme on Understanding the Evolving Macroeconomy (Grant L138251045) and the Leverhulme Trust Travel Fellowship scheme. The views expressed here are the authors’ alone and do not necessarily reflect those of the International Monetary Fund. 1 Evidence that the pre-1914 gold standard facilitated world capital market integration is provided in Michael Bordo and Hugh Rockoff (1996), and Maurice Obstfeld and Alan M. Taylor (2003). On the effects of the gold standard on goods markets and trade integration, see Kevin H. O’Rourke and Jeffrey G. Williamson (1999) and J. Ernesto Lo ´pez-Co ´rdova and Christopher M. Meissner (2003). 2 Detailed discussions of the specie-flow adjustment mechanism can be found in Bordo and Schwartz (1984) and Eichengreen and Flandreau (1997). 1259

Welcome message from author
This document is posted to help you gain knowledge. Please leave a comment to let me know what you think about it! Share it to your friends and learn new things together.
Transcript
integr
* CFund,SolomCambrWe thaPaoloymousgers Ucommeinnumeinvaluain partfrey Wlishedof theMacroTrust Tare the
world
Effective Exchange Rates and the Classical GoldStandard Adjustment
By LUIS A. V. CATAO AND SOLOMOS N. SOLOMOU*
Using a new international dataset of trade-weighed exchange rates, this paperhighlights a neglected adjustment mechanism in the classical gold standard liter-ature. Since gold-pegged countries traded extensively with economies operatingmore flexible monetary regimes and where parity change was a common adjustmentdevice to systemic shocks, we show that such parity adjustments induced worldwideswings in nominal effective exchange rates. These translated into real exchange ratevariations to which trade balances responded with an average elasticity of unity andin the direction of restoring external disequilibria. We conclude that some nominalexchange rate flexibility thus present in the pre-1914 system was instrumental to
international payments adjustment. (JEL F31, F32, F33, N10)In these days when skepticism of fixed ex-change rates rides high in the profession, it istempting to think of the classical gold standardas a historical counterweight that may help tem-per some of the prevailing wisdom. After all, fornearly a third of a century from the late 1870s,core sovereign nations managed to stick to asystem of de facto fixed exchange rates, whichnot only prevented potentially destabilizing par-ity gyrations among the main international cur-rencies, but also accommodated considerabledifferences in economic growth across coun-tries and arguably helped foster world financial
ation.1 The feat is all the more impressive
atao: Research Department, International MonetaryWashington, DC 20431 (e-mail: [email protected]);ou: Faculty of Economics, University of Cambridge,idge, CB3 9DD, UK (e-mail: [email protected]).nk Tam Bayoumi, Michael Bordo, Marc Flandreau,
Mauro, Chris Meissner, Ken Rogoff, and two anon-referees, as well as seminar participants at the Rut-niversity, UCLA, and Universidad Carlos III fornts on an earlier draft. We would also like to thankrous colleagues on both sides of the Atlantic forble help in tracking some national data sources, and
icular George Kostelenos, Leandro Prados, and Jef-illiamson for sharing with us some of their unpub-data. Solomou gratefully acknowledges the supportUK ESRC scheme on Understanding the Evolvingeconomy (Grant L138251045) and the Leverhulmeravel Fellowship scheme. The views expressed hereauthors’ alone and do not necessarily reflect those of
capital market integration is provided in Michael
1259
since the system worked in the absence of cap-ital controls, nontariff trade restrictions, or mas-sive central bank interventions, and was onlyinterrupted by a world war.
Attempts to explain such long-lasting stabil-ity have produced a voluminous literature,which highlights four main factors. One was thelimited resort to sterilization policies, whichfacilitated the automatic working of the specie-flow mechanism of balance-of-payments adjust-ment. To the extent that this mitigated persistentasymmetric accumulation of trade surpluses andforeign exchange reserves in any one country, itclearly contributed to the sustainability of thevarious gold pegs.2 A second factor, empha-sized by Michael D. Bordo and Hugh Rockoff(1996), was the degree of credibility underpin-ning central bank interventions. Since adher-ence to gold was widely perceived as a “goodhousekeeping seal of approval” which facili-tated access to capital markets, the systemprovided a clear incentive for the pursuit of
time-consistent policies which helped back theLopez-Cordova and Christopher M. Meissner (2003).2 Detailed discussions of the specie-flow adjustment
mechanism can be found in Bordo and Schwartz (1984) and
the International Monetary Fund.1 Evidence that the pre-1914 gold standard facilitated
Bordo and Hugh Rockoff (1996), and Maurice Obstfeld andAlan M. Taylor (2003). On the effects of the gold standardon goods markets and trade integration, see Kevin H.O’Rourke and Jeffrey G. Williamson (1999) and J. Ernesto
Eichengreen and Flandreau (1997).
correlated with nominal effective exchange rate
1260 THE AMERICAN ECONOMIC REVIEW SEPTEMBER 2005
exchange rate peg. Barry Eichengreen and MarcFlandreau (1997) note that with other policygoals being secondary to this task, and with thepublic being given assurance that any departurefrom convertibility would be contemplated onlyin rare emergencies (such as wars) and that theold parity would be restored soon after, theprevailing policy regime exerted a stabilizinginfluence on asset markets which, in turn, facil-itated the task of monetary management. Third,while aggregate shocks appear to have been noless prevalent than in the interwar and post–World War II eras, aggregate supply curveswere steeper and macroeconomic adjustmentfaster, reflecting lower nominal rigidities. Thishas been emphasized in the work of TamimBayoumi and Eichengreen (1996) and Bordo(1993). A fourth avenue of adjustment, empha-sized in the recent work of Timothy J. Hattonand Jeffrey G. Williamson (1994, 1998), is mi-gration. With labor being freer to move inter-nationally during the period, supply couldrespond more promptly to international wagedifferentials, leading to a well-known patternof transatlantic and intra-European migrationflows, which helped stabilize labor markets overthe economic cycle. Similar ideas can be foundin earlier work by Harry Jerome (1926) andBrinley Thomas (1973).
A striking omission in this literature, however,pertains to the system-wide implications of coex-isting alternative monetary standards trading ex-tensively with each other. This paper takes up thisissue. In doing so, it provides evidence of anadditional adjustment mechanism thus far ne-glected in the gold standard literature, namely,fluctuations in real effective exchange rates(REERs) arising from nominal exchange ratechanges in the periphery. As discussed below, thismechanism was operative because while corecountries had their currencies pegged to gold,many periphery countries experienced significantfluctuations in the gold value of their currencies.This was so among countries operating a silver-currency standard (as silver prices fluctuatedwidely relative to those of gold from the early1870s) as well as those under inconvertiblepaper money, which could not maintain a pre-specified gold parity. The latter group includes theAustrian-Hungarian Empire, Greece, Italy, Portu-gal, Russia, and Spain in Europe, and Argentina,Brazil, Chile, and Colombia in South America.Silver-standard regimes prevailed in most of Asia
(China, India, Japan, Malaysia, and Thailand) andalso in Mexico and Peru.
Transactions with the periphery amounted toabout two-thirds of the European core total mer-chandise trade and to more than 40 percent of U.S.foreign trade, about half of which was conductedwith countries under silver or inconvertible papermoney standards for much of the period (see Ap-pendix Table A1 available at http://www.e-aer.org/data/sept05_app_catao.pdf). Coupled with rel-atively high external trade-to-GDP ratios, this sug-gests that large exchange rate fluctuations in theperiphery must have had an important bearing oninternational relative prices, given evidence thatnominal rigidities were nonnegligible at the time,as emphasized in the work of W. Arthur Lewis(1978) and Robert J. Gordon (1983). If so, suchreal exchange rate movements must also have hada significant bearing on external balances, withimplications for the way the international mone-tary system adjusted to shocks.
To evaluate this hypothesis, this paper con-structs multilateral or “effective” exchange rateindices for both the four core countries and arepresentative group of periphery economiesoperating inconvertible paper money or silver-standard regimes. As discussed in the paper’sAppendix, this dataset was based on extensiveresearch with both primary and secondarysources, allowing us to address the nature ofinternational adjustment during the classicalgold standard era with more extensive data thanthose available to previous researchers. We thenuse the data to document the effective exchangerate swings in the various countries, identifysystem-wide co-movements, and relate them tofluctuations in other variables highlighted inthe literature. Finally, this paper assesses theeffects of real exchange rate changes on tradebalances. Since trade adjustment may havecountry-specific features (possibly reflecting theheterogeneity of policy regimes and nationaleconomic structures), trade effects are modeledusing panel econometric techniques that canaccommodate these features of the data.
Three main findings emerge. First, countriesunder inconvertible paper-currency and silverregimes experienced major swings in their nom-inal effective exchange rates. Much of this vari-ance in nominal rates took place during periodsof well-known, systemic shocks and capitalflow reversals, and was, grosso modo, inversely
relates their m
1261VOL. 95 NO. 4 CATAO AND SOLOMOU: EXCHANGE RATES AND GOLD STANDARD ADJUSTMENT
ain swings to worldwide common
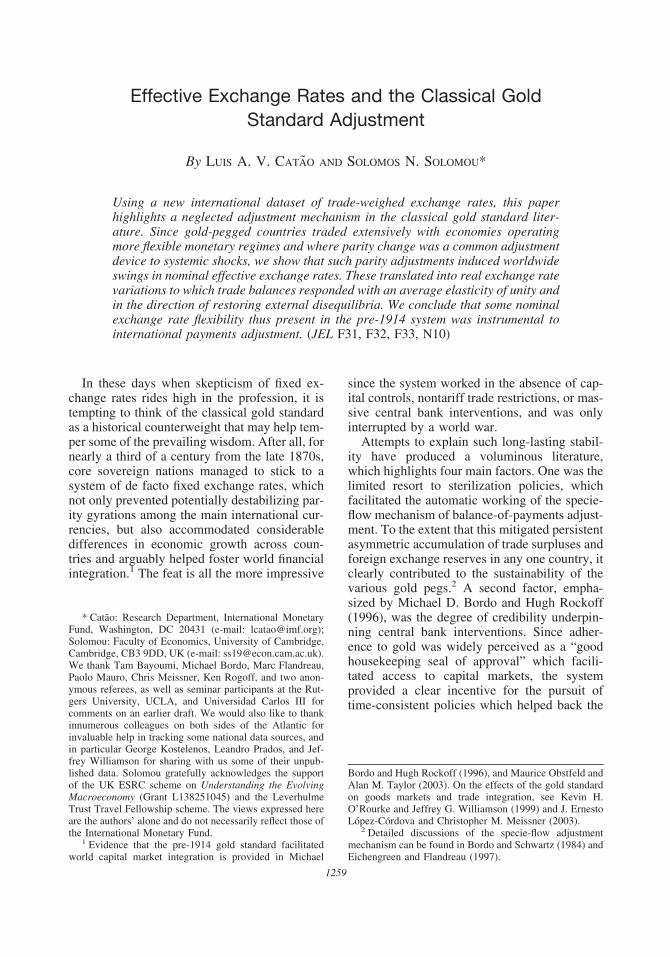
FIGURE 1. NOMINAL EFFECTIVE EXCHANGE RATES IN THE PERIPHERY (1913 � 100)
shocks. Section II does the same for REERs andmeasures the contribution of nominal currencymovements in the periphery to REER variances.Section III estimates the respective trade ef-fects. Section IV summarizes the main findingsand discusses the importance of the effectiveexchange rate mechanism relative to other ad-justment channels noted in the gold standardliterature. The data construction methodologyand sources are provided in the Web Appendix.
I. Nominal Effective Exchange Rates
Figure 1 plots the NEER indices for 12 pe-
movements in the core. Second, such nominalvariations translated into real exchange rate ad-justments, which were at times dramatic, and ofa long-swing nature, entailing large and oftenprotracted deviations from purchasing powerparity (PPP). Third, we find evidence of signif-icant and relatively rapid responses of tradebalances to exchange rate fluctuations, suggest-ing that nominal exchange rate flexibility in theperiphery effectively contributed to interna-tional payments adjustment.
The paper is structured as follows. Section Idocuments the cross-country fluctuations innominal effective exchange rates (NEERs) and
riphery countries, which together accounted for
to which su
1262 THE AMERICAN ECONOMIC REVIEW SEPTEMBER 2005
ch NEER fluctuations in the pe-
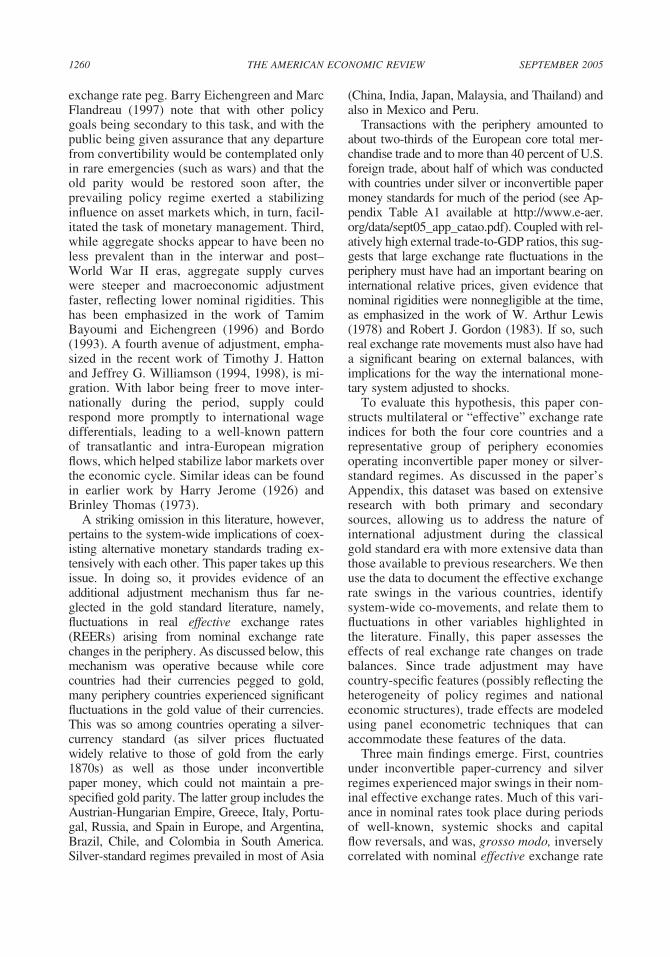
FIGURE 2. NOMINAL EFFECTIVE EXCHANGE RATES IN THE CORE (1913 � 100)
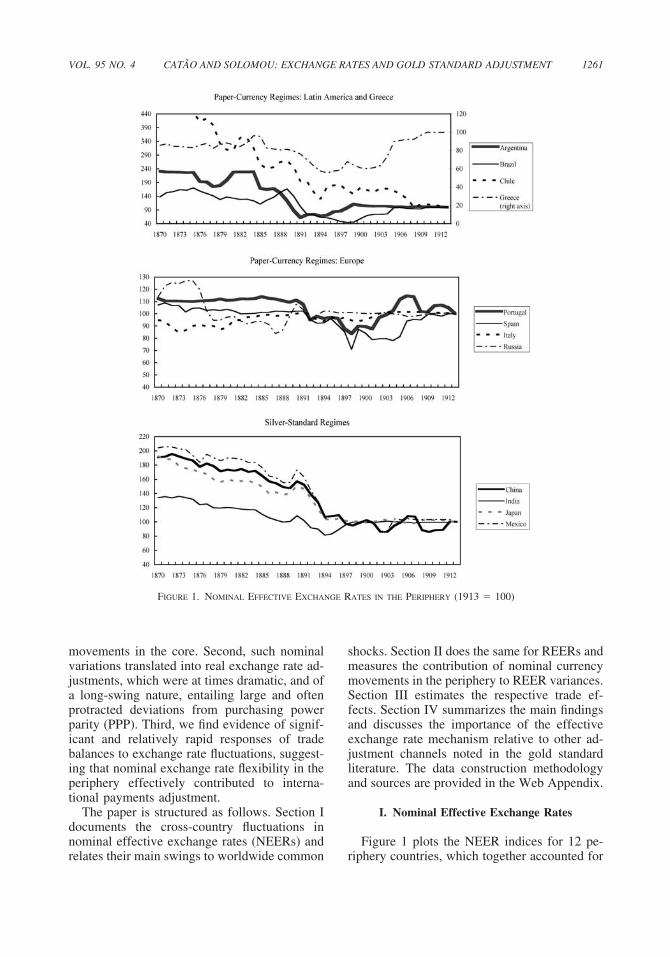
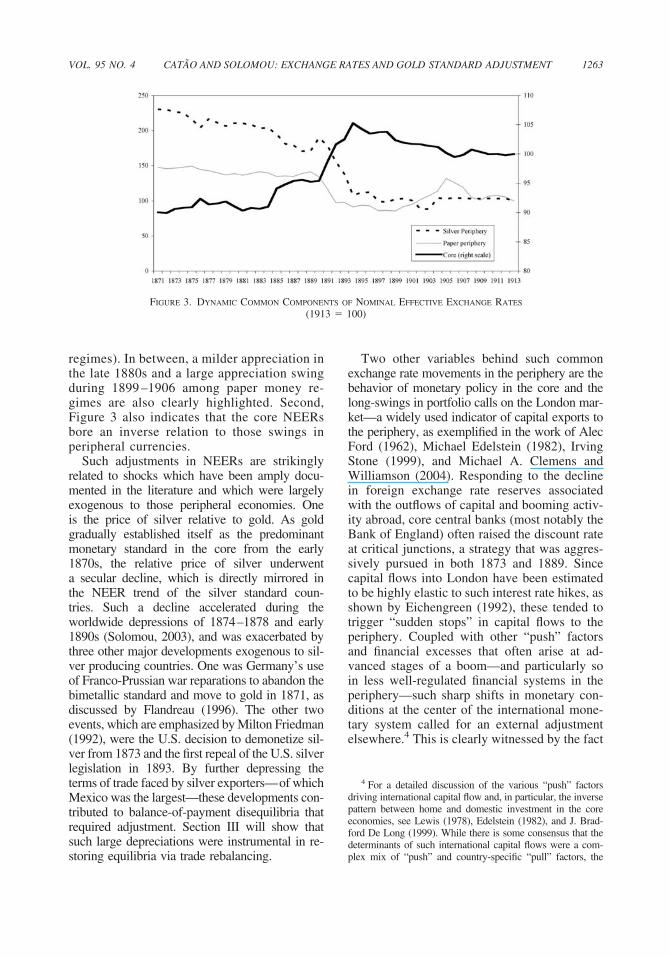
riphery were mirrored in the core. All corecountries’ NEERs displayed nonnegligiblevariations, with appreciations taking placearound 1874 –1879 and in the early 1890s,followed by depreciation from the late 1890s,only briefly interrupted by an appreciation in1907–1908. The existence, magnitude, andtiming of such an international component inexchange rate movements can be more for-mally gauged. Employing the dynamic com-mon components approach developed byJames H. Stock and Mark W. Watson (1989,1991), we let each country series be a log-linear function of both its own cyclical dy-namics plus an i.i.d. residual and a componentcommon to all other series. Maximum likeli-hood estimates yield the results depicted inFigure 3.3 The figure helps drive home twomain features of the data. First, not only didinconvertible paper money and silver regimesexperience a common long-run depreciatingtrend; their parity adjustments also displayeda marked long-swing pattern. Besides a largedownward adjustment in the 1890s, othernonnegligible depreciation episodes tookplace in the late 1870s, 1883–1886, and
1906 –1908 (the latter among paper money3 A concise description of the estimated model is providedin Chang-Jin Kim and Charles Nelson (1999, pp. 48–56). Inorder to conserve on degrees of freedom while also accommo-dating some cyclical dynamics, we allowed both the log of thefirst differences of the common component and each idiosyn-cratic country component to follow an autoregression of orderp, where p � 2. Further specifics of the estimation procedure
no less than two-thirds of the core’s trade withthe nongold periphery (see Appendices).Throughout this paper, exchange rates are de-fined as the foreign currency price of the do-mestic currency, so that a rise (fall) means anappreciation (depreciation). A striking featureof the data is the large amplitude of NEERvariations. Among Latin American paper cur-rency regimes and the silver standard bloc,NEER variations often reached 50 percent ofthe respective mean. For the Southern Europeanpaper currencies, NEER fluctuations were lessdramatic but nevertheless large, in some in-stances exceeding 30 percent, as in Russia be-tween 1875 and 1878 and in Spain and Greecebetween 1891 and 1898 and 1889 and 1895,respectively.
Another salient feature of Figure 1 is thatsuch fluctuations appear to display some com-mon cross-country patterns. For instance, allLatin American paper currency regimes sawtheir exchange rates depreciate between 1875and 1879, with a similar pattern being observedfor silver standard countries and for Russia andSpain. Another depreciation bout is again ob-served in the early 1890s, with one country thatsystematically stuck to parity in previous de-cades (Portugal) being forced off gold in 1891.This was subsequently followed by a wave ofappreciating currencies from the late 1890s, atwhich point a subset of these countries joinedgold (see Appendix A).
Consistent with the existence of signi-ficant trade linkages between core and periph-ery noted earlier, Figure 2 depicts the extent
are available from the authors upon request.
storing equil
1263VOL. 95 NO. 4 CATAO AND SOLOMOU: EXCHANGE RATES AND GOLD STANDARD ADJUSTMENT
FIGURE 3. DYNAMIC COMMON COMPONENTS OF NOMINAL EFFECTIVE EXCHANGE RATES
ibria via trade rebalancing.
(1913 � 100)
Two other variables behind such commonexchange rate movements in the periphery are thebehavior of monetary policy in the core and thelong-swings in portfolio calls on the London mar-ket—a widely used indicator of capital exports tothe periphery, as exemplified in the work of AlecFord (1962), Michael Edelstein (1982), IrvingStone (1999), and Michael A. Clemens andWilliamson (2004). Responding to the declinein foreign exchange rate reserves associatedwith the outflows of capital and booming activ-ity abroad, core central banks (most notably theBank of England) often raised the discount rateat critical junctions, a strategy that was aggres-sively pursued in both 1873 and 1889. Sincecapital flows into London have been estimatedto be highly elastic to such interest rate hikes, asshown by Eichengreen (1992), these tended totrigger “sudden stops” in capital flows to theperiphery. Coupled with other “push” factorsand financial excesses that often arise at ad-vanced stages of a boom—and particularly soin less well-regulated financial systems in theperiphery—such sharp shifts in monetary con-ditions at the center of the international mone-tary system called for an external adjustment
elsewhere.4 This is clearly witnessed by the factregimes). In between, a milder appreciation inthe late 1880s and a large appreciation swingduring 1899 –1906 among paper money re-gimes are also clearly highlighted. Second,Figure 3 also indicates that the core NEERsbore an inverse relation to those swings inperipheral currencies.
Such adjustments in NEERs are strikinglyrelated to shocks which have been amply docu-mented in the literature and which were largelyexogenous to those peripheral economies. Oneis the price of silver relative to gold. As goldgradually established itself as the predominantmonetary standard in the core from the early1870s, the relative price of silver underwenta secular decline, which is directly mirrored inthe NEER trend of the silver standard coun-tries. Such a decline accelerated during theworldwide depressions of 1874–1878 and early1890s (Solomou, 2003), and was exacerbated bythree other major developments exogenous to sil-ver producing countries. One was Germany’s useof Franco-Prussian war reparations to abandon thebimetallic standard and move to gold in 1871, asdiscussed by Flandreau (1996). The other twoevents, which are emphasized by Milton Friedman(1992), were the U.S. decision to demonetize sil-ver from 1873 and the first repeal of the U.S. silverlegislation in 1893. By further depressing theterms of trade faced by silver exporters—of whichMexico was the largest—these developments con-tributed to balance-of-payment disequilibria thatrequired adjustment. Section III will show thatsuch large depreciations were instrumental in re-
4 For a detailed discussion of the various “push” factorsdriving international capital flow and, in particular, the inversepattern between home and domestic investment in the coreeconomies, see Lewis (1978), Edelstein (1982), and J. Brad-ford De Long (1999). While there is some consensus that thedeterminants of such international capital flows were a com-
plex mix of “push” and country-specific “pull” factors, the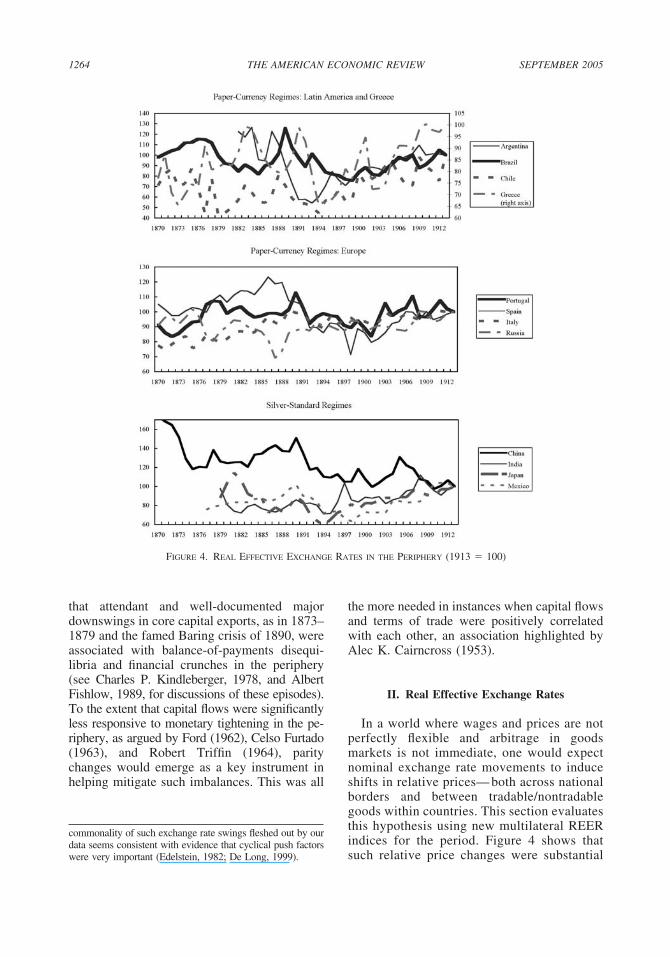
helping miti
were very impo
1264 THE AMERICAN ECONOMIC REVIEW SEPTEMBER 2005
gate such imbalances. This was all
rtant (Edelstein, 1982; De Long, 1999).
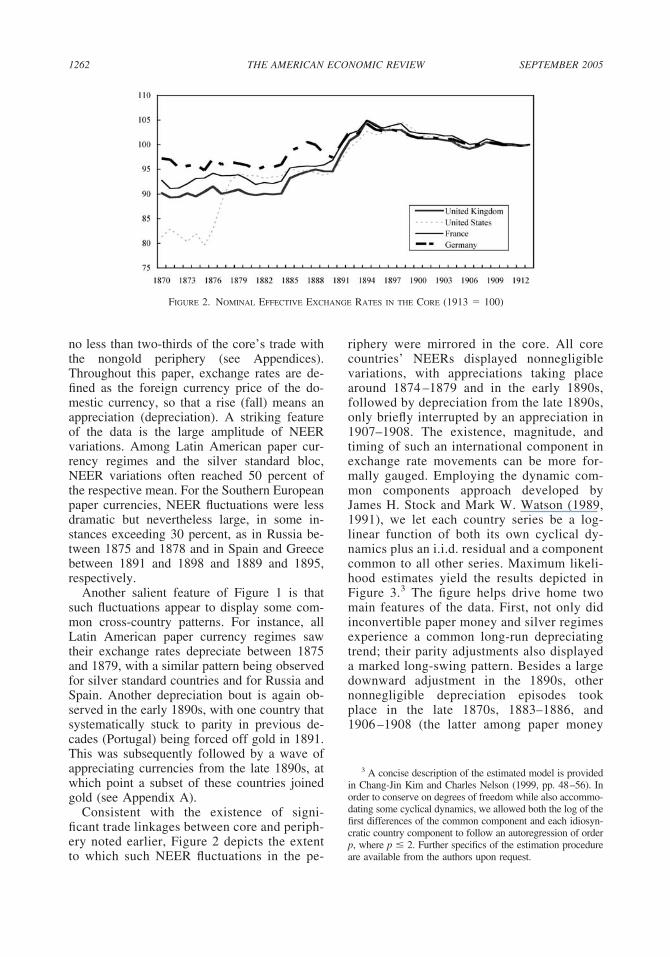
FIGURE 4. REAL EFFECTIVE EXCHANGE RATES IN THE PERIPHERY (1913 � 100)
the more needed in instances when capital flowsand terms of trade were positively correlatedwith each other, an association highlighted byAlec K. Cairncross (1953).
II. Real Effective Exchange Rates
In a world where wages and prices are notperfectly flexible and arbitrage in goodsmarkets is not immediate, one would expectnominal exchange rate movements to induceshifts in relative prices— both across nationalborders and between tradable/nontradablegoods within countries. This section evaluatesthis hypothesis using new multilateral REERindices for the period. Figure 4 shows that
that attendant and well-documented majordownswings in core capital exports, as in 1873–1879 and the famed Baring crisis of 1890, wereassociated with balance-of-payments disequi-libria and financial crunches in the periphery(see Charles P. Kindleberger, 1978, and AlbertFishlow, 1989, for discussions of these episodes).To the extent that capital flows were significantlyless responsive to monetary tightening in the pe-riphery, as argued by Ford (1962), Celso Furtado(1963), and Robert Triffin (1964), paritychanges would emerge as a key instrument in
commonality of such exchange rate swings fleshed out by ourdata seems consistent with evidence that cyclical push factors
such relative price changes were substantial
1265VOL. 95 NO. 4 CATAO AND SOLOMOU: EXCHANGE RATES AND GOLD STANDARD ADJUSTMENT
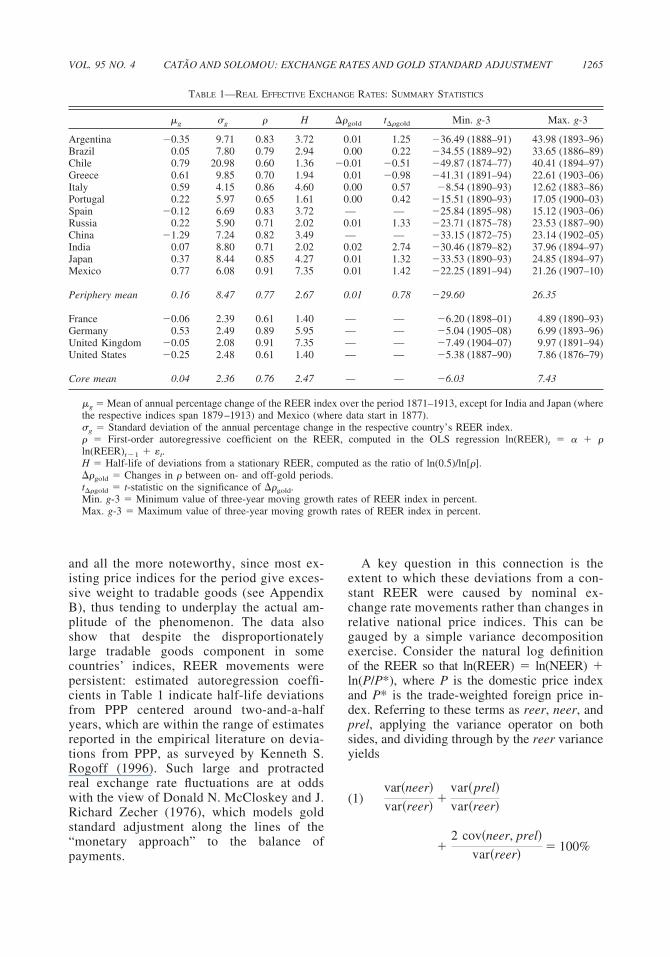
TABLE 1—REAL EFFECTIVE EXCHANGE RATES: SUMMARY STATISTICS
�g �g � H ��gold t��gold Min. g-3 Max. g-3
Argentina �0.35 9.71 0.83 3.72 0.01 1.25 �36.49 (1888–91) 43.98 (1893–96)Brazil 0.05 7.80 0.79 2.94 0.00 0.22 �34.55 (1889–92) 33.65 (1886–89)Chile 0.79 20.98 0.60 1.36 �0.01 �0.51 �49.87 (1874–77) 40.41 (1894–97)Greece 0.61 9.85 0.70 1.94 0.01 �0.98 �41.31 (1891–94) 22.61 (1903–06)Italy 0.59 4.15 0.86 4.60 0.00 0.57 �8.54 (1890–93) 12.62 (1883–86)Portugal 0.22 5.97 0.65 1.61 0.00 0.42 �15.51 (1890–93) 17.05 (1900–03)Spain �0.12 6.69 0.83 3.72 — — �25.84 (1895–98) 15.12 (1903–06)Russia 0.22 5.90 0.71 2.02 0.01 1.33 �23.71 (1875–78) 23.53 (1887–90)China �1.29 7.24 0.82 3.49 — — �33.15 (1872–75) 23.14 (1902–05)India 0.07 8.80 0.71 2.02 0.02 2.74 �30.46 (1879–82) 37.96 (1894–97)Japan 0.37 8.44 0.85 4.27 0.01 1.32 �33.53 (1890–93) 24.85 (1894–97)Mexico 0.77 6.08 0.91 7.35 0.01 1.42 �22.25 (1891–94) 21.26 (1907–10)
Periphery mean 0.16 8.47 0.77 2.67 0.01 0.78 �29.60 26.35
France �0.06 2.39 0.61 1.40 — — �6.20 (1898–01) 4.89 (1890–93)Germany 0.53 2.49 0.89 5.95 — — �5.04 (1905–08) 6.99 (1893–96)United Kingdom �0.05 2.08 0.91 7.35 — — �7.49 (1904–07) 9.97 (1891–94)United States �0.25 2.48 0.61 1.40 — — �5.38 (1887–90) 7.86 (1876–79)
Core mean 0.04 2.36 0.76 2.47 — — �6.03 7.43
�g � Mean of annual percentage change of the REER index over the period 1871–1913, except for India and Japan (wherethe respective indices span 1879–1913) and Mexico (where data start in 1877).�g � Standard deviation of the annual percentage change in the respective country’s REER index.� � First-order autoregressive coefficient on the REER, computed in the OLS regression ln(REER)t � � � �ln(REER)t�1 � �t.H � Half-life of deviations from a stationary REER, computed as the ratio of ln(0.5)/ln[�].��gold � Changes in � between on- and off-gold periods.t��gold � t-statistic on the significance of ��gold.Min. g-3 � Minimum value of three-year moving growth rates of REER index in percent.
payments.
Max. g-3 � Maximum value of three-year moving growth rates of REER index in percent.
A key question in this connection is theextent to which these deviations from a con-stant REER were caused by nominal ex-change rate movements rather than changes inrelative national price indices. This can begauged by a simple variance decompositionexercise. Consider the natural log definitionof the REER so that ln(REER) � ln(NEER) �ln(P/P*), where P is the domestic price indexand P* is the trade-weighted foreign price in-dex. Referring to these terms as reer, neer, andprel, applying the variance operator on bothsides, and dividing through by the reer varianceyields
(1)var�neer�
var�reer��
var�prel�
var�reer�
�2 cov�neer, prel�
� 100%
and all the more noteworthy, since most ex-isting price indices for the period give exces-sive weight to tradable goods (see AppendixB), thus tending to underplay the actual am-plitude of the phenomenon. The data alsoshow that despite the disproportionatelylarge tradable goods component in somecountries’ indices, REER movements werepersistent: estimated autoregression coeffi-cients in Table 1 indicate half-life deviationsfrom PPP centered around two-and-a-halfyears, which are within the range of estimatesreported in the empirical literature on devia-tions from PPP, as surveyed by Kenneth S.Rogoff (1996). Such large and protractedreal exchange rate fluctuations are at oddswith the view of Donald N. McCloskey and J.Richard Zecher (1976), which models goldstandard adjustment along the lines of the“monetary approach” to the balance of
var�reer�
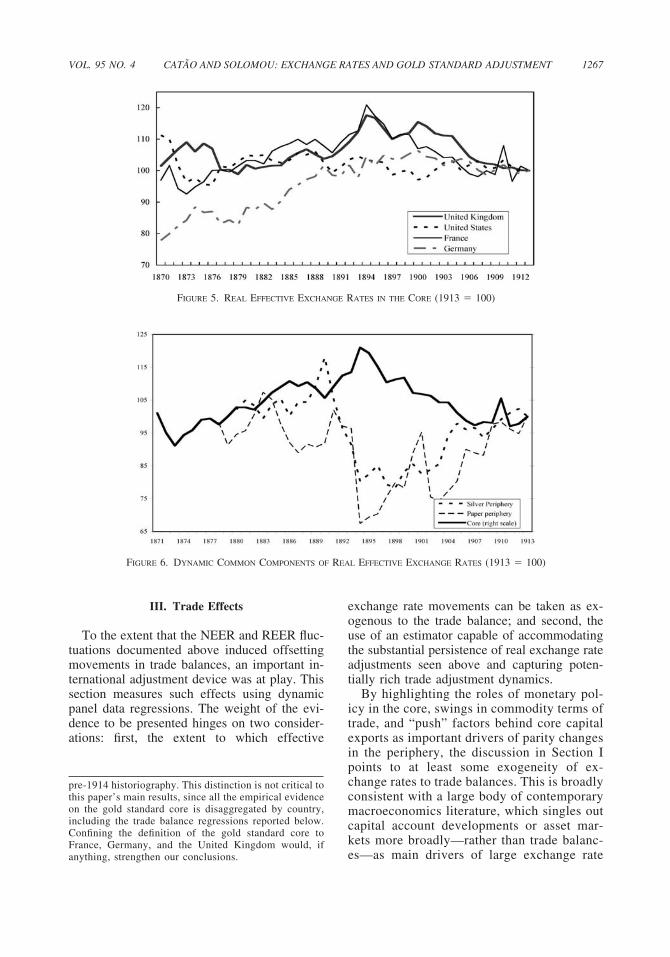
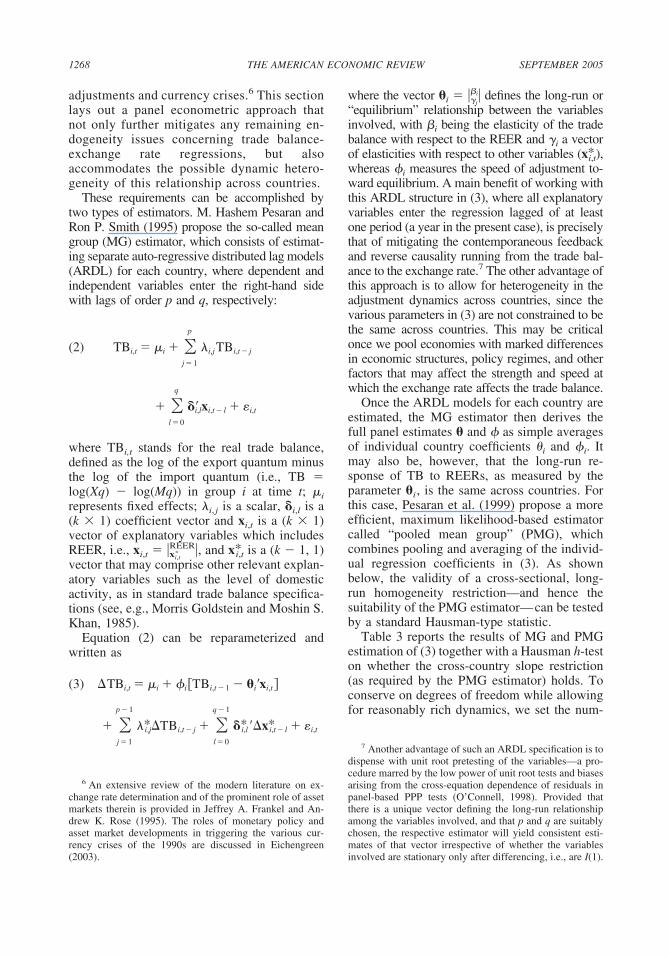
pean core (see Figures 5 and 6).
is classified as a part of the periphery by some of the
1266 THE AMERICAN ECONOMIC REVIEW SEPTEMBER 2005
where the covariance term in (1) is typicallynegative for any positive exchange ratepass-through.
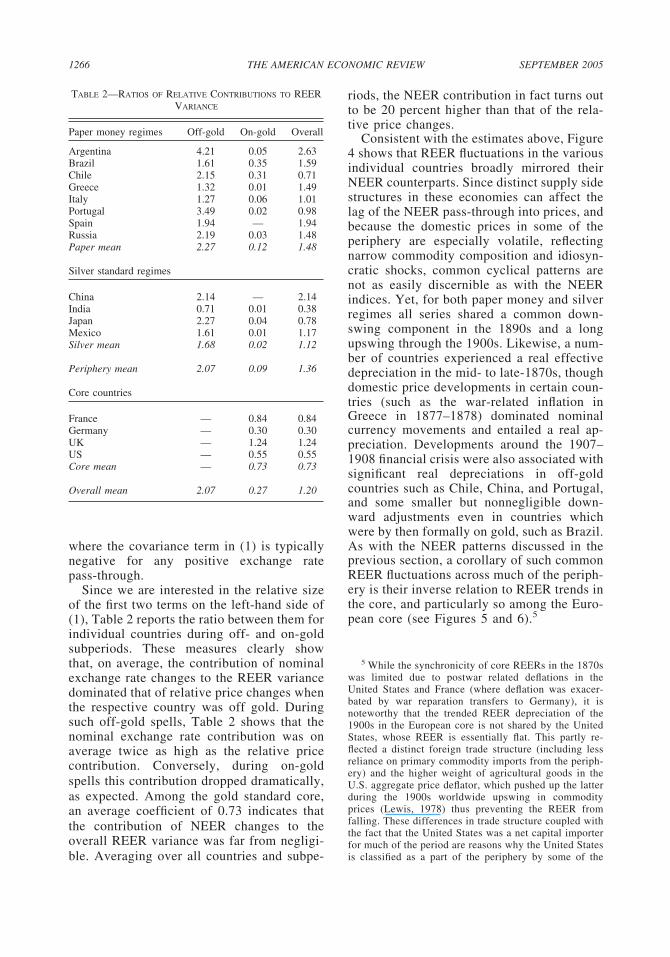
Since we are interested in the relative sizeof the first two terms on the left-hand side of(1), Table 2 reports the ratio between them forindividual countries during off- and on-goldsubperiods. These measures clearly showthat, on average, the contribution of nominalexchange rate changes to the REER variancedominated that of relative price changes whenthe respective country was off gold. Duringsuch off-gold spells, Table 2 shows that thenominal exchange rate contribution was onaverage twice as high as the relative pricecontribution. Conversely, during on-goldspells this contribution dropped dramatically,as expected. Among the gold standard core,an average coefficient of 0.73 indicates thatthe contribution of NEER changes to theoverall REER variance was far from negligi-ble. Averaging over all countries and subpe-
TABLE 2—RATIOS OF RELATIVE CONTRIBUTIONS TO REERVARIANCE
Paper money regimes Off-gold On-gold Overall
Argentina 4.21 0.05 2.63Brazil 1.61 0.35 1.59Chile 2.15 0.31 0.71Greece 1.32 0.01 1.49Italy 1.27 0.06 1.01Portugal 3.49 0.02 0.98Spain 1.94 — 1.94Russia 2.19 0.03 1.48Paper mean 2.27 0.12 1.48
Silver standard regimes
China 2.14 — 2.14India 0.71 0.01 0.38Japan 2.27 0.04 0.78Mexico 1.61 0.01 1.17Silver mean 1.68 0.02 1.12
Periphery mean 2.07 0.09 1.36
Core countries
France — 0.84 0.84Germany — 0.30 0.30UK — 1.24 1.24US — 0.55 0.55Core mean — 0.73 0.73
Overall mean 2.07 0.27 1.20
riods, the NEER contribution in fact turns outto be 20 percent higher than that of the rela-tive price changes.
Consistent with the estimates above, Figure4 shows that REER fluctuations in the variousindividual countries broadly mirrored theirNEER counterparts. Since distinct supply sidestructures in these economies can affect thelag of the NEER pass-through into prices, andbecause the domestic prices in some of theperiphery are especially volatile, reflectingnarrow commodity composition and idiosyn-cratic shocks, common cyclical patterns arenot as easily discernible as with the NEERindices. Yet, for both paper money and silverregimes all series shared a common down-swing component in the 1890s and a longupswing through the 1900s. Likewise, a num-ber of countries experienced a real effectivedepreciation in the mid- to late-1870s, thoughdomestic price developments in certain coun-tries (such as the war-related inflation inGreece in 1877–1878) dominated nominalcurrency movements and entailed a real ap-preciation. Developments around the 1907–1908 financial crisis were also associated withsignificant real depreciations in off-goldcountries such as Chile, China, and Portugal,and some smaller but nonnegligible down-ward adjustments even in countries whichwere by then formally on gold, such as Brazil.As with the NEER patterns discussed in theprevious section, a corollary of such commonREER fluctuations across much of the periph-ery is their inverse relation to REER trends inthe core, and particularly so among the Euro-
5
5 While the synchronicity of core REERs in the 1870swas limited due to postwar related deflations in theUnited States and France (where deflation was exacer-bated by war reparation transfers to Germany), it isnoteworthy that the trended REER depreciation of the1900s in the European core is not shared by the UnitedStates, whose REER is essentially flat. This partly re-flected a distinct foreign trade structure (including lessreliance on primary commodity imports from the periph-ery) and the higher weight of agricultural goods in theU.S. aggregate price deflator, which pushed up the latterduring the 1900s worldwide upswing in commodityprices (Lewis, 1978) thus preventing the REER fromfalling. These differences in trade structure coupled withthe fact that the United States was a net capital importerfor much of the period are reasons why the United States
ations: fi
anything, s
1267VOL. 95 NO ˜
FIGURE 5. REAL EFFECTIVE EXCHANGE RATES IN THE CORE (1913 � 100)
. 4 CATAO AND SOLOMOU: EXCHANGE RATES AND GOLD STANDARD ADJUSTMENT
rst, the extent to which effective
trengthen our conclusions.
FIGURE 6. DYNAMIC COMMON COMPONENTS OF REAL EFFECTIVE EXCHANGE RATES (1913 � 100)
exchange rate movements can be taken as ex-ogenous to the trade balance; and second, theuse of an estimator capable of accommodatingthe substantial persistence of real exchange rateadjustments seen above and capturing poten-tially rich trade adjustment dynamics.
By highlighting the roles of monetary pol-icy in the core, swings in commodity terms oftrade, and “push” factors behind core capitalexports as important drivers of parity changesin the periphery, the discussion in Section Ipoints to at least some exogeneity of ex-change rates to trade balances. This is broadlyconsistent with a large body of contemporarymacroeconomics literature, which singles outcapital account developments or asset mar-kets more broadly—rather than trade balanc-es—as main drivers of large exchange rate
III. Trade Effects
To the extent that the NEER and REER fluc-tuations documented above induced offsettingmovements in trade balances, an important in-ternational adjustment device was at play. Thissection measures such effects using dynamicpanel data regressions. The weight of the evi-dence to be presented hinges on two consider-
pre-1914 historiography. This distinction is not critical tothis paper’s main results, since all the empirical evidenceon the gold standard core is disaggregated by country,including the trade balance regressions reported below.Confining the definition of the gold standard core toFrance, Germany, and the United Kingdom would, if
for reasonably rich dynamics, we set the num-
1268 THE AMERICAN ECONOMIC REVIEW SEPTEMBER 2005
adjustments and currency crises.6 This sectionlays out a panel econometric approach thatnot only further mitigates any remaining en-dogeneity issues concerning trade balance-exchange rate regressions, but alsoaccommodates the possible dynamic hetero-geneity of this relationship across countries.
These requirements can be accomplished bytwo types of estimators. M. Hashem Pesaran andRon P. Smith (1995) propose the so-called meangroup (MG) estimator, which consists of estimat-ing separate auto-regressive distributed lag models(ARDL) for each country, where dependent andindependent variables enter the right-hand sidewith lags of order p and q, respectively:
(2) TBi,t � �i � �j � 1
p
i,jTBi,t � j
� �l � 0
q
��i,lxi,t � l � �i,t
where TBi,t stands for the real trade balance,defined as the log of the export quantum minusthe log of the import quantum (i.e., TB �log(Xq) � log(Mq)) in group i at time t; �irepresents fixed effects; i, j is a scalar, �i,l is a(k � 1) coefficient vector and xi,t is a (k � 1)vector of explanatory variables which includesREER, i.e., xi,t � �xi,t
*REER�, and x*i,t is a (k � 1, 1)
vector that may comprise other relevant explan-atory variables such as the level of domesticactivity, as in standard trade balance specifica-tions (see, e.g., Morris Goldstein and Moshin S.Khan, 1985).
Equation (2) can be reparameterized andwritten as
(3) �TBi,t � �i � iTBi,t � 1 � �i�xi,t
� �p � 1
*i,j�TBi,t � j � �q � 1
�*i,l��x*i,t � l � �i,t
j � 1 l � 0
6 An extensive review of the modern literature on ex-change rate determination and of the prominent role of assetmarkets therein is provided in Jeffrey A. Frankel and An-drew K. Rose (1995). The roles of monetary policy andasset market developments in triggering the various cur-rency crises of the 1990s are discussed in Eichengreen(2003).
where the vector �i � ��i
i� defines the long-run or“equilibrium” relationship between the variablesinvolved, with i being the elasticity of the tradebalance with respect to the REER and �i a vectorof elasticities with respect to other variables (x*i,t),whereas i measures the speed of adjustment to-ward equilibrium. A main benefit of working withthis ARDL structure in (3), where all explanatoryvariables enter the regression lagged of at leastone period (a year in the present case), is preciselythat of mitigating the contemporaneous feedbackand reverse causality running from the trade bal-ance to the exchange rate.7 The other advantage ofthis approach is to allow for heterogeneity in theadjustment dynamics across countries, since thevarious parameters in (3) are not constrained to bethe same across countries. This may be criticalonce we pool economies with marked differencesin economic structures, policy regimes, and otherfactors that may affect the strength and speed atwhich the exchange rate affects the trade balance.
Once the ARDL models for each country areestimated, the MG estimator then derives thefull panel estimates � and as simple averagesof individual country coefficients �i and i. Itmay also be, however, that the long-run re-sponse of TB to REERs, as measured by theparameter �i, is the same across countries. Forthis case, Pesaran et al. (1999) propose a moreefficient, maximum likelihood-based estimatorcalled “pooled mean group” (PMG), whichcombines pooling and averaging of the individ-ual regression coefficients in (3). As shownbelow, the validity of a cross-sectional, long-run homogeneity restriction—and hence thesuitability of the PMG estimator—can be testedby a standard Hausman-type statistic.
Table 3 reports the results of MG and PMGestimation of (3) together with a Hausman h-teston whether the cross-country slope restriction(as required by the PMG estimator) holds. Toconserve on degrees of freedom while allowing
7 Another advantage of such an ARDL specification is todispense with unit root pretesting of the variables—a pro-cedure marred by the low power of unit root tests and biasesarising from the cross-equation dependence of residuals inpanel-based PPP tests (O’Connell, 1998). Provided thatthere is a unique vector defining the long-run relationshipamong the variables involved, and that p and q are suitablychosen, the respective estimator will yield consistent esti-mates of that vector irrespective of whether the variablesinvolved are stationary only after differencing, i.e., are I(1).
˜
TABLE 3—DYNAMIC PANEL ESTIMATES OF TRADE BALANCE ELASTICITIES
(Variables in logs, t-ratios in brackets)
I. Periphery onlyDFE MGE PMGE h-test No. of obs.
A. TB and REER
REER elasticity �0.90 �0.90 �0.92 0.01 464(�3.44) (�3.11) (�8.02) [p � 0.96]
EC coefficient �0.39 �0.58 �0.46(�10.82) (�8.39) (�7.46)
Max. log likelihood 173.37 259.82 233.05
B. TB on REER and real income
REER elasticity �0.91 �0.78 �1.11 1.01 350(�3.93) (�2.21) (�8.85) [p � 0.32]
Yreal elasticity �0.09 �0.39 �0.17 1.17(�1.04) (�1.75) (�2.10) [p � 0.28]
EC coefficient �0.44 �0.74 �0.58(�10.37) (�7.29) (�5.70)
Max. log likelihood 126.91 206.52 168.65
II. All countriesDFE MGE PMGE h-test No. of obs.
A. TB on REER
REER elasticity �0.91 �1.35 �1.00 0.77 559(�6.10) (�3.21) (�8.96) [p � 0.38]
EC coefficient �0.38 �0.50 �0.41(�11.57) (�6.80) (�6.20)
Max. log likelihood 276.30 448.35 417.79
B. TB on REER and real income
REER elasticity �0.99 �1.10 �1.15 0.02 486(�4.49) (�2.98) (�11.13) [p � 0.90]
Yreal elasticity �0.01 �0.38 �0.02 5.24(�0.18) (�2.29) (�0.32) [p � 0.02]
EC coefficient �0.42 �0.76 �0.65(�10.21) (�9.05) (�7.21)
1269VOL. 95 NO. 4 CATAO AND SOLOMOU: EXCHANGE RATES AND GOLD STANDARD ADJUSTMENT
panel. Estimation first spans all periphery
method is subject to the lagged dependent variable bias, but
Max. log likelihood 229.68 406.61 351.96
countries and two alternative specifications: onecorresponds to the bivariate regression of thelog of the export-to-import ratio on the log ofREER and a deterministic trend among the re-gressors;9 the other adds to the latter regression
an index of aggregate economic activity forber of lags to a maximum of 2, i.e., p, q � 2.The estimation period is 1870–1913 for all thecountries where respective REER series beginin 1870; otherwise, the starting point is the firstyear for which the trade volume and relativeprice data become available. In addition, forcomparison purposes, we also report estimatesusing the more standard dynamic fixed-effects(DFE) method, which imposes the same lagstructure (p � q � 1) on all countries across the
8
8 As is well known in the panel data literature, the DFE
this bias goes away in the time series dimension of the data(Nickell, 1981). For a sample such as ours of about 40 or so
time-series observations, this bias is deemed to be small.9 As with the fixed-effect term �i, the coefficient on thetrend is allowed to differ across units. The trend can bethought of as possibly capturing cross-country differencesin supply-side factors that lack a better proxy (given the
dearth of relevant data for several countries during the
1270 THE AMERICAN ECONOMIC REVIEW SEPTEMBER 2005
each country (“Yreal”), also in logs.10 In thebottom half of Table 3, we repeat this exercisefor the whole panel, including both core andperiphery economies.
The results in the upper half of Table 3unanimously indicate that trade flows are sig-nificantly sensitive to REER movements inthe periphery, with the estimated elasticitiesimplying that a one-percentage-point REERappreciation leads to about a one-percentage-point contraction in the ratio of exports toimports— quite a strong effect, consideringthe relatively large magnitude of REER fluc-tuations in some periphery economies. Thespeed of trade balance adjustment, as gaugedby the error correction (EC) coefficient, aver-ages 0.5 across specifications. This implies ahalf-life adjustment of about one year, whichcan be considered as relatively speedy for aperiod in which physical goods and informa-tion traveled far more slowly and at a greatercost than nowadays.11 Comparing across es-timation methods for the periphery-only re-gressions, the Hausman tests indicate that therestriction of a similar REER-trade elasticityacross countries cannot be rejected at conven-tional levels of statistical significance; soPMGEs are more efficient than MGEs and
ought to be preferred. This yields a relativecation that excludes such a deterministic trend.10 A main reason to run separate regressions with and
without Yreal is the relatively poor quality of real GDPdata for most countries during the period and the shortspan of some countries’ GDP series (hence the drop inthe number of observations for the last pair of regressionsshown in Table 3). In addition to income, we haveconsidered an alternative specification which adds anexternal capital flow variable (the U.K. capital exportseries from Stone, 1999), which could possibly pick upother effects of capital inflows on the periphery’s tradebalances not captured by either the REER or the realincome variable. Such a capital flow indicator proved tobe economically and statistically insignificant in the re-gressions, without altering the inferences above regard-ing the REER and income effects. Full results of thisalternative specification are available from the authorsupon request.
11 As a benchmark comparison, a half-life of one year isfar lower than the average speed of convergence to PPP,both using pre- and post-war data as discussed in Section II.A half-life speed of adjustment around one year is compa-rable to that reported in studies using a variety of post–World War II macro data, from money demand to aggregateconsumption equations (see, e.g., Banerjee et al., 1993).
price elasticity of �0.92 in the regressionwithout real income and �1.11 in the regres-sion including real income. Regarding theincome elasticity, estimates across specifica-tions are more heterogeneous but, again, theh-test indicates that the hypothesis of a sim-ilar coefficient across groups cannot be re-jected, yielding the preferred PMGE elasticityestimate of �0.17.
These econometric results square well withnoneconometric evidence available from somecountry-specific studies. For instance, describ-ing the Argentine experience in the early 1890s,Ford (1962) notes that the export sector quicklyand sharply rebounded from the 1890 Baringcrisis (as can be seen from the first panel inAppendix Figure A1) and argues that this un-derpinned the subsequent recovery of domesticeconomic activity. Describing the case of Bra-zil, Fishlow (1989) notes that the 1890–1898depreciation fed import substitution in manu-facturing, thus helping mitigate the effects ofcapital outflows, deteriorating terms of trade ondomestic activity, and paving the way for thesharp turnaround in the trade balance from themid-1890s (see Appendix Figure A1). Catao(2005) documents a similar mechanism in thecase of Mexico. More broadly, our econometricresults are also consistent with Jeffrey B. Nu-gent’s (1973) observation that economies on asilver standard experienced faster foreign tradegrowth than their gold-standard peers during thelate nineteenth century.
Bringing the gold core into the picture cor-roborates this inference about a strong tradebalance response to exchange rate variations.As shown in the bottom half of Table 3, esti-mates of the real exchange rate elasticity of thetrade balance remain statistically significant andaround unity across DF, MG, and PMG estima-tors. Furthermore, this result is robust to a sam-ple breakdown between the pre- and post-1890period: rerunning the panel regressions for theperiod 1870–1890, we also obtain REER elas-ticities around one, which are highly significant
period). The same inferences hold, however, for a specifi-
statistically.12 This indicates that the estimated
12 The respective REER coefficients and associated t-ratios in the regression with REER and trend among thedependent variables for 1870–1890 are: PMGE � �1.11(�8.62); MGE � �1.07 (�3.68); DFE � �0.62 (�1.77).The lower coefficient for the DFE estimator is to be ex-
pected as the sample time span gets shortened, due to the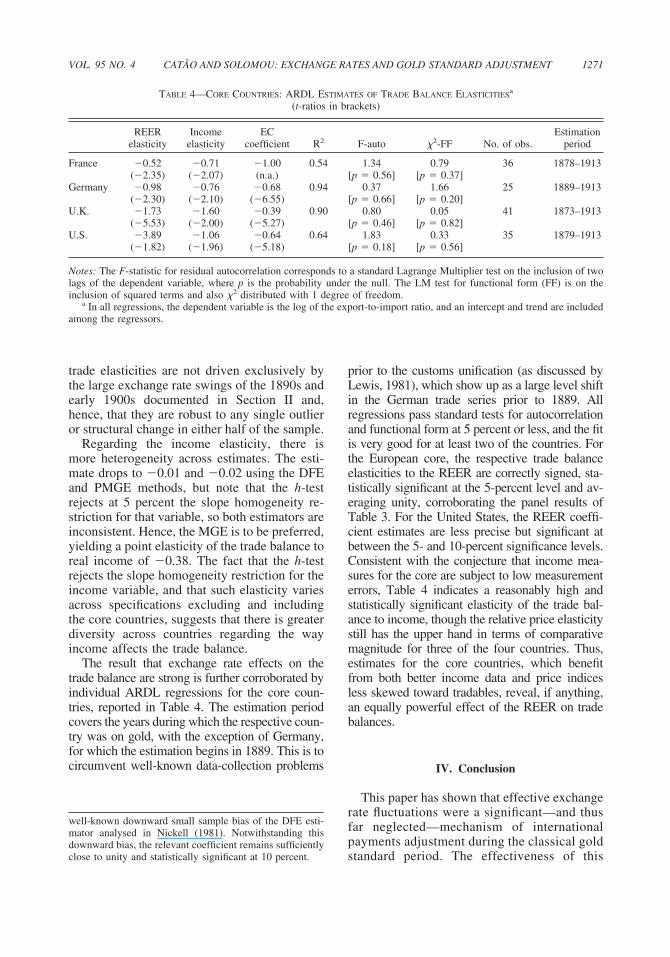
1271VOL. 95 NO. 4 CATAO AND SOLOMOU: EXCHANGE RATES AND GOLD STANDARD ADJUSTMENT
TABLE 4—CORE COUNTRIES: ARDL ESTIMATES OF TRADE BALANCE ELASTICITIESa
(t-ratios in brackets)
REERelasticity
Incomeelasticity
ECcoefficient R2 F-auto �2-FF No. of obs.
Estimationperiod
France �0.52 �0.71 �1.00 0.54 1.34 0.79 36 1878–1913(�2.35) (�2.07) (n.a.) [p � 0.56] [p � 0.37]
Germany �0.98 �0.76 �0.68 0.94 0.37 1.66 25 1889–1913(�2.30) (�2.10) (�6.55) [p � 0.66] [p � 0.20]
U.K. �1.73 �1.60 �0.39 0.90 0.80 0.05 41 1873–1913(�5.53) (�2.00) (�5.27) [p � 0.46] [p � 0.82]
U.S. �3.89 �1.06 �0.64 0.64 1.83 0.33 35 1879–1913(�1.82) (�1.96) (�5.18) [p � 0.18] [p � 0.56]
Notes: The F-statistic for residual autocorrelation corresponds to a standard Lagrange Multiplier test on the inclusion of twolags of the dependent variable, where p is the probability under the null. The LM test for functional form (FF) is on theinclusion of squared terms and also �2 distributed with 1 degree of freedom.
a In all regressions, the dependent variable is the log of the export-to-import ratio, and an intercept and trend are included
circumvent well-known data-collection problems
close to unity and statistically significant at 10 percent.
among the regressors.
prior to the customs unification (as discussed byLewis, 1981), which show up as a large level shiftin the German trade series prior to 1889. Allregressions pass standard tests for autocorrelationand functional form at 5 percent or less, and the fitis very good for at least two of the countries. Forthe European core, the respective trade balanceelasticities to the REER are correctly signed, sta-tistically significant at the 5-percent level and av-eraging unity, corroborating the panel results ofTable 3. For the United States, the REER coeffi-cient estimates are less precise but significant atbetween the 5- and 10-percent significance levels.Consistent with the conjecture that income mea-sures for the core are subject to low measurementerrors, Table 4 indicates a reasonably high andstatistically significant elasticity of the trade bal-ance to income, though the relative price elasticitystill has the upper hand in terms of comparativemagnitude for three of the four countries. Thus,estimates for the core countries, which benefitfrom both better income data and price indicesless skewed toward tradables, reveal, if anything,an equally powerful effect of the REER on tradebalances.
IV. Conclusion
This paper has shown that effective exchangerate fluctuations were a significant—and thusfar neglected—mechanism of internationalpayments adjustment during the classical goldstandard period. The effectiveness of this
trade elasticities are not driven exclusively bythe large exchange rate swings of the 1890s andearly 1900s documented in Section II and,hence, that they are robust to any single outlieror structural change in either half of the sample.
Regarding the income elasticity, there ismore heterogeneity across estimates. The esti-mate drops to �0.01 and �0.02 using the DFEand PMGE methods, but note that the h-testrejects at 5 percent the slope homogeneity re-striction for that variable, so both estimators areinconsistent. Hence, the MGE is to be preferred,yielding a point elasticity of the trade balance toreal income of �0.38. The fact that the h-testrejects the slope homogeneity restriction for theincome variable, and that such elasticity variesacross specifications excluding and includingthe core countries, suggests that there is greaterdiversity across countries regarding the wayincome affects the trade balance.
The result that exchange rate effects on thetrade balance are strong is further corroborated byindividual ARDL regressions for the core coun-tries, reported in Table 4. The estimation periodcovers the years during which the respective coun-try was on gold, with the exception of Germany,for which the estimation begins in 1889. This is to
well-known downward small sample bias of the DFE esti-mator analysed in Nickell (1981). Notwithstanding thisdownward bias, the relevant coefficient remains sufficiently
periphery, and hence NEERs in the core, ad-
1272 THE AMERICAN ECONOMIC REVIEW SEPTEMBER 2005
mechanism stems from two sets of factors.First, it stems from some currency flexibilityin several countries that traded extensivelywith the gold bloc, allowing changes in goldparities during large systemic shocks. In aworld where nominal rigidities were nonneg-ligible and goods market arbitrage was notperfect, the resulting shifts in nominal effec-tive exchange rates could induce significantswings in REERs. Second, this mechanismcould be highly instrumental to external ad-justment insofar as trade was responsive torelative prices. As the estimated elasticitiesabove indicate, the trade account could go along way in adjusting to large terms-of-tradeshocks and “sudden stops” in capital flows,which then, as today, permeated much of thehistory of the international monetary system.
As with the proliferation of transactions inparallel foreign exchange markets during theBretton Woods system discussed by Carmen M.Reinhart and Rogoff (2004), these findings in-dicate that an extra layer of nominal flexibilitywas also present in the pre-1914 internationalmonetary system—even if coming through thesystem’s “back door.” From the periphery view-point, exchange rate flexibility allowed coun-tries to accomplish significant trade balanceadjustments during major shocks without re-quiring wage and price deflation. In severalcountries for which the evidence exists, suchcurrency depreciations speeded up the recoveryof exports and helped insulate domestic activity,in a similar fashion as the early abandonment ofgold in the 1930s did (see Eichengreen andJeffrey Sachs, 1985; Ben S. Bernanke andKevin Carey, 1996).
From the perspective of the core, exchangerate flexibility in the periphery facilitated inter-national relative price adjustment, while main-taining the monetary stability required for thepreservation of the gold peg. For instance, dur-ing periods of capital reflows and recovery inthe domestic investment cycle, the concomitantdevaluations in the periphery would prove in-strumental to a benign price environment athome through falling import prices. Conversely,during periods of strong capital outflows, risingactivity and prices abroad would mitigate thedeflationary effects of weaker investment athome. Among other things, this obviated theneed for the kind of massive monetary steriliza-tion by central banks often observed in the
post–World War II world. As such, exchangerate flexibility in the periphery seems to helpexplain a key puzzle of the classical gold stan-dard noted by Richard S. Sayers (1976) andDonald E. Moggridge (1987), namely, how sig-nificant relative price adjustments were accom-plished without jeopardizing the gold peg in theabsence of massive reserve accumulation by thecore central banks.
These results raise the question of howimportant the adjustment mechanism high-lighted in this paper was vis-a-vis those pre-viously discussed in the literature. Estimatesprovided in Section II suggest that nominalparity adjustments were no less importantthan relative price flexibility in accounting forREER variance over the entire period. On theone hand, this puts the highlighted mecha-nism at least at par with the traditional priceflexibility/specie-flow channel. On the otherhand, this suggests that while nominal rigid-ities in the pre-1914 period may have beenlower than during much of the twentieth cen-tury, thus facilitating international adjust-ment, such rigidities were doubtless present,so nominal parity fluctuations had a role toplay in quantity adjustments.
The evidence presented in this paper alsosheds new light on two aspects of the contro-versial reinterpretation of the gold standardadjustment mechanism by Triffin (1964).First, while we show that nominal exchangerate adjustment dominated price movementsin their contemporaneous contribution toREER variance, the contribution of relativeprice variance was far from negligible. This isconsistent with both the gradual working ofgoods market arbitrage and the traditionalprice-specie-flow mechanism dismissed byTriffin. Second, our econometric estimates in-dicate that not only were relative pricechanges key to trade balance adjustment; theyalso generally contributed more than the in-come effects emphasized by Triffin and otherearlier studies, such as Ford (1962) and Fur-tado (1963).
Finally, regarding the importance of theexchange rate/relative price mechanism vis-a-vis international labor migration, three con-siderations seem key. First is that of relativespeed: the evidence for the various countriesindicates that nominal gold parities in the
1273VOL. 95 NO. 4 CATAO AND SOLOMOU: EXCHANGE RATES AND GOLD STANDARD ADJUSTMENT
justed promptly to large shocks. While for anumber of countries migration flows aredeemed to have been an important mechanismof labor market adjustment, as shown byJerome (1926) and Hatton and Williamson(1998), their impact on balance-of-paymentsadjustment, via indirect income effects in-duced by the economic-demographic interac-tions, was bound to be gradual. Second, asnoted by Blanca Sanchez-Alonso (2000), mi-gration itself can be influenced by exchangerate developments. For instance, large ex-change rate depreciations in the peripherydiscourage migration not only by helping fos-ter domestic production of labor-intensive im-port substitutes, but also by raising the cost oftransatlantic voyages. Furthermore, by raisingthe cost of workers’ remittances to the homecountry, exchange rate depreciations in someof the labor-importing periphery may havediscouraged both fresh immigration and re-mittance flows by the existing stock of immi-grants, though the current dearth of foreignremittance data for the period precludes moredefinite statements. Third, there appears tohave been some substitutability between theexchange rate and international migrationmechanisms. For instance, the most cited andsuccessful example of emigration as a cycli-cal adjustment device during the period refersto Scandinavian countries (see Hatton andWilliamson, 1998, p. 19 and pp. 67– 68).Since these countries stuck to gold throughoutand conducted nearly all of their trade withother gold countries, the exchange rate adjust-ment mechanism was simply not available tothem, either directly (through the manage-ment of their own currency) or indirectly(through currency flexibility among tradingpartners).13 In these circumstances, it is notsurprising that migration would become a keyadjustment device. This contrasts with the
case of several periphery countries (notably13 The NEER indices for Norway and Sweden (coveringabout 80 percent of trade in the former and 95 percent in thelatter) show variations within a very narrow, 2-percent bandover 1870–1913. The respective standard deviations ofREER percentage changes are also relatively small at 2.6percent and 2.3 percent a year, thus far lower than innon-gold periphery countries (see Table 1). When measuredin levels rather than in percentage changes, the variances ofthe REER indices for Norway and Sweden are also lowerthan those of the European gold core.
India, Japan, and Russia in our sample) whereboth immigration and emigration rates werevery low and thus not relevant as adjustmentdevices.
In a nutshell, while future research is likely tocontinue to improve our understanding of therelative contribution of these distinct channelsto the classical gold standard operation, twoconclusions are warranted. First, nominal ex-change rate flexibility in the non-gold bloc wasinstrumental in systemic adjustment during theperiod. Second, this effective exchange ratechannel is best seen as complementary ratherthan as a substitute for the other mechanismsemphasized in the earlier literature. Operatingdifferentially across countries but together on asystem-wide perspective, they provided themuch-needed grease to the wheels of the inter-national monetary system in its ability to copewith capital flow and commodity price shocksthat continue to afflict us to this day.
REFERENCES
Acena, Pablo M. and Reis, Jaime. Monetary stan-dards in the periphery: Paper, silver andgold, 1854–1933. London: Macmillan Press,2000.
Banerjee, Anindya; Dolado, Juan J.; Galbraith,John W. and Hendry, David F. Co-integration,error correction, and the econometric analy-sis of non-stationary data. Oxford: OxfordUniversity Press, 1993.
Bayoumi, Tamim and Eichengreen, Barry. “TheStability of the Gold Standard and the Evo-lution of the International Monetary System,”in Tamim Bayoumi, Barry Eichengreen, andMark P. Taylor, eds., Modern perspectives onthe gold standard. Cambridge: CambridgeUniversity Press, 1996, pp. 165–88.
Bernanke, Ben S. and Carey, Kevin. “NominalWage Stickiness and Aggregate Supply in theGreat Depression.” Quarterly Journal ofEconomics, 1996, 111(3), pp. 853–83.
Bordo, Michael D. “The Gold Standard, BrettonWoods and Other Monetary Regimes: A His-torical Appraisal.” Federal Reserve Bank ofSt. Louis Review, 1993, 75(2), pp. 123–91.
Bordo, Michael D. and Rockoff, Hugh. “The GoldStandard as a ‘Good Housekeeping Seal ofApproval.’ ” Journal of Economic History,1996, 56(2), pp. 389–428.
Lopez-Cordova, J. Ernesto and Meissner, Chris-
1274 THE AMERICAN ECONOMIC REVIEW SEPTEMBER 2005
Bordo, Michael D. and Schwartz, Anna J. A ret-rospective on the classical gold standard,1821–1931. Chicago: University of ChicagoPress, 1984.
Cairncross, Alec K. Home and foreign invest-ment, 1870–1913. Cambridge: CambridgeUniversity Press, 1953.
Catao, Luis A. V. “Exchange Rate and Machin-ery Investment in Early Development: TheCases of Brazil and Mexico.” UnpublishedPaper, 2005.
Clemens, Michael A. and Williamson, Jeffrey G.“Wealth Bias in the First Global Capital Mar-ket Boom, 1870–1913.” Economic Journal,2004, 114(495), pp. 304–37.
De Long, J. Bradford. “Financial Crises in the1890s and the 1990s: Must History Repeat?”in William C. Brainard and George L. Perry,eds., Brookings papers on economic activity:99:2. Washington, DC: Brookings InstitutionPress, 1999, pp. 253–79.
Edelstein, Michael. Overseas investment in theage of high imperialism. London: Methuen &Co., 1982.
Eichengreen, Barry. “The Gold Standard sinceAlec Ford,” in Stephen N. Broadberry andNicholas F. R. Crafts, eds., Britain in theinternational economy 1870–1939. Cam-bridge: Cambridge University Press, 1992,pp. 49–79.
Eichengreen, Barry. Capital flows and crises.Cambridge, MA: MIT Press, 2003.
Eichengreen, Barry and Flandreau, Marc, eds.,The gold standard in theory and history. 2nd
ed. London: Routledge, 1997.Eichengreen, Barry and Sachs, Jeffrey. “Ex-
change Rates and Economic Recovery in the1930s.” Journal of Economic History, 1985,45(4), pp. 925–46.
Fishlow, Albert. “Conditionality and Willing-ness to Pay: Some Parallels from the 1890s,”in Barry J. Eichengreen and Peter H. Lindert,eds., The international debt crisis in histori-cal perspective. Cambridge, MA: MIT Press,1989, pp. 86–105.
Flandreau, Marc. “The French Crime of 1873:An Essay on the Emergence of the Interna-tional Gold Standard, 1870–1880.” Journalof Economic History, 1996, 56(4), pp. 862–97.
Ford, Alec G. The gold standard 1880–1914:Britain and Argentina. Oxford: ClarendonPress, 1962.
Frankel, Jeffrey A. and Rose, Andrew K. “Em-pirical Research on Nominal ExchangeRates,” in Gene M. Grossman and KennethRogoff, eds., Handbook of international eco-nomics, Vol. 3. Amsterdam: Elsevier, North-Holland, 1995, pp. 1689–1729.
Friedman, Milton. “Franklin D. Roosevelt, Sil-ver, and China.” Journal of Political Econ-omy, 1992, 100(1), pp. 62–83.
Furtado, Celso. The economic growth of Brazil:A survey from colonial to modern times.Berkeley: University of California Press,1963.
Goldstein, Morris and Khan, Moshin S. “Incomeand Price Effects in Foreign Trade,” in Ro-nald W. Jones and Peter B. Kenen, eds.,Handbook of international economics, Vol.II. Amsterdam: North-Holland, 1985, pp.1041–1105.
Gordon, Robert J. “A Century of Evidence onWage and Price Stickiness in the US, theUK and Japan,” in James Tobin, ed., Macro-economics, prices and quantities. Wash-ington, DC: Brookings Institution Press,1983.
Hatton, Timothy J. and Williamson, Jeffrey G.,eds. Migration and the international labormarket, 1850–1939. London: Routledge,1994.
Hatton, Timothy J. and Williamson, Jeffrey G.The age of mass migration: Causes and eco-nomic impact. Oxford: Oxford UniversityPress, 1998.
Jerome, Harry. Migration and business cycles.New York: National Bureau of EconomicResearch, 1926.
Kim, Chang-Jin and Nelson, Charles R. State-space models with regime switching: Classi-cal and Gibbs-sampling approaches withapplications. Cambridge, MA: MIT Press,1999.
Kindleberger, Charles P. Manias, panics andcrashes: A history of financial crises. NewYork: Basic Books, 1978.
Lewis, W. Arthur. Growth and fluctuations,1870–1913. London: George Allen and Un-win, 1978.
Lewis, W. Arthur. “The Rate of Growth ofWorld Trade, 1830–1973,” in Sven Grass-mann and Erik Lundberg, eds., The worldeconomic order: Past and prospects. Lon-don: Macmillan, 1981.
1275VOL. 95 NO. 4 CATAO AND SOLOMOU: EXCHANGE RATES AND GOLD STANDARD ADJUSTMENT
topher M. “Exchange-Rate Regimes andInternational Trade: Evidence from the Clas-sical Gold Standard Era.” American Eco-nomic Review, 2003, 93(1), pp. 344–53.
McCloskey, Donald N. and Zecher, J. Richard.“How the Gold Standard Worked,1880–1913,” in Jacob A. Frankel and HarryG. Johnson, eds., The Monetary approach tothe balance of payments. London: GeorgeAllen and Unwin, 1976, pp. 64–81.
Moggridge, Don. “Problems in the History of theInternational Economy since 1870: The GoldStandard.” Unpublished Paper, 1987.
Nickell, Stephen J. “Biases in Dynamic Modelswith Fixed Effects.” Econometrica, 1981,49(6), pp. 1417–26.
Nugent, Jeffrey B. “Exchange-Rate Movementsand Economic Development in the LateNineteenth Century.” Journal of PoliticalEconomy, 1973, 81(5), pp. 1110–35.
Obstfeld, Maurice and Taylor, Alan M. “Sover-eign Risk, Credibility and the Gold Standard:1870–1913 versus 1925–31.” EconomicJournal, 2003, 113(487), pp. 241–75.
O’Connell, Paul G. J. “The Overvaluation ofPurchasing Power Parity.” Journal ofInternational Economics, 1998, 44(1), pp.1–19.
O’Rourke, Kevin H. and Williamson, Jeffrey G.Globalization and history: The evolution of anineteenth-century Atlantic economy. Cam-bridge, MA: MIT Press, 1999.
Pesaran, M. Hashem; Shin, Yongcheol and Smith,Ron P. “Pooled Mean Group Estimation ofDynamic Heterogeneous Panels.” Journal ofthe American Statistical Association, 1999,94(446), pp. 621–34.
Pesaran, M. Hashem and Smith, Ron P. “Estimat-ing Long-Run Relationships from DynamicHeterogeneous Panels.” Journal of Econo-metrics, 1995, 68(1), pp. 79–113.
Reinhart, Carmen M. and Rogoff, Kenneth S. “The
Modern History of Exchange Rate Arrange-ments: A Reinterpretation.” Quarterly Journalof Economics, 2004, 119(1), pp. 1–48.
Rogoff, Kenneth S. “The Purchasing Power Par-ity Puzzle.” Journal of Economic Literature,1996, 34(2), pp. 647–68.
Sanchez-Alonso, Blanca. “European Emigrationin the Late Nineteenth Century: The Paradox-ical Case of Spain.” Economic History Re-view, 2000, 53(2), pp. 309–30.
Sayers, Richard S. The Bank of England, 1891–1944, Vol. 2. Cambridge: Cambridge Univer-sity Press, 1976.
Solomou, Solomos N. “Business Cycles,” in JoelMokyr, ed., The Oxford encyclopedia of eco-nomic history. New York: Oxford UniversityPress, 2003.
Stock, James H. and Watson, Mark W. “NewIndexes of Coincident and Leading Eco-nomic Indicators,” in Oliver J. Blanchard andStanley Fischer, eds., NBER macroeconomicsannual: 1989. Cambridge, MA: MIT Press,1989, pp. 351–94.
Stock, James H. and Watson, Mark W. “A Prob-ability Model of the Coincident EconomicIndicators,” in Kajal Lahiri and George H.Moore, eds., Leading economic indicators:New approaches and forecasting records.Cambridge: Cambridge University Press,1991, pp. 63–90.
Stone, Irving. The global export of capital fromGreat Britain, 1865–1914: A statistical sur-vey. New York: St. Martin’s Press, 1999.
Thomas, Brinley. Migration and economicgrowth: A study of Great Britain and theAtlantic community. Cambridge: CambridgeUniversity Press, 1973.
Triffin, Robert. The evolution of the interna-tional monetary system: Historical reap-praisal and future perspectives. PrincetonStudies in International Finance, No. 12.
Princeton: Princeton University Press, 1964.
Related Documents