This article appeared in a journal published by Elsevier. The attached copy is furnished to the author for internal non-commercial research and education use, including for instruction at the authors institution and sharing with colleagues. Other uses, including reproduction and distribution, or selling or licensing copies, or posting to personal, institutional or third party websites are prohibited. In most cases authors are permitted to post their version of the article (e.g. in Word or Tex form) to their personal website or institutional repository. Authors requiring further information regarding Elsevier’s archiving and manuscript policies are encouraged to visit: http://www.elsevier.com/authorsrights

Welcome message from author
This document is posted to help you gain knowledge. Please leave a comment to let me know what you think about it! Share it to your friends and learn new things together.
Transcript
This article appeared in a journal published by Elsevier. The attachedcopy is furnished to the author for internal non-commercial researchand education use, including for instruction at the authors institution
and sharing with colleagues.
Other uses, including reproduction and distribution, or selling orlicensing copies, or posting to personal, institutional or third party
websites are prohibited.
In most cases authors are permitted to post their version of thearticle (e.g. in Word or Tex form) to their personal website orinstitutional repository. Authors requiring further information
regarding Elsevier’s archiving and manuscript policies areencouraged to visit:
http://www.elsevier.com/authorsrights
Author's personal copy
CERAMICSINTERNATIONAL
Available online at www.sciencedirect.com
Ceramics International 40 (2014) 1971–1977
Effect of Y3+ substitution on structural, electrical and optical properties ofBiFeO3 ceramics
Vikash Singh, Subhash Sharma, Pardeep K. Jha, Manoj Kumar, R.K. Dwivedin
Department of Physics and Materials Science and Engineering, Jaypee Institute of Information Technology, Noida 201307, India
Received 9 May 2013; received in revised form 27 June 2013; accepted 14 July 2013Available online 27 July 2013
Abstract
Bi1�xYxFeO3 ceramics with compositions x¼0.00, 0.05, 0.10, 0.15 and 0.20 were synthesized by the solid state reaction route. All thecompositions have shown single phase formation with minor impurities. Microstructural studies reveal that Y3+ substitution influences graingrowth, which in turn affects the dielectric and optical properties of these materials. Dielectric anomalies in temperature dependent dielectric plotsat around the magnetic transition temperature (TN) indicate magneto-electric coupling. Ac conductivity has been found to decrease withincreasing Y3+ concentration. FTIR spectra show two broad absorption bands due to the overlapping of Fe-O and Bi-O group′s vibrations in theregion 400–700 cm�1. The photoluminescence spectra of these ceramics exhibit band edge emission at 458 nm (2.67 eV) in blue region.The emission in green region may be attributed to the transitions related to the defects and Y3+ ions.& 2013 Elsevier Ltd and Techna Group S.r.l. All rights reserved.
Keywords: X-ray diffraction; Dielectric and optical properties
1. Introduction
Present soar of interest in multiferroics is due to coexistence offerroelectric, antiferromagnetic and/or ferroelastic ordering simulta-neously at room temperature. Existence of these two polar ordersare expected to provide potential for technological applications andunderstanding of the inherent new physics underlying multiferroicbehavior [1,2]. BiFeO3 (BFO) is one of the most investigatedmultiferroics in which lone pair electrons of Bi3+ are responsiblefor ferroelectricity, and partially filled d orbitals of Fe3+ ioncontribute to the magnetic ordering in bismuth ferrite [2]. BiFeO3
possesses magnetic order of anti-ferromagnetic (AFM) type belowNeel temperature (TN) ∼640 K and ferroelectric order below Curietemperature (TC) ∼1103 K [3–5]. The crystal structure of theBiFeO3 has been reported to be distorted rhombohedral withR3c space group symmetry, which allows anti-phase octahedraltilting and ionic displacements from the centrosymmetric position.The R3c symmetry has permitted the existence of weak ferromag-netic moments, because a cycloid type spatial spin modulation
superimposed to the G-type antiferromagnetic spin order, preventsthe observation of net magnetization [6,7].The possibility to suppress the spin modulation with a
partial A-site ionic substitution has motivated numerousstudies of Bi1�xAxFeO3 compounds where the substitutingelements are rare earth elements. These substitutions areexpected to influence the properties and offer the way forelucidating of the powerful mechanism of the ferroelectricityand it is coupling to the magnetic order in multiferroics [8–11].In view of the above, the substitution of a non rare earth Y3+
ion (ionic radius∼0.90 Å) in place of Bi3+ ion (ionic radius∼1.03 Å) could be explored as one of the worthful studies onstructural, electrical and optical properties in multiferroics.In the present paper, we have synthesized Bi1�xYxFeO3
ceramics with x≤0.20 by the solid state reaction method. Asystematic study of the effect of Y3+ doping on the structure,dielectric and optical properties of BiFeO3 has been reported.
2. Experimental details
Bi1�xYxFeO3 ceramics with x=0.00, 0.05, 0.10, 0.15 and0.20 were synthesized by the solid state reaction method. Highpurity powders of bismuth oxide (Bi2O3 ∼99.99%, Aldrich),
www.elsevier.com/locate/ceramint
0272-8842/$ - see front matter & 2013 Elsevier Ltd and Techna Group S.r.l. All rights reserved.http://dx.doi.org/10.1016/j.ceramint.2013.07.106
nCorresponding author. Tel.: +91 120 2594366; fax: +91 120 2400986.E-mail addresses: [email protected],
[email protected] (R.K. Dwivedi).
Author's personal copy
iron oxide (Fe2O3 ∼99.99%, Aldrich) and yttrium oxide(Y2O3 ∼99.99%, Aldrich) were used as starting materials. Inorder to obtain phase-pure and dense samples, appropriatesintering temperatures were carefully selected from 820–830 1C for 2 h with varying amounts of Y3+ substitutions.X-ray diffraction (XRD) patterns of sintered samples wererecorded at room temperature using an X-ray Powder Dif-fractometer (Bruker D8 Advance) with Cu Kα radiation(1.5418 Å). Microstructure of the synthesized sampleshas been studied using scanning electron microscope (SEM)and the average grain size has been determined using lineintercept method. For this, it is necessary to count the numberof grains intersected by each of these line segments. Averageline length intersection is calculated according to the followingrelation:
ave: line length intersection ¼ length of the line drawn on SEM imageave: no: of grain boundary intersections
Average grain size ‘d’ can be obtained using the formula asgiven below:
d ¼ ave: line length intersectedmagnification
Dielectric measurements from room temperature to 550 1C atdeferent frequencies were carried out using an automated LCRMeter (HIOKI 3532-50 Hi Tester). Room temperaturephotoluminescence emission spectra were recorded by PerkinElmer LS55. Fourier transformed infrared spectroscopy(FTIR) was employed to study various vibrational bands in Y3+
ions substituted BFO ceramics using Perkin Elmer BXIIspectrometer.
3. Results and discussion
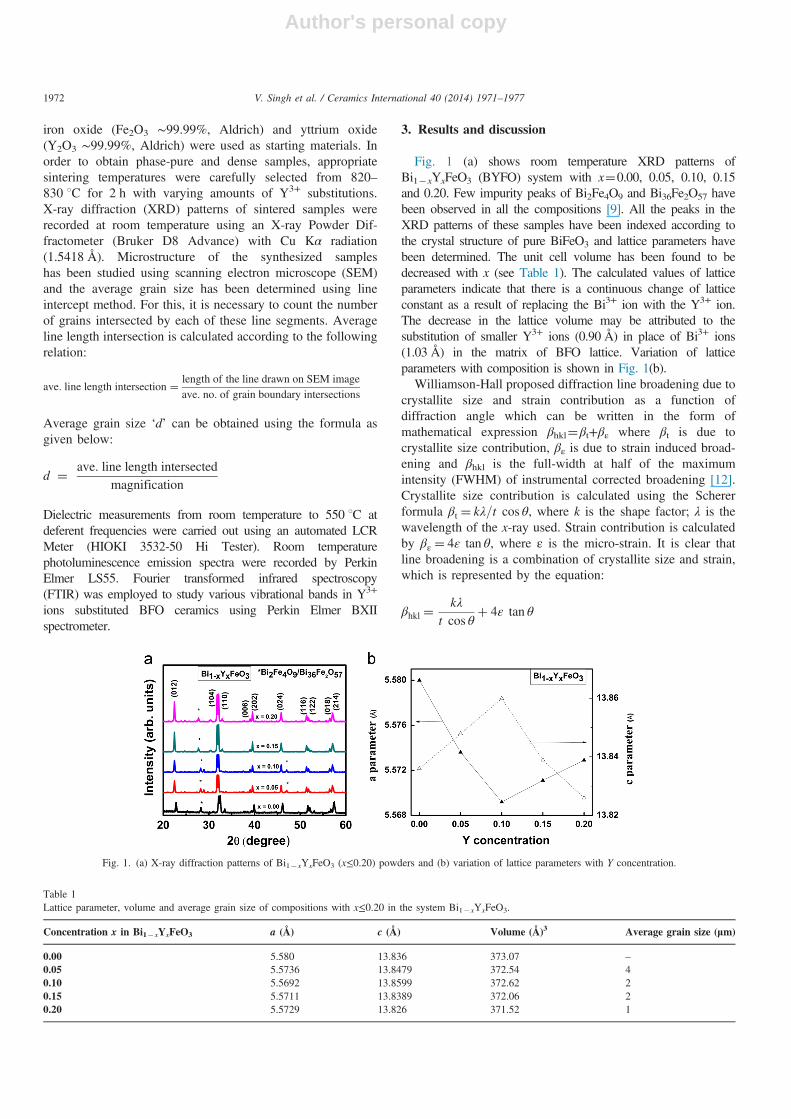
Fig. 1 (a) shows room temperature XRD patterns ofBi1�xYxFeO3 (BYFO) system with x¼0.00, 0.05, 0.10, 0.15and 0.20. Few impurity peaks of Bi2Fe4O9 and Bi36Fe2O57 havebeen observed in all the compositions [9]. All the peaks in theXRD patterns of these samples have been indexed according tothe crystal structure of pure BiFeO3 and lattice parameters havebeen determined. The unit cell volume has been found to bedecreased with x (see Table 1). The calculated values of latticeparameters indicate that there is a continuous change of latticeconstant as a result of replacing the Bi3+ ion with the Y3+ ion.The decrease in the lattice volume may be attributed to thesubstitution of smaller Y3+ ions (0.90 Å) in place of Bi3+ ions(1.03 Å) in the matrix of BFO lattice. Variation of latticeparameters with composition is shown in Fig. 1(b).Williamson-Hall proposed diffraction line broadening due to
crystallite size and strain contribution as a function ofdiffraction angle which can be written in the form ofmathematical expression βhkl¼βt+βε where βt is due tocrystallite size contribution, βε is due to strain induced broad-ening and βhkl is the full-width at half of the maximumintensity (FWHM) of instrumental corrected broadening [12].Crystallite size contribution is calculated using the Schererformula βt ¼ kλ=t cos θ, where k is the shape factor; λ is thewavelength of the x-ray used. Strain contribution is calculatedby βε ¼ 4ε tan θ, where ε is the micro-strain. It is clear thatline broadening is a combination of crystallite size and strain,which is represented by the equation:
βhkl ¼kλ
t cos θþ 4ε tan θ
Fig. 1. (a) X-ray diffraction patterns of Bi1�xYxFeO3 (x≤0.20) powders and (b) variation of lattice parameters with Y concentration.
Table 1Lattice parameter, volume and average grain size of compositions with x≤0.20 in the system Bi1�xYxFeO3.
Concentration x in Bi1�xYxFeO3 a (Å) c (Å) Volume (Å)3 Average grain size (lm)
0.00 5.580 13.836 373.07 –
0.05 5.5736 13.8479 372.54 40.10 5.5692 13.8599 372.62 20.15 5.5711 13.8389 372.06 20.20 5.5729 13.826 371.52 1
V. Singh et al. / Ceramics International 40 (2014) 1971–19771972
Author's personal copy
This is further simplified as
βhkl cos θhkl ¼kλ
tþ 4ε sin θhkl
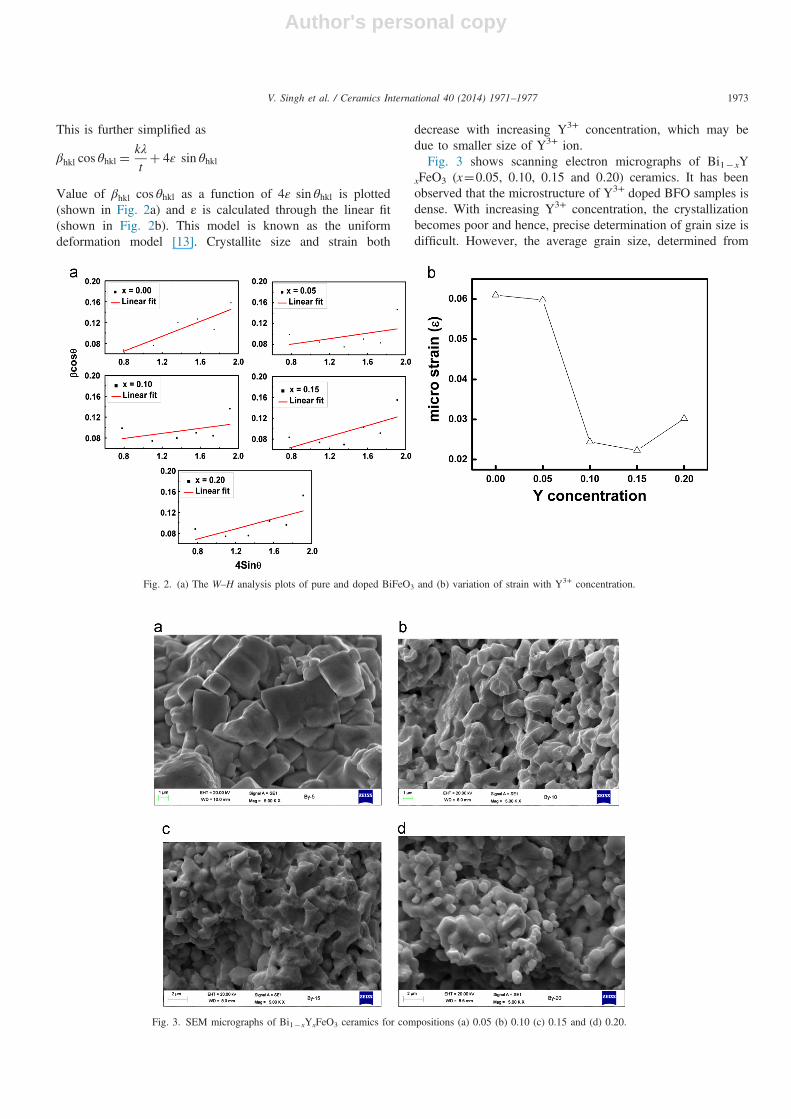
Value of βhkl cos θhkl as a function of 4ε sin θhkl is plotted(shown in Fig. 2a) and ε is calculated through the linear fit(shown in Fig. 2b). This model is known as the uniformdeformation model [13]. Crystallite size and strain both
decrease with increasing Y3+ concentration, which may bedue to smaller size of Y3+ ion.Fig. 3 shows scanning electron micrographs of Bi1�xY
xFeO3 (x¼0.05, 0.10, 0.15 and 0.20) ceramics. It has beenobserved that the microstructure of Y3+ doped BFO samples isdense. With increasing Y3+ concentration, the crystallizationbecomes poor and hence, precise determination of grain size isdifficult. However, the average grain size, determined from
Fig. 2. (a) The W–H analysis plots of pure and doped BiFeO3 and (b) variation of strain with Y3+ concentration.
Fig. 3. SEM micrographs of Bi1�xYxFeO3 ceramics for compositions (a) 0.05 (b) 0.10 (c) 0.15 and (d) 0.20.
V. Singh et al. / Ceramics International 40 (2014) 1971–1977 1973
Author's personal copy
line intercept method is given in the Table 1, which has beenfound to decrease with x. Average grain size in all the samplesis less than 4 mm and almost spherical grains are observed forthe sample with x¼0.20.
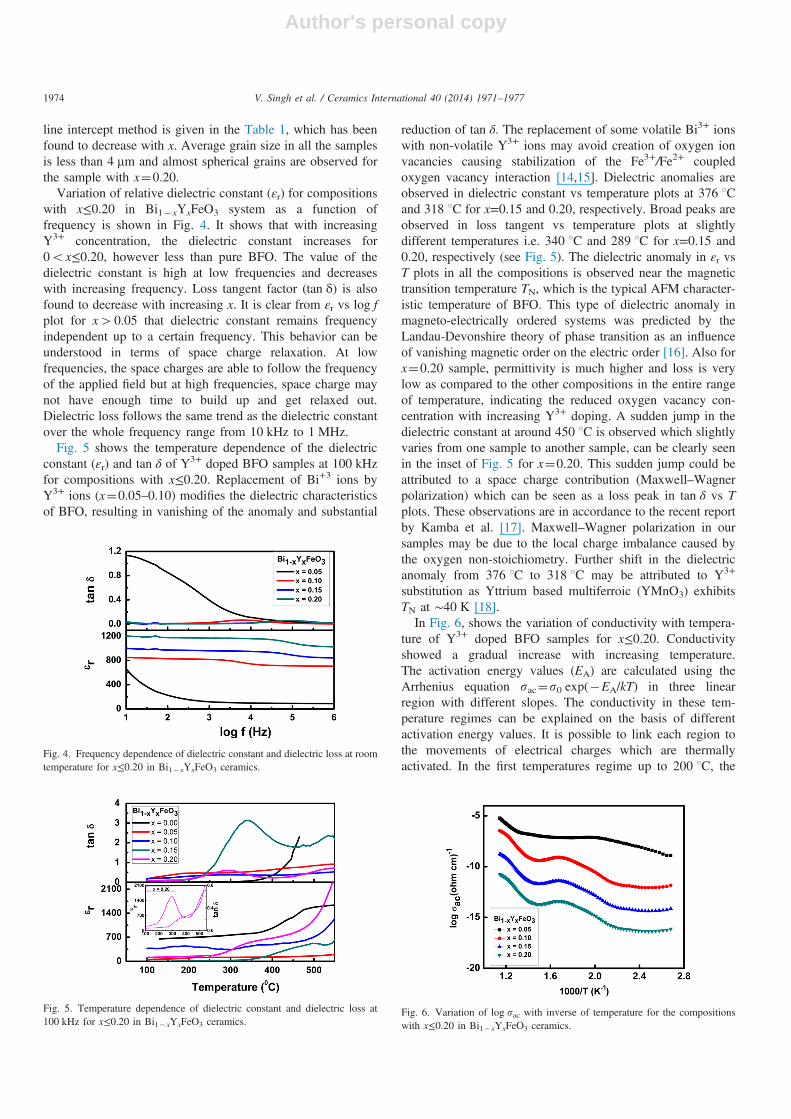
Variation of relative dielectric constant (εr) for compositionswith x≤0.20 in Bi1�xYxFeO3 system as a function offrequency is shown in Fig. 4. It shows that with increasingY3+ concentration, the dielectric constant increases for0ox≤0.20, however less than pure BFO. The value of thedielectric constant is high at low frequencies and decreaseswith increasing frequency. Loss tangent factor (tan δ) is alsofound to decrease with increasing x. It is clear from εr vs log fplot for x40.05 that dielectric constant remains frequencyindependent up to a certain frequency. This behavior can beunderstood in terms of space charge relaxation. At lowfrequencies, the space charges are able to follow the frequencyof the applied field but at high frequencies, space charge maynot have enough time to build up and get relaxed out.Dielectric loss follows the same trend as the dielectric constantover the whole frequency range from 10 kHz to 1 MHz.
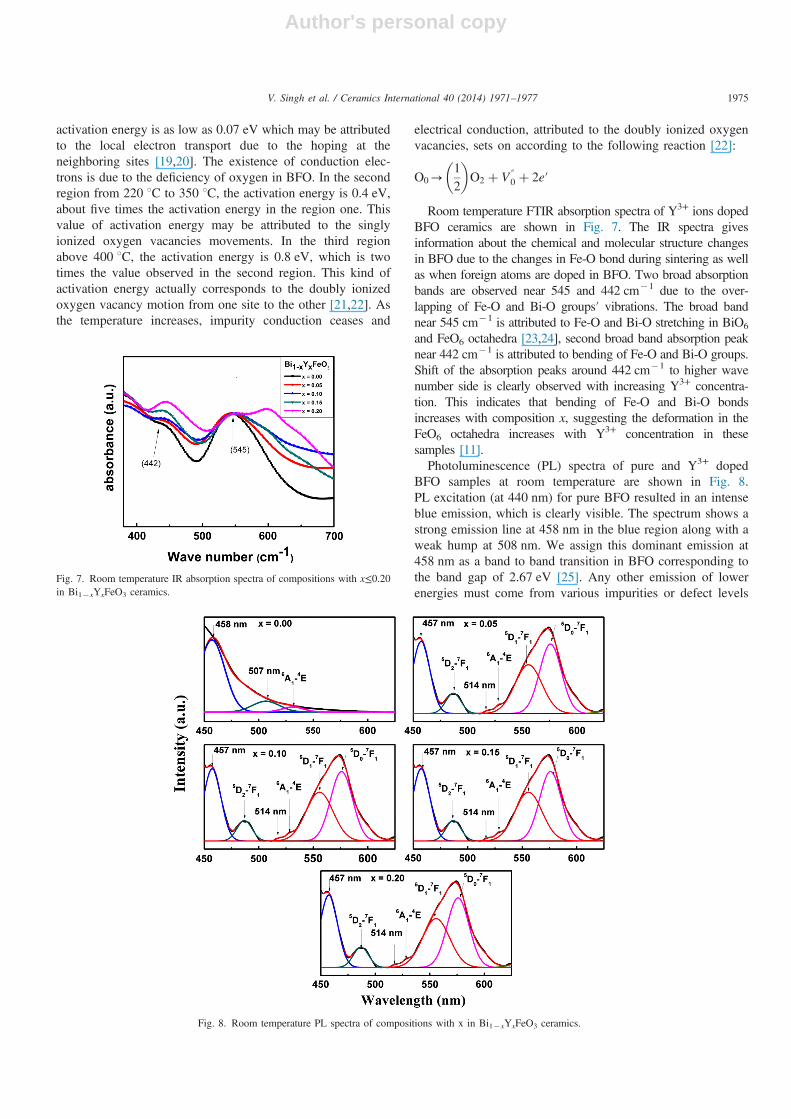
Fig. 5 shows the temperature dependence of the dielectricconstant (εr) and tan δ of Y3+ doped BFO samples at 100 kHzfor compositions with x≤0.20. Replacement of Bi+3 ions byY3+ ions (x¼0.05–0.10) modifies the dielectric characteristicsof BFO, resulting in vanishing of the anomaly and substantial
reduction of tan δ. The replacement of some volatile Bi3+ ionswith non-volatile Y3+ ions may avoid creation of oxygen ionvacancies causing stabilization of the Fe3+/Fe2+ coupledoxygen vacancy interaction [14,15]. Dielectric anomalies areobserved in dielectric constant vs temperature plots at 376 1Cand 318 1C for x=0.15 and 0.20, respectively. Broad peaks areobserved in loss tangent vs temperature plots at slightlydifferent temperatures i.e. 340 1C and 289 1C for x=0.15 and0.20, respectively (see Fig. 5). The dielectric anomaly in εr vsT plots in all the compositions is observed near the magnetictransition temperature TN, which is the typical AFM character-istic temperature of BFO. This type of dielectric anomaly inmagneto-electrically ordered systems was predicted by theLandau-Devonshire theory of phase transition as an influenceof vanishing magnetic order on the electric order [16]. Also forx¼0.20 sample, permittivity is much higher and loss is verylow as compared to the other compositions in the entire rangeof temperature, indicating the reduced oxygen vacancy con-centration with increasing Y3+ doping. A sudden jump in thedielectric constant at around 450 1C is observed which slightlyvaries from one sample to another sample, can be clearly seenin the inset of Fig. 5 for x¼0.20. This sudden jump could beattributed to a space charge contribution (Maxwell–Wagnerpolarization) which can be seen as a loss peak in tan δ vs Tplots. These observations are in accordance to the recent reportby Kamba et al. [17]. Maxwell–Wagner polarization in oursamples may be due to the local charge imbalance caused bythe oxygen non-stoichiometry. Further shift in the dielectricanomaly from 376 1C to 318 1C may be attributed to Y3+
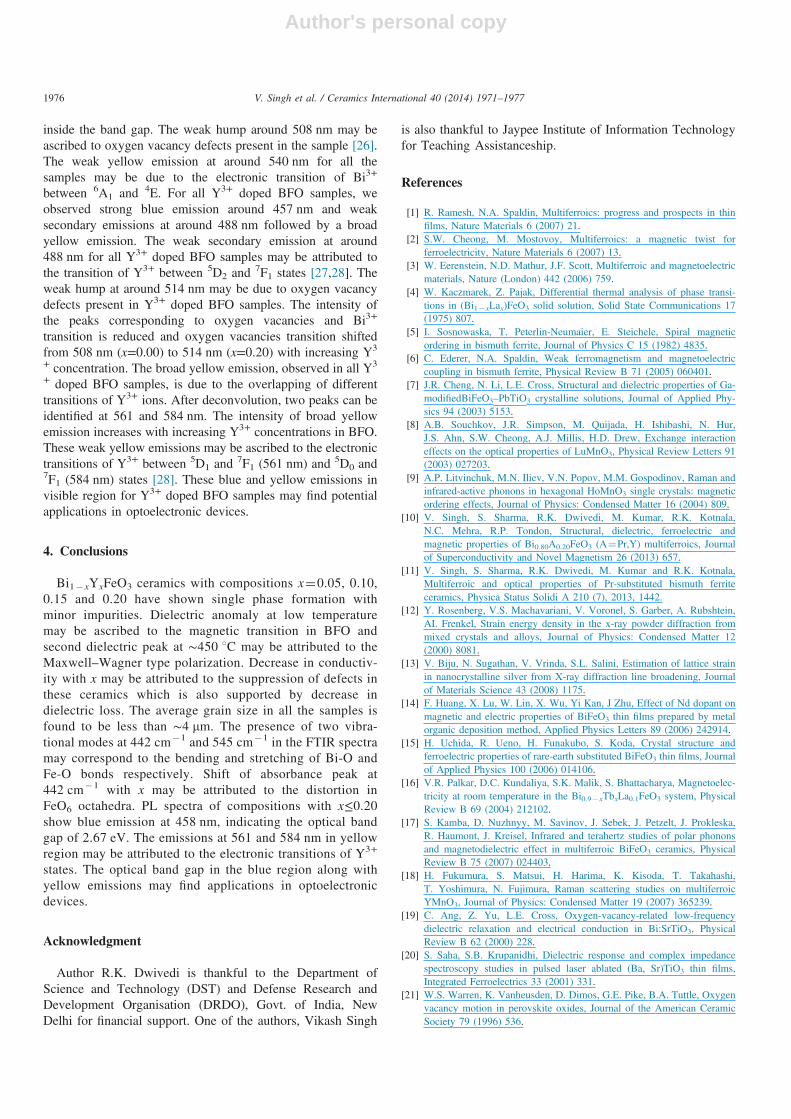
substitution as Yttrium based multiferroic (YMnO3) exhibitsTN at ∼40 K [18].In Fig. 6, shows the variation of conductivity with tempera-
ture of Y3+ doped BFO samples for x≤0.20. Conductivityshowed a gradual increase with increasing temperature.The activation energy values (EA) are calculated using theArrhenius equation sac¼s0 exp(�EA/kT) in three linearregion with different slopes. The conductivity in these tem-perature regimes can be explained on the basis of differentactivation energy values. It is possible to link each region tothe movements of electrical charges which are thermallyactivated. In the first temperatures regime up to 200 1C, the
Fig. 4. Frequency dependence of dielectric constant and dielectric loss at roomtemperature for x≤0.20 in Bi1�xYxFeO3 ceramics.
Fig. 5. Temperature dependence of dielectric constant and dielectric loss at100 kHz for x≤0.20 in Bi1�xYxFeO3 ceramics.
Fig. 6. Variation of log sac with inverse of temperature for the compositionswith x≤0.20 in Bi1�xYxFeO3 ceramics.
V. Singh et al. / Ceramics International 40 (2014) 1971–19771974
Author's personal copy
activation energy is as low as 0.07 eV which may be attributedto the local electron transport due to the hoping at theneighboring sites [19,20]. The existence of conduction elec-trons is due to the deficiency of oxygen in BFO. In the secondregion from 220 1C to 350 1C, the activation energy is 0.4 eV,about five times the activation energy in the region one. Thisvalue of activation energy may be attributed to the singlyionized oxygen vacancies movements. In the third regionabove 400 1C, the activation energy is 0.8 eV, which is twotimes the value observed in the second region. This kind ofactivation energy actually corresponds to the doubly ionizedoxygen vacancy motion from one site to the other [21,22]. Asthe temperature increases, impurity conduction ceases and
electrical conduction, attributed to the doubly ionized oxygenvacancies, sets on according to the following reaction [22]:
O0-12
� �O2 þ V ″
0 þ 2e′
Room temperature FTIR absorption spectra of Y3+ ions dopedBFO ceramics are shown in Fig. 7. The IR spectra givesinformation about the chemical and molecular structure changesin BFO due to the changes in Fe-O bond during sintering as wellas when foreign atoms are doped in BFO. Two broad absorptionbands are observed near 545 and 442 cm�1 due to the over-lapping of Fe-O and Bi-O groups′ vibrations. The broad bandnear 545 cm�1 is attributed to Fe-O and Bi-O stretching in BiO6
and FeO6 octahedra [23,24], second broad band absorption peaknear 442 cm�1 is attributed to bending of Fe-O and Bi-O groups.Shift of the absorption peaks around 442 cm�1 to higher wavenumber side is clearly observed with increasing Y3+ concentra-tion. This indicates that bending of Fe-O and Bi-O bondsincreases with composition x, suggesting the deformation in theFeO6 octahedra increases with Y3+ concentration in thesesamples [11].Photoluminescence (PL) spectra of pure and Y3+ doped
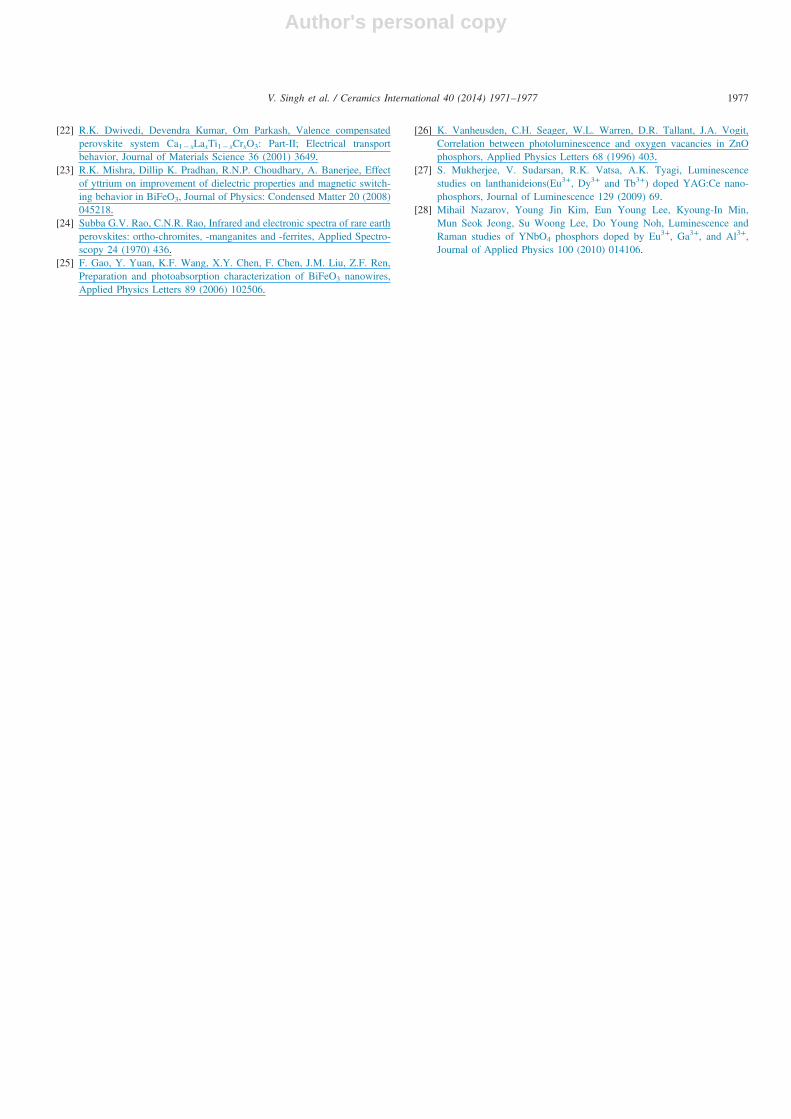
BFO samples at room temperature are shown in Fig. 8.PL excitation (at 440 nm) for pure BFO resulted in an intenseblue emission, which is clearly visible. The spectrum shows astrong emission line at 458 nm in the blue region along with aweak hump at 508 nm. We assign this dominant emission at458 nm as a band to band transition in BFO corresponding tothe band gap of 2.67 eV [25]. Any other emission of lowerenergies must come from various impurities or defect levels
Fig. 7. Room temperature IR absorption spectra of compositions with x≤0.20in Bi1�xYxFeO3 ceramics.
Fig. 8. Room temperature PL spectra of compositions with x in Bi1�xYxFeO3 ceramics.
V. Singh et al. / Ceramics International 40 (2014) 1971–1977 1975
Author's personal copy
inside the band gap. The weak hump around 508 nm may beascribed to oxygen vacancy defects present in the sample [26].The weak yellow emission at around 540 nm for all thesamples may be due to the electronic transition of Bi3+
between 6A1 and 4E. For all Y3+ doped BFO samples, weobserved strong blue emission around 457 nm and weaksecondary emissions at around 488 nm followed by a broadyellow emission. The weak secondary emission at around488 nm for all Y3+ doped BFO samples may be attributed tothe transition of Y3+ between 5D2 and
7F1 states [27,28]. Theweak hump at around 514 nm may be due to oxygen vacancydefects present in Y3+ doped BFO samples. The intensity ofthe peaks corresponding to oxygen vacancies and Bi3+
transition is reduced and oxygen vacancies transition shiftedfrom 508 nm (x=0.00) to 514 nm (x=0.20) with increasing Y3
+ concentration. The broad yellow emission, observed in all Y3
+ doped BFO samples, is due to the overlapping of differenttransitions of Y3+ ions. After deconvolution, two peaks can beidentified at 561 and 584 nm. The intensity of broad yellowemission increases with increasing Y3+ concentrations in BFO.These weak yellow emissions may be ascribed to the electronictransitions of Y3+ between 5D1 and
7F1 (561 nm) and 5D0 and7F1 (584 nm) states [28]. These blue and yellow emissions invisible region for Y3+ doped BFO samples may find potentialapplications in optoelectronic devices.
4. Conclusions
Bi1�xYxFeO3 ceramics with compositions x¼0.05, 0.10,0.15 and 0.20 have shown single phase formation withminor impurities. Dielectric anomaly at low temperaturemay be ascribed to the magnetic transition in BFO andsecond dielectric peak at ∼450 1C may be attributed to theMaxwell–Wagner type polarization. Decrease in conductiv-ity with x may be attributed to the suppression of defects inthese ceramics which is also supported by decrease indielectric loss. The average grain size in all the samples isfound to be less than ∼4 mm. The presence of two vibra-tional modes at 442 cm�1 and 545 cm�1 in the FTIR spectramay correspond to the bending and stretching of Bi-O andFe-O bonds respectively. Shift of absorbance peak at442 cm�1 with x may be attributed to the distortion inFeO6 octahedra. PL spectra of compositions with x≤0.20show blue emission at 458 nm, indicating the optical bandgap of 2.67 eV. The emissions at 561 and 584 nm in yellowregion may be attributed to the electronic transitions of Y3+
states. The optical band gap in the blue region along withyellow emissions may find applications in optoelectronicdevices.
Acknowledgment
Author R.K. Dwivedi is thankful to the Department ofScience and Technology (DST) and Defense Research andDevelopment Organisation (DRDO), Govt. of India, NewDelhi for financial support. One of the authors, Vikash Singh
is also thankful to Jaypee Institute of Information Technologyfor Teaching Assistanceship.
References
[1] R. Ramesh, N.A. Spaldin, Multiferroics: progress and prospects in thinfilms, Nature Materials 6 (2007) 21.
[2] S.W. Cheong, M. Mostovoy, Multiferroics: a magnetic twist forferroelectricity, Nature Materials 6 (2007) 13.
[3] W. Eerenstein, N.D. Mathur, J.F. Scott, Multiferroic and magnetoelectricmaterials, Nature (London) 442 (2006) 759.
[4] W. Kaczmarek, Z. Pajak, Differential thermal analysis of phase transi-tions in (Bi1�xLax)FeO3 solid solution, Solid State Communications 17(1975) 807.
[5] I. Sosnowaska, T. Peterlin-Neumaier, E. Steichele, Spiral magneticordering in bismuth ferrite, Journal of Physics C 15 (1982) 4835.
[6] C. Ederer, N.A. Spaldin, Weak ferromagnetism and magnetoelectriccoupling in bismuth ferrite, Physical Review B 71 (2005) 060401.
[7] J.R. Cheng, N. Li, L.E. Cross, Structural and dielectric properties of Ga-modifiedBiFeO3–PbTiO3 crystalline solutions, Journal of Applied Phy-sics 94 (2003) 5153.
[8] A.B. Souchkov, J.R. Simpson, M. Quijada, H. Ishibashi, N. Hur,J.S. Ahn, S.W. Cheong, A.J. Millis, H.D. Drew, Exchange interactioneffects on the optical properties of LuMnO3, Physical Review Letters 91(2003) 027203.
[9] A.P. Litvinchuk, M.N. Iliev, V.N. Popov, M.M. Gospodinov, Raman andinfrared-active phonons in hexagonal HoMnO3 single crystals: magneticordering effects, Journal of Physics: Condensed Matter 16 (2004) 809.
[10] V. Singh, S. Sharma, R.K. Dwivedi, M. Kumar, R.K. Kotnala,N.C. Mehra, R.P. Tondon, Structural, dielectric, ferroelectric andmagnetic properties of Bi0.80A0.20FeO3 (A¼Pr,Y) multiferroics, Journalof Superconductivity and Novel Magnetism 26 (2013) 657.
[11] V. Singh, S. Sharma, R.K. Dwivedi, M. Kumar and R.K. Kotnala,Multiferroic and optical properties of Pr-substituted bismuth ferriteceramics, Physica Status Solidi A 210 (7), 2013, 1442.
[12] Y. Rosenberg, V.S. Machavariani, V. Voronel, S. Garber, A. Rubshtein,AI. Frenkel, Strain energy density in the x-ray powder diffraction frommixed crystals and alloys, Journal of Physics: Condensed Matter 12(2000) 8081.
[13] V. Biju, N. Sugathan, V. Vrinda, S.L. Salini, Estimation of lattice strainin nanocrystalline silver from X-ray diffraction line broadening, Journalof Materials Science 43 (2008) 1175.
[14] F. Huang, X. Lu, W. Lin, X. Wu, Yi Kan, J Zhu, Effect of Nd dopant onmagnetic and electric properties of BiFeO3 thin films prepared by metalorganic deposition method, Applied Physics Letters 89 (2006) 242914.
[15] H. Uchida, R. Ueno, H. Funakubo, S. Koda, Crystal structure andferroelectric properties of rare-earth substituted BiFeO3 thin films, Journalof Applied Physics 100 (2006) 014106.
[16] V.R. Palkar, D.C. Kundaliya, S.K. Malik, S. Bhattacharya, Magnetoelec-tricity at room temperature in the Bi0.9�xTbxLa0.1FeO3 system, PhysicalReview B 69 (2004) 212102.
[17] S. Kamba, D. Nuzhnyy, M. Savinov, J. Sebek, J. Petzelt, J. Prokleska,R. Haumont, J. Kreisel, Infrared and terahertz studies of polar phononsand magnetodielectric effect in multiferroic BiFeO3 ceramics, PhysicalReview B 75 (2007) 024403.
[18] H. Fukumura, S. Matsui, H. Harima, K. Kisoda, T. Takahashi,T. Yoshimura, N. Fujimura, Raman scattering studies on multiferroicYMnO3, Journal of Physics: Condensed Matter 19 (2007) 365239.
[19] C. Ang, Z. Yu, L.E. Cross, Oxygen-vacancy-related low-frequencydielectric relaxation and electrical conduction in Bi:SrTiO3, PhysicalReview B 62 (2000) 228.
[20] S. Saha, S.B. Krupanidhi, Dielectric response and complex impedancespectroscopy studies in pulsed laser ablated (Ba, Sr)TiO3 thin films,Integrated Ferroelectrics 33 (2001) 331.
[21] W.S. Warren, K. Vanheusden, D. Dimos, G.E. Pike, B.A. Tuttle, Oxygenvacancy motion in perovskite oxides, Journal of the American CeramicSociety 79 (1996) 536.
V. Singh et al. / Ceramics International 40 (2014) 1971–19771976
Author's personal copy
[22] R.K. Dwivedi, Devendra Kumar, Om Parkash, Valence compensatedperovskite system Ca1�xLaxTi1�xCrxO3: Part-II; Electrical transportbehavior, Journal of Materials Science 36 (2001) 3649.
[23] R.K. Mishra, Dillip K. Pradhan, R.N.P. Choudhary, A. Banerjee, Effectof yttrium on improvement of dielectric properties and magnetic switch-ing behavior in BiFeO3, Journal of Physics: Condensed Matter 20 (2008)045218.
[24] Subba G.V. Rao, C.N.R. Rao, Infrared and electronic spectra of rare earthperovskites: ortho-chromites, -manganites and -ferrites, Applied Spectro-scopy 24 (1970) 436.
[25] F. Gao, Y. Yuan, K.F. Wang, X.Y. Chen, F. Chen, J.M. Liu, Z.F. Ren,Preparation and photoabsorption characterization of BiFeO3 nanowires,Applied Physics Letters 89 (2006) 102506.
[26] K. Vanheusden, C.H. Seager, W.L. Warren, D.R. Tallant, J.A. Vogit,Correlation between photoluminescence and oxygen vacancies in ZnOphosphors, Applied Physics Letters 68 (1996) 403.
[27] S. Mukherjee, V. Sudarsan, R.K. Vatsa, A.K. Tyagi, Luminescencestudies on lanthanideions(Eu3+, Dy3+ and Tb3+) doped YAG:Ce nano-phosphors, Journal of Luminescence 129 (2009) 69.
[28] Mihail Nazarov, Young Jin Kim, Eun Young Lee, Kyoung-In Min,Mun Seok Jeong, Su Woong Lee, Do Young Noh, Luminescence andRaman studies of YNbO4 phosphors doped by Eu3+, Ga3+, and Al3+,Journal of Applied Physics 100 (2010) 014106.
V. Singh et al. / Ceramics International 40 (2014) 1971–1977 1977
Related Documents


![Science y3[1]](https://static.cupdf.com/doc/110x72/577d2fb51a28ab4e1eb26d03/science-y31.jpg)

