C Effect of Waste Sew Fr Hab Department of Z Abstract – Effect of sewage pollutio diversity of fresh water ecosystem of west India was carried out between February 2010, by investigating the biological en habitats. The faunal species were obtain sediment with 0.5mm mesh sieve and phys of ten major taxonomic groupings wer groupings and their percentage contrib macro-benthic organisms collection ar Diptera (17.2%), Cladocera (12.25%), C Ostracoda (8.5 %), Hemiptera (8.37%), O Copepoda (6.7%), Trichoptera (0.27 %) a (0.23%). Benthic diversity varied from a m June, 2009 to a maximum of 3.23 in Febru this ecosystem can be considered as m Rotifers and Diptera were dominant in thi attributed to their level of pollution toler species of these groups can tolerate high e of water and easily survive in polluted w and Plecoptera was totally absent thro period. This suggests that the study ar Mollusc and Plecoptera can’t tolerate hyp condition of aquatic ecosystem. The CO 2 w throughout the study period. Keywords – Aquatic Ecosystem, Be Diversity, Sewage Pollution. I. INTRODUCTION The present study on this fresh water e effect of high level sewage pollution resu and natural activities on benthic diversit in view of the economic importance and interests in respect of wild life, fisheries water quality in order to ensure the sust natural resources. Benthic macro organisms that live on or inside the dep of a water body (Idowu and Ugwumb communities are widely used in the mo of pollution as the organisms are m integrate effects of pollutants over tim communities comprise a large numbe because of the varying sensitivities of sp possible to identify subtle effects of poll changes in community structure. Until f accepted methods for identifying changes have been relatively crude, usin number of species, diversity indices occurrence of opportunistic species, but of such stress indices Gray (1989) s indicate end-points rather than first eff induced change. Copyright © 2014 IJAIR, All right reserved 946 International Journal of Agriculture I Volume 2, Issue 6, wage Pollution on Benthic resh Water Ecosystem beeba A. Kabeer* and Saltanat Parveen Zoology, Aligarh Muslim University, Aligarh 202 002, Indi *E-mail: [email protected] on on the benthic tern region of U.P., y, 2009 – January, nvironment of the ned by sieving the sical sorting. A total re recorded. These bution to the total re Rotifers (30%), Coleoptera (8.9%), Oligochaetes (6.8%), and Ephemeroptera minimum of 3.11 in uary, 2009 therefore moderately polluted. is ecosystem may be rance because some eutrophic condition water. The Mollusc oughout the study rea is polluted and poxia and eutrophic was found to absent enthic Community, N ecosystem focused sulting from human ty. This ecosystem d inherent scientific s, flood control and tainable use of the fauna are those posit at the bottom ba, 2005). Benthic onitoring of effects mostly sessile and me. Most benthic er of species and pecies it should be llutants reflected in fairly recently, the pollution-induced ng changes in total and frequency of in a recent review suggests that they fects of pollution- Benthic communities are esp and evaluating the impacts of lo and aquatic contamination anoxia/hypoxia is greatest in hydrophobic anthropogenic accumulate in sediments. Bent mobility cannot avoid adverse c local environmental conditions fauna (Gray, 1979). The d tolerances, life history strateg trophic interactions can ma communities effective estim condition. Several papers co indices to assess the ecologica and estuarine environments (Bo al., 2008; Weisberg et al., 2 between the unavailable nutrie protein materials in fish and oth organisms feed on detritus that water and in turn serve as food (Idowu and Ugwumba, 200 breakdown of decaying orga organic forms such as phospha al., 1978). All forms of aquatic link of several food cha environments, can utilize the nu A highly diverse group, bent excellent candidates for studies Aquatic insects often make go are present in some capacity habitat and many are habita Gripenberg, 2008). Diversity attribute of a natural or organ related to other structural and fu productivity, niche structure, integration of the community. called biological diversity conservation in terrestrial, environments (Brooks et al., 20 II. MATERIAL AN Aquatic ecosystem directl enormous ecological, comme importance. They are rich in diversity like, flora and faun regional significance. Aligarh richly well off with hundreds o used as drainage basin and regular fisheries of various kin water sewage fed Pond is almos Manuscript Processing Details (dd/mm/yyyy Received : 05/05/2014 | Accepted on : 20/05 Innovations and Research , ISSN (Online) 2319-1473 c Diversity of ia pecially useful in detecting ow dissolved oxygen events because exposure to n near bottom waters and contaminants typically thic organisms with limited conditions and better reflect s compared to most pelagic diversity of physiological gies, feeding modes, and ake sedimentary benthic mators of environmental oncern the use of benthic al quality, status of marine orja et al., 2008; Teixeira et 2008). They form the link ents in detritus and useful her organisms. Most benthic t settle on the bottom of the d for a wide range of fishes 05). They accelerate the ganic matter into simpler ates and nitrates (Gallep et c plants, which are the first ains existing in aquatic utrients. thic macroinvertebrates are s of changes in biodiversity. ood indicators because they y in almost every type of at specialists (Lewis and is an important structural nized community, which is unctional properties such as competition, stability and The sustaining of the so- is a priority of nature marine and freshwater 006). ND METHODS ly or indirectly has an ercial and socio-economic n the components of bio- na of local, national and and its adjoining areas are of derelict ponds which are support an extensive and nd. This is a perennial fresh st rectangular in shape. It is y) : 5/2014 | Published : 24/05/2014

Welcome message from author
This document is posted to help you gain knowledge. Please leave a comment to let me know what you think about it! Share it to your friends and learn new things together.
Transcript
Copyright © 2014 IJAIR, All right reserved
Effect of Waste Sewage
Fresh
Habeeba A. Kabeer* and Saltanat ParveenDepartment of Zoology, Aligarh Muslim University, Aligarh 202 002, India
Abstract – Effect of sewage pollution on the benthic
diversity of fresh water ecosystem of western region
India was carried out between February, 2009
2010, by investigating the biological environment of the
habitats. The faunal species were obtained by sieving the
sediment with 0.5mm mesh sieve and physical sorting. A total
of ten major taxonomic groupings were recorded. These
groupings and their percentage contribution to the total
macro-benthic organisms collection are
Diptera (17.2%), Cladocera (12.25%), Coleoptera (8.9%),
Ostracoda (8.5 %), Hemiptera (8.37%), Oligochaetes (6.8%),
Copepoda (6.7%), Trichoptera (0.27 %) and
(0.23%). Benthic diversity varied from a minimum of 3.11 in
June, 2009 to a maximum of 3.23 in Februar
this ecosystem can be considered as moderately polluted.
Rotifers and Diptera were dominant in this
attributed to their level of pollution tolerance
species of these groups can tolerate high eutrophic condit
of water and easily survive in polluted water
and Plecoptera was totally absent throughout the study
period. This suggests that the study area is polluted
Mollusc and Plecoptera can’t tolerate hypoxia and eutrophic
condition of aquatic ecosystem. The CO2 was found to absent
throughout the study period.
Keywords – Aquatic Ecosystem, Benthic Community,
Diversity, Sewage Pollution.
I. INTRODUCTION
The present study on this fresh water ecosystem focused
effect of high level sewage pollution resulting from human
and natural activities on benthic diversity
in view of the economic importance and inherent scientific
interests in respect of wild life, fisheries, flood control and
water quality in order to ensure the sustainable use of the
natural resources. Benthic macro fauna are those
organisms that live on or inside the deposit at the bottom
of a water body (Idowu and Ugwumba, 2005).
communities are widely used in the monitoring of effects
of pollution as the organisms are mostly sessile and
integrate effects of pollutants over time. Most benthic
communities comprise a large number of species and
because of the varying sensitivities of species it should be
possible to identify subtle effects of pollutants
changes in community structure. Until fairly recently, the
accepted methods for identifying pollution
changes have been relatively crude, using changes in total
number of species, diversity indices and frequency of
occurrence of opportunistic species, but in a recent review
of such stress indices Gray (1989) suggests that they
indicate end-points rather than first effects of pollution
induced change.
Copyright © 2014 IJAIR, All right reserved
946
International Journal of Agriculture Innovations and Research
Volume 2, Issue 6, ISSN
ewage Pollution on Benthic
resh Water Ecosystem
Habeeba A. Kabeer* and Saltanat Parveen Department of Zoology, Aligarh Muslim University, Aligarh 202 002, India
*E-mail: [email protected]
pollution on the benthic
of fresh water ecosystem of western region of U.P.,
carried out between February, 2009 – January,
2010, by investigating the biological environment of the
The faunal species were obtained by sieving the
sediment with 0.5mm mesh sieve and physical sorting. A total
ere recorded. These
groupings and their percentage contribution to the total
collection are Rotifers (30%),
Cladocera (12.25%), Coleoptera (8.9%),
Ostracoda (8.5 %), Hemiptera (8.37%), Oligochaetes (6.8%),
and Ephemeroptera
diversity varied from a minimum of 3.11 in
June, 2009 to a maximum of 3.23 in February, 2009 therefore
can be considered as moderately polluted.
his ecosystem may be
attributed to their level of pollution tolerance because some
species of these groups can tolerate high eutrophic condition
of water and easily survive in polluted water. The Mollusc
and Plecoptera was totally absent throughout the study
This suggests that the study area is polluted and
Mollusc and Plecoptera can’t tolerate hypoxia and eutrophic
was found to absent
Aquatic Ecosystem, Benthic Community,
NTRODUCTION
fresh water ecosystem focused
resulting from human
on benthic diversity. This ecosystem
in view of the economic importance and inherent scientific
interests in respect of wild life, fisheries, flood control and
e sustainable use of the
Benthic macro fauna are those
organisms that live on or inside the deposit at the bottom
of a water body (Idowu and Ugwumba, 2005). Benthic
communities are widely used in the monitoring of effects
the organisms are mostly sessile and
integrate effects of pollutants over time. Most benthic
communities comprise a large number of species and
because of the varying sensitivities of species it should be
possible to identify subtle effects of pollutants reflected in
changes in community structure. Until fairly recently, the
accepted methods for identifying pollution-induced
changes have been relatively crude, using changes in total
number of species, diversity indices and frequency of
unistic species, but in a recent review
of such stress indices Gray (1989) suggests that they
points rather than first effects of pollution-
Benthic communities are especially useful in detecting
and evaluating the impacts of lo
and aquatic contamination because exposure to
anoxia/hypoxia is greatest in near bottom waters and
hydrophobic anthropogenic contaminants typically
accumulate in sediments. Benthic organisms with limited
mobility cannot avoid adverse conditions and better reflect
local environmental conditions compared to most pelagic
fauna (Gray, 1979). The diversity of physiological
tolerances, life history strategies, feeding modes, and
trophic interactions can make sedimentary benthic
communities effective estimators of environmental
condition. Several papers concern the use of benthic
indices to assess the ecological quality, status of marine
and estuarine environments (Borja
al., 2008; Weisberg et al., 2008).
between the unavailable nutrients in detritus and useful
protein materials in fish and other organisms. Most benthic
organisms feed on detritus that settle on the bottom of the
water and in turn serve as food for a wide range of fishes
(Idowu and Ugwumba, 2005). They accelerate the
breakdown of decaying organic matter into simpler
organic forms such as phosphates and nitrates (Gallep
al., 1978). All forms of aquatic plants, which are the first
link of several food chains existing in aquatic
environments, can utilize the nutrients.
A highly diverse group, benthic macroinvertebrates are
excellent candidates for studies of changes in biodiversity.
Aquatic insects often make good indicators because they
are present in some capacity in almost every
habitat and many are habitat specialists (Lewis and
Gripenberg, 2008). Diversity is an important structural
attribute of a natural or organized community, which is
related to other structural and functional properties such as
productivity, niche structure, competition, stability and
integration of the community. The sustaining of the so
called biological diversity is a priority of nature
conservation in terrestrial, marine and freshwater
environments (Brooks et al., 2006).
II. MATERIAL AND
Aquatic ecosystem directly or indirectly has
enormous ecological, commercial and socio
importance. They are rich in the components of bio
diversity like, flora and fauna of local, national and
regional significance. Aligarh and its adjoining areas are
richly well off with hundreds of derelict ponds which are
used as drainage basin and support an extensive and
regular fisheries of various kind. This is a perennial fresh
water sewage fed Pond is almost rectangular in sh
Manuscript Processing Details (dd/mm/yyyy) :
Received : 05/05/2014 | Accepted on : 20/05
International Journal of Agriculture Innovations and Research
, ISSN (Online) 2319-1473
enthic Diversity of
Department of Zoology, Aligarh Muslim University, Aligarh 202 002, India
Benthic communities are especially useful in detecting
and evaluating the impacts of low dissolved oxygen events
and aquatic contamination because exposure to
anoxia/hypoxia is greatest in near bottom waters and
hydrophobic anthropogenic contaminants typically
accumulate in sediments. Benthic organisms with limited
rse conditions and better reflect
local environmental conditions compared to most pelagic
fauna (Gray, 1979). The diversity of physiological
tolerances, life history strategies, feeding modes, and
trophic interactions can make sedimentary benthic
es effective estimators of environmental
condition. Several papers concern the use of benthic
indices to assess the ecological quality, status of marine
and estuarine environments (Borja et al., 2008; Teixeira et
., 2008). They form the link
between the unavailable nutrients in detritus and useful
protein materials in fish and other organisms. Most benthic
organisms feed on detritus that settle on the bottom of the
water and in turn serve as food for a wide range of fishes
nd Ugwumba, 2005). They accelerate the
breakdown of decaying organic matter into simpler
organic forms such as phosphates and nitrates (Gallep et
., 1978). All forms of aquatic plants, which are the first
link of several food chains existing in aquatic
nvironments, can utilize the nutrients.
A highly diverse group, benthic macroinvertebrates are
excellent candidates for studies of changes in biodiversity.
Aquatic insects often make good indicators because they
are present in some capacity in almost every type of
habitat and many are habitat specialists (Lewis and
Gripenberg, 2008). Diversity is an important structural
attribute of a natural or organized community, which is
related to other structural and functional properties such as
tructure, competition, stability and
integration of the community. The sustaining of the so-
called biological diversity is a priority of nature
conservation in terrestrial, marine and freshwater
., 2006).
ATERIAL AND METHODS
ecosystem directly or indirectly has an
enormous ecological, commercial and socio-economic
importance. They are rich in the components of bio-
diversity like, flora and fauna of local, national and
Aligarh and its adjoining areas are
richly well off with hundreds of derelict ponds which are
used as drainage basin and support an extensive and
regular fisheries of various kind. This is a perennial fresh
water sewage fed Pond is almost rectangular in shape. It is
Manuscript Processing Details (dd/mm/yyyy) :
5/2014 | Published : 24/05/2014

Copyright © 2014 IJAIR, All right reserved
shallow pond. Its source of water replenishment is mainly
sewage effluent from Medical College through drains, the
overhead tank and surface run-off from surrounding areas.
Many washermen use this pond for washing clothes, thus
adding certain chemicals and colour to its water almost
every day that brings certain pysico
biological changes in its flora and fauna regularly. The
water of the pond is turbid due to luxuriant growth of
microscopic algae, colour stains and washing chemicals
used by washermen. Bottom of the pond contains mostly
loose mud, sand, stones, part of dead plants, dead plankton
and decayed littler deposited by trees situated on its bank.
A. Sediment analysis and Water analysisSampling of sediment and water was
February, 2009 to January, 2010. At each sampling site
sediment sample was collected using Ekman
water sample in bottle after collection labeled and bring to
laboratory. The collected sediment was washed and sieved
on a mesh screen of 0.5 mm preserved and identify under
microscope. The Benthic macro-invertebrates were
identified using identification keys Edmondson (1959),
Pennak (1978) and Tonapi (1980) and density determined
per meter square area (ind/m2). The conductivity and pH
were measured using a digital conductivity meter,
Dissolved oxygen, (TS), (TDS), (TS
Hardness, Calcium, Magnesium and Nitrate
(NO3-N), Phosphate- phosphorus (PO4-
Free carbon dioxide (CO2), composition of sand, silt a
clay and Organic matter and organic carbon were analyzed
according to the method given by Triedy and Goel (1984),
Barnes (1959), Michael (1984).
B. Statistical analyses Patterns of spatial and seasonal variation of Benthic
macro-invertebrates population with environmental
variables were described using Correspon
Analysis (CCA) with the help of Past
Harper (2001) and diversity indices, MDS and
dendogram were calculated and plotted with the
help of Primer v5 (version 5.2.4).
III. RESULT AND DISCUSSION
The percentage compositions of each of the major
benthic fauna are presented in Table 1. A total of
major taxonomic groupings were recorded. These
groupings and their percentage contribution to the total
macro-benthic collection are Rotifers (30%), Diptera
(17.2%), Cladocera (12.25%), Coleoptera (8.9%),
Ostracoda (8.5 %), Hemiptera (8.37%), Oligochaetes
(6.8%), Copepoda (6.7%), Trichoptera (0.27 %) and
Ephemeroptera (0.23%) (Table-I) were recorded in the
study area. The Shannon Wiener index is based on both
the number of species present and relative abundance of
each species. Monthly benthos species diversity is given in
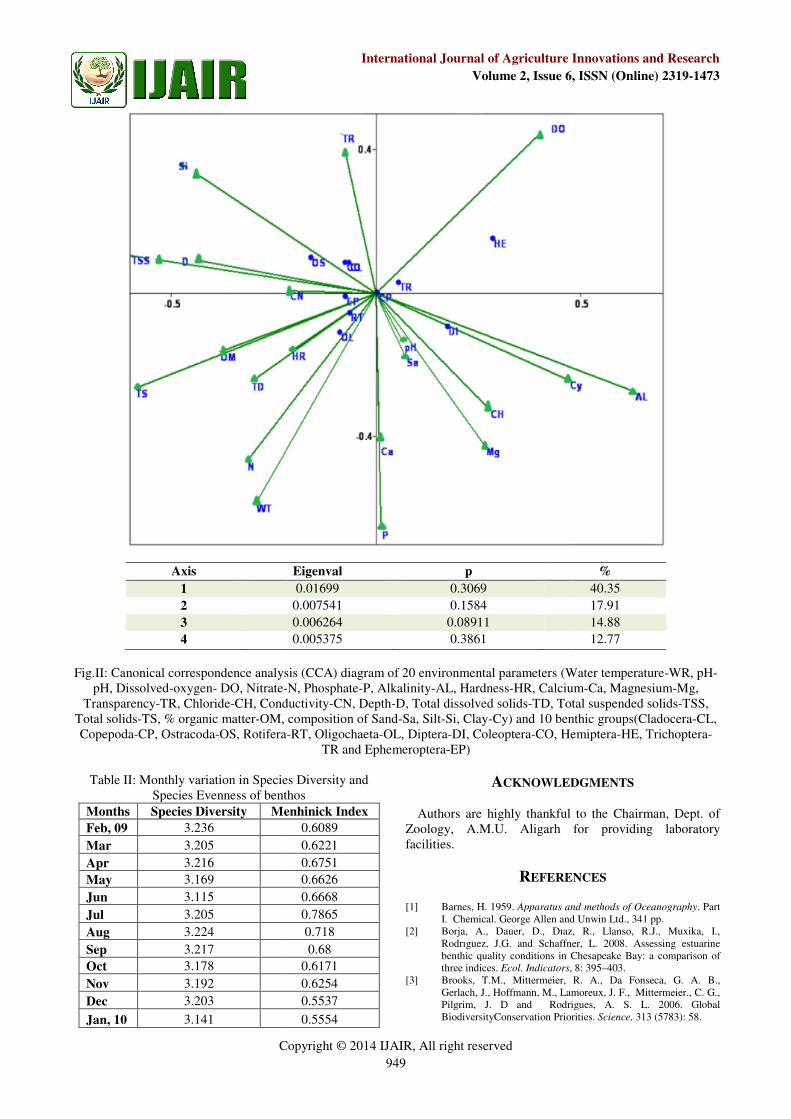
Table II. The index values for benthic
from a minimum of 3.11 in June, 2009 to a maximum of
3.23 in February, 2009 and Menhinicks index of diversity
for benthos varied from a minimum of 0.553 in December,
2009 to a maximum of 0.786 in July, 2009
Shannon – Weiner diversity index proposed as diversity
Copyright © 2014 IJAIR, All right reserved
947
International Journal of Agriculture Innovations and Research
Volume 2, Issue 6, ISSN
shallow pond. Its source of water replenishment is mainly
sewage effluent from Medical College through drains, the
off from surrounding areas.
Many washermen use this pond for washing clothes, thus
emicals and colour to its water almost
every day that brings certain pysico-chemical and
biological changes in its flora and fauna regularly. The
water of the pond is turbid due to luxuriant growth of
microscopic algae, colour stains and washing chemicals
used by washermen. Bottom of the pond contains mostly
loose mud, sand, stones, part of dead plants, dead plankton
and decayed littler deposited by trees situated on its bank.
and Water analysis ampling of sediment and water was performed from
February, 2009 to January, 2010. At each sampling site
sediment sample was collected using Ekman-dredges and
water sample in bottle after collection labeled and bring to
laboratory. The collected sediment was washed and sieved
preserved and identify under
invertebrates were
identified using identification keys Edmondson (1959),
Pennak (1978) and Tonapi (1980) and density determined
The conductivity and pH
were measured using a digital conductivity meter,
Dissolved oxygen, (TS), (TDS), (TS-TDS=TSS),
Hardness, Calcium, Magnesium and Nitrate-nitrogen
-P), Alkalinity and
), composition of sand, silt and
clay and Organic matter and organic carbon were analyzed
according to the method given by Triedy and Goel (1984),
Patterns of spatial and seasonal variation of Benthic
population with environmental
variables were described using Correspondence Canonical
with the help of Past by Hammer and
diversity indices, MDS and
were calculated and plotted with the
ISCUSSION
The percentage compositions of each of the major
benthic fauna are presented in Table 1. A total of ten
were recorded. These
contribution to the total
Rotifers (30%), Diptera
(17.2%), Cladocera (12.25%), Coleoptera (8.9%),
Ostracoda (8.5 %), Hemiptera (8.37%), Oligochaetes
(6.8%), Copepoda (6.7%), Trichoptera (0.27 %) and
were recorded in the
The Shannon Wiener index is based on both
the number of species present and relative abundance of
each species. Monthly benthos species diversity is given in
ic diversity varied
2009 to a maximum of
3.23 in February, 2009 and Menhinicks index of diversity
for benthos varied from a minimum of 0.553 in December,
2009 to a maximum of 0.786 in July, 2009 (Table II). The
Weiner diversity index proposed as diversity
index > 4 is clean water; between 3
water and < 2 is heavily polluted water (Shekhar
2008). Since, the Shannon-Weiner diversity index in the
present study ranged between 3.11
water ecosystem; they can be considered as moderately
polluted. Moreover, diversity and evenness followed the
same trend in selected study area
always associated with high evenness (Ismail and
Dorgham, 2003). Sorenson’s index va
similarity) for Similarity index between different months
of the recorded benthic groups is depicted in dendrogram
and MDS (Fig. I). The highest similarity was recorded in
April, 2009 – August, 2009 and
July, 2009 – December, 2009
Similarity index values suggest that most of the species in
this ecosystem were common during the course of stud
This has resulted in overlapping of faunal grouping and
predictability of community composition.
Canonical correspondence analysis (CCA) of benthic
community and water and sediment quality variables were
drawn up in the form of one matrix and were anal
canonical correspondence analysis (CCA) using PAST
program, version (2.10) by Hammer and Harper (2001).
CCA diagram was performed to determine relationships
between 20 environmental variables and 10 groups of
benthos. It is a non-linear technique u
variations in the environmental factors. Benthic data were
log transformed to approach the assumed condition of
normality and homoscedasticity of the data to standardize
the data sets. The constrained ordination axis corresponds
to the direction of the greatest variability of the data set
that can be explained by the variables.
environmental factors are indicated by the length of arrow,
length of line represents the degree of relationship
between benthic groups and environmental fact
angle between arrow shaft and ordination axis indicates
the degree of correlation between environmental factors.
In addition the analysis make vertical lines connecting a
particular group with the line of environmental factors,
closer the connecting point on the line of environmental
factors to arrow shows stronger positive correlation.
Distribution pattern of groups in benthic community are
represented by points, points of group and environmental
factors indicates the distribution of groups and
characteristics of benthic community variance along the
gradient direction of each environmental factor.
The eigen value, value of p and Cumulative percentage
variance of groups-environment relation of axes 1
given the (Fig-II). Trichoptera and Hemiptera showed
positive correlation with Dissolved oxygen whereas
Diptera showed high positive correlation with Clay
composition and Alkalinity. Copepoda showed high
positive correlation with Clay, Sand, Chloride, pH and
Mg. Other groups like Rotifera, Oligochaeta and
Ephemeroptera showed high negative correlation with
Water temperature, Nitrate, Hardness, TDS, % Organic
matter, TS and Conductivity and Cladocera, Coleoptera
and Ostracoda showed high positive correlation with
Transparency, TSS, depth and Composition of Silt. CCA
analysis indicates that, in this aquatic ecosystem important
International Journal of Agriculture Innovations and Research
, ISSN (Online) 2319-1473
is clean water; between 3-4 is mildly polluted
water and < 2 is heavily polluted water (Shekhar et al.,
Weiner diversity index in the
present study ranged between 3.11– 3.23 in the selected
water ecosystem; they can be considered as moderately
polluted. Moreover, diversity and evenness followed the
study area. High diversity was
always associated with high evenness (Ismail and
orenson’s index values (% species
Similarity index between different months
of the recorded benthic groups is depicted in dendrogram
e highest similarity was recorded in
and lowest similarity was in
December, 2009 (Fig. I). Overall high
Similarity index values suggest that most of the species in
were common during the course of study.
This has resulted in overlapping of faunal grouping and
predictability of community composition.
Canonical correspondence analysis (CCA) of benthic
community and water and sediment quality variables were
drawn up in the form of one matrix and were analysed by
canonical correspondence analysis (CCA) using PAST
program, version (2.10) by Hammer and Harper (2001).
CCA diagram was performed to determine relationships
between 20 environmental variables and 10 groups of
linear technique used to relate
variations in the environmental factors. Benthic data were
log transformed to approach the assumed condition of
normality and homoscedasticity of the data to standardize
the data sets. The constrained ordination axis corresponds
ion of the greatest variability of the data set
n be explained by the variables. In graph,
environmental factors are indicated by the length of arrow,
length of line represents the degree of relationship
between benthic groups and environmental factors, the
angle between arrow shaft and ordination axis indicates
the degree of correlation between environmental factors.
In addition the analysis make vertical lines connecting a
particular group with the line of environmental factors,
ng point on the line of environmental
factors to arrow shows stronger positive correlation.
Distribution pattern of groups in benthic community are
represented by points, points of group and environmental
factors indicates the distribution of groups and
aracteristics of benthic community variance along the
gradient direction of each environmental factor.
The eigen value, value of p and Cumulative percentage
environment relation of axes 1-4 are
Trichoptera and Hemiptera showed
positive correlation with Dissolved oxygen whereas
Diptera showed high positive correlation with Clay
composition and Alkalinity. Copepoda showed high
positive correlation with Clay, Sand, Chloride, pH and
like Rotifera, Oligochaeta and
Ephemeroptera showed high negative correlation with
Water temperature, Nitrate, Hardness, TDS, % Organic
matter, TS and Conductivity and Cladocera, Coleoptera
and Ostracoda showed high positive correlation with
TSS, depth and Composition of Silt. CCA
analysis indicates that, in this aquatic ecosystem important

Copyright © 2014 IJAIR, All right reserved
factors affecting benthos distribution are Water
temperature, Dissolved oxygen, Nitrate, Phosphate,
Alkalinity, Calcium, Magnesium, Transparency, Chloride,
Depth, Total dissolved solids, Total suspended solids,
Total solids, % Organic matter, Composition of Silt and
Clay. However, pH, Hardness, Conductivity and
composition of Sand have a lesser influences on the
distribution of the benthic species. The diffe
species composition and abundance may be attributed to
the ecological differences of the different habitat locations
and period of investigation water quality, immediate
substrate for occupation and food availability may also
affect the abundance and distribution of the
macroinvertebrates communities. The numerical numbers
of the individual species recorded in this study were high.
This suggests that they can survive eutrophic condition of
water.
Table I: Monthly abundance (No/m
Fig.I. Dendogram and MDS showing similarity of Benthic community between
Copyright © 2014 IJAIR, All right reserved
948
International Journal of Agriculture Innovations and Research
Volume 2, Issue 6, ISSN
factors affecting benthos distribution are Water
temperature, Dissolved oxygen, Nitrate, Phosphate,
Alkalinity, Calcium, Magnesium, Transparency, Chloride,
Depth, Total dissolved solids, Total suspended solids,
Total solids, % Organic matter, Composition of Silt and
Clay. However, pH, Hardness, Conductivity and
composition of Sand have a lesser influences on the
The differences in
composition and abundance may be attributed to
ecological differences of the different habitat locations
and period of investigation water quality, immediate
substrate for occupation and food availability may also
and distribution of the
The numerical numbers
recorded in this study were high.
they can survive eutrophic condition of
IV. CONCLUSION
� The absence of Mollusk and
study area showed eutrophic condition
survive in polluted water because
their filter feeding mechanism which is blocked in
polluted and high turbid water
at low oxygen concentration (hypoxia).
� The Shannon-Weiner diversity index in the present
study ranged between 3.11–
ecosystem; they can be considered as moderately
polluted.
� The numerical numbers of the individual species
recorded in this study were high this may be attributed
to their level of pollution tolerance.
� The CO2 was found to absent throughout the study
period might be attributed due to its utilization in
photosynthesis process as well as conversion in to
carbonate and bicarbonate.
aquatic ecosystem is polluted presently.
Monthly abundance (No/m2) and percent contribution of Benthic community
Fig.I. Dendogram and MDS showing similarity of Benthic community between different months
International Journal of Agriculture Innovations and Research
, ISSN (Online) 2319-1473
ONCLUSION
Mollusk and Plecoptera throughout the
showed eutrophic condition and they can’t
because Mollusk can’t feed by
their filter feeding mechanism which is blocked in
water. Plecoptera can’t survive
n concentration (hypoxia).
Weiner diversity index in the present
– 3.23 in the selected water
ecosystem; they can be considered as moderately
The numerical numbers of the individual species
study were high this may be attributed
to their level of pollution tolerance.
was found to absent throughout the study
period might be attributed due to its utilization in
photosynthesis process as well as conversion in to
. This suggests that this
polluted presently.
) and percent contribution of Benthic community
different months
Copyright © 2014 IJAIR, All right reserved
Axis
1
2
3
4
Fig.II: Canonical correspondence analysis (CCA) diagram of 20 environmental parameters (Water temperature
pH, Dissolved-oxygen- DO, Nitrate-
Transparency-TR, Chloride-CH, Conductivity
Total solids-TS, % organic matter-OM, composition of Sand
Copepoda-CP, Ostracoda-OS, Rotifera
Table II: Monthly variation in Species Diversity and
Species Evenness of benthos
Months Species Diversity Menhinick Index
Feb, 09 3.236
Mar 3.205
Apr 3.216
May 3.169
Jun 3.115
Jul 3.205
Aug 3.224
Sep 3.217
Oct 3.178
Nov 3.192
Dec 3.203
Jan, 10 3.141
Copyright © 2014 IJAIR, All right reserved
949
International Journal of Agriculture Innovations and Research
Volume 2, Issue 6, ISSN
Eigenval p
0.01699 0.3069
0.007541 0.1584
0.006264 0.08911
0.005375 0.3861
Canonical correspondence analysis (CCA) diagram of 20 environmental parameters (Water temperature
-N, Phosphate-P, Alkalinity-AL, Hardness-HR, Calcium
CH, Conductivity-CN, Depth-D, Total dissolved solids-TD, Total suspended solids
OM, composition of Sand-Sa, Silt-Si, Clay-Cy) and 10 benthic groups(Cladocera
OS, Rotifera-RT, Oligochaeta-OL, Diptera-DI, Coleoptera-CO, Hemiptera
TR and Ephemeroptera-EP)
Monthly variation in Species Diversity and
Species Evenness of benthos
Menhinick Index
0.6089
0.6221
0.6751
0.6626
0.6668
0.7865
0.718
0.68
0.6171
0.6254
0.5537
0.5554
ACKNOWLEDGMENTS
Authors are highly thankful to the Chairman, Dept. of
Zoology, A.M.U. Aligarh for providing laboratory
facilities.
REFERENCES
[1] Barnes, H. 1959. Apparatus and methods of Oceanography
I. Chemical. George Allen and Unwin Ltd., 341 pp.
[2] Borja, A., Dauer, D., Dıaz, R., Llanso, R.J., Muxika, I.,
Rodrıguez, J.G. and Schaffner, L. 2008.
benthic quality conditions in Chesapeake Bay: a comparison of
three indices. Ecol. Indicators, 8: 395
[3] Brooks, T.M., Mittermeier, R. A., Da Fonseca, G. A. B.,
Gerlach, J., Hoffmann, M., Lamoreux, J. F., Mittermeier., C. G.,
Pilgrim, J. D and Rodrigues, A. S. L. 2006. Global
BiodiversityConservation Priorities.
International Journal of Agriculture Innovations and Research
, ISSN (Online) 2319-1473
%
40.35
17.91
14.88
12.77
Canonical correspondence analysis (CCA) diagram of 20 environmental parameters (Water temperature-WR, pH-
HR, Calcium-Ca, Magnesium-Mg,
TD, Total suspended solids-TSS,
Cy) and 10 benthic groups(Cladocera-CL,
CO, Hemiptera-HE, Trichoptera-
CKNOWLEDGMENTS
Authors are highly thankful to the Chairman, Dept. of
A.M.U. Aligarh for providing laboratory
EFERENCES
Apparatus and methods of Oceanography. Part
I. Chemical. George Allen and Unwin Ltd., 341 pp.
Borja, A., Dauer, D., Dıaz, R., Llanso, R.J., Muxika, I.,
, J.G. and Schaffner, L. 2008. Assessing estuarine
benthic quality conditions in Chesapeake Bay: a comparison of
, 8: 395–403.
Brooks, T.M., Mittermeier, R. A., Da Fonseca, G. A. B.,
Gerlach, J., Hoffmann, M., Lamoreux, J. F., Mittermeier., C. G.,
Pilgrim, J. D and Rodrigues, A. S. L. 2006. Global
BiodiversityConservation Priorities. Science, 313 (5783): 58.
Copyright © 2014 IJAIR, All right reserved
[4] Edmondson, W.T. 1959. Ward and Whipple’s Freshwater
Biology, 2nd Ed. John Wiley & Sons Inc., New York, 1248 pp.
[5] Gallep, G.W., J.F. Kitchell and S.M. Bartell, 1978.
release from lake sediments as affected by chironomid. Ver.
Inter. Vere Limnolog., 20: 458-465.
[6] Gray, J. S. 1989. Effects of environmental stress on species rich
assemblages. Biol. J. Linn. Soc. 37: 19-32.
[7] Hammer, O., Harper, D.A.T. and Ryan, P.D. 2001
Paleontological statistics software package for education and
data analysis. Palaeontologia Electronica, 4(1): 9.
[8] Idowu, E.O. and A.A.A. Ugwumba, 2005.
faunal characteristics of a southern Nigeria reservoir. Zoologist,
3:15-25.
[9] Ismail, A.A. and Dorgham, M. M. (2003)
a tool for assessing pollution in El – Dehaila Harbor (Alexandria,
Egypt). Oceanologia, 45 (1): 121-131.
[10] Lewis, O.T. and Gripenberg, S. 2008. Insect seed predators and
environmental change. Journal of Applied Ecology,
1599.
[11] Michael, P. 1984. Ecological methods for field and lab
investigations. L.C.E.U. Tata-McGraw Hill Publication
Company Ltd. (India), 1-401 pp.
[12] Pennak, R.W. 1978. Freshwater invertebrates of United States
2nd Ed. Johan Wiley and Sons Inc., New York, 803 pp.
[13] Shekhar, S. T. R., Kiran, B. B., Puttaiah, E. T., Shivraj. Y. and
Mahadevan, K.M. (2008) - Phytoplankton as index of water
quality with reference to industrial pollution. Journ.
Biol., 29 (2) – 233-236.
[14] Teixeira, H., Salas, F., Borja, A., Neto, J.
2008. A benthic perspective in assessing the ecological status of
estuaries: the case of the Mondego Estuary (Portugal).
Indicators., 8: 404–416.
[15] Tonapi, G.T., 1980. Fresh water animals of India
IBH Publishing Co., New Delhi, 341 pp.
[16] Trivedy, R.K. and Goel, P.K. 1984. Chemical and biological
methods for water pollution studies. Karad, India; 215 pp.
[17] Weisberg, S.B., Thompson, B., Ranasinghe, J.A., Montagne,
D.E., Cadien, D.B., Dauer, D.M., Diener, D., Oliver, J.,
D.J., Velarde, R.G. and Word, J.Q. 2008.
among experts applying best professional judgment to assess the
condition of benthic infaunal communities.
Indicators, 8: 389–394.
AUTHOR’S PROFILE
Dr. Habeeba Ahmad M. Phil and P.hD from Aligarh Muslim University,
Aligarh, U.P., India
Email: [email protected]
Copyright © 2014 IJAIR, All right reserved
950
International Journal of Agriculture Innovations and Research
Volume 2, Issue 6, ISSN
Ward and Whipple’s Freshwater
Ed. John Wiley & Sons Inc., New York, 1248 pp.
.F. Kitchell and S.M. Bartell, 1978. Phosphorous
release from lake sediments as affected by chironomid. Ver.
1989. Effects of environmental stress on species rich
32.
Hammer, O., Harper, D.A.T. and Ryan, P.D. 2001. PAST:
Paleontological statistics software package for education and
, 4(1): 9.
. Physical chemical and
faunal characteristics of a southern Nigeria reservoir. Zoologist,
Ismail, A.A. and Dorgham, M. M. (2003) – Ecological indices as
Dehaila Harbor (Alexandria,
Lewis, O.T. and Gripenberg, S. 2008. Insect seed predators and
Journal of Applied Ecology, 45 (6): 1593-
Ecological methods for field and laboratory
McGraw Hill Publication
Freshwater invertebrates of United States.
Ed. Johan Wiley and Sons Inc., New York, 803 pp.
Shekhar, S. T. R., Kiran, B. B., Puttaiah, E. T., Shivraj. Y. and
Phytoplankton as index of water
quality with reference to industrial pollution. Journ. Environ.
, Neto, J.M. and Marques, J.C.
A benthic perspective in assessing the ecological status of
estuaries: the case of the Mondego Estuary (Portugal). Ecol.
Fresh water animals of India. Oxford and
Chemical and biological
Karad, India; 215 pp.
Weisberg, S.B., Thompson, B., Ranasinghe, J.A., Montagne,
D.E., Cadien, D.B., Dauer, D.M., Diener, D., Oliver, J., Reish,
The level of agreement
among experts applying best professional judgment to assess the
condition of benthic infaunal communities. Ecological
r. Habeeba Ahmad Kabeer
M. Phil and P.hD from Aligarh Muslim University,
Email: [email protected]
International Journal of Agriculture Innovations and Research
, ISSN (Online) 2319-1473
Related Documents