Asian Journal of Pharmaceutical and Biological Research Original Research Effect of Trichloroethylene (TCE) on Oxidative Stress and Vital Organ Damage in BALB/c Mice Marimuthu Mathan Kumar, Siddikuzzaman, Chandrasekharan Guruvayoorappan and Viswanathan Mariammal Berlin Grace* Department of Biotechnology, Karunya University, Coimbatore-641 114, Tamil Nadu, India,Tel No: +919487846617, Fax : +914222615615, E-mail: [email protected] Abstract Objective: In the present study we had analyzed the effect of TCE mixture (TCE, 250mg/Kg and Trichloroacetic acid (TCA) 250mg/kg) on the immune status as well as its effect on the antioxidant status in experimental animals. Methods: Several antioxidant stress like SOD, GSH and LPO, toxic effects by SGOT, SGPT and creatinine, urea level was measured. Histopathology was examined by microscopy. Results: It was found increased serum levels of urea, creatinine, SGOT and SGPT indicating its toxic effects on vital organs like kidney and liver. Significant decrease in superoxide dismutase (SOD) and glutathione and increased lipid peroxide was observed after TCE administration in experimental animals. Conclusion: In conclusion our present study reveals that TCE administration could result in immunosuppression accompanied with reduced antioxidant status. INTRODUCTION T and higher oxidation rate leads to the risk of cancer [8] in humans and other experimental animals . richloroethylene (TCE) is a non- flammable chlorinated solvent with The oxidative stress, which it is not only a sweet smell, used in industries as the result of an imbalance between oxidants and general solvent- mainly for degreasing metal parts. anti-oxidants, but also the consequence of [9] TCE is found in measurable amounts in the food imbalance in the cellular redox status . Oxidation [1] chain and in drinking water and was considered as is a chemical reaction that transfers electrons from the primary ground water contaminant by a substance to an oxidizing agent. Oxidation [2] registries . During the last 20 years, its potential reactions can produce free radicals. In turn, these adverse effect on human health from TCE exposure radicals can start chain reactions that damage cells. either occupationally or via drinking water has Reactive oxygen species (ROS) readily combine been studied at different ways. The National and oxidize biomolecules and make them inactive Toxicology Program (NTP) studies have shown with subsequent damage to cells, tissues and [10] TCE to be a rodent hepato-carcinogen when given organs . Antioxidants are compounds that are [3] in high doses by corn oil gavages . The involved in effective scavenging of free radicals Environmental Protection Agency (EPA) of U.S and in suppressing the actions of reactive oxygen also identified TCE as rodent hepato-carcinogen substances. Antioxidants level is decreased by [4] cigarette smoking, carbonated substances and other upon life time exposure . International Agency for toxic metabolites like TCE and chlorinated Research on Cancer (IARC) classified TCE as a substances upon frequent intake. TCE has been suspected carcinogen in humans, especially for [5] reported to form covalent binding and inhibit liver and cervical cancers . However TCE is not [11] cytochrome p450 . found to be a direct acting carcinogen but act through its major metabolites Trichloro acetic Acid In this study, the antioxidants such as (TCA) and minor metabolite Dichloro Acetic Acid superoxide dismutase (SOD) and glutathione [6,7] (DCA) . Due to the accumulation of TCE and its (GSH) were studied. Also lipid peroxide (LPO) metabolites, oxidation occurs in liver and kidney formation was analyzed in TCE treated mice. SOD Publication History Received :12 Jul 2011 Accepted :29 Jul 2011 Published :10 Sep 2011 Key Words Trichloroethylene TCA TCE toxicity Free radical Tissue damage. e ISSN: 2231-2218 © 2011 Asian J Pharm Biol Res 240

Welcome message from author
This document is posted to help you gain knowledge. Please leave a comment to let me know what you think about it! Share it to your friends and learn new things together.
Transcript
Asian Journal of Pharmaceutical and Biological Research Original Research
Effect of Trichloroethylene (TCE) on Oxidative Stress and Vital Organ Damage in BALB/c Mice
Marimuthu Mathan Kumar, Siddikuzzaman, Chandrasekharan Guruvayoorappan and Viswanathan Mariammal Berlin Grace*
Department of Biotechnology, Karunya University, Coimbatore-641 114, Tamil Nadu, India,Tel No: +919487846617, Fax : +914222615615, E-mail: [email protected]
AbstractObjective: In the present study we had analyzed the effect of TCE mixture (TCE, 250mg/Kg and Trichloroacetic acid (TCA) 250mg/kg) on the immune status as well as its effect on the antioxidant status in experimental animals. Methods: Several antioxidant stress like SOD, GSH and LPO, toxic effects by SGOT, SGPT and creatinine, urea level was measured. Histopathology was examined by microscopy. Results: It was found increased serum levels of urea, creatinine, SGOT and SGPT indicating its toxic effects on vital organs like kidney and liver. Significant decrease in superoxide dismutase (SOD) and glutathione and increased lipid peroxide was observed after TCE administration in experimental animals. Conclusion: In conclusion our present study reveals that TCE administration could result in immunosuppression accompanied with reduced antioxidant status.
INTRODUCTION
Tand higher oxidation rate leads to the risk of cancer
[8]in humans and other experimental animals . richloroethylene (TCE) is a non-flammable chlorinated solvent with The oxidative stress, which it is not only a sweet smell, used in industries as the result of an imbalance between oxidants and
general solvent- mainly for degreasing metal parts. anti-oxidants, but also the consequence of [9]TCE is found in measurable amounts in the food imbalance in the cellular redox status . Oxidation
[1]chain and in drinking water and was considered as is a chemical reaction that transfers electrons from the primary ground water contaminant by a substance to an oxidizing agent. Oxidation
[2]registries . During the last 20 years, its potential reactions can produce free radicals. In turn, these adverse effect on human health from TCE exposure radicals can start chain reactions that damage cells. either occupationally or via drinking water has Reactive oxygen species (ROS) readily combine been studied at different ways. The National and oxidize biomolecules and make them inactive Toxicology Program (NTP) studies have shown with subsequent damage to cells, tissues and
[10]TCE to be a rodent hepato-carcinogen when given organs . Antioxidants are compounds that are [3]in high doses by corn oil gavages . The involved in effective scavenging of free radicals
Environmental Protection Agency (EPA) of U.S and in suppressing the actions of reactive oxygen also identified TCE as rodent hepato-carcinogen substances. Antioxidants level is decreased by
[4] cigarette smoking, carbonated substances and other upon life time exposure . International Agency for toxic metabolites like TCE and chlorinated Research on Cancer (IARC) classified TCE as a substances upon frequent intake. TCE has been suspected carcinogen in humans, especially for
[5] reported to form covalent binding and inhibit liver and cervical cancers . However TCE is not [11]
cytochrome p450 .found to be a direct acting carcinogen but act through its major metabolites Trichloro acetic Acid
In this study, the antioxidants such as (TCA) and minor metabolite Dichloro Acetic Acid
superoxide dismutase (SOD) and glutathione [6,7](DCA) . Due to the accumulation of TCE and its (GSH) were studied. Also lipid peroxide (LPO) metabolites, oxidation occurs in liver and kidney formation was analyzed in TCE treated mice. SOD
Publication History Received :12 Jul 2011
Accepted :29 Jul 2011
Published :10 Sep 2011
Key Words TrichloroethyleneTCATCE toxicityFree radical Tissue damage.
e ISSN: 2231-2218 © 2011 Asian J Pharm Biol Res
240
is responsible for the dismutase of oxygen radicals kept as normal untreated control whereas group II to hydrogen peroxides, which is subsequently were treated with TCE mixture (TCE 250mg/kg,
[14]detoxified by glutathione peroxidase. As this TCA 250mg/kg, Methionine 12.5mg/kg) for 10 oxidative stress can impair the normal function of consecutive days. Six animals from each group these organs, attempts were made to analyze the were euthanized by chloroform anesthesia during
th th th th thfunctional status of liver and kidney by assaying the the 0 hr, 10 , 20 , 30 , 40 and 50 day respectively. serum enzymatic markers, glutamic oxaloacetic Blood was collected by cardiac puncture and the transaminase and glutamic pyruvic transaminase serum was separated by centrifugation. The liver (SGOT and SGPT), urea, creatinine and the and kidney were excised, washed in ice cold pathological damage of tissue as well. Phosphate Buffer Saline (PBS, pH-7.2) weighed Furthermore, TCE has been reported to promote and homogenized with Tris HCl buffer (pH 7.8). development of autoimmunity by their metabolic The homogenate were prepared by centrifuging for
[12]activation . It has been reported that exposure to 30 min at 10, 000 rpm, 4ºC and were used for TCE at high concentrations affects the immune biochemical estimations. The protein level in the
[13]system . In the present study, we had therefore tissue homogenate was estimated by the method of [15]evaluated the effect of TCE mixture on the immune Lowry . A portion of the liver and kidney was kept
status as well as its effect on the antioxidant in 5% formalin for histopathological analysis. enzymes in vivo.
The effect of TCE mixture on total WBC Trichloroethylene (TCE) and i ts [16]
count was determined as explained previously . metabolite Trichloro acetic acid (TCA), Briefly 20µl of the blood sample was mixed with methionine and xylene were purchased from Hi diluting fluid (Crystal violet, 1% in methanol) and Media Laboratories, Mumbai, India. SGOT, SGPT, loaded in haemocytometer and counted under Creatinine, Urea kits were purchased from Span inverted microscope (40X magnification). The Diagnostics, Surat, India. All the other chemicals haemoglobin content in the blood sample was used for the experiment were of analytical reagent
[17]grade. determined by Cyanmethaemoglobin method . Briefly 20µl of the blood sample was mixed with 5ml of Drabkin's solution. The mixture was incubated at 37°C for 5 minutes and absorbance
BALB/c mice (4-6 weeks old, 20-25g) was read at 550 nm. Body weight of all mice was noted before the experiment started and before were purchased from Pasteur Institute of India, scarification.Coonoor, Tamil Nadu, India. BALB/c is an albino
mice and having long reproductive life span.
BALB/c mice are widely used for cancer and
immunology research. The animals were kept in
well-ventilated cages at 37± 1ºC, 40± 10% The effect of TCE mixture on the serum humidity and 12 hours light-dark during the urea level was estimated as explained in the reagent
kit (Urease Bertholet End Point Assay kit) supplied experimental period. The mice were fed with by SPAN Diagnostics, Surat, India. Urea normal mice chow, a natural ingredient diet (Sai concentration in the sample were expressed as Feeds, Bangalore, India) and water ad libitum. All mg/dl. Similarly serum creatinine levels were the animal experiments were carried out according estimated using the reagent kit as per the
to the rules and regulation of the Institutional manufacturers' procedure (SPAN Diagnostics, Animal Ethics Committee. Surat, India). Creatinine concentration in the
sample were expressed as mg/dl.
Male BALB/c mice (20-25g) were divided into two groups of 36 animals each. Group I was
Determination of the effect of TCE mixture on MATERIALS AND METHODS
the Total WBC Count and Hemoglobin levelChemicals and reagents
Animals
Determination of the effect of TCE mixture on Urea and Creatinine levels
Experimental Design
Asian J Pharm Biol Res Jul-Sep 2011 Vol. 1(3)
241
Determination of the effect of TCE mixture on Histopathological analysisSGOT and SGPT levels (Span Diagnostics Ltd., Surat, India)
Determination of the effect of TCE mixture on in vivo Superoxide Dismutase (SOD) activity
Statistical analysis
RESULTSEffect of TCE mixture on the body weight of experimental animals
Determination of the effect of TCE mixture on in [19vivo Glutathione (GSH) level
Determination of the effect of TCE mixture on [20]
lipid peroxide (LPO)
Effect of TCE mixture on total WBC count and hemoglobin level
Liver and kidney were dissected, washed in saline and a small portion of it was quickly fixed
The effect of TCE mixture on the SGOT in 10% formalin and a portion was blocked in
and SGPT levels in the serum was estimated using paraffin after processing. Sections of 4-5 ìm
the Assay kit supplied by SPAN Diagnostics, Surat, thickness were taken and subjected to
India. Absorbance was taken at 340 nm and the histopathological analysis using Hematoxylin and
SGOT and SGPT concentration was expressed as Eosin (H&E) stain. The histologic changes were
IU/l.observed under light microscope and validated by a chief histopathologist.
[18]
The effect of TCE mixture on the serum and tissue Superoxide dismutase (SOD) activity All data were expressed as mean ± S.D. was measured by nitro blue tetrazolium (NBT) The statistical analysis was done by one way
[18]reduction method . The reaction mixture ANOVA followed by Dunnett's test using contained EDTA (6µM), NaCN (3µg), riboflavin Graphpad InStat version 3.00 for Windows XP, (2µM), hemolysed blood (0.1ml) and phosphate GraphPad Software, San Diego, California, USA. buffer (67mM, pH 7.8) in a final volume of 3 ml. P value less than 0.05 was considered significant.The tubes were uniformly illuminated with an incandescent lamp for 15 min and optical density was measured at 560 nm before and after illumination.
] The effect of TCE mixture on the body weight was shown in Table 1. The body weight of
The effect of TCE mixture on the tissue untreated control animals and TCE mixture treated glutathione level was assayed by the method of was found to be 23.02 ± 1.7 grams and 24.13 ± 3.7
[19]Moron et al., 1979 based on the reaction with 5'5' grams respectively at 0 hour. The body weight was Diothiobis 2-nitrobenzoic acid (DTNB). The found to be 28.02 ± 2.6 grams on Day 50 for absorbance was read at 412 nm. untreated animals and administration of TCE
mixture resulted in significant reduction in the body weight, when compared to untreated control
thanimals and on 50 day after TCE mixture treatment the body weight was found 21.54 ± 2.2** The effect of TCE mixture on the serum grams.and tissue lipid peroxide was estimated as
[20]explained previously . Serum or tissue homogenate (100 µl) was taken and equal volume of Tris buffer, Ascorbic acid, Ferrus Ammonium
Effect of TCE mixture on total WBC count Sulphate (freshly prepared) and 50 µl of KCl was and hemoglobin level was shown in table 1. added in the mixture and allowed to incubate at Administration of TCE mixture showed gradual 37°c for 1 hour. After 1 hour, 400µl of mixture were increase in total WBC count. Total WBC count in taken and 200µl of SDS, 1.5ml of Acetic acid and untreated control animals was found to be 7633.30 TBA (Thiobarbituric acid) was added and made up
3 th± 120 cells /mm on 0 hrs and on 50 day it was to 4ml. This mixture was kept in 1 hour at 100°c and 38250.00 ± 138 cells /mm . Administration of TCE cooled at room temperature. After cooling the
mixture resulted in significant increase in total solution, 1ml of distilled water was added followed th
WBC count on 0 hrs and 50 day the value was by 5 ml of Butanol: Pyridine (1:15). The solutions 3
were centrifuged at 2000 rpm and the supernatant found to 7416.6 ± 145* cells /mm and 11650 ± 3 was collected and read at 560nm. 145** cells /mm respectively. Administration of
TCE mixture resulted in significant decrease in
Asian J Pharm Biol Res Jul-Sep 2011 Vol. 1(3)
242
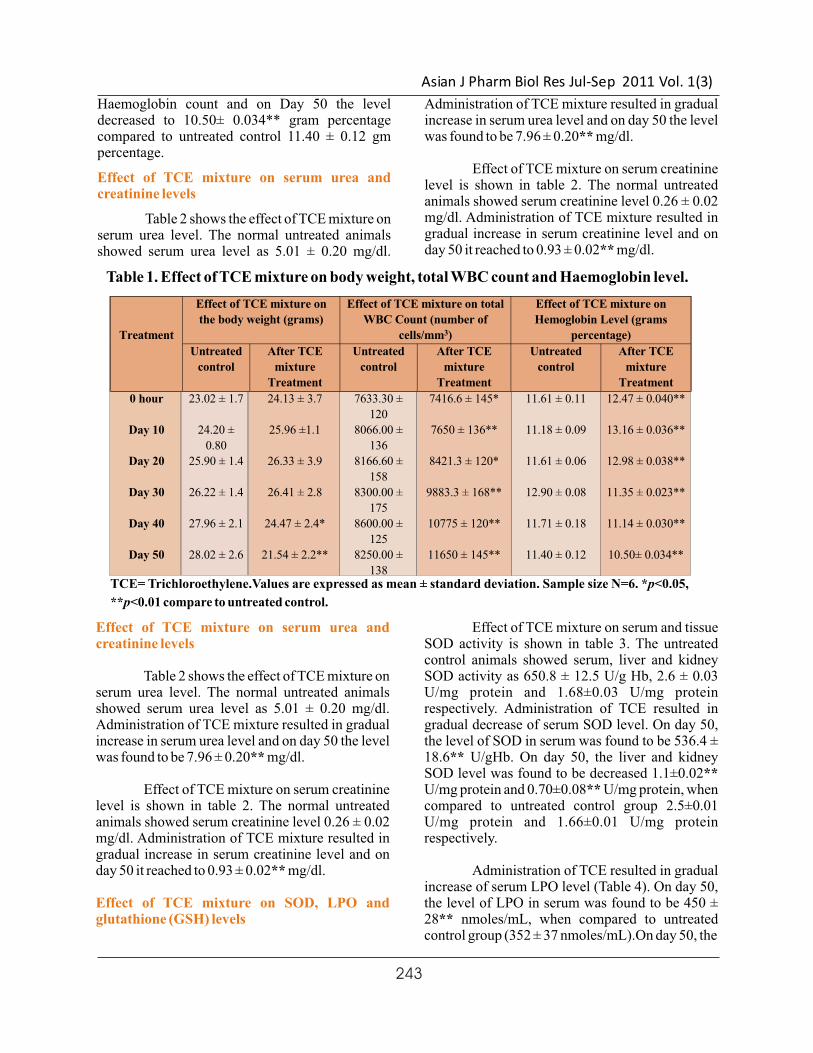
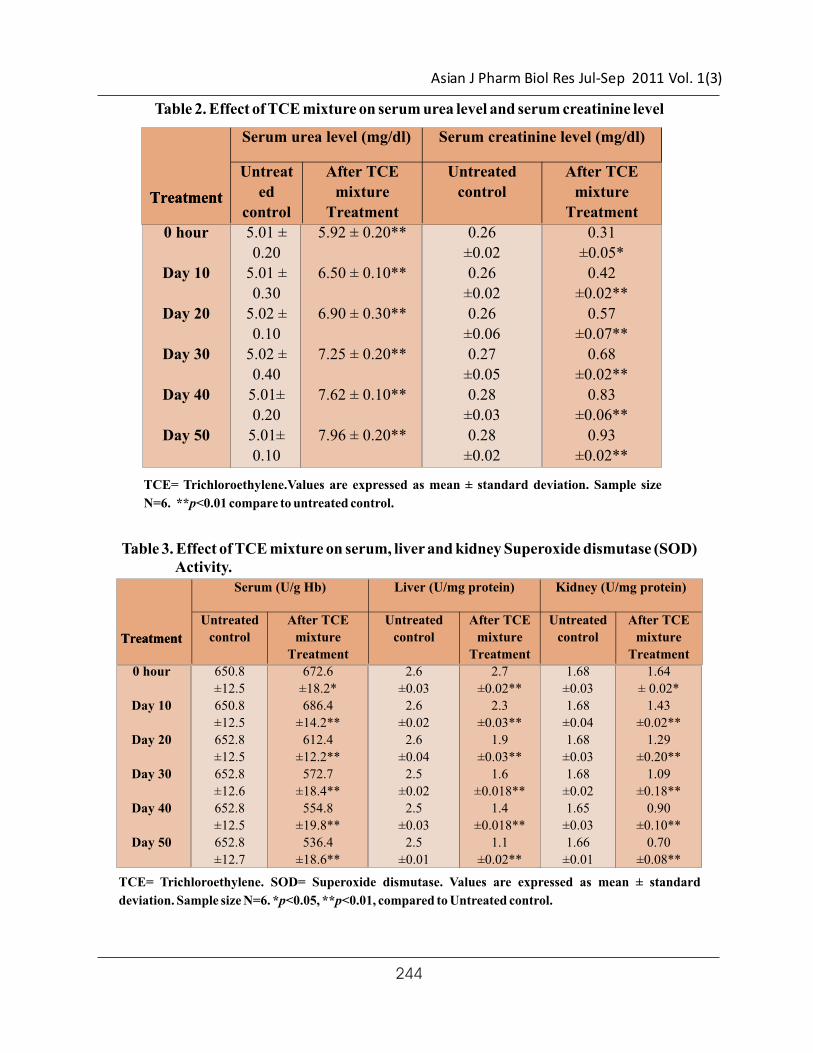
Haemoglobin count and on Day 50 the level Administration of TCE mixture resulted in gradual decreased to 10.50± 0.034** gram percentage increase in serum urea level and on day 50 the level compared to untreated control 11.40 ± 0.12 gm was found to be 7.96 ± 0.20** mg/dl. percentage.
Effect of TCE mixture on serum creatinine level is shown in table 2. The normal untreated animals showed serum creatinine level 0.26 ± 0.02 mg/dl. Administration of TCE mixture resulted in Table 2 shows the effect of TCE mixture on gradual increase in serum creatinine level and on serum urea level. The normal untreated animals day 50 it reached to 0.93 ± 0.02** mg/dl. showed serum urea level as 5.01 ± 0.20 mg/dl.
Effect of TCE mixture on serum urea and creatinine levels
Asian J Pharm Biol Res Jul-Sep 2011 Vol. 1(3)
Treatment
Effect of TCE mixture on
the body weight (grams)
Effect of TCE mixture on total
WBC Count (number of
cells/mm3)
Effect of TCE mixture on
Hemoglobin Level (grams
percentage)
Untreated
control
After TCE
mixture
Treatment
Untreated
control
After TCE
mixture
Treatment
Untreated
control
After TCE
mixture
Treatment
0 hour 23.02 ± 1.7 24.13 ± 3.7 7633.30 ±
120
7416.6 ± 145* 11.61 ± 0.11 12.47 ± 0.040**
Day 10 24.20 ±
0.80
25.96 ±1.1 8066.00 ±
136
7650 ± 136** 11.18 ± 0.09 13.16 ± 0.036**
Day 20 25.90 ± 1.4 26.33 ± 3.9 8166.60 ±
158
8421.3 ± 120* 11.61 ± 0.06 12.98 ± 0.038**
Day 30 26.22 ± 1.4 26.41 ± 2.8 8300.00 ±
175
9883.3 ± 168** 12.90 ± 0.08 11.35 ± 0.023**
Day 40 27.96 ± 2.1 24.47 ± 2.4* 8600.00 ±
125
10775 ± 120** 11.71 ± 0.18 11.14 ± 0.030**
Day 50 28.02 ± 2.6 21.54 ± 2.2** 8250.00 ±
138
11650 ± 145** 11.40 ± 0.12 10.50± 0.034**
Table 1. Effect of TCE mixture on body weight, total WBC count and Haemoglobin level.
TCE= Trichloroethylene.Values are expressed as mean ± standard deviation. Sample size N=6. *p<0.05,
**p<0.01 compare to untreated control.
Effect of TCE mixture on serum urea and creatinine levels
Effect of TCE mixture on SOD, LPO and glutathione (GSH) levels
Effect of TCE mixture on serum and tissue SOD activity is shown in table 3. The untreated control animals showed serum, liver and kidney
Table 2 shows the effect of TCE mixture on SOD activity as 650.8 ± 12.5 U/g Hb, 2.6 ± 0.03 serum urea level. The normal untreated animals U/mg protein and 1.68±0.03 U/mg protein showed serum urea level as 5.01 ± 0.20 mg/dl. respectively. Administration of TCE resulted in Administration of TCE mixture resulted in gradual gradual decrease of serum SOD level. On day 50, increase in serum urea level and on day 50 the level the level of SOD in serum was found to be 536.4 ± was found to be 7.96 ± 0.20** mg/dl. 18.6** U/gHb. On day 50, the liver and kidney
SOD level was found to be decreased 1.1±0.02** Effect of TCE mixture on serum creatinine U/mg protein and 0.70±0.08** U/mg protein, when
level is shown in table 2. The normal untreated compared to untreated control group 2.5±0.01 animals showed serum creatinine level 0.26 ± 0.02 U/mg protein and 1.66±0.01 U/mg protein mg/dl. Administration of TCE mixture resulted in respectively.gradual increase in serum creatinine level and on day 50 it reached to 0.93 ± 0.02** mg/dl. Administration of TCE resulted in gradual
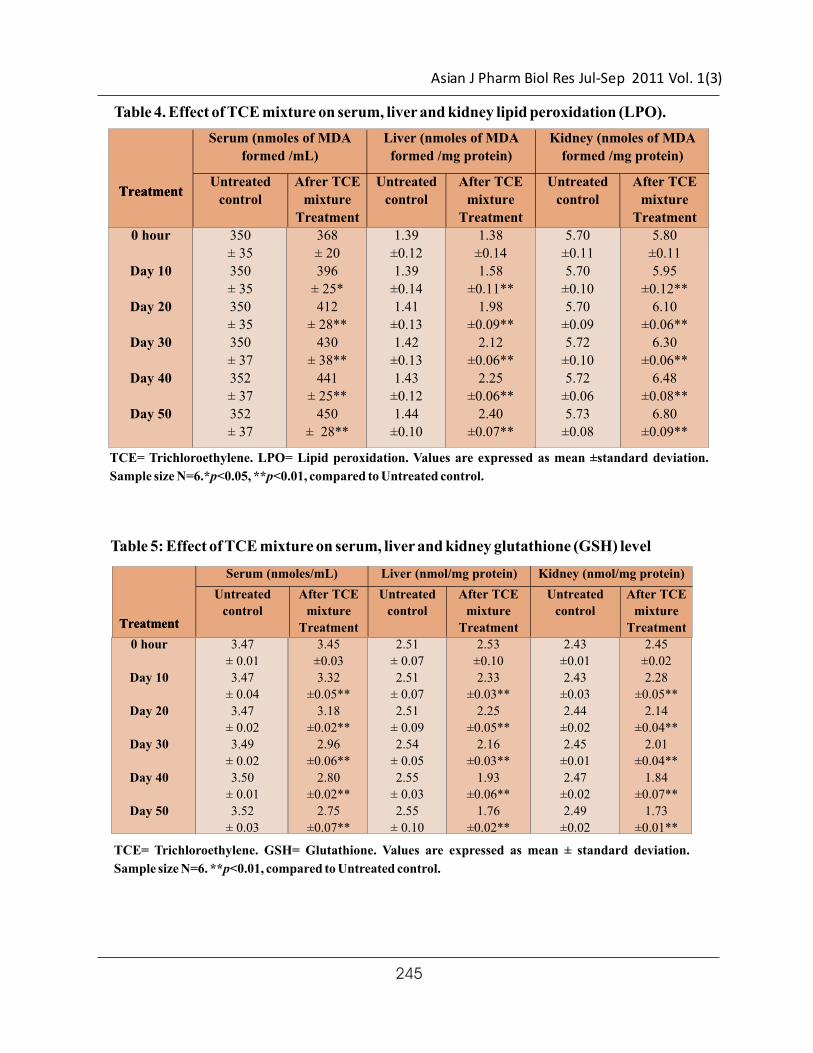
increase of serum LPO level (Table 4). On day 50, the level of LPO in serum was found to be 450 ± 28** nmoles/mL, when compared to untreated control group (352 ± 37 nmoles/mL).On day 50, the
243
Asian J Pharm Biol Res Jul-Sep 2011 Vol. 1(3)
Table 2. Effect of TCE mixture on serum urea level and serum creatinine level
Treatment
Serum urea level (mg/dl) Serum creatinine level (mg/dl)
Treatment
Untreat
ed
control
After TCE
mixture
Treatment
Untreated
control
After TCE
mixture
Treatment
0 hour 5.01 ±
0.20
5.92 ± 0.20** 0.26
±0.02
0.31
±0.05*
Day 10 5.01 ±
0.30
6.50 ± 0.10** 0.26
±0.02
0.42
±0.02**
Day 20 5.02 ±
0.10
6.90 ± 0.30** 0.26
±0.06
0.57
±0.07**
Day 30 5.02 ±
0.40
7.25 ± 0.20** 0.27
±0.05
0.68
±0.02**
Day 40 5.01±
0.20
7.62 ± 0.10** 0.28
±0.03
0.83
±0.06**
Day 50 5.01±
0.10
7.96 ± 0.20** 0.28
±0.02
0.93
±0.02**
TCE= Trichloroethylene.Values are expressed as mean ± standard deviation. Sample size
N=6. **p<0.01 compare to untreated control.
Treatment
Serum (U/g Hb) Liver (U/mg protein) Kidney (U/mg protein)
Treatment
Untreated
control
After TCE
mixture
Treatment
Untreated
control
After TCE
mixture
Treatment
Untreated
control
After TCE
mixture
Treatment
0 hour 650.8
±12.5
672.6
±18.2*
2.6
±0.03
2.7
±0.02**
1.68
±0.03
1.64
± 0.02*
Day 10 650.8
±12.5
686.4
±14.2**
2.6
±0.02
2.3
±0.03**
1.68
±0.04
1.43
±0.02**
Day 20 652.8
±12.5
612.4
±12.2**
2.6
±0.04
1.9
±0.03**
1.68
±0.03
1.29
±0.20**
Day 30 652.8
±12.6
572.7
±18.4**
2.5
±0.02
1.6
±0.018**
1.68
±0.02
1.09
±0.18**
Day 40 652.8
±12.5
554.8
±19.8**
2.5
±0.03
1.4
±0.018**
1.65
±0.03
0.90
±0.10**
Day 50 652.8
±12.7
536.4
±18.6**
2.5
±0.01
1.1
±0.02**
1.66
±0.01
0.70
±0.08**
TCE= Trichloroethylene. SOD= Superoxide dismutase. Values are expressed as mean ± standard
deviation. Sample size N=6. *p<0.05, **p<0.01, compared to Untreated control.
Table 3. Effect of TCE mixture on serum, liver and kidney Superoxide dismutase (SOD) Activity.
244
Asian J Pharm Biol Res Jul-Sep 2011 Vol. 1(3)
Treatment
Serum (nmoles of MDA
formed /mL)
Liver (nmoles of MDA
formed /mg protein)
Kidney (nmoles of MDA
formed /mg protein)
TreatmentUntreated
control
Afrer TCE
mixture
Treatment
Untreated
control
After TCE
mixture
Treatment
Untreated
control
After TCE
mixture
Treatment
0 hour 350
± 35
368
± 20
1.39
±0.12
1.38
±0.14
5.70
±0.11
5.80
±0.11
Day 10 350
± 35
396
± 25*
1.39
±0.14
1.58
±0.11**
5.70
±0.10
5.95
±0.12**
Day 20 350
± 35
412
± 28**
1.41
±0.13
1.98
±0.09**
5.70
±0.09
6.10
±0.06**
Day 30 350
± 37
430
± 38**
1.42
±0.13
2.12
±0.06**
5.72
±0.10
6.30
±0.06**
Day 40 352
± 37
441
± 25**
1.43
±0.12
2.25
±0.06**
5.72
±0.06
6.48
±0.08**
Day 50 352
± 37
450
± 28**
1.44
±0.10
2.40
±0.07**
5.73
±0.08
6.80
±0.09**
Table 4. Effect of TCE mixture on serum, liver and kidney lipid peroxidation (LPO).
TCE= Trichloroethylene. LPO= Lipid peroxidation. Values are expressed as mean ±standard deviation.
Sample size N=6.*p<0.05, **p<0.01, compared to Untreated control.
Treatment
Serum (nmoles/mL) Liver (nmol/mg protein) Kidney (nmol/mg protein)
Treatment
Untreated
control
After TCE
mixture
Treatment
Untreated
control
After TCE
mixture
Treatment
Untreated
control
After TCE
mixture
Treatment
0 hour 3.47
± 0.01
3.45
±0.03
2.51
± 0.07
2.53
±0.10
2.43
±0.01
2.45
±0.02
Day 10 3.47
± 0.04
3.32
±0.05**
2.51
± 0.07
2.33
±0.03**
2.43
±0.03
2.28
±0.05**
Day 20 3.47
± 0.02
3.18
±0.02**
2.51
± 0.09
2.25
±0.05**
2.44
±0.02
2.14
±0.04**
Day 30 3.49
± 0.02
2.96
±0.06**
2.54
± 0.05
2.16
±0.03**
2.45
±0.01
2.01
±0.04**
Day 40 3.50
± 0.01
2.80
±0.02**
2.55
± 0.03
1.93
±0.06**
2.47
±0.02
1.84
±0.07**
Day 50 3.52
± 0.03
2.75
±0.07**
2.55
± 0.10
1.76
±0.02**
2.49
±0.02
1.73
±0.01**
Table 5: Effect of TCE mixture on serum, liver and kidney glutathione (GSH) level
TCE= Trichloroethylene. GSH= Glutathione. Values are expressed as mean ± standard deviation.
Sample size N=6. **p<0.01, compared to Untreated control.
245
Asian J Pharm Biol Res Jul-Sep 2011 Vol. 1(3)
Treatment
SGOT (IU/l) level SGPT(IU/l) level
TreatmentUntreated
control
After TCE
mixture
Treatment
Untreated
control
After TCE
mixture
Treatment
0 hour 2.94
±0.43
2.35
±0.29*
2.50
±0.43
2.35
±0.29*
Day 10 2.94
±0.42
3.11
±0.20
2.52
±0.42
6.11
±0.20**
Day 20 2.96
±0.43
5.25
±0.21**
2.53
±0.43
7.25
±0.21**
Day 30 2.96
±0.41
6.32
±0.12**
2.53
±0.41
8.32
±0.12**
Day 40 2.98
±0.43
7.28
±0.62**
2.55
±0.43
9.28
±0.62**
Day 50 2.98
±0.46
8.57
±0.40**
2.56
±0.46
11.57
±0.40**
Table 6: Effect of TCE mixture on SGOT and SGPT level in serum
TCE= Trichloroethylene. Values are expressed as mean ± standard deviation. Sample size N=6.
*p<0.05, **p<0.01, compared to Untreated control.
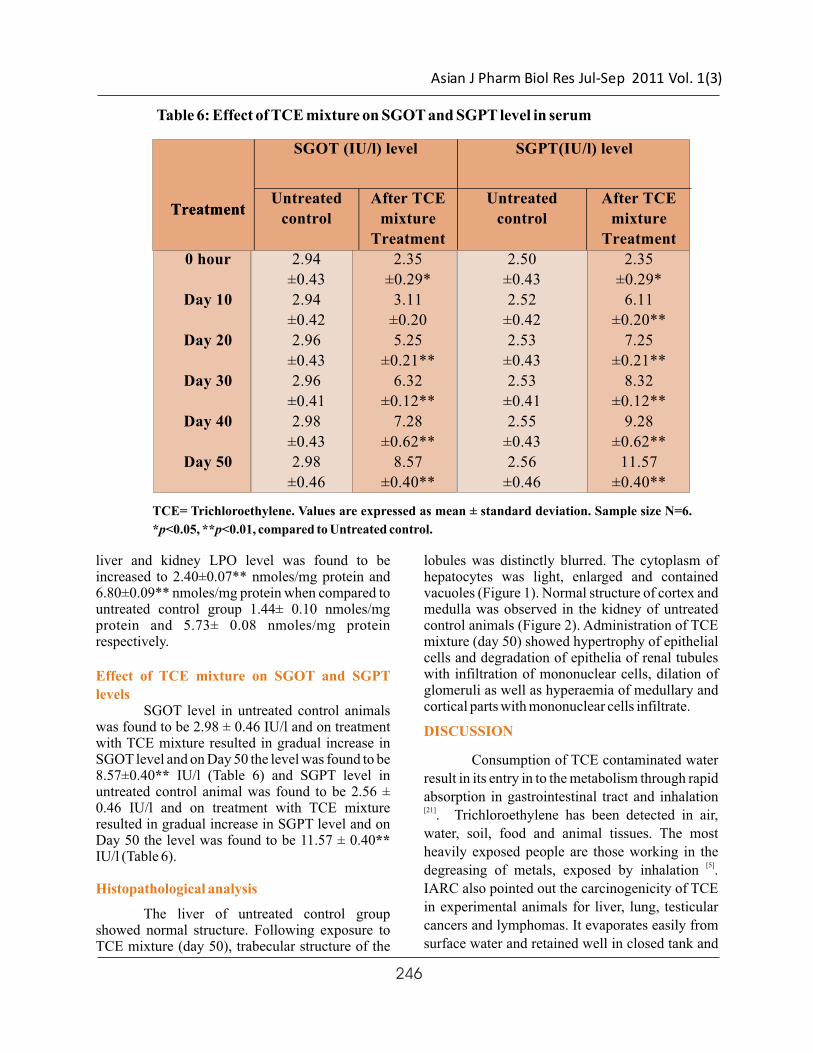
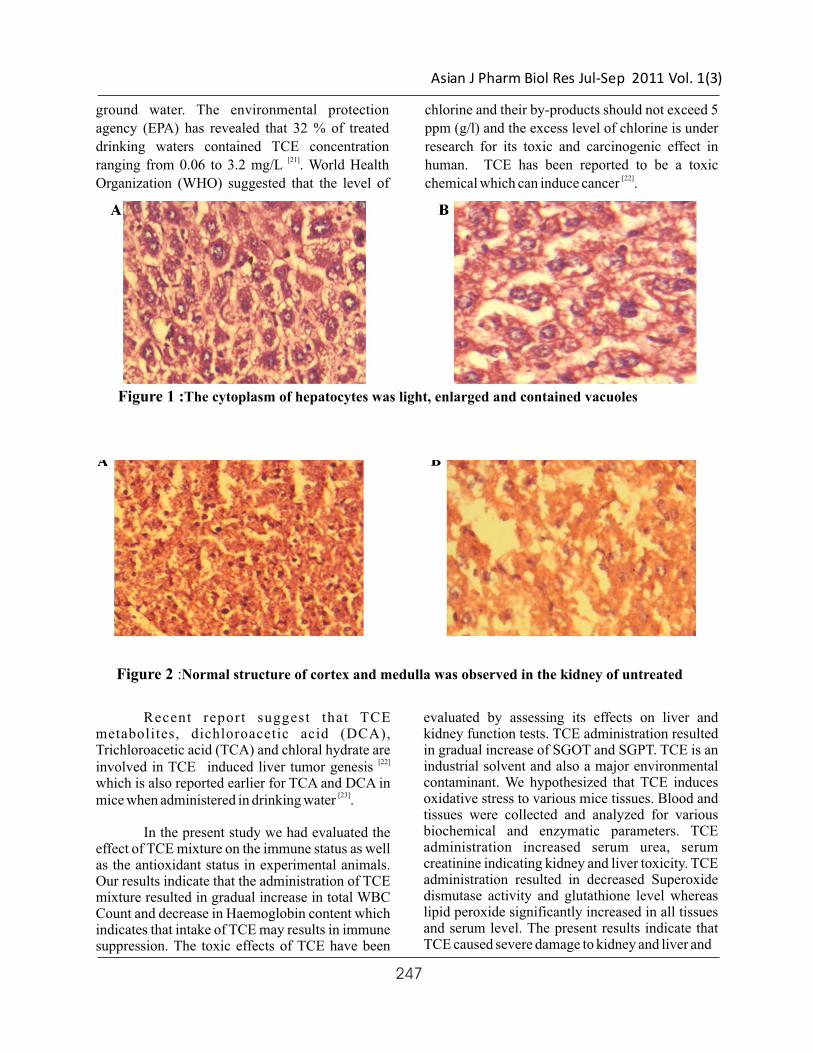
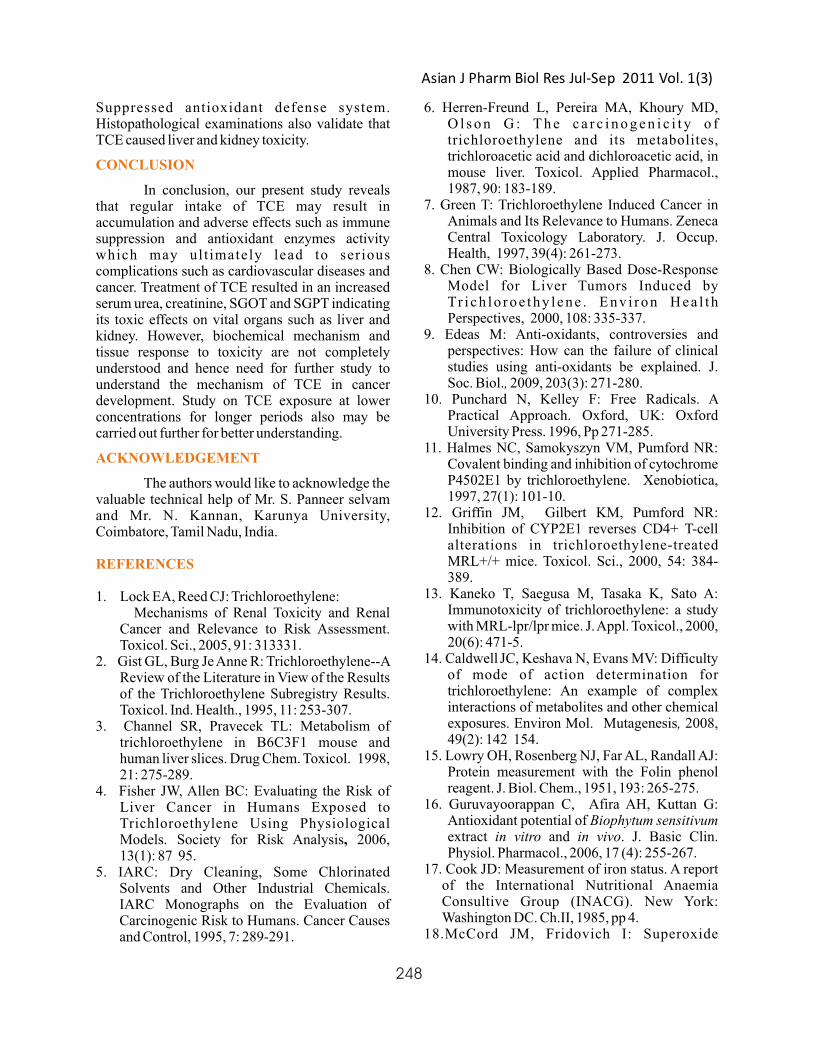
liver and kidney LPO level was found to be lobules was distinctly blurred. The cytoplasm of increased to 2.40±0.07** nmoles/mg protein and hepatocytes was light, enlarged and contained 6.80±0.09** nmoles/mg protein when compared to vacuoles (Figure 1). Normal structure of cortex and untreated control group 1.44± 0.10 nmoles/mg medulla was observed in the kidney of untreated protein and 5.73± 0.08 nmoles/mg protein control animals (Figure 2). Administration of TCE respectively. mixture (day 50) showed hypertrophy of epithelial
cells and degradation of epithelia of renal tubules with infiltration of mononuclear cells, dilation of glomeruli as well as hyperaemia of medullary and cortical parts with mononuclear cells infiltrate.SGOT level in untreated control animals
was found to be 2.98 ± 0.46 IU/l and on treatment with TCE mixture resulted in gradual increase in SGOT level and on Day 50 the level was found to be Consumption of TCE contaminated water 8.57±0.40** IU/l (Table 6) and SGPT level in result in its entry in to the metabolism through rapid untreated control animal was found to be 2.56 ± absorption in gastrointestinal tract and inhalation 0.46 IU/l and on treatment with TCE mixture [21]. Trichloroethylene has been detected in air, resulted in gradual increase in SGPT level and on
water, soil, food and animal tissues. The most Day 50 the level was found to be 11.57 ± 0.40** heavily exposed people are those working in the IU/l (Table 6).
[5]degreasing of metals, exposed by inhalation . IARC also pointed out the carcinogenicity of TCE
in experimental animals for liver, lung, testicular The liver of untreated control group cancers and lymphomas. It evaporates easily from showed normal structure. Following exposure to surface water and retained well in closed tank and TCE mixture (day 50), trabecular structure of the
Effect of TCE mixture on SGOT and SGPT
levels
DISCUSSION
Histopathological analysis
246
Asian J Pharm Biol Res Jul-Sep 2011 Vol. 1(3)
ground water. The environmental protection chlorine and their by-products should not exceed 5
agency (EPA) has revealed that 32 % of treated ppm (g/l) and the excess level of chlorine is under
drinking waters contained TCE concentration research for its toxic and carcinogenic effect in [21]ranging from 0.06 to 3.2 mg/L . World Health human. TCE has been reported to be a toxic
[22]Organization (WHO) suggested that the level of chemical which can induce cancer .
Figure 1 :The cytoplasm of hepatocytes was light, enlarged and contained vacuoles
Figure 2 :Normal structure of cortex and medulla was observed in the kidney of untreated
Recent report suggest that TCE evaluated by assessing its effects on liver and metabolites, dichloroacetic acid (DCA), kidney function tests. TCE administration resulted Trichloroacetic acid (TCA) and chloral hydrate are in gradual increase of SGOT and SGPT. TCE is an
[22] industrial solvent and also a major environmental involved in TCE induced liver tumor genesis contaminant. We hypothesized that TCE induces which is also reported earlier for TCA and DCA in
[23] oxidative stress to various mice tissues. Blood and mice when administered in drinking water . tissues were collected and analyzed for various biochemical and enzymatic parameters. TCE In the present study we had evaluated the administration increased serum urea, serum effect of TCE mixture on the immune status as well creatinine indicating kidney and liver toxicity. TCE as the antioxidant status in experimental animals. administration resulted in decreased Superoxide Our results indicate that the administration of TCE dismutase activity and glutathione level whereas mixture resulted in gradual increase in total WBC lipid peroxide significantly increased in all tissues Count and decrease in Haemoglobin content which and serum level. The present results indicate that indicates that intake of TCE may results in immune TCE caused severe damage to kidney and liver and suppression. The toxic effects of TCE have been
247
Suppressed antioxidant defense system. 6. Herren-Freund L, Pereira MA, Khoury MD, Histopathological examinations also validate that O l s o n G : T h e c a r c i n o g e n i c i t y o f TCE caused liver and kidney toxicity. trichloroethylene and its metabolites,
trichloroacetic acid and dichloroacetic acid, in mouse liver. Toxicol. Applied Pharmacol., 1987, 90: 183-189.In conclusion, our present study reveals
7. Green T: Trichloroethylene Induced Cancer in that regular intake of TCE may result in Animals and Its Relevance to Humans. Zeneca accumulation and adverse effects such as immune Central Toxicology Laboratory. J. Occup. suppression and antioxidant enzymes activity Health, 1997, 39(4): 261-273.which may ul t imately lead to serious
8. Chen CW: Biologically Based Dose-Response complications such as cardiovascular diseases and Model for Liver Tumors Induced by cancer. Treatment of TCE resulted in an increased Tr i ch lo roe thy l ene . Env i ron Hea l t h serum urea, creatinine, SGOT and SGPT indicating Perspectives, 2000, 108: 335-337.its toxic effects on vital organs such as liver and
9. Edeas M: Anti-oxidants, controversies and kidney. However, biochemical mechanism and perspectives: How can the failure of clinical tissue response to toxicity are not completely studies using anti-oxidants be explained. J. understood and hence need for further study to Soc. Biol., 2009, 203(3): 271-280.understand the mechanism of TCE in cancer
10. Punchard N, Kelley F: Free Radicals. A development. Study on TCE exposure at lower Practical Approach. Oxford, UK: Oxford concentrations for longer periods also may be University Press. 1996, Pp 271-285.carried out further for better understanding.
11. Halmes NC, Samokyszyn VM, Pumford NR: Covalent binding and inhibition of cytochrome P4502E1 by trichloroethylene. Xenobiotica, The authors would like to acknowledge the 1997, 27(1): 101-10.valuable technical help of Mr. S. Panneer selvam
12. Griffin JM, Gilbert KM, Pumford NR: and Mr. N. Kannan, Karunya University, Inhibition of CYP2E1 reverses CD4+ T-cell Coimbatore, Tamil Nadu, India. alterations in trichloroethylene-treated MRL+/+ mice. Toxicol. Sci., 2000, 54: 384-389.� � � � � � �
1. Lock EA, Reed CJ: Trichloroethylene: Mechanisms of Renal Toxicity and Renal
Cancer and Relevance to Risk Assessment. Toxicol. Sci., 2005, 91: 313331.
2. Gist GL, Burg Je Anne R: Trichloroethylene--A Review of the Literature in View of the Results of the Trichloroethylene Subregistry Results. Toxicol. Ind. Health., 1995, 11: 253-307.
3. Channel SR, Pravecek TL: Metabolism of trichloroethylene in B6C3F1 mouse and human liver slices. Drug Chem. Toxicol. 1998, 21: 275-289.
4. Fisher JW, Allen BC: Evaluating the Risk of Liver Cancer in Humans Exposed to Trichloroethylene Using Physiological Models. Society for Risk Analysis, 2006, 13(1): 87 95.
5. IARC: Dry Cleaning, Some Chlorinated Solvents and Other Industrial Chemicals. IARC Monographs on the Evaluation of Carcinogenic Risk to Humans. Cancer Causes and Control, 1995, 7: 289-291.
CONCLUSION
ACKNOWLEDGEMENT
REFERENCES
13. Kaneko T, Saegusa M, Tasaka K, Sato A: Immunotoxicity of trichloroethylene: a study with MRL-lpr/lpr mice. J. Appl. Toxicol., 2000, 20(6): 471-5.
14. Caldwell JC, Keshava N, Evans MV: Difficulty of mode of action determination for trichloroethylene: An example of complex interactions of metabolites and other chemical exposures. Environ Mol. Mutagenesis, 2008, 49(2): 142 154.
15. Lowry OH, Rosenberg NJ, Far AL, Randall AJ: Protein measurement with the Folin phenol reagent. J. Biol. Chem., 1951, 193: 265-275.
16. Guruvayoorappan C, Afira AH, Kuttan G: Antioxidant potential of Biophytum sensitivum extract in vitro and in vivo. J. Basic Clin. Physiol. Pharmacol., 2006, 17 (4): 255-267.
17. Cook JD: Measurement of iron status. A report of the International Nutritional Anaemia Consultive Group (INACG). New York: Washington DC. Ch.II, 1985, pp 4.
18.McCord JM, Fridovich I: Superoxide
Asian J Pharm Biol Res Jul-Sep 2011 Vol. 1(3)
248
dismutase. An enzymic function for Contamination and Health Risk Assessment. erythrocuprein (hemocuprein). J. Biol. Chem., Rev. Environ. Contam. Toxicol., 1988, 101: 55-1969, 244(22): 6049-6055. 92.
19. Moron MS, Depieffe JW, Mannervik B: Levels 22.Caldwell JC, Keshava N: Key Issues in the of glutathione, glutathione reductase and M o d e s o f A c t i o n a n d E f f e c t s o f glutathione S-transferase activities in rat lung Trichloroethylene Metabolites for Liver and and liver. Biochim. Biophys. Acta, 1979, 582 Kidney Tumorigenesis. Environ. Health (1): 67-78. Perspectives, 2006, 114 (9): 1457-1463.
20.Ohkawa H, Ohishi N, Yagi K: Assay for lipid 23.Rhomber LR: Dose-Response Analyses of the peroxides in animal tissues by thiobarbituric Carcinogenic Effects of Trichloroethylene in acid reaction. Anal Biochem., 1979, 95(2): 351- Experimental Animals. Environ Health Persp., 8. 2000, 108: 343-358.
21. Fan AM: Trichloroethylene: Water
Asian J Pharm Biol Res Jul-Sep 2011 Vol. 1(3)
249
Related Documents