International Journal of Engineering Research and Development e-ISSN: 2278-067X, p-ISSN: 2278-800X, www.ijerd.com Volume 11, Issue 02 (February 2015), PP.29-38 29 Effect of Temperature and Nickel Concentration on the Electrical and Dielectric Properties of Polyethylene-Nickel Composites Ghassan Adnan Naeem Physics Department, College of Education for Pure Science, AL-Anbar University, Anbar/Ramady, Iraq Abstract:- In this paper the effect of temperature range of 298 K to 348 K and volume filler content ф on electrical properties of polyethylene PE filled with nickel Ni powders has been investigated .The volume electrical resistivity V of such composites decreases suddenly by several orders of magnitude at a critical volume concentration (i.e. ф c =14.27 Vol.%) ,whereas the dielectric constant and the A.C electrical conductivity AC of such composites increase suddenly at a critical volume concentration (i.e. ф c =14.27 Vol.%).For volume filler content lower than percolation threshold ф<ф c the resistivity decreases with increasing temperature, whereas the dielectric constant and the A.C electrical conductivity of such composites increase indicating a semi-conducting behavior, where for ф> ф c there is increase in the value of their resistivity, and decrease in the value of their dielectric constant and the A.C electrical conductivity AC with increasing temperature indicating metallic-conduction. Keywords:- conducting polymer, filler, polymer matrix, polyethylene, CPCM, percolation threshold. I. INTRODUCTION In our daily life we are surrounded by more and more articles produced of polymers rather than traditional materials such as wood, metals or ceramics. One of the main drivers contributing to the popularization of polymers is their ease of processing into complexly shaped parts at high speeds and low costs via relatively simple processes, such as extrusion, injection and compression modelling . Complementary advantages of polymers are their low density and large range of specific properties due to these properties polymers are becoming attractive .Conducting polymer composite materials (CPCM), that consist of a random distribution of a conducting filler throughout an insulating polymer, deserve interest in several application fields [2].They have emerged as a new group of engineering materials lately. Possible applications include (a) discharging static electricity, (b) heat conduction, (c) electrical shielding, (d) converting mechanical to electrical signals, (f) absorbing electrical waves, and (g) friction-antifriction materials. The materials are likely to have the following advantages in comparison with metals: high corrosion resistance, lower specific weight, ease of workability when manufacturing products of complex shapes are desired, cheapness, and great accessibility [3]. The purpose of use of fillers can be divided into two basic categories, first, to improve the properties of the material and second, to reduce the cost of component. Metal-polymer composites are a relative new of technological materials; their electrical characteristics are close to those of metals, whereas the mechanical properties and processing methods are typical for plastics. The conditions of electric charge transfer determine the electrical conductivity level and the dielectric properties of the heterogeneous system, in which polymer forms the matrix and conductive phase is formed by the dispersed metallic filler. The electrical properties of (CPCM) depend on several factors, including the kind of conducting filler, the spatial distribution of filler particles, the interaction between polymer and filler, and the contact interaction between particles [4]. By gradually increasing the filler content in a metal-polymer composite, the most significant changes in electrical and dielectric properties occur in a certain, relatively narrow critical region of filler content Фc (percolation concentration).Usually the percolation model is used for explaining the observed effects in metal-polymer composite[5]. The percolation theory is the most adequate for modelling conductivity of CPCM .It involves convergence of particles to distances at which the probability of transfer of current carriers between them becomes higher than zero. The so-called percolation threshold фc, i.e. the lowest concentration of conduction particles at which continuous conducting chains are formed, is easily determined from the experimental dependence of conductivity on the filler concentration. It is a very useful tool to probe the filler distribution within a polymer matrix [6]. Increased attention has been paid in recent years to the researches on polymeric composites in general and PE- metal composite in particular .A brief summary of various experimental studies on PE- metal composite is given below. Turner and co-workers [6-9] reported early works on polyethylene-Ni composites. They made

Welcome message from author
This document is posted to help you gain knowledge. Please leave a comment to let me know what you think about it! Share it to your friends and learn new things together.
Transcript
International Journal of Engineering Research and Development
e-ISSN: 2278-067X, p-ISSN: 2278-800X, www.ijerd.com
Volume 11, Issue 02 (February 2015), PP.29-38
29
Effect of Temperature and Nickel Concentration on the Electrical
and Dielectric Properties of Polyethylene-Nickel Composites
Ghassan Adnan Naeem Physics Department, College of Education for Pure Science, AL-Anbar University, Anbar/Ramady, Iraq
Abstract:- In this paper the effect of temperature range of 298 K to 348 K and volume filler content ф on
electrical properties of polyethylene PE filled with nickel Ni powders has been investigated .The volume
electrical resistivityV
of such composites decreases suddenly by several orders of magnitude at a critical
volume concentration (i.e. фc=14.27 Vol.%) ,whereas the dielectric constant and the A.C electrical
conductivity AC of such composites increase suddenly at a critical volume concentration (i.e. фc=14.27
Vol.%).For volume filler content lower than percolation threshold ф<фc the resistivity decreases with
increasing temperature, whereas the dielectric constant and the A.C electrical conductivity of such composites
increase indicating a semi-conducting behavior, where for ф> фc there is increase in the value of their
resistivity, and decrease in the value of their dielectric constant and the A.C electrical conductivity AC with
increasing temperature indicating metallic-conduction.
Keywords:- conducting polymer, filler, polymer matrix, polyethylene, CPCM, percolation threshold.
I. INTRODUCTION In our daily life we are surrounded by more and more articles produced of polymers rather than
traditional materials such as wood, metals or ceramics. One of the main drivers contributing to the
popularization of polymers is their ease of processing into complexly shaped parts at high speeds and low costs
via relatively simple processes, such as extrusion, injection and compression modelling . Complementary
advantages of polymers are their low density and large range of specific properties due to these properties
polymers are becoming attractive .Conducting polymer composite materials (CPCM), that consist of a random
distribution of a conducting filler throughout an insulating polymer, deserve interest in several application fields
[2].They have emerged as a new group of engineering materials lately. Possible applications include (a)
discharging static electricity, (b) heat conduction, (c) electrical shielding, (d) converting mechanical to electrical
signals, (f) absorbing electrical waves, and (g) friction-antifriction materials. The materials are likely to have the
following advantages in comparison with metals: high corrosion resistance, lower specific weight, ease of
workability when manufacturing products of complex shapes are desired, cheapness, and great accessibility [3].
The purpose of use of fillers can be divided into two basic categories, first, to improve the properties of
the material and second, to reduce the cost of component. Metal-polymer composites are a relative new of
technological materials; their electrical characteristics are close to those of metals, whereas the mechanical
properties and processing methods are typical for plastics. The conditions of electric charge transfer determine
the electrical conductivity level and the dielectric properties of the heterogeneous system, in which polymer
forms the matrix and conductive phase is formed by the dispersed metallic filler. The electrical properties of
(CPCM) depend on several factors, including the kind of conducting filler, the spatial distribution of filler
particles, the interaction between polymer and filler, and the contact interaction between particles [4]. By
gradually increasing the filler content in a metal-polymer composite, the most significant changes in electrical
and dielectric properties occur in a certain, relatively narrow critical region of filler content Фc (percolation
concentration).Usually the percolation model is used for explaining the observed effects in metal-polymer
composite[5].
The percolation theory is the most adequate for modelling conductivity of CPCM .It involves
convergence of particles to distances at which the probability of transfer of current carriers between them
becomes higher than zero. The so-called percolation threshold фc, i.e. the lowest concentration of conduction
particles at which continuous conducting chains are formed, is easily determined from the experimental
dependence of conductivity on the filler concentration. It is a very useful tool to probe the filler distribution
within a polymer matrix [6].
Increased attention has been paid in recent years to the researches on polymeric composites in general
and PE- metal composite in particular .A brief summary of various experimental studies on PE- metal composite
is given below. Turner and co-workers [6-9] reported early works on polyethylene-Ni composites. They made
Effect of Temperature and Nickel Concentration on the Electrical and Dielectric Properties of Polye...
30
preliminary investigations on polyethylene-Ni and polyurethane-Ni systems. Their studies showed that the
critical composition of metal could be reduced considerably by segregation of the metallic particles. Segregation
was effected by admixture of large particles of polymer with smaller particles of metal followed by compaction.
Horibe et-al [10] investigated the effect of the content and particle size of carbon black filler on the electrical
conductivity of the PE-C.B composite .the study of composites showed that the resistivity of PE-C.B composites
decreased with increasing C.B content, and the smaller the C.B. particle size is the lower resistivity of the PE-
C.B composites. Ismail [11] studied the electrical resistivity and tensile properties of composites formed by the
incorporation of metal such as Al, Cu & Fe in PE matrix. It is found that the electrical resistivity of the
composites is governed by the shape of filler and amount of filler content.
The aim of this paper is to focus on study of the effect of filler concentration and the effect of
temperature on the electrical properties of PE-Ni composites. It is important from the practical point of view
because composites are used extensively in many industrial applications.
II. EXPERIMENTAL PART 1. Materials
The materials used in this work were:
a. High-density polyethylene is used as polymer matrix, a non polar polymer. It is light polymer with a density
approaching 0.95-0.97 gm/cm3.Polyethylene is commercially available , the commonly used polyethylene due to
its ability for modelling in various ways and tempting properties such as high density, good mechanical
properties, good dielectric in high frequency and possesses a good resistance against corrosion because it is
inert against chemicals . Its chemical formula is shown in the following [12]:
b. Nickel powder from (Metco Ltd. England) of particle size 75-100 microns with a density8.902 gm/cm3.
2. Preparation of PE-Ni composites
Weighed amounts of polyethylene and nickel powders were mixed by a rotary blender until a
homogeneous product was obtained. The mixture was compacted in steel cylindrical of diameter 3 cm under a
pressure of 110 bar for 10 min at 110oC, the die was then cooled to 50
oC by tapped water. The compacted
sample was ejected from the die and allowed to cool to room temperature. The specimens were modelled in
disc-shape with a diameter of about 30 mm and a thickness ranged between 0.9 and 1.5 mm. Table1 gives the
list of weight percentage of all the PE-Ni specimens and their equivalent volume percentage. The weight
percentage of Ni powder is given by:
%100.% T
Ni
W
WNiofwt ……...…(1)
Whereas The weight percentage of PE powder is:
%100.%
T
NiPE
W
WWPEofwt …(2)
Where TW : the total weight of sample, NiW : weight of Ni powder and PEW : weight of PE powder .The
volume percentage of Ni powder is given by:
%100.%
PE
PE
Ni
Ni
DW
DW
NiofVol ……(3)
Where NiD : density of Ni powder and PED : density of PE powder.
Table I: List of weight percentage of all the PE-Ni specimens and their equivalent volume percentage.
3. Optical Micrograph
Effect of Temperature and Nickel Concentration on the Electrical and Dielectric Properties of Polye...
31
All samples of PE-Ni composites were examined by the optical microscope from (Olympus – BH-22)
which have a maximum magnification power of ( 500 ) and equipped with light intensity automatic
controlled camera.
4. Measurement of DC electrical properties
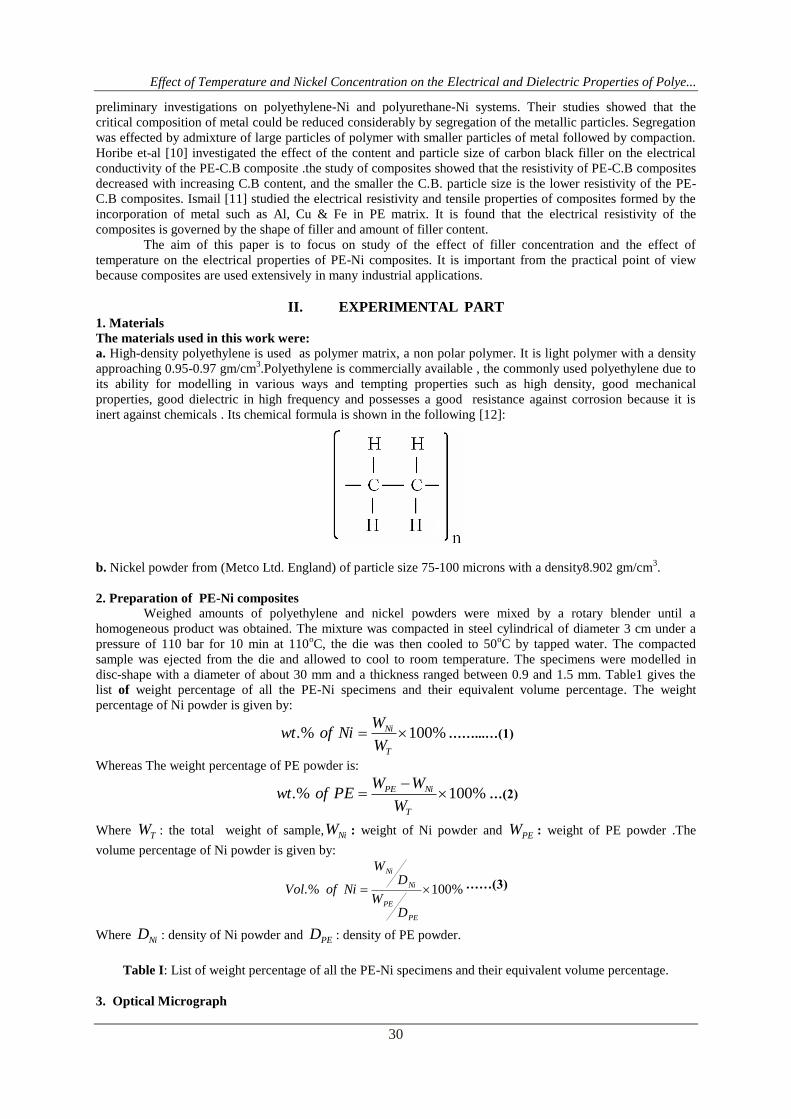
The resistivity data were obtained with specimens shaped according to ASTM, D257- 66 standard.
Figure.1a by means of the Three electrodes arrangement [13].This technique has been used to decrease the effect
of the fringing of the electric field at edges ,and to distinguish between the surface and the volume resistivity of
the sample ,therefore it permits measuring the bulk resistivity of the material.
In Figure1b a schematic representation of the preferential current paths and the equivalent electric
circuit are shown .RS represent the surface resistance between the guard and the guarded electrodes ,Rv the
volume resistance between the guarded and the bottom electrodes ,and Rg is the guard resistance between the
guard and the bottom electrodes.
Fig. 1: (a) Shape of the specimen and of the electrodes. (b) Schematic representation of the preferential
current paths and equivalent electric circuit.
The complete system of the D.C. volume resistivity measurement is shown in Figure 2.The electrodes
were made of copper metal, and a uniform pressure on the specimen was applied by Four adjustable screws, the
electrical input was provided by means of stabilized D.C. power supply (Philip Harris Limited) which provide
an output voltage from 0 to 3000 volt .The output current was measured by Keithley 616C / digital solid state
electrometer.
Fig. 2: Schematic diagram of the DC volume resistivity measurements.
Volume percentage of the
filler
Weight percentage of
the filler
Symbol of
sample
1.63 15 1
3.09 25 2
4.99 35 3
11.33 55 4
17.22 65 5
21.63 70 6
Effect of Temperature and Nickel Concentration on the Electrical and Dielectric Properties of Polye...
32
The Keithley electrometer provides direct reading current ranges to 10-12
ampere full scale .The test
samples are in the form of disc like shape, the disc surfaces were covered by a (AL) leaf to ensure uniform
electrical contact and to minimize the contact resistance. The test sample is placed between the two electrodes
and left at a desired temperature for half hour, then the desired test voltage is selected from the voltage supply
and the current passing through the bulk of the test sample at this selected temperature ,is measured by the
electrometer. The volume resistivity measurements were performed in the temperature range between298 K –
348 K by using a temperature controlled oven (MLW) which has been shield against external electromagnetic
field.
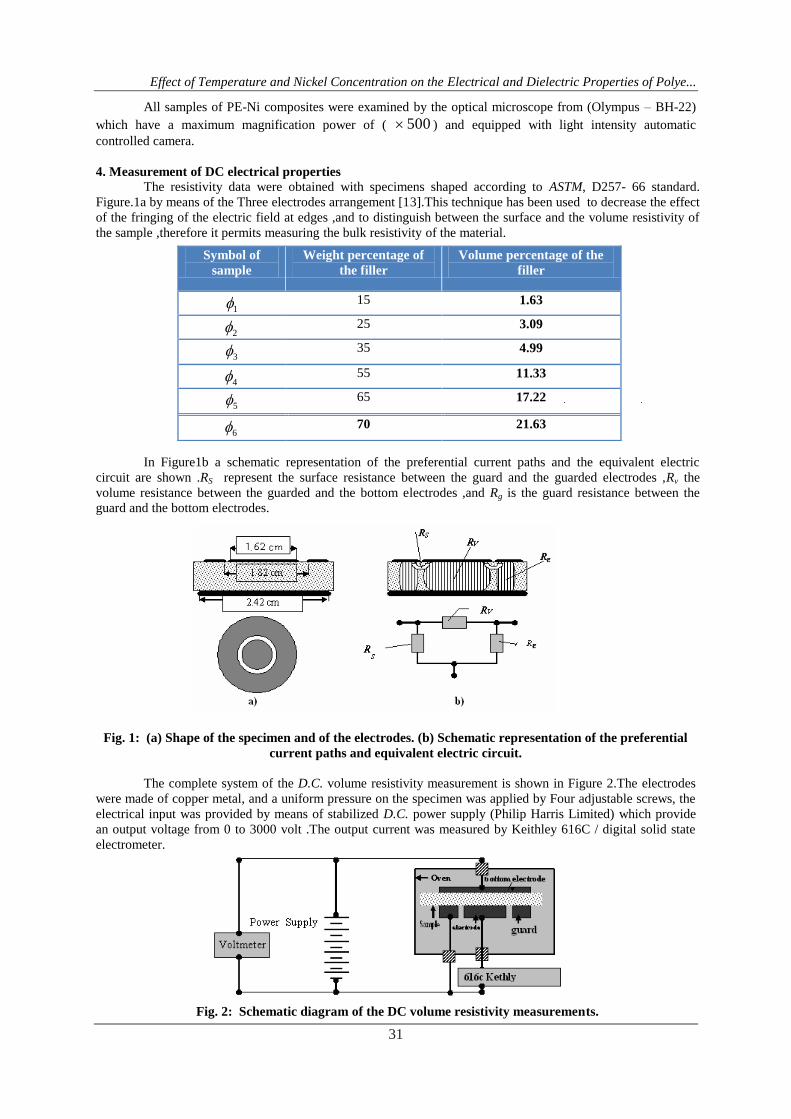
5. Measurement of AC electrical properties
Figure 3 shows the guard electrode specimen holder which is situated in temperature controlled oven
(MLW).As shown in the figure ,the high and low specimen holder terminals are connected to Multi-Frequency
LCR Meters(Models hp-4274A & hp-4275A),and the third specimen holder terminal is connected to earth. The
hp-4274A & hp-4275A are able to measure several parameters among them, the specimen capacitance C,
dissipation factor tan , and the phase angle ф. The HP covers a frequency range of 100Hz to 10MHz. In this
paper we use only 1KHz because the dielectric constant is generally insensitive to the frequency increasing in
the low and intermediate frequency range for non polar polymers[14].
Fig. 3: Schematic diagram for the A.C. measurements.
All the wiring was shielded to reduce the noise which is readily detectable especially in case of high
resistance measurements.
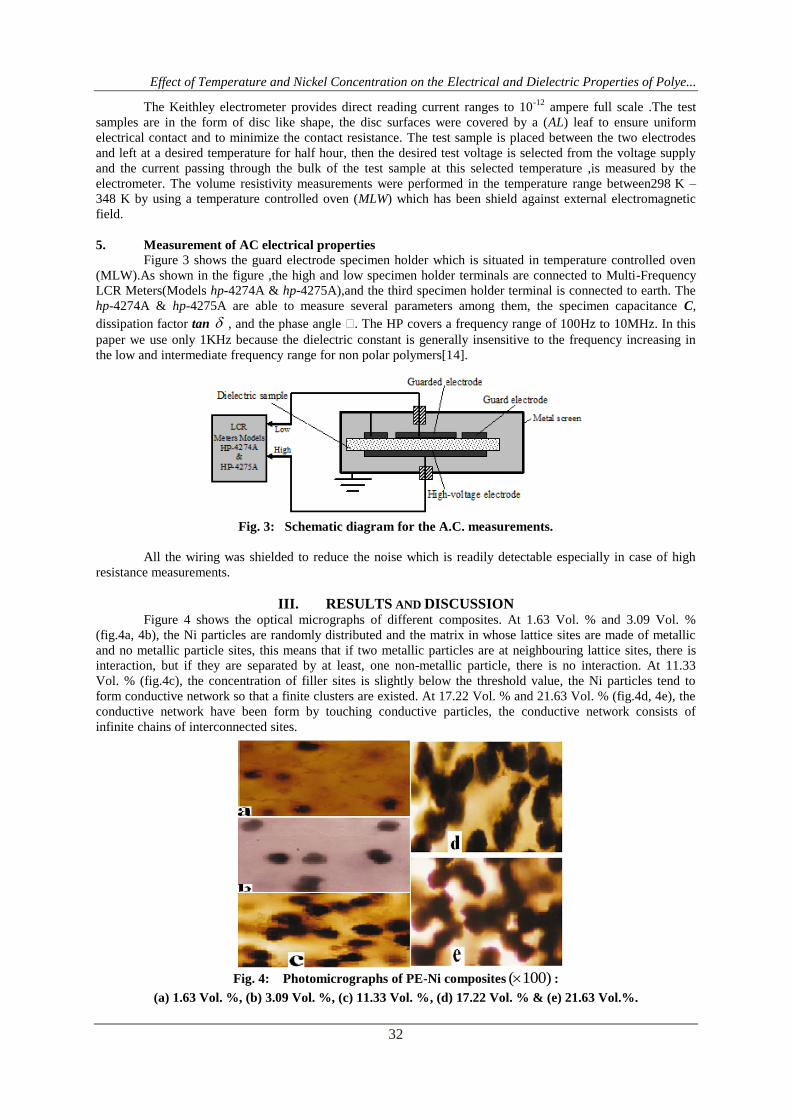
III. RESULTS AND DISCUSSION Figure 4 shows the optical micrographs of different composites. At 1.63 Vol. % and 3.09 Vol. %
(fig.4a, 4b), the Ni particles are randomly distributed and the matrix in whose lattice sites are made of metallic
and no metallic particle sites, this means that if two metallic particles are at neighbouring lattice sites, there is
interaction, but if they are separated by at least, one non-metallic particle, there is no interaction. At 11.33
Vol. % (fig.4c), the concentration of filler sites is slightly below the threshold value, the Ni particles tend to
form conductive network so that a finite clusters are existed. At 17.22 Vol. % and 21.63 Vol. % (fig.4d, 4e), the
conductive network have been form by touching conductive particles, the conductive network consists of
infinite chains of interconnected sites.
Fig. 4: Photomicrographs of PE-Ni composites )100( :
(a) 1.63 Vol. %, (b) 3.09 Vol. %, (c) 11.33 Vol. %, (d) 17.22 Vol. % & (e) 21.63 Vol.%.
Effect of Temperature and Nickel Concentration on the Electrical and Dielectric Properties of Polye...
33
A. D.C. Electrical Resistivity Results
The volume resistance for composites of various volume filler concentrations (0, 1.63,3.09,4.99,11.33,
17.22 and 21.63 Vol. %) were measured during heating by the guard ring electrode method. The volume
resistivity v was determined from the equation [15]:
v =R v L
A……………….…………(4)
Where Rv is the volume resistance between the guarded and the bottom electrodes in ohm measured as
the ratio between desired applied test voltage and the current passing through the test sample, L is the average
thickness of the sample; A is the guarded electrode effective area.
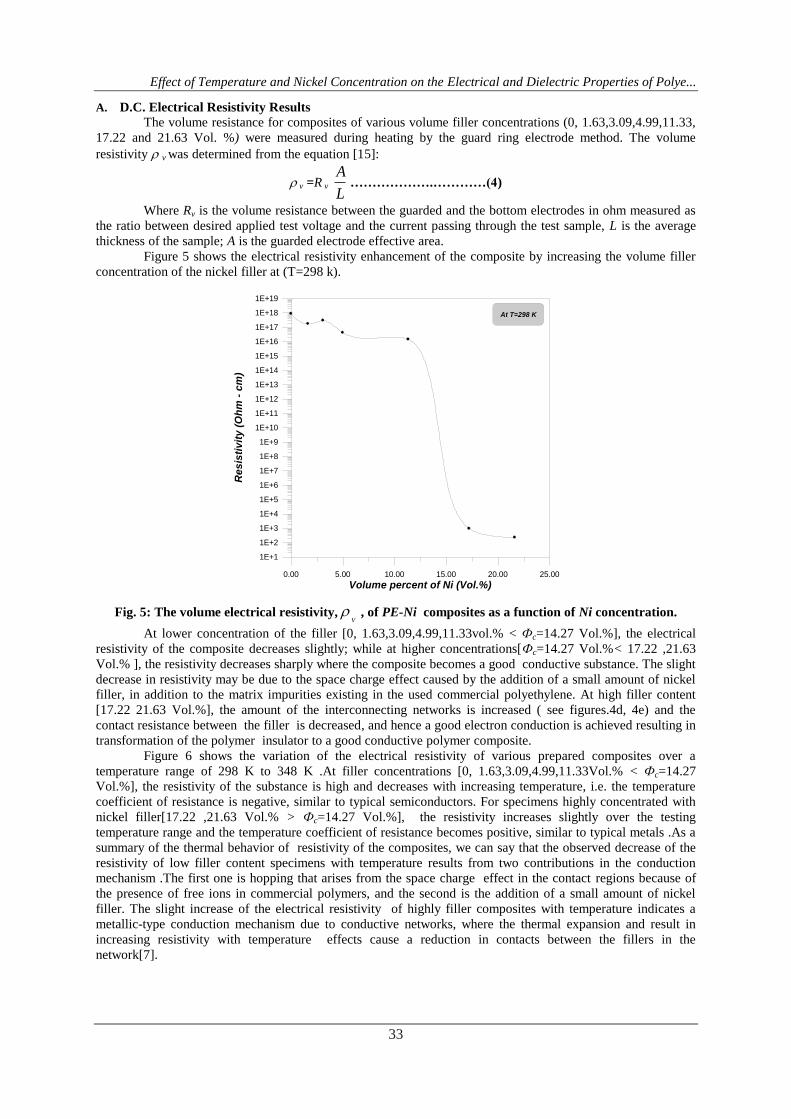
Figure 5 shows the electrical resistivity enhancement of the composite by increasing the volume filler
concentration of the nickel filler at (T=298 k).
Fig. 5: The volume electrical resistivity,V
, of PE-Ni composites as a function of Ni concentration.
At lower concentration of the filler [0, 1.63,3.09,4.99,11.33vol.% < Фc=14.27 Vol.%], the electrical
resistivity of the composite decreases slightly; while at higher concentrations[Фc=14.27 Vol.%< 17.22 ,21.63
Vol.% ], the resistivity decreases sharply where the composite becomes a good conductive substance. The slight
decrease in resistivity may be due to the space charge effect caused by the addition of a small amount of nickel
filler, in addition to the matrix impurities existing in the used commercial polyethylene. At high filler content
[17.22 21.63 Vol.%], the amount of the interconnecting networks is increased ( see figures.4d, 4e) and the
contact resistance between the filler is decreased, and hence a good electron conduction is achieved resulting in
transformation of the polymer insulator to a good conductive polymer composite.
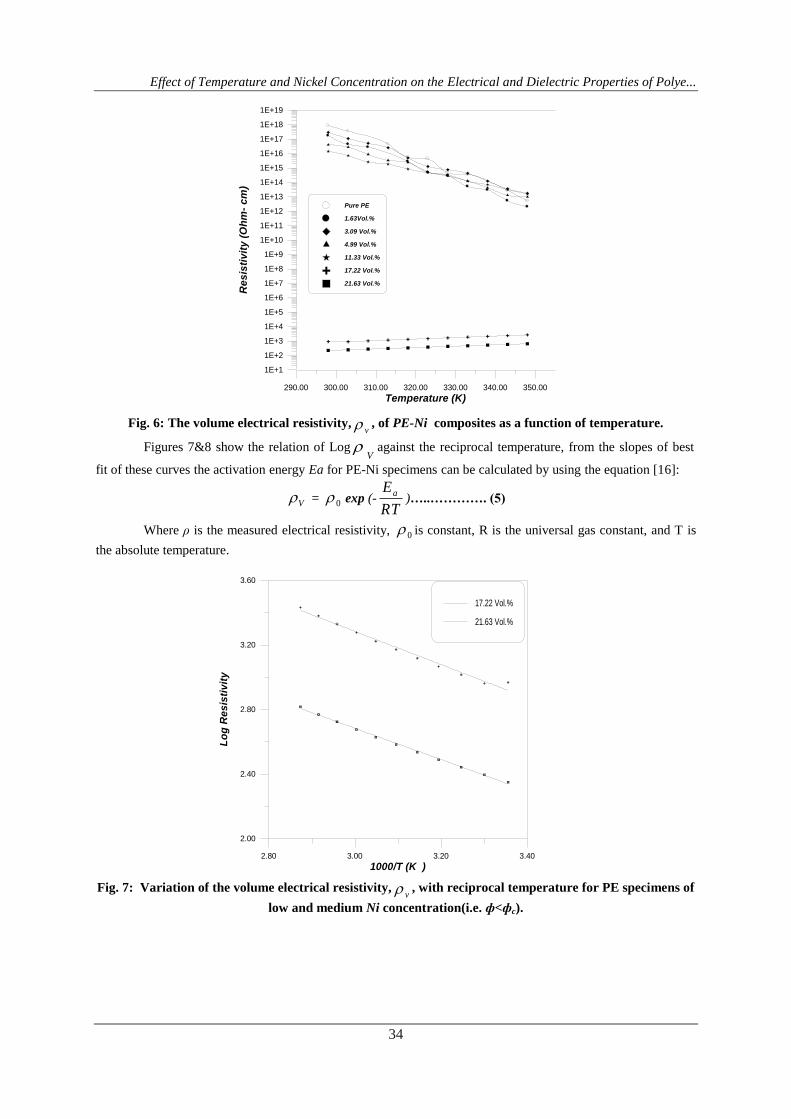
Figure 6 shows the variation of the electrical resistivity of various prepared composites over a
temperature range of 298 K to 348 K .At filler concentrations [0, 1.63,3.09,4.99,11.33Vol.% < Фc=14.27
Vol.%], the resistivity of the substance is high and decreases with increasing temperature, i.e. the temperature
coefficient of resistance is negative, similar to typical semiconductors. For specimens highly concentrated with
nickel filler[17.22 ,21.63 Vol.% > Фc=14.27 Vol.%], the resistivity increases slightly over the testing
temperature range and the temperature coefficient of resistance becomes positive, similar to typical metals .As a
summary of the thermal behavior of resistivity of the composites, we can say that the observed decrease of the
resistivity of low filler content specimens with temperature results from two contributions in the conduction
mechanism .The first one is hopping that arises from the space charge effect in the contact regions because of
the presence of free ions in commercial polymers, and the second is the addition of a small amount of nickel
filler. The slight increase of the electrical resistivity of highly filler composites with temperature indicates a
metallic-type conduction mechanism due to conductive networks, where the thermal expansion and result in
increasing resistivity with temperature effects cause a reduction in contacts between the fillers in the
network[7].
0.00 5.00 10.00 15.00 20.00 25.00
Volume percent of Ni (Vol.%)
1E+1
1E+2
1E+3
1E+4
1E+5
1E+6
1E+7
1E+8
1E+9
1E+10
1E+11
1E+12
1E+13
1E+14
1E+15
1E+16
1E+17
1E+18
1E+19
Re
sis
tiv
ity
(O
hm
- c
m)
At T=298 K
Effect of Temperature and Nickel Concentration on the Electrical and Dielectric Properties of Polye...
34
Fig. 6: The volume electrical resistivity,v , of PE-Ni composites as a function of temperature.
Figures 7&8 show the relation of LogV
against the reciprocal temperature, from the slopes of best
fit of these curves the activation energy Ea for PE-Ni specimens can be calculated by using the equation [16]:
V = 0 exp (-RT
Ea)…..…………. (5)
Where ρ is the measured electrical resistivity, 0 is constant, R is the universal gas constant, and T is
the absolute temperature.
Fig. 7: Variation of the volume electrical resistivity,v , with reciprocal temperature for PE specimens of
low and medium Ni concentration(i.e. ф<фc).
290.00 300.00 310.00 320.00 330.00 340.00 350.00
Temperature (K)
1E+1
1E+2
1E+3
1E+4
1E+5
1E+6
1E+7
1E+8
1E+9
1E+10
1E+11
1E+12
1E+13
1E+14
1E+15
1E+16
1E+17
1E+18
1E+19
Re
sis
tiv
ity
(O
hm
- c
m)
Pure PE
1.63Vol.%
3.09 Vol.%
4.99 Vol.%
11.33 Vol.%
17.22 Vol.%
21.63 Vol.%
2.80 3.00 3.20 3.40
1000/T (K )
2.00
2.40
2.80
3.20
3.60
Lo
g R
es
isti
vit
y
17.22 Vol.%
21.63 Vol.%
Effect of Temperature and Nickel Concentration on the Electrical and Dielectric Properties of Polye...
35
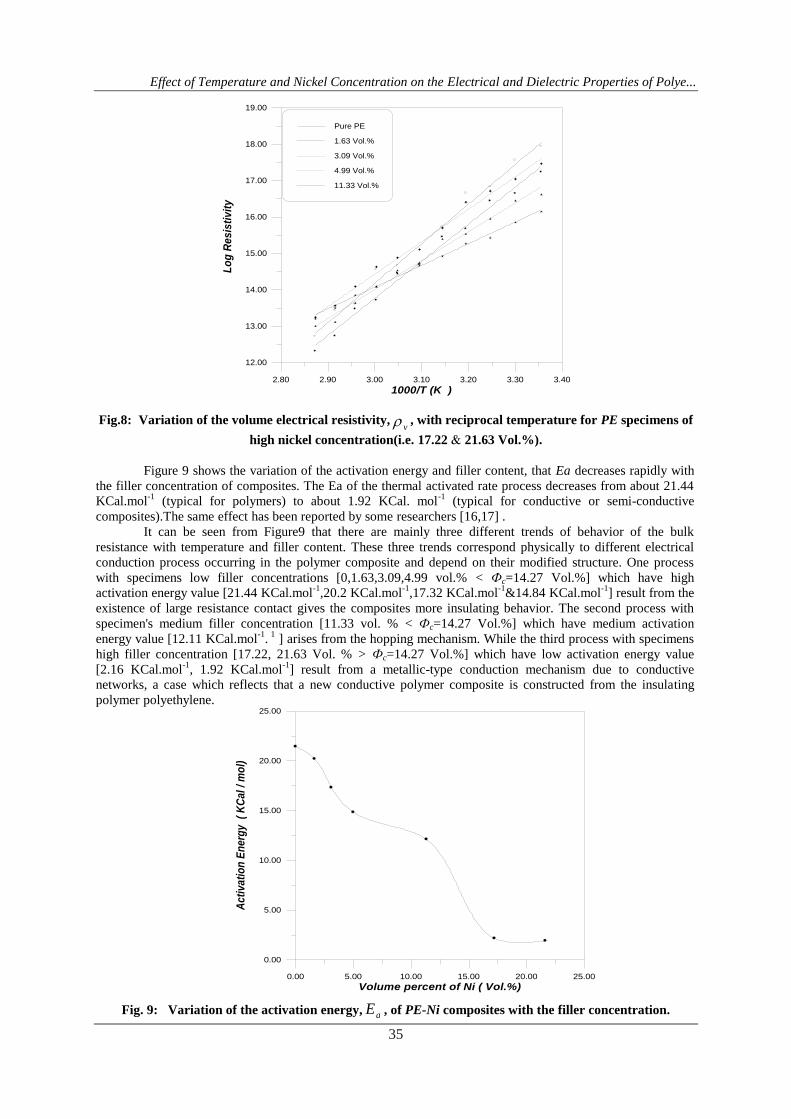
Fig.8: Variation of the volume electrical resistivity,v , with reciprocal temperature for PE specimens of
high nickel concentration(i.e. 17.22 & 21.63 Vol.%).
Figure 9 shows the variation of the activation energy and filler content, that Ea decreases rapidly with
the filler concentration of composites. The Ea of the thermal activated rate process decreases from about 21.44
KCal.mol-1
(typical for polymers) to about 1.92 KCal. mol-1
(typical for conductive or semi-conductive
composites).The same effect has been reported by some researchers [16,17] .
It can be seen from Figure9 that there are mainly three different trends of behavior of the bulk
resistance with temperature and filler content. These three trends correspond physically to different electrical
conduction process occurring in the polymer composite and depend on their modified structure. One process
with specimens low filler concentrations [0,1.63,3.09,4.99 vol.% < Фc=14.27 Vol.%] which have high
activation energy value [21.44 KCal.mol-1
,20.2 KCal.mol-1
,17.32 KCal.mol-1
&14.84 KCal.mol-1
] result from the
existence of large resistance contact gives the composites more insulating behavior. The second process with
specimen's medium filler concentration [11.33 vol. % < Фc=14.27 Vol.%] which have medium activation
energy value [12.11 KCal.mol-1
. 1
] arises from the hopping mechanism. While the third process with specimens
high filler concentration [17.22, 21.63 Vol. % > Фc=14.27 Vol.%] which have low activation energy value
[2.16 KCal.mol-1
, 1.92 KCal.mol-1
] result from a metallic-type conduction mechanism due to conductive
networks, a case which reflects that a new conductive polymer composite is constructed from the insulating
polymer polyethylene.
Fig. 9: Variation of the activation energy, aE , of PE-Ni composites with the filler concentration.
0.00 5.00 10.00 15.00 20.00 25.00
Volume percent of Ni ( Vol.%)
0.00
5.00
10.00
15.00
20.00
25.00
Ac
tiv
ati
on
En
erg
y
( K
Ca
l /
mo
l)
2.80 2.90 3.00 3.10 3.20 3.30 3.40
1000/T (K )
12.00
13.00
14.00
15.00
16.00
17.00
18.00
19.00
Lo
g R
es
isti
vit
y
Pure PE
1.63 Vol.%
3.09 Vol.%
4.99 Vol.%
11.33 Vol.%
Effect of Temperature and Nickel Concentration on the Electrical and Dielectric Properties of Polye...
36
B. A.C. Electrical Conductivity Results
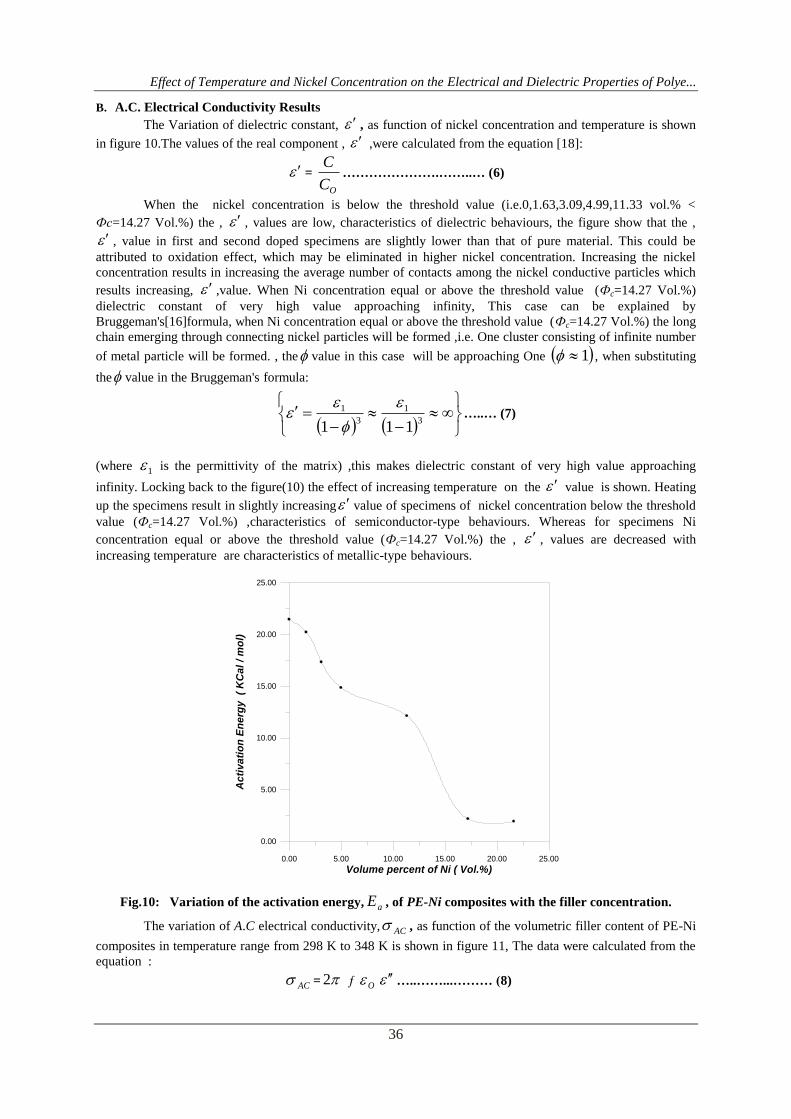
The Variation of dielectric constant, , as function of nickel concentration and temperature is shown
in figure 10.The values of the real component , ,were calculated from the equation [18]:
=
OC
C………………….……..… (6)
When the nickel concentration is below the threshold value (i.e.0,1.63,3.09,4.99,11.33 vol.% <
Фc=14.27 Vol.%) the , , values are low, characteristics of dielectric behaviours, the figure show that the ,
, value in first and second doped specimens are slightly lower than that of pure material. This could be
attributed to oxidation effect, which may be eliminated in higher nickel concentration. Increasing the nickel
concentration results in increasing the average number of contacts among the nickel conductive particles which
results increasing, ,value. When Ni concentration equal or above the threshold value (Фc=14.27 Vol.%)
dielectric constant of very high value approaching infinity, This case can be explained by
Bruggeman's[16]formula, when Ni concentration equal or above the threshold value (Фc=14.27 Vol.%) the long
chain emerging through connecting nickel particles will be formed ,i.e. One cluster consisting of infinite number
of metal particle will be formed. , the value in this case will be approaching One 1 , when substituting
the value in the Bruggeman's formula:
3
1
3
1
111
…..… (7)
(where 1 is the permittivity of the matrix) ,this makes dielectric constant of very high value approaching
infinity. Locking back to the figure(10) the effect of increasing temperature on the value is shown. Heating
up the specimens result in slightly increasing value of specimens of nickel concentration below the threshold
value (Фc=14.27 Vol.%) ,characteristics of semiconductor-type behaviours. Whereas for specimens Ni
concentration equal or above the threshold value (Фc=14.27 Vol.%) the , , values are decreased with
increasing temperature are characteristics of metallic-type behaviours.
Fig.10: Variation of the activation energy, aE , of PE-Ni composites with the filler concentration.
The variation of A.C electrical conductivity, AC , as function of the volumetric filler content of PE-Ni
composites in temperature range from 298 K to 348 K is shown in figure 11, The data were calculated from the
equation :
AC = 2 ƒ O …..……...……… (8)
0.00 5.00 10.00 15.00 20.00 25.00
Volume percent of Ni ( Vol.%)
0.00
5.00
10.00
15.00
20.00
25.00
Ac
tiv
ati
on
En
erg
y
( K
Ca
l /
mo
l)
Effect of Temperature and Nickel Concentration on the Electrical and Dielectric Properties of Polye...
37
Where O is the permittivity of free space { O =8.854 x10⁻¹²
F. m-1
}, ƒ is the frequency and is dielectric
loss.
= . tan ………………...…...(9)
Where tan is loss angle δ [18].
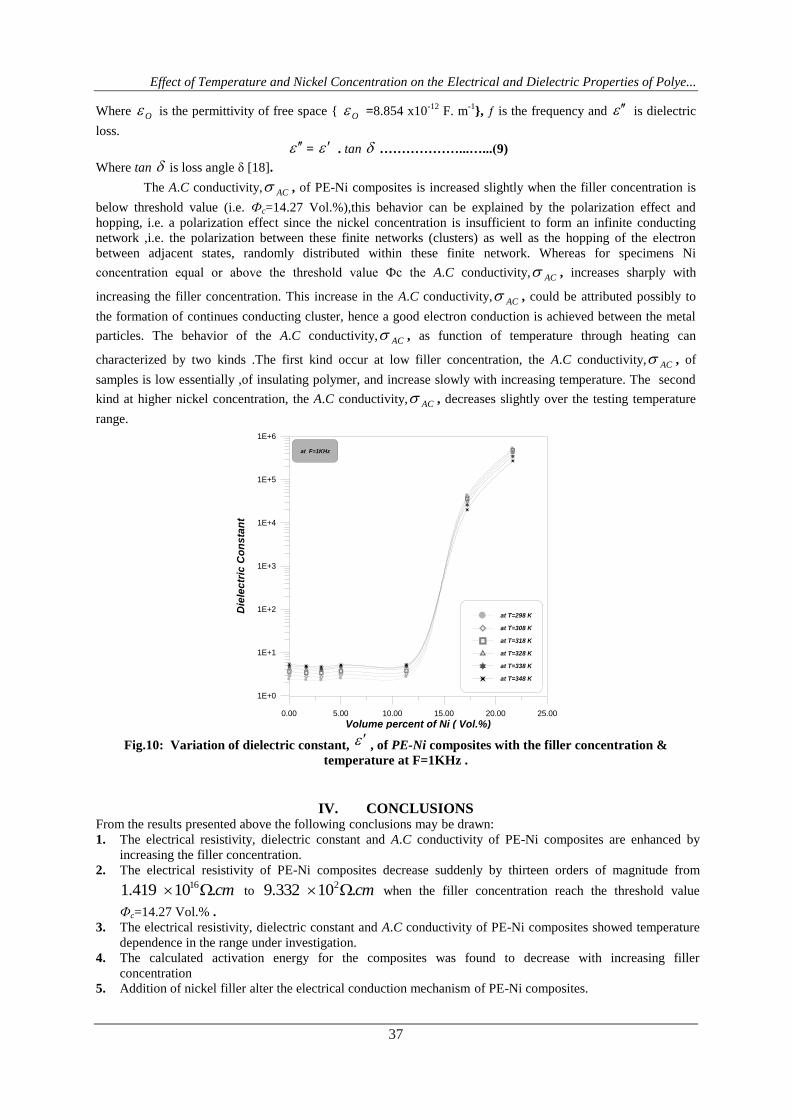
The A.C conductivity, AC , of PE-Ni composites is increased slightly when the filler concentration is
below threshold value (i.e. Фc=14.27 Vol.%),this behavior can be explained by the polarization effect and
hopping, i.e. a polarization effect since the nickel concentration is insufficient to form an infinite conducting
network ,i.e. the polarization between these finite networks (clusters) as well as the hopping of the electron
between adjacent states, randomly distributed within these finite network. Whereas for specimens Ni
concentration equal or above the threshold value Фc the A.C conductivity, AC , increases sharply with
increasing the filler concentration. This increase in the A.C conductivity, AC , could be attributed possibly to
the formation of continues conducting cluster, hence a good electron conduction is achieved between the metal
particles. The behavior of the A.C conductivity, AC , as function of temperature through heating can
characterized by two kinds .The first kind occur at low filler concentration, the A.C conductivity, AC , of
samples is low essentially ,of insulating polymer, and increase slowly with increasing temperature. The second
kind at higher nickel concentration, the A.C conductivity, AC , decreases slightly over the testing temperature
range.
Fig.10: Variation of dielectric constant, , of PE-Ni composites with the filler concentration &
temperature at F=1KHz .
IV. CONCLUSIONS From the results presented above the following conclusions may be drawn:
1. The electrical resistivity, dielectric constant and A.C conductivity of PE-Ni composites are enhanced by
increasing the filler concentration.
2. The electrical resistivity of PE-Ni composites decrease suddenly by thirteen orders of magnitude from
cm.10419.1 16 to cm.10332.9 2 when the filler concentration reach the threshold value
Фc=14.27 Vol.% .
3. The electrical resistivity, dielectric constant and A.C conductivity of PE-Ni composites showed temperature
dependence in the range under investigation.
4. The calculated activation energy for the composites was found to decrease with increasing filler
concentration
5. Addition of nickel filler alter the electrical conduction mechanism of PE-Ni composites.
0.00 5.00 10.00 15.00 20.00 25.00
Volume percent of Ni ( Vol.%)
1E+0
1E+1
1E+2
1E+3
1E+4
1E+5
1E+6
Die
lec
tric
Co
ns
tan
t
at F=1KHz
at T=298 K
at T=308 K
at T=318 K
at T=328 K
at T=338 K
at T=348 K
Effect of Temperature and Nickel Concentration on the Electrical and Dielectric Properties of Polye...
38
REFERENCES
[1]. M.A.Kori, M.G.Kulthe & R.K.Goyal, "International J. of Innovative Research in Science, Engenearing
and Technology" , vol.3,Issue 6,2014.
[2]. F.Gubbels, S.Blacher, E.Vanlathem, R.Jerome, R.Veltoure, F.Broues & Ph.Teyssie,"Macromolecules”,
vol.28, pp .1559-1566, 1995.
[3]. R.Mukhopyay, S.K.De, S.Basu, “J.Appl.Polym.Sci.”,vol.20, pp .2575,1976.
[4]. Z. Zhou, S. Wang, Y. Zhang, & Yi. Zhang,,"J.Appl.Poly.Sci." , vol. 102 Issue5, pp .4823 – 4830, 2006.
[5]. H.S. Dahiya, N. Kishore & R. M. Mehra ,"J.Appl.Poly.Sci.", vol. 106 Issue3, pp .2101 -2110, 2007.
[6]. Ye .P. Mameunya, Yv. V. Muzychenko, P.Pissis, E.V.Lebedev, & M. I. Shut ,"Polymer Engineering
and Science, 2002.
[7]. A.Malliaris and D.T.Turner,“J.Appl.Phys.” vol.42, pp .614, 1971.
[8]. R.P.Kusy and D.T.Turner ,“J.Appl.Polym.Sci.”,vol.17 , pp .1631, 1973.
[9]. J.E.Scheer and D.T.Turner , (1971), “SPE J.”, vol .99, pp. 572.
[10]. H.Horibe, T.Kamimura & K.Yoshida,,"Japa. J.of Appl. Phys.", vol .44, pp.2025-2029, 2005.
[11]. H.Ismail, "J.of Thermopl. Compo. Mater.", vol .19, No.4, pp.413 -425, 2006.
[12]. N.G. MCckum, C.P. Buckley and C.B. Bucknall ,"Principles of Polymer Engineering", Second Ed.,
Oxford University Press, U.K., 1997.
[13]. S.S.AL-Rawi, M.N.AL-Delaimi & G.A.Naeem AL-Heti , “J. College of Education for Women”,
vol.12, (3), 2001.
[14]. H.F.Mark & N.G.Gaylord ,"Encyclopedia of Polymer Science &Engineering",2nd,vol.5, pp.531, 1971.
[15]. M.Z.Iqbal, G.M.Mamoor, Tariq Bashir,M.S. Irfan &M.B.Manzorr,"J. of Chemical Engineering, IEB",
vol .CHE.25,No.1,2010.
[16]. A.Hashim,A.Marza,B.H.Rabee,M.A.Habeeb,N.Abd-alkadhim,A.Saad Z.Alrarmadhan,"Chemistry and
Materials Resaerch", vol .3,No.7. , pp.40-43,2013.
[17]. A.Hashim ,B.H.Rabee,M.A.Habeeb&N.Abd-alkadhim,"American J. of Scientific Research",Issue
74,pp.05-08,2012.
[18]. V.Pan WAK,"European Polymer J.", vol .45,No.6. , pp.1777-1784,2009.
Related Documents


![Vacuum-processed polyethylene as a dielectric for low operating voltage … · 2017. 1. 13. · 2010[7]. Deposition of polyethyleneby vacuumprocessing technique was first reported](https://static.cupdf.com/doc/110x72/60ee17aa1bf57c066448a346/vacuum-processed-polyethylene-as-a-dielectric-for-low-operating-voltage-2017-1.jpg)
