International Dairy Journal 16 (2006) 153–163 Effect of temperature and inoculum concentration on gel microstructure, permeability and syneresis kinetics. Cottage cheese-type gels M. Castillo a,b, , J.A. Lucey a , T. Wang a , F.A. Payne b a Department of Food Science, University of Wisconsin-Madison, 1605 Linden Drive, Madison, WI 53706-1565, USA b Department of Biosystems and Agricultural Engineering, University of Kentucky, C. E. Barnhart Building, Lexington, KY 40546-0276, USA Received 5 January 2004; accepted 24 February 2005 Abstract Effects of coagulation temperature and inoculum concentration on microstructure, permeability and syneresis of cottage cheese gels were investigated. Relationships between coagulation parameters (obtained by rheology and near infrared light backscatter) and rate and extent of syneresis were studied. Mass of drained whey was fitted to first order equation W ¼ W 1 ð1 e k whey t Þ (determination coefficient, R 2 ¼ 0:994 0:005). Temperature coefficient and activation energy for syneresis were estimated. Increasing temperature significantly enhanced the rate of syneresis, due to bond relaxation. Increasing inoculum concentration decreased rate of syneresis, suggesting that faster acidification rate inhibited network rearrangement during whey expulsion. Syneresis parameters were highly correlated with the rates of acidification and network formation and with the loss tangent. Permeability coefficient, mass of whey drained and kinetic rate constant for syneresis were predicted by equations that included temperature and coagulation parameters. The close interactions between coagulation and syneresis kinetics suggested that it may be possible to develop optical sensors to simultaneously monitor both of these processes. r 2005 Elsevier Ltd. All rights reserved. Keywords: Cottage cheese; Milk gels; Light backscatter; Microstructure; Syneresis; Permeability coefficient 1. Introduction One of the objectives of cheese making is to obtain a curd with a defined moisture content. In fact, variations in cheese making procedures very frequently relate to different methods of controlling curd syneresis in order to obtain the desired moisture, acidity, and texture of the product. For this reason, syneresis is considered to be one of the most important steps in cheese making (Walstra, 1993). Rearrangement of casein micelles during the syneresis process is responsible for the shrinkage of the casein matrix and subsequent expulsion of whey from curd pieces. The rate and extent of syneresis controls the moisture and lactose contents of curd (Weber, 1989; Castillo, 2001), which impacts cheese moisture and pH, and consequently cheese texture, colour, flavour and quality. Syneresis also influences protein and fat loses in whey and thus cheese yield. Better control of the syneresis process would result in an improvement of the final cheese product homogeneity and quality. Syneresis process and factors affecting its extent and kinetics have been widely studied in rennet-induced milk gels (Walstra, 1993), but very little is known about syneresis in acid gels or in milk gels made by the combined action of acid and rennet (Lucey, 2001); we will use the term mixed gels for the gels made by a combination of acid and rennet. Limited knowledge is available about the mechanisms by which the micro- structure and rheological properties of mixed gels ARTICLE IN PRESS www.elsevier.com/locate/idairyj 0958-6946/$ - see front matter r 2005 Elsevier Ltd. All rights reserved. doi:10.1016/j.idairyj.2005.02.004 Corresponding author. Tel.: +1 859 257 3000x210; fax: +1 859 257 5671. E-mail address: [email protected] (M. Castillo).

Welcome message from author
This document is posted to help you gain knowledge. Please leave a comment to let me know what you think about it! Share it to your friends and learn new things together.
Transcript
ARTICLE IN PRESS
0958-6946/$ - se
doi:10.1016/j.id
�Correspondfax: +1859 257
E-mail addr
International Dairy Journal 16 (2006) 153–163
www.elsevier.com/locate/idairyj
Effect of temperature and inoculum concentration on gelmicrostructure, permeability and syneresis kinetics.
Cottage cheese-type gels
M. Castilloa,b,�, J.A. Luceya, T. Wanga, F.A. Payneb
aDepartment of Food Science, University of Wisconsin-Madison, 1605 Linden Drive, Madison, WI 53706-1565, USAbDepartment of Biosystems and Agricultural Engineering, University of Kentucky, C. E. Barnhart Building, Lexington, KY 40546-0276, USA
Received 5 January 2004; accepted 24 February 2005
Abstract
Effects of coagulation temperature and inoculum concentration on microstructure, permeability and syneresis of cottage cheese
gels were investigated. Relationships between coagulation parameters (obtained by rheology and near infrared light backscatter) and
rate and extent of syneresis were studied. Mass of drained whey was fitted to first order equation W ¼W1ð1� e�kwheytÞ
(determination coefficient, R2 ¼ 0:994� 0:005). Temperature coefficient and activation energy for syneresis were estimated.
Increasing temperature significantly enhanced the rate of syneresis, due to bond relaxation. Increasing inoculum concentration
decreased rate of syneresis, suggesting that faster acidification rate inhibited network rearrangement during whey expulsion.
Syneresis parameters were highly correlated with the rates of acidification and network formation and with the loss tangent.
Permeability coefficient, mass of whey drained and kinetic rate constant for syneresis were predicted by equations that included
temperature and coagulation parameters. The close interactions between coagulation and syneresis kinetics suggested that it may be
possible to develop optical sensors to simultaneously monitor both of these processes.
r 2005 Elsevier Ltd. All rights reserved.
Keywords: Cottage cheese; Milk gels; Light backscatter; Microstructure; Syneresis; Permeability coefficient
1. Introduction
One of the objectives of cheese making is to obtain acurd with a defined moisture content. In fact, variationsin cheese making procedures very frequently relate todifferent methods of controlling curd syneresis in orderto obtain the desired moisture, acidity, and texture ofthe product. For this reason, syneresis is considered tobe one of the most important steps in cheese making(Walstra, 1993). Rearrangement of casein micellesduring the syneresis process is responsible for theshrinkage of the casein matrix and subsequent expulsionof whey from curd pieces. The rate and extent of
e front matter r 2005 Elsevier Ltd. All rights reserved.
airyj.2005.02.004
ing author. Tel.: +1859 257 3000x210;
5671.
ess: [email protected] (M. Castillo).
syneresis controls the moisture and lactose contents ofcurd (Weber, 1989; Castillo, 2001), which impacts cheesemoisture and pH, and consequently cheese texture,colour, flavour and quality. Syneresis also influencesprotein and fat loses in whey and thus cheese yield.Better control of the syneresis process would result in animprovement of the final cheese product homogeneityand quality.
Syneresis process and factors affecting its extent andkinetics have been widely studied in rennet-induced milkgels (Walstra, 1993), but very little is known aboutsyneresis in acid gels or in milk gels made by thecombined action of acid and rennet (Lucey, 2001); wewill use the term mixed gels for the gels made by acombination of acid and rennet. Limited knowledge isavailable about the mechanisms by which the micro-structure and rheological properties of mixed gels
ARTICLE IN PRESS
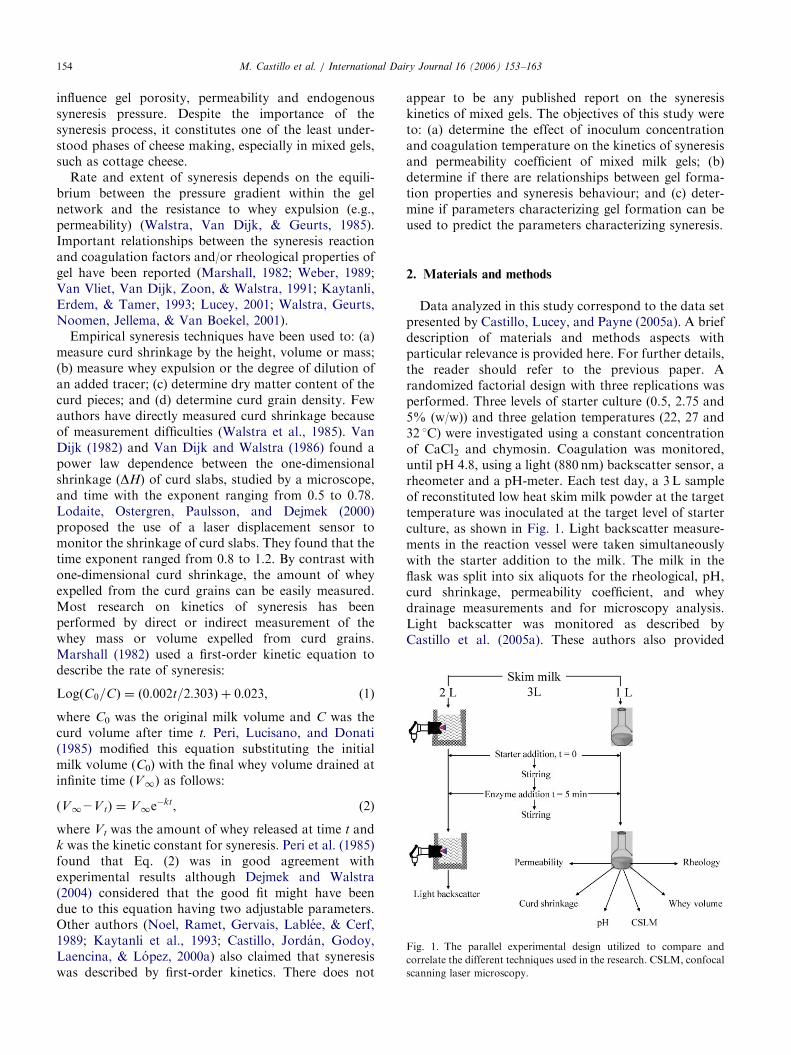
Fig. 1. The parallel experimental design utilized to compare and
correlate the different techniques used in the research. CSLM, confocal
scanning laser microscopy.
M. Castillo et al. / International Dairy Journal 16 (2006) 153–163154
influence gel porosity, permeability and endogenoussyneresis pressure. Despite the importance of thesyneresis process, it constitutes one of the least under-stood phases of cheese making, especially in mixed gels,such as cottage cheese.
Rate and extent of syneresis depends on the equili-brium between the pressure gradient within the gelnetwork and the resistance to whey expulsion (e.g.,permeability) (Walstra, Van Dijk, & Geurts, 1985).Important relationships between the syneresis reactionand coagulation factors and/or rheological properties ofgel have been reported (Marshall, 1982; Weber, 1989;Van Vliet, Van Dijk, Zoon, & Walstra, 1991; Kaytanli,Erdem, & Tamer, 1993; Lucey, 2001; Walstra, Geurts,Noomen, Jellema, & Van Boekel, 2001).
Empirical syneresis techniques have been used to: (a)measure curd shrinkage by the height, volume or mass;(b) measure whey expulsion or the degree of dilution ofan added tracer; (c) determine dry matter content of thecurd pieces; and (d) determine curd grain density. Fewauthors have directly measured curd shrinkage becauseof measurement difficulties (Walstra et al., 1985). VanDijk (1982) and Van Dijk and Walstra (1986) found apower law dependence between the one-dimensionalshrinkage (DH) of curd slabs, studied by a microscope,and time with the exponent ranging from 0.5 to 0.78.Lodaite, Ostergren, Paulsson, and Dejmek (2000)proposed the use of a laser displacement sensor tomonitor the shrinkage of curd slabs. They found that thetime exponent ranged from 0.8 to 1.2. By contrast withone-dimensional curd shrinkage, the amount of wheyexpelled from the curd grains can be easily measured.Most research on kinetics of syneresis has beenperformed by direct or indirect measurement of thewhey mass or volume expelled from curd grains.Marshall (1982) used a first-order kinetic equation todescribe the rate of syneresis:
LogðC0=CÞ ¼ ð0:002t=2:303Þ þ 0:023, (1)
where C0 was the original milk volume and C was thecurd volume after time t. Peri, Lucisano, and Donati(1985) modified this equation substituting the initialmilk volume (C0) with the final whey volume drained atinfinite time (V1) as follows:
ðV12VtÞ ¼ V1e�kt, (2)
where Vt was the amount of whey released at time t andk was the kinetic constant for syneresis. Peri et al. (1985)found that Eq. (2) was in good agreement withexperimental results although Dejmek and Walstra(2004) considered that the good fit might have beendue to this equation having two adjustable parameters.Other authors (Noel, Ramet, Gervais, Lablee, & Cerf,1989; Kaytanli et al., 1993; Castillo, Jordan, Godoy,Laencina, & Lopez, 2000a) also claimed that syneresiswas described by first-order kinetics. There does not
appear to be any published report on the syneresiskinetics of mixed gels. The objectives of this study wereto: (a) determine the effect of inoculum concentrationand coagulation temperature on the kinetics of syneresisand permeability coefficient of mixed milk gels; (b)determine if there are relationships between gel forma-tion properties and syneresis behaviour; and (c) deter-mine if parameters characterizing gel formation can beused to predict the parameters characterizing syneresis.
2. Materials and methods
Data analyzed in this study correspond to the data setpresented by Castillo, Lucey, and Payne (2005a). A briefdescription of materials and methods aspects withparticular relevance is provided here. For further details,the reader should refer to the previous paper. Arandomized factorial design with three replications wasperformed. Three levels of starter culture (0.5, 2.75 and5% (w/w)) and three gelation temperatures (22, 27 and32 1C) were investigated using a constant concentrationof CaCl2 and chymosin. Coagulation was monitored,until pH 4.8, using a light (880 nm) backscatter sensor, arheometer and a pH-meter. Each test day, a 3L sampleof reconstituted low heat skim milk powder at the targettemperature was inoculated at the target level of starterculture, as shown in Fig. 1. Light backscatter measure-ments in the reaction vessel were taken simultaneouslywith the starter addition to the milk. The milk in theflask was split into six aliquots for the rheological, pH,curd shrinkage, permeability coefficient, and wheydrainage measurements and for microscopy analysis.Light backscatter was monitored as described byCastillo et al. (2005a). These authors also provided
ARTICLE IN PRESSM. Castillo et al. / International Dairy Journal 16 (2006) 153–163 155
definitions of the light backscatter parameters used thatwere classified according to Castillo, Payne, Hicks, andLopez (2000b). Dynamic rheology testing methodology,pH measurements and the corresponding parameterdefinitions were as described by Castillo et al. (2005a).The recommended curd cutting time when rennet isadded at 2 mLL�1 is when the curd reaches pH 4.8(Walstra et al., 2001). For that reason, the time at whichthe curd achieved a pH of 4.8 was selected as cuttingtime (t*cut). For further details regarding cutting time seeCastillo, Payne, Wang, and Lucey (2005b).
2.1. Permeability coefficient
Permeability coefficient of gels was measured usingthe method described by Van Dijk and Walstra (1986)and Roefs, de Groot-Mostert, and Van Vliet (1990) andcalculated by the equation
B ¼ � lnðh1 � ht2Þ
ðh1 � ht1Þ
� �ZH=½rgðt2 � t1Þ�, (3)
where B was the permeability coefficient (m2), hN wasthe height of the whey in the reference tube (m), ht1 wasthe height of the whey in the gel tube (m) at time t1, ht2
was the height of the whey in the gel tube (m) at time t2,Z was the viscosity of the whey (Pa s), H was the lengthof the gel (m), r was the density of the whey (kgm�3)and g was the acceleration due to gravity (m s�2). Gelswere formed at target temperature inside hollow glasstubes (4mm internal diameter and 25 cm length).Permeability measurements were made at a temperatureof 30 1C and pH of 4.8. The height of whey in the tubeswas measured at 10min intervals over 2 h using acathetometer (Model 2202, The Precision Tool andInstrument Company, East Sussex, UK) having anaccuracy of 0.01mm.The B value that was obtained wasthe average of 12 determinations per tube and 7 tubesper test. Samples were not included in the analysis if thegel appeared cracked or separated from the sides of theglass tubes. The viscosity of the acid whey at 30 1C wasassumed to be 0.95mPa s (Lucey, Teo, Munro, & Singh,1998c).
2.2. Degree of whey separation
The method proposed by Lucey, Munro, and Singh(1998a) was used to measure the degree of wheyseparation. Gels samples were tested using two 250mLvolumetric flasks that were filled to a height just belowthe flask neck with 240 g of milk. The flasks weremaintained at the target temperature by placing them ina water bath. One flask was examined 2 h after the pHreached 4.8 to determine if whey had collected on thetop or around the sides of the gel. The free whey wasgently poured off for 1min and weighed. The variableW2h was defined as the relative mass of whey collected
from the undisturbed gel samples 2 h after they reachedpH 4.8. W2h was expressed as a percentage of the initialweight of milk. The second flask was used to estimatethe syneresis kinetics by decanting and weighing the freewhey every 10min intervals for 2 h after the gel reachedpH 4.8. The expulsion of whey from the mixed gel wasassumed to follow a first order kinetics as has beenobserved for rennet-induced milk gels (Marshall, 1982;Peri et al., 1985; Weber, 1989; St-Gelais & Hache, 1995;Grundelius, Lodaite, Ostergren, Paulsson, & Dejmek,2000; Castillo et al., 2000a). The following first orderequation was fitted to the data:
W ¼W1ð1� e�kwheytÞ, (4)
where W was the weight of whey (g) at time t (min), WN
was the mass of whey drained (g) at infinite time(estimated to be 120.3 g), and kwhey was the kinetic rateconstant (min�1) for the syneresis process.
The variable WA was the accumulated whey masscollected every 10min during the 2 h period after pH 4.8and was expressed as a percentage of the initial weight ofmilk.
2.3. One-dimensional curd shrinkage
One-dimensional shrinkage of the gels was measuredusing the method described by Lodaite et al. (2000). Alaser (LB-72W, Keyence Corporation, Osaka, Japan)connected to an analog sensor controller (RD-50RW,Keyence Corporation) measured the displacement of thegel surface during syneresis. Measurements were takenat 60ms intervals. The displacement resolution was 2 mmat the response speed selected. The laser system wascalibrated by placing the sensor head at differentdistances from the target surface. Center of measuringrange (0V output) was set at 40mm from the target(zero point adjustment). After span adjustment, a linearregression between the output voltage and distance (inthe range 30–50mm) was conducted in order to convertthe output voltage units to length units. The 122 g milksamples were placed in a temperature-controlled vessel(10.2 cm of internal diameter and 1.59 cm depth) locatedin the middle of the vat, which was connected to a waterbath. The samples were covered with a lid to avoiddehydration of the gel during coagulation. The waterbath lid had a central opening through which the laserwas placed to allow distance measurements to be takenduring syneresis process. The kinetics of one-dimen-sional curd shrinkage was estimated from the laserdisplacement measurements. Measurements were startedwhen the pH of the gel was 4.8. Shrinkage was started(t ¼ 0) by carefully wetting the surface of the curd with10mL of UF milk permeate previously warmed for10min at the target temperature. Measurements wererecorded every 10min for a period of 2 h. Milk permeatewas obtained by ultrafiltration of commercial skim milk
ARTICLE IN PRESS
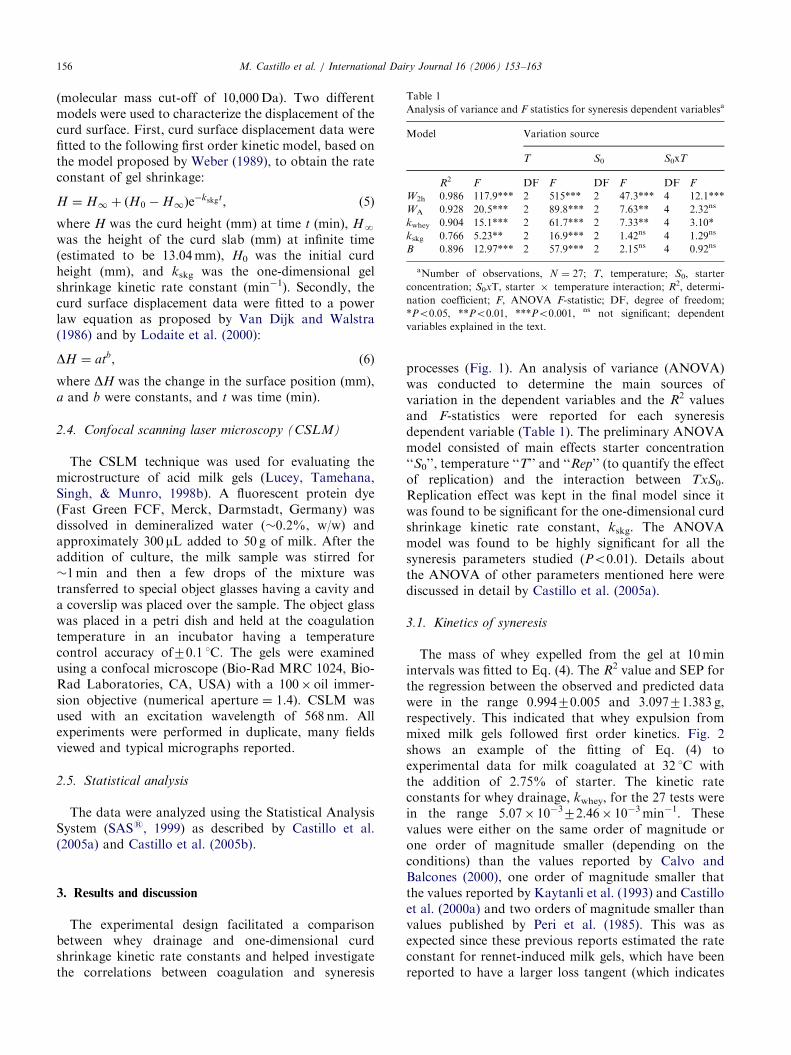
Table 1
Analysis of variance and F statistics for syneresis dependent variablesa
Model Variation source
T S0 S0xT
R2 F DF F DF F DF F
W2h 0.986 117.9*** 2 515*** 2 47.3*** 4 12.1***
WA 0.928 20.5*** 2 89.8*** 2 7.63** 4 2.32ns
kwhey 0.904 15.1*** 2 61.7*** 2 7.33** 4 3.10*
kskg 0.766 5.23** 2 16.9*** 2 1.42ns 4 1.29ns
B 0.896 12.97*** 2 57.9*** 2 2.15ns 4 0.92ns
aNumber of observations, N ¼ 27; T, temperature; S0, starter
concentration; S0xT, starter � temperature interaction; R2, determi-
nation coefficient; F, ANOVA F-statistic; DF, degree of freedom;
*Po0:05, **Po0:01, ***Po0:001, ns not significant; dependent
variables explained in the text.
M. Castillo et al. / International Dairy Journal 16 (2006) 153–163156
(molecular mass cut-off of 10,000Da). Two differentmodels were used to characterize the displacement of thecurd surface. First, curd surface displacement data werefitted to the following first order kinetic model, based onthe model proposed by Weber (1989), to obtain the rateconstant of gel shrinkage:
H ¼ H1 þ ðH0 �H1Þe�kskgt, (5)
where H was the curd height (mm) at time t (min), HN
was the height of the curd slab (mm) at infinite time(estimated to be 13.04mm), H0 was the initial curdheight (mm), and kskg was the one-dimensional gelshrinkage kinetic rate constant (min�1). Secondly, thecurd surface displacement data were fitted to a powerlaw equation as proposed by Van Dijk and Walstra(1986) and by Lodaite et al. (2000):
DH ¼ atb, (6)
where DH was the change in the surface position (mm),a and b were constants, and t was time (min).
2.4. Confocal scanning laser microscopy (CSLM)
The CSLM technique was used for evaluating themicrostructure of acid milk gels (Lucey, Tamehana,Singh, & Munro, 1998b). A fluorescent protein dye(Fast Green FCF, Merck, Darmstadt, Germany) wasdissolved in demineralized water (�0.2%, w/w) andapproximately 300 mL added to 50 g of milk. After theaddition of culture, the milk sample was stirred for�1min and then a few drops of the mixture wastransferred to special object glasses having a cavity anda coverslip was placed over the sample. The object glasswas placed in a petri dish and held at the coagulationtemperature in an incubator having a temperaturecontrol accuracy of70.1 1C. The gels were examinedusing a confocal microscope (Bio-Rad MRC 1024, Bio-Rad Laboratories, CA, USA) with a 100� oil immer-sion objective (numerical aperture ¼ 1.4). CSLM wasused with an excitation wavelength of 568 nm. Allexperiments were performed in duplicate, many fieldsviewed and typical micrographs reported.
2.5. Statistical analysis
The data were analyzed using the Statistical AnalysisSystem (SASs, 1999) as described by Castillo et al.(2005a) and Castillo et al. (2005b).
3. Results and discussion
The experimental design facilitated a comparisonbetween whey drainage and one-dimensional curdshrinkage kinetic rate constants and helped investigatethe correlations between coagulation and syneresis
processes (Fig. 1). An analysis of variance (ANOVA)was conducted to determine the main sources ofvariation in the dependent variables and the R2 valuesand F-statistics were reported for each syneresisdependent variable (Table 1). The preliminary ANOVAmodel consisted of main effects starter concentration‘‘S0’’, temperature ‘‘T’’ and ‘‘Rep’’ (to quantify the effectof replication) and the interaction between TxS0.Replication effect was kept in the final model since itwas found to be significant for the one-dimensional curdshrinkage kinetic rate constant, kskg. The ANOVAmodel was found to be highly significant for all thesyneresis parameters studied (Po0:01). Details aboutthe ANOVA of other parameters mentioned here werediscussed in detail by Castillo et al. (2005a).
3.1. Kinetics of syneresis
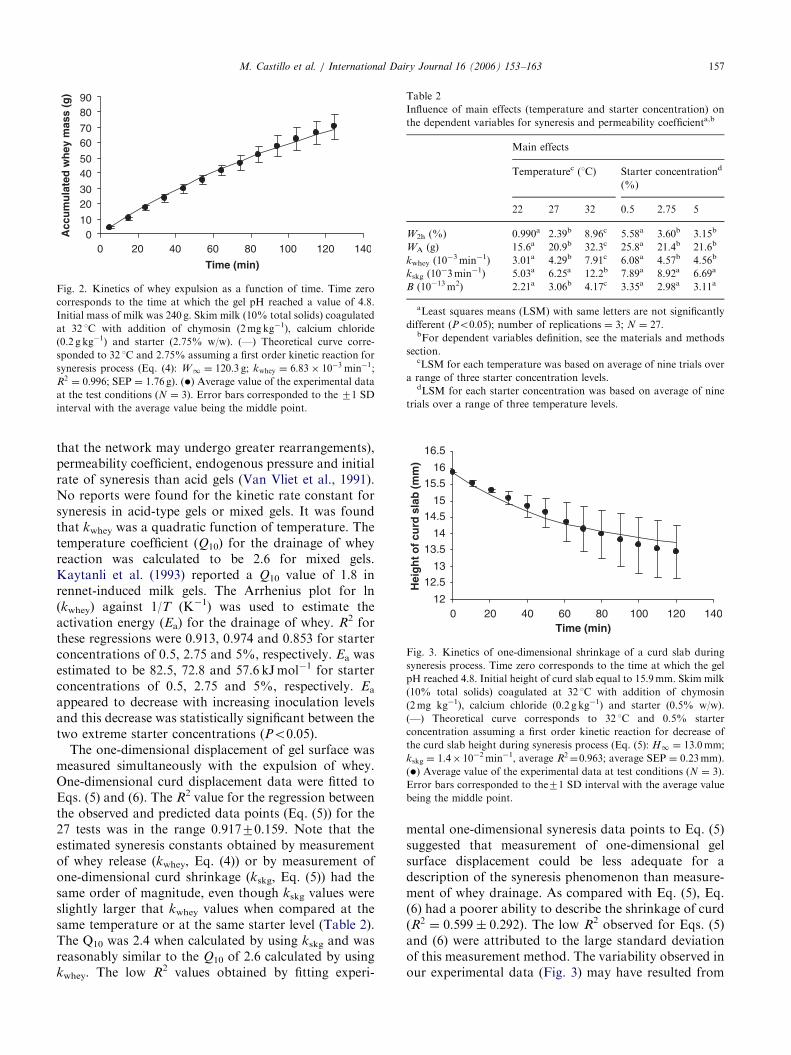
The mass of whey expelled from the gel at 10minintervals was fitted to Eq. (4). The R2 value and SEP forthe regression between the observed and predicted datawere in the range 0.99470.005 and 3.09771.383 g,respectively. This indicated that whey expulsion frommixed milk gels followed first order kinetics. Fig. 2shows an example of the fitting of Eq. (4) toexperimental data for milk coagulated at 32 1C withthe addition of 2.75% of starter. The kinetic rateconstants for whey drainage, kwhey, for the 27 tests werein the range 5.07� 10�372.46� 10�3min�1. Thesevalues were either on the same order of magnitude orone order of magnitude smaller (depending on theconditions) than the values reported by Calvo andBalcones (2000), one order of magnitude smaller thatthe values reported by Kaytanli et al. (1993) and Castilloet al. (2000a) and two orders of magnitude smaller thanvalues published by Peri et al. (1985). This was asexpected since these previous reports estimated the rateconstant for rennet-induced milk gels, which have beenreported to have a larger loss tangent (which indicates
ARTICLE IN PRESS
010
2030
4050
6070
8090
0 20 40 60 80 100 120 140
Time (min)
Acc
um
ula
ted
wh
ey m
ass
(g)
Fig. 2. Kinetics of whey expulsion as a function of time. Time zero
corresponds to the time at which the gel pH reached a value of 4.8.
Initial mass of milk was 240 g. Skim milk (10% total solids) coagulated
at 32 1C with addition of chymosin (2mgkg�1), calcium chloride
(0.2 g kg�1) and starter (2.75% w/w). (—) Theoretical curve corre-
sponded to 32 1C and 2.75% assuming a first order kinetic reaction for
syneresis process (Eq. (4): W1 ¼ 120:3 g; kwhey ¼ 6:83� 10�3 min�1;
R2 ¼ 0:996; SEP ¼ 1.76 g). (�) Average value of the experimental data
at the test conditions (N ¼ 3). Error bars corresponded to the 71 SD
interval with the average value being the middle point.
Table 2
Influence of main effects (temperature and starter concentration) on
the dependent variables for syneresis and permeability coefficienta,b
Main effects
Temperaturec (1C) Starter concentrationd
(%)
22 27 32 0.5 2.75 5
W2h (%) 0.990a 2.39b 8.96c 5.58a 3.60b 3.15b
WA (g) 15.6a 20.9b 32.3c 25.8a 21.4b 21.6b
kwhey (10�3min�1) 3.01a 4.29b 7.91c 6.08a 4.57b 4.56b
kskg (10�3min�1) 5.03a 6.25a 12.2b 7.89a 8.92a 6.69a
B (10�13m2) 2.21a 3.06b 4.17c 3.35a 2.98a 3.11a
aLeast squares means (LSM) with same letters are not significantly
different (Po0:05); number of replications ¼ 3; N ¼ 27.bFor dependent variables definition, see the materials and methods
section.cLSM for each temperature was based on average of nine trials over
a range of three starter concentration levels.dLSM for each starter concentration was based on average of nine
trials over a range of three temperature levels.
12
12.5
13
13.5
14
14.5
15
15.5
16
16.5
0 20 40 60 80 100 120 140Time (min)
Hei
gh
t of c
urd
sla
b (m
m)
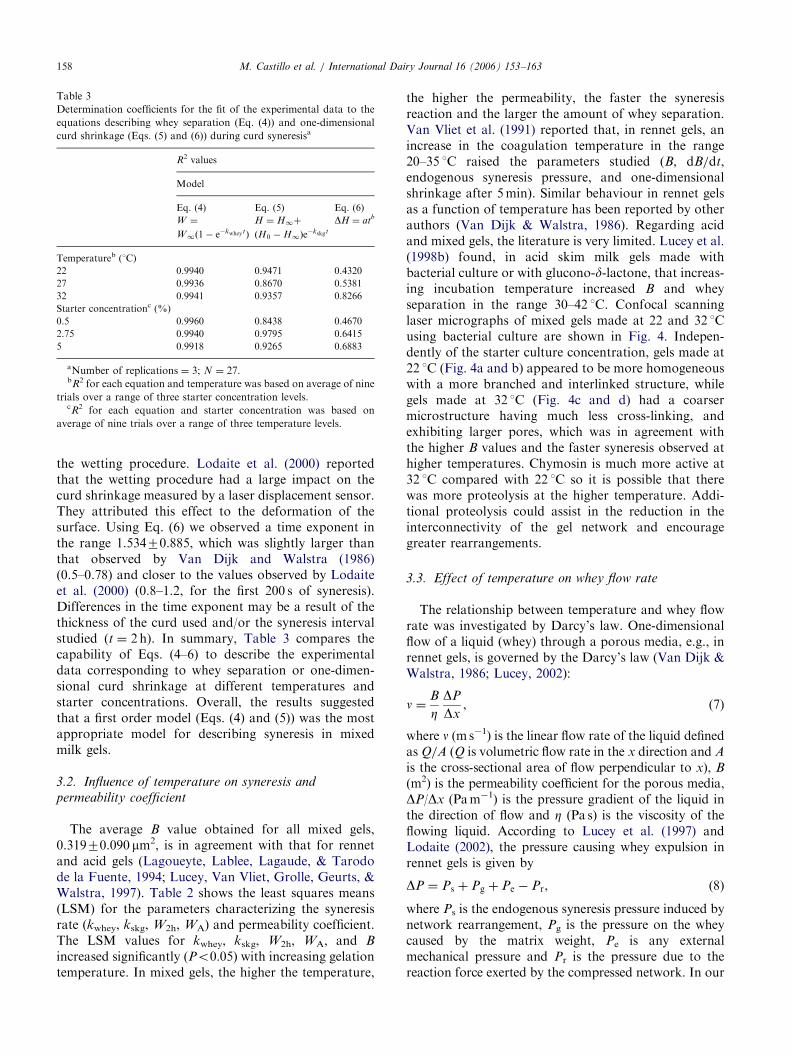
Fig. 3. Kinetics of one-dimensional shrinkage of a curd slab during
syneresis process. Time zero corresponds to the time at which the gel
pH reached 4.8. Initial height of curd slab equal to 15.9mm. Skim milk
(10% total solids) coagulated at 32 1C with addition of chymosin
(2mg kg�1), calcium chloride (0.2 g kg�1) and starter (0.5% w/w).
(—) Theoretical curve corresponds to 32 1C and 0.5% starter
concentration assuming a first order kinetic reaction for decrease of
the curd slab height during syneresis process (Eq. (5): H1 ¼ 13:0mm;
kskg ¼ 1.4� 10�2min�1, average R2¼0:963; average SEP ¼ 0.23mm).
(�) Average value of the experimental data at test conditions (N ¼ 3).
Error bars corresponded to the71 SD interval with the average value
being the middle point.
M. Castillo et al. / International Dairy Journal 16 (2006) 153–163 157
that the network may undergo greater rearrangements),permeability coefficient, endogenous pressure and initialrate of syneresis than acid gels (Van Vliet et al., 1991).No reports were found for the kinetic rate constant forsyneresis in acid-type gels or mixed gels. It was foundthat kwhey was a quadratic function of temperature. Thetemperature coefficient (Q10) for the drainage of wheyreaction was calculated to be 2.6 for mixed gels.Kaytanli et al. (1993) reported a Q10 value of 1.8 inrennet-induced milk gels. The Arrhenius plot for ln(kwhey) against 1/T (K�1) was used to estimate theactivation energy (Ea) for the drainage of whey. R2 forthese regressions were 0.913, 0.974 and 0.853 for starterconcentrations of 0.5, 2.75 and 5%, respectively. Ea wasestimated to be 82.5, 72.8 and 57.6 kJmol�1 for starterconcentrations of 0.5, 2.75 and 5%, respectively. Ea
appeared to decrease with increasing inoculation levelsand this decrease was statistically significant between thetwo extreme starter concentrations (Po0:05).
The one-dimensional displacement of gel surface wasmeasured simultaneously with the expulsion of whey.One-dimensional curd displacement data were fitted toEqs. (5) and (6). The R2 value for the regression betweenthe observed and predicted data points (Eq. (5)) for the27 tests was in the range 0.91770.159. Note that theestimated syneresis constants obtained by measurementof whey release (kwhey, Eq. (4)) or by measurement ofone-dimensional curd shrinkage (kskg, Eq. (5)) had thesame order of magnitude, even though kskg values wereslightly larger that kwhey values when compared at thesame temperature or at the same starter level (Table 2).The Q10 was 2.4 when calculated by using kskg and wasreasonably similar to the Q10 of 2.6 calculated by usingkwhey. The low R2 values obtained by fitting experi-
mental one-dimensional syneresis data points to Eq. (5)suggested that measurement of one-dimensional gelsurface displacement could be less adequate for adescription of the syneresis phenomenon than measure-ment of whey drainage. As compared with Eq. (5), Eq.(6) had a poorer ability to describe the shrinkage of curd(R2 ¼ 0:599� 0:292). The low R2 observed for Eqs. (5)and (6) were attributed to the large standard deviationof this measurement method. The variability observed inour experimental data (Fig. 3) may have resulted from
ARTICLE IN PRESS
Table 3
Determination coefficients for the fit of the experimental data to the
equations describing whey separation (Eq. (4)) and one-dimensional
curd shrinkage (Eqs. (5) and (6)) during curd syneresisa
R2 values
Model
Eq. (4) Eq. (5) Eq. (6)
W ¼
W1ð1� e�kwhey tÞ
H ¼ H1þ
ðH0 �H1Þe�kskg t
DH ¼ atb
Temperatureb (1C)
22 0.9940 0.9471 0.4320
27 0.9936 0.8670 0.5381
32 0.9941 0.9357 0.8266
Starter concentrationc (%)
0.5 0.9960 0.8438 0.4670
2.75 0.9940 0.9795 0.6415
5 0.9918 0.9265 0.6883
aNumber of replications ¼ 3; N ¼ 27.bR2 for each equation and temperature was based on average of nine
trials over a range of three starter concentration levels.cR2 for each equation and starter concentration was based on
average of nine trials over a range of three temperature levels.
M. Castillo et al. / International Dairy Journal 16 (2006) 153–163158
the wetting procedure. Lodaite et al. (2000) reportedthat the wetting procedure had a large impact on thecurd shrinkage measured by a laser displacement sensor.They attributed this effect to the deformation of thesurface. Using Eq. (6) we observed a time exponent inthe range 1.53470.885, which was slightly larger thanthat observed by Van Dijk and Walstra (1986)(0.5–0.78) and closer to the values observed by Lodaiteet al. (2000) (0.8–1.2, for the first 200 s of syneresis).Differences in the time exponent may be a result of thethickness of the curd used and/or the syneresis intervalstudied (t ¼ 2 h). In summary, Table 3 compares thecapability of Eqs. (4–6) to describe the experimentaldata corresponding to whey separation or one-dimen-sional curd shrinkage at different temperatures andstarter concentrations. Overall, the results suggestedthat a first order model (Eqs. (4) and (5)) was the mostappropriate model for describing syneresis in mixedmilk gels.
3.2. Influence of temperature on syneresis and
permeability coefficient
The average B value obtained for all mixed gels,0.31970.090 mm2, is in agreement with that for rennetand acid gels (Lagoueyte, Lablee, Lagaude, & Tarodode la Fuente, 1994; Lucey, Van Vliet, Grolle, Geurts, &Walstra, 1997). Table 2 shows the least squares means(LSM) for the parameters characterizing the syneresisrate (kwhey, kskg, W2h, WA) and permeability coefficient.The LSM values for kwhey, kskg, W2h, WA, and B
increased significantly (Po0:05) with increasing gelationtemperature. In mixed gels, the higher the temperature,
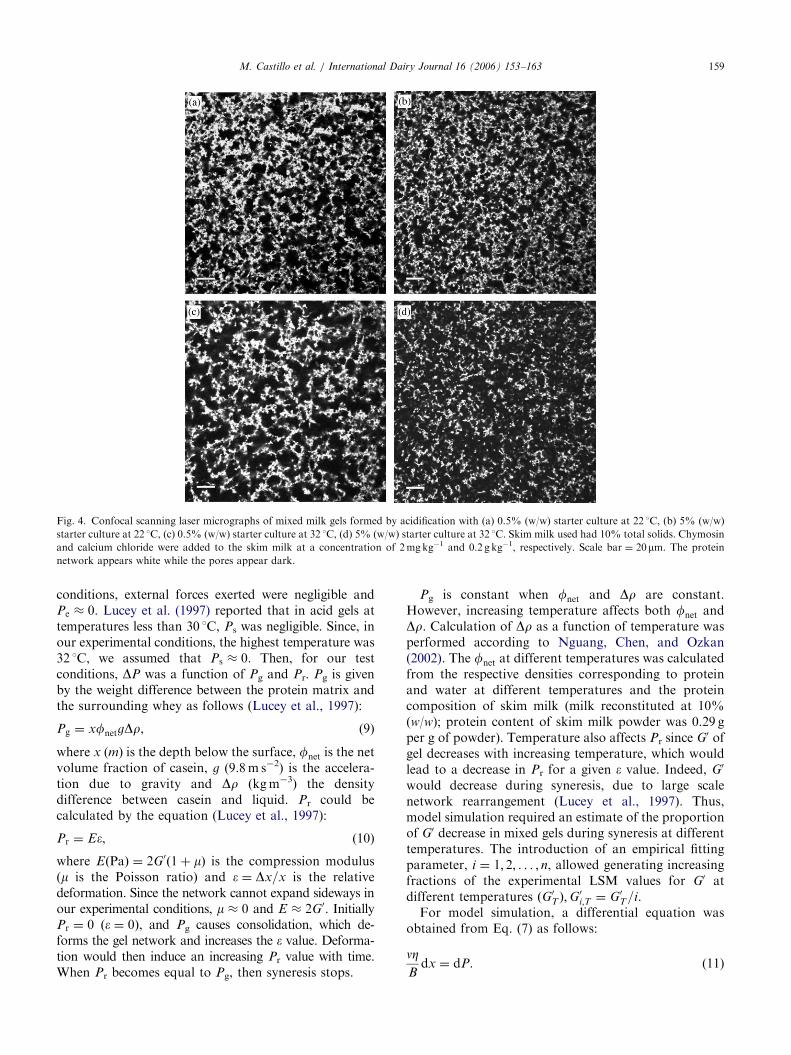
the higher the permeability, the faster the syneresisreaction and the larger the amount of whey separation.Van Vliet et al. (1991) reported that, in rennet gels, anincrease in the coagulation temperature in the range20–35 1C raised the parameters studied (B, dB/dt,endogenous syneresis pressure, and one-dimensionalshrinkage after 5min). Similar behaviour in rennet gelsas a function of temperature has been reported by otherauthors (Van Dijk & Walstra, 1986). Regarding acidand mixed gels, the literature is very limited. Lucey et al.(1998b) found, in acid skim milk gels made withbacterial culture or with glucono-d-lactone, that increas-ing incubation temperature increased B and wheyseparation in the range 30–42 1C. Confocal scanninglaser micrographs of mixed gels made at 22 and 32 1Cusing bacterial culture are shown in Fig. 4. Indepen-dently of the starter culture concentration, gels made at22 1C (Fig. 4a and b) appeared to be more homogeneouswith a more branched and interlinked structure, whilegels made at 32 1C (Fig. 4c and d) had a coarsermicrostructure having much less cross-linking, andexhibiting larger pores, which was in agreement withthe higher B values and the faster syneresis observed athigher temperatures. Chymosin is much more active at32 1C compared with 22 1C so it is possible that therewas more proteolysis at the higher temperature. Addi-tional proteolysis could assist in the reduction in theinterconnectivity of the gel network and encouragegreater rearrangements.
3.3. Effect of temperature on whey flow rate
The relationship between temperature and whey flowrate was investigated by Darcy’s law. One-dimensionalflow of a liquid (whey) through a porous media, e.g., inrennet gels, is governed by the Darcy’s law (Van Dijk &Walstra, 1986; Lucey, 2002):
n ¼B
ZDP
Dx, (7)
where n (m s�1) is the linear flow rate of the liquid definedas Q/A (Q is volumetric flow rate in the x direction and A
is the cross-sectional area of flow perpendicular to x), B
(m2) is the permeability coefficient for the porous media,DP/Dx (Pam�1) is the pressure gradient of the liquid inthe direction of flow and Z (Pa s) is the viscosity of theflowing liquid. According to Lucey et al. (1997) andLodaite (2002), the pressure causing whey expulsion inrennet gels is given by
DP ¼ Ps þ Pg þ Pe � Pr, (8)
where Ps is the endogenous syneresis pressure induced bynetwork rearrangement, Pg is the pressure on the wheycaused by the matrix weight, Pe is any externalmechanical pressure and Pr is the pressure due to thereaction force exerted by the compressed network. In our
ARTICLE IN PRESS
Fig. 4. Confocal scanning laser micrographs of mixed milk gels formed by acidification with (a) 0.5% (w/w) starter culture at 22 1C, (b) 5% (w/w)
starter culture at 22 1C, (c) 0.5% (w/w) starter culture at 32 1C, (d) 5% (w/w) starter culture at 32 1C. Skim milk used had 10% total solids. Chymosin
and calcium chloride were added to the skim milk at a concentration of 2mgkg�1 and 0.2 g kg�1, respectively. Scale bar ¼ 20mm. The protein
network appears white while the pores appear dark.
M. Castillo et al. / International Dairy Journal 16 (2006) 153–163 159
conditions, external forces exerted were negligible andPe � 0. Lucey et al. (1997) reported that in acid gels attemperatures less than 30 1C, Ps was negligible. Since, inour experimental conditions, the highest temperature was32 1C, we assumed that Ps � 0. Then, for our testconditions, DP was a function of Pg and Pr. Pg is givenby the weight difference between the protein matrix andthe surrounding whey as follows (Lucey et al., 1997):
Pg ¼ xfnetgDr, (9)
where x (m) is the depth below the surface, fnet is the netvolume fraction of casein, g (9.8m s�2) is the accelera-tion due to gravity and Dr (kgm�3) the densitydifference between casein and liquid. Pr could becalculated by the equation (Lucey et al., 1997):
Pr ¼ E�, (10)
where EðPaÞ ¼ 2G0ð1þ mÞ is the compression modulus(m is the Poisson ratio) and � ¼ Dx=x is the relativedeformation. Since the network cannot expand sideways inour experimental conditions, m � 0 and E � 2G0. InitiallyPr ¼ 0 ð� ¼ 0Þ, and Pg causes consolidation, which de-forms the gel network and increases the e value. Deforma-tion would then induce an increasing Pr value with time.When Pr becomes equal to Pg, then syneresis stops.
Pg is constant when fnet and Dr are constant.However, increasing temperature affects both fnet andDr. Calculation of Dr as a function of temperature wasperformed according to Nguang, Chen, and Ozkan(2002). The fnet at different temperatures was calculatedfrom the respective densities corresponding to proteinand water at different temperatures and the proteincomposition of skim milk (milk reconstituted at 10%(w/w); protein content of skim milk powder was 0.29 gper g of powder). Temperature also affects Pr since G0 ofgel decreases with increasing temperature, which wouldlead to a decrease in Pr for a given e value. Indeed, G0
would decrease during syneresis, due to large scalenetwork rearrangement (Lucey et al., 1997). Thus,model simulation required an estimate of the proportionof G0 decrease in mixed gels during syneresis at differenttemperatures. The introduction of an empirical fittingparameter, i ¼ 1; 2; . . . ; n, allowed generating increasingfractions of the experimental LSM values for G0 atdifferent temperatures ðG0T Þ;G
0i;T ¼ G0T=i.
For model simulation, a differential equation wasobtained from Eq. (7) as follows:
nZBdx ¼ dP. (11)
ARTICLE IN PRESSM. Castillo et al. / International Dairy Journal 16 (2006) 153–163160
Assuming that B and n do not change with depth, Eq.(11) was integrated between x0 ¼ 0 (surface) and x1, andbetween P0 and P1, and solved for n yielding:
n ¼B
ZDP
x1. (12)
Then, Eq. (12) was used to simulate n as function oftemperature by substituting Eq. (8) in Eq. (12). Pg andPr were calculated, as described above, by using Eqs. (9)and (10), respectively. B values used corresponded toexperimental LSM values of B at the tested levels oftemperature. For the change in whey viscosity withtemperature, Z values of whey reported by Lucey et al.(1998b) were used. A depth x1 ¼ 6mm below the surfaceand � ¼ 0:05 were used to compare results of simulationat 32 1C with those reported by Lucey et al. (1997).Simulation was performed using ever-increasing valuesof i. Positive flow rates for the three temperaturesconsidered were simultaneously obtained for iX19.The simulated n value at 32 1C (i ¼ 19) was0.62� 10�8m s�1, which agreed well with Lucey et al.(1997) (1.3� 10�8m s�1 for acid gels at 30 1C). The i
value needed to obtain positive n values was larger thanexpected, i.e., very large reduction of G0 duringsyneresis. This suggested that Pr was overestimated orthat Ps was not negligible as temperature increased. Thismay result from the activity of the small amount ofrennet in these mixed gels or the change in acid gelnetwork properties at high temperatures (Lucey et al.,1997). The simulated n values increased with increasingtemperature according to the observed increase ofsyneresis parameters with increasing temperature asshown in Table 2. Thus, the model predicted, the effectsof temperature on whey flow rate according to Darcy’slaw.
Finally, the effect of different degrees of deformation,e, and depths, x, on the simulated values was analyzed.Flow rates were simulated at x values of 1, 7.95, and15.9mm using the experimental average e values (0.072,0.090, and 0.127) observed 2 h after pH 4.8 was attainedat 22, 27 and 32 1C, respectively. The results confirmedthe above conclusions.
3.4. Effect of inoculum concentration on syneresis and
permeability coefficient
The effect of starter concentration on the syneresisparameters was inconclusive as shown in Table 2. TheLSM values for B and kskg did not change significantlywith starter concentration. W2h, WA and kwhey decreasedsignificantly when starter concentration increased from0.5 to 2.75%, while the differences between 2.75 and 5%levels were not significant. No definite conclusions onthe effects of starter concentration on syneresis could beobtained from the data. However, the results suggestedthat increasing starter concentrations tended to decrease
syneresis. Differences in microstructure between gelsinduced with different starter concentrations weremostly small. At low incubation temperature, the caseinnetwork structure observed at higher starter concentra-tions (Fig. 4b) had more homogeneous and less coarsestructure with smaller pores than at low starterconcentration (Fig. 4a). At high incubation temperature,the enhanced chymosin activity may have reduced gelinterconnectivity especially at high starter concentra-tions. The observed increase of syneresis with decreasinglevels of starter concentration could be related to achange from a predominant acid-type gel to a morerennet-type gel structure. It could be argued that in ourexperimental design, the use of constant enzymeconcentration and decreasing starter concentrationcaused a transition to a more rennet-type gel with animproved tendency for the network to rearrange andundergo syneresis. This may explain why we observed asmooth decrease in W2h, WA, kwhey with increasingstarter concentration.
3.5. Relationships between gel properties and syneresis
process
Pearson’s correlation coefficients were calculated toevaluate evidence of linear relationships between coa-gulation variables and parameters characterizing syner-esis (Table 4). As mentioned in the materials andmethods, definitions of light backscatter, rheologicaland pH parameters discussed here were explained byCastillo et al. (2005a). As expected, the correlationsbetween the various syneresis parameters (kwhey, kskg,W2h, WA, B) was positive and highly significant. Thehigh positive correlation (Po0.001) between perme-ability coefficient, B, and the syneresis kinetic rateconstants, kwhey (r ¼ 0:768) and kskg (r ¼ 0:626), respec-tively, suggested that an increase in syneresis rate wasrelated to an increased permeability or gel porosity. Ahigher rate of whey syneresis (kwhey, kskg) also resulted ina larger mass of whey drained from the curd (W2h andWA), as expected. The correlation between kwhey andkskg was significant (r ¼ 0:615, Po0:001), showing thatthere was consistency between these two differentapproaches to syneresis kinetics.
It was confirmed that faster acidification and coagu-lation reactions enhanced syneresis, which was sup-ported by (Table 4): (a) the positive correlation betweensyneresis parameters and the rate of acidification, RA;(b) the positive correlation between parameters measur-ing the rate of increase in light backscatter (R0max,R00max, R00max2), which represented the rate of networkformation, and syneresis parameters; (c) the negativecorrelation observed between syneresis parameters andtime-parameters characterizing acidification (tRA) aswell as coagulation reactions (tmax, t2max, t2min, t2max2,t2min2, tgel and t*cut). Surprisingly, parameters describing
ARTICLE IN PRESSM. Castillo et al. / International Dairy Journal 16 (2006) 153–163 161
the time course of coagulation (tmax, t2min2 and tgel) weremore correlated with syneresis parameters than cuttingtime.
A positive correlation coefficient was found betweenthe light backscatter response parameter Rmax and thesyneresis variables (W2h, WA, kwhey, kskg and B). In turn,the light backscatter ratio at cutting time (i.e., at pH
Table 4
Pearson correlation between dependent variablesa
W2h WA kwhey kskg B
WA 0.945*** � � � �
kwhey 0.945*** 0.989*** � � �
kskg 0.673*** 0.639*** 0.615*** � �
B 0.874*** 0.805*** 0.768*** 0.626*** �
tmax �0.423* �0.475* �0.411* �0.433* �0.556**
t2max �0.415* �0.468* �0.405* �0.426* �0.546**
t2min �0.428* �0.482* �0.418* �0.438* �0.560**
t2max2 �0.427* �0.478* �0.417* �0.428* �0.557**
t2min2 �0.407* �0.459* �0.395* �0.422* �0.542**
tgel �0.448* �0.495** �0.432* �0.451* �0.587**
t*cut �0.388* �0.447* �0.384* �0.394* �0.525**
R0max 0.818*** 0.825*** 0.770*** 0.646*** 0.871***
R0 0max 0.755*** 0.787*** 0.720*** 0.637*** 0.835***
R0 0max2 0.501** 0.585** 0.530** 0.411* 0.597**
Rmax 0.793*** 0.833*** 0.816*** 0.468* 0.743***
R*cut 0.078ns 0.169ns 0.156ns �0.082ns 0.0895ns
G0 �0.195ns �0.254ns �0.249ns 0.0336ns �0.066ns
Tan d 0.622*** 0.615*** 0.550** 0.374ns 0.655***
sy �0.308ns �0.280 ns�0.321ns �0.237ns �0.142ns
gy �0.326ns �0.258 ns�0.289ns �0.0813ns �0.265ns
RA 0.380 ns 0.471* 0.414* 0.264ns 0.441*
tRA �0.387* �0.437* �0.382* �0.330ns �0.419*
aN ¼ 27; ***Po0:001, **Po0:01, *Po0:05, nsnot significant;
syneresis variables, W2h, WA, kwhey, kskg, and B were explained in
the text while the remaining dependent variables were defined by
Castillo et al. (2005a); t*cut was defined as the time when the gel pH
reached 4.8.
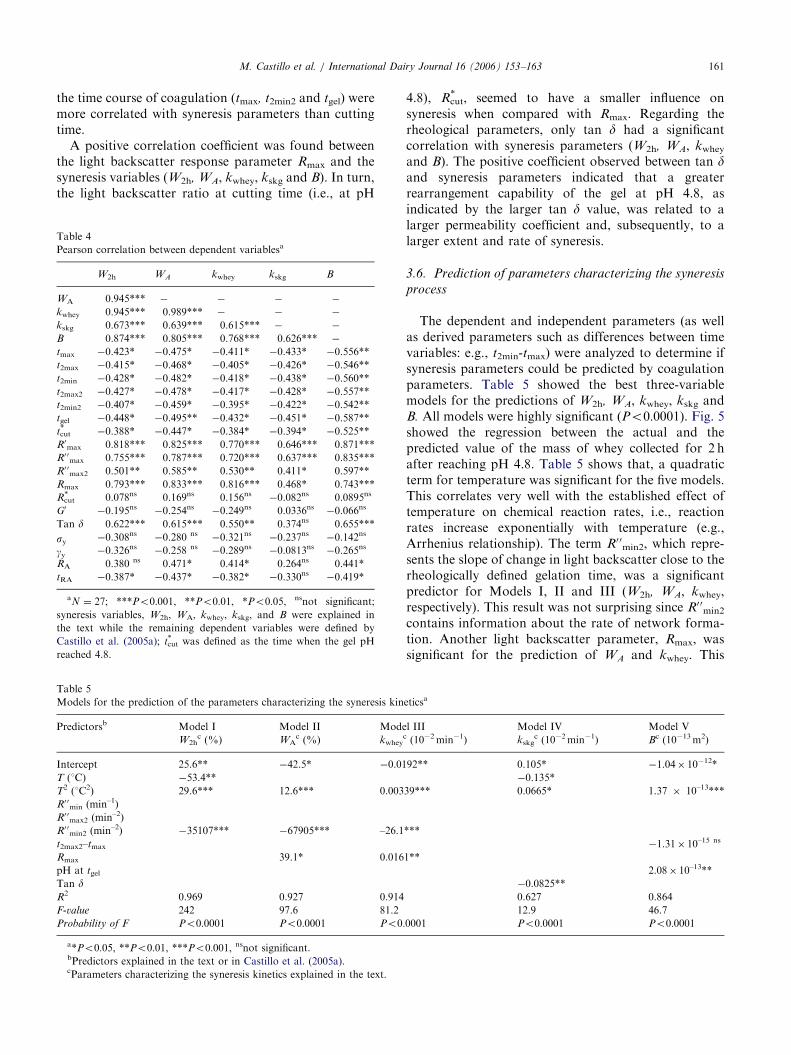
Table 5
Models for the prediction of the parameters characterizing the syneresis kin
Predictorsb Model I Model II Mode
W2hc (%) WA
c (%) kwhey
Intercept 25.6** �42.5* �0.01
T (1C) �53.4**
T2 (1C2) 29.6*** 12.6*** 0.003
R0 0min (min–1)
R0 0max2 (min–2)
R0 0min2 (min–2) �35107*** �67905*** –26.1
t2max2–tmax
Rmax 39.1* 0.016
pH at tgelTan dR2 0.969 0.927 0.914
F-value 242 97.6 81.2
Probability of F Po0:0001 Po0:0001 Po0:
a*Po0:05, **Po0:01, ***Po0:001, nsnot significant.bPredictors explained in the text or in Castillo et al. (2005a).cParameters characterizing the syneresis kinetics explained in the text.
4.8), R*cut, seemed to have a smaller influence on
syneresis when compared with Rmax. Regarding therheological parameters, only tan d had a significantcorrelation with syneresis parameters (W2h, WA, kwheyand B). The positive coefficient observed between tan dand syneresis parameters indicated that a greaterrearrangement capability of the gel at pH 4.8, asindicated by the larger tan d value, was related to alarger permeability coefficient and, subsequently, to alarger extent and rate of syneresis.
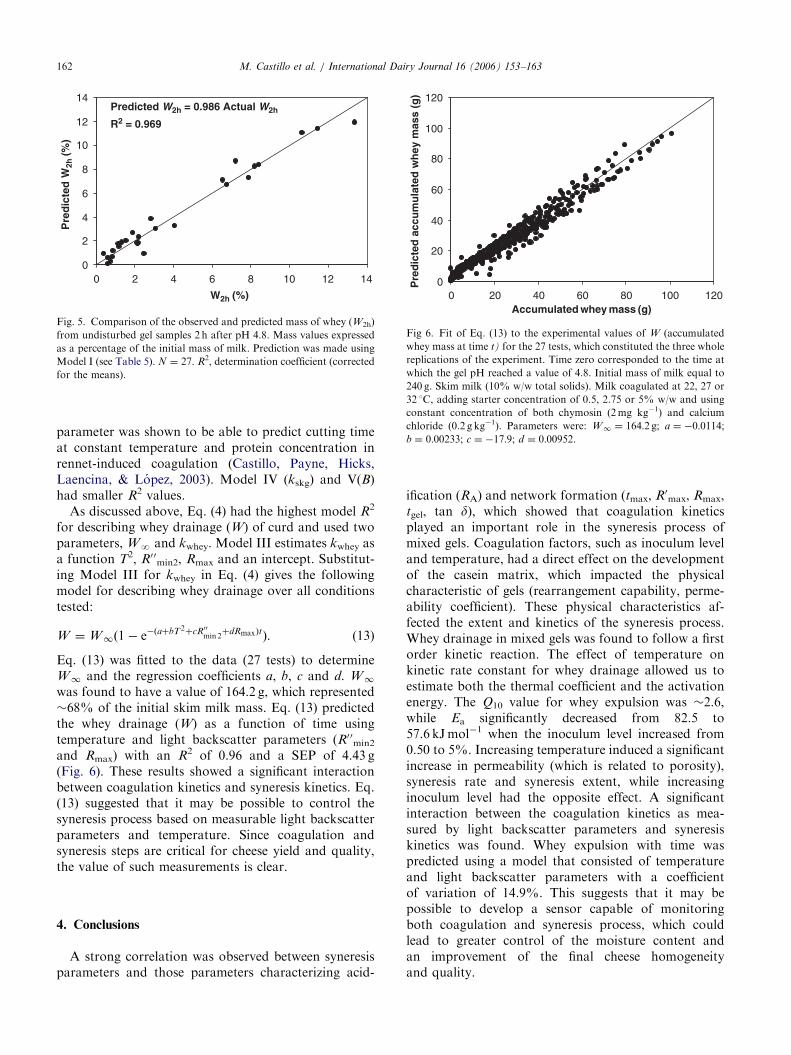
3.6. Prediction of parameters characterizing the syneresis
process
The dependent and independent parameters (as wellas derived parameters such as differences between timevariables: e.g., t2min-tmax) were analyzed to determine ifsyneresis parameters could be predicted by coagulationparameters. Table 5 showed the best three-variablemodels for the predictions of W2h, WA, kwhey, kskg andB. All models were highly significant (Po0:0001). Fig. 5showed the regression between the actual and thepredicted value of the mass of whey collected for 2 hafter reaching pH 4.8. Table 5 shows that, a quadraticterm for temperature was significant for the five models.This correlates very well with the established effect oftemperature on chemical reaction rates, i.e., reactionrates increase exponentially with temperature (e.g.,Arrhenius relationship). The term R00min2, which repre-sents the slope of change in light backscatter close to therheologically defined gelation time, was a significantpredictor for Models I, II and III (W2h, WA, kwhey,respectively). This result was not surprising since R00min2
contains information about the rate of network forma-tion. Another light backscatter parameter, Rmax, wassignificant for the prediction of WA and kwhey. This
eticsa
l III Model IV Model Vc (10�2min�1) kskg
c (10�2min�1) Bc (10�13m2)
92** 0.105* �1.04� 10�12*
�0.135*
39*** 0.0665* 1.37 � 10–13***
***
�1.31� 10–15 ns
1**
2.08� 10–13**
�0.0825**
0.627 0.864
12.9 46.7
0001 Po0:0001 Po0:0001
ARTICLE IN PRESS
0
2
4
6
8
10
12
14
0 2 4 6 8 10 12 14
W2h (%)
Pre
dic
ted
W2h
(%)
Predicted W2h = 0.986 Actual W2h
R2 = 0.969
Fig. 5. Comparison of the observed and predicted mass of whey (W2h)
from undisturbed gel samples 2 h after pH 4.8. Mass values expressed
as a percentage of the initial mass of milk. Prediction was made using
Model I (see Table 5). N ¼ 27. R2, determination coefficient (corrected
for the means).
0
20
40
60
80
100
120
0 20 40 60 80 100 120Accumulated whey mass (g)
Pre
dic
ted
acc
um
ula
ted
wh
ey m
ass
(g)
Fig 6. Fit of Eq. (13) to the experimental values of W (accumulated
whey mass at time t) for the 27 tests, which constituted the three whole
replications of the experiment. Time zero corresponded to the time at
which the gel pH reached a value of 4.8. Initial mass of milk equal to
240 g. Skim milk (10% w/w total solids). Milk coagulated at 22, 27 or
32 1C, adding starter concentration of 0.5, 2.75 or 5% w/w and using
constant concentration of both chymosin (2mg kg�1) and calcium
chloride (0.2 g kg�1). Parameters were: W1 ¼ 164:2 g; a ¼ �0:0114;b ¼ 0:00233; c ¼ �17:9; d ¼ 0:00952.
M. Castillo et al. / International Dairy Journal 16 (2006) 153–163162
parameter was shown to be able to predict cutting timeat constant temperature and protein concentration inrennet-induced coagulation (Castillo, Payne, Hicks,Laencina, & Lopez, 2003). Model IV (kskg) and V(B)had smaller R2 values.
As discussed above, Eq. (4) had the highest model R2
for describing whey drainage (W) of curd and used twoparameters, WN and kwhey. Model III estimates kwhey asa function T2, R00min2, Rmax and an intercept. Substitut-ing Model III for kwhey in Eq. (4) gives the followingmodel for describing whey drainage over all conditionstested:
W ¼W1ð1� e�ðaþbT2þcR00min 2þdRmaxÞtÞ. (13)
Eq. (13) was fitted to the data (27 tests) to determineW1 and the regression coefficients a, b, c and d. W1
was found to have a value of 164.2 g, which represented�68% of the initial skim milk mass. Eq. (13) predictedthe whey drainage (W) as a function of time usingtemperature and light backscatter parameters (R00min2
and Rmax) with an R2 of 0.96 and a SEP of 4.43 g(Fig. 6). These results showed a significant interactionbetween coagulation kinetics and syneresis kinetics. Eq.(13) suggested that it may be possible to control thesyneresis process based on measurable light backscatterparameters and temperature. Since coagulation andsyneresis steps are critical for cheese yield and quality,the value of such measurements is clear.
4. Conclusions
A strong correlation was observed between syneresisparameters and those parameters characterizing acid-
ification (RA) and network formation (tmax, R0max, Rmax,tgel, tan d), which showed that coagulation kineticsplayed an important role in the syneresis process ofmixed gels. Coagulation factors, such as inoculum leveland temperature, had a direct effect on the developmentof the casein matrix, which impacted the physicalcharacteristic of gels (rearrangement capability, perme-ability coefficient). These physical characteristics af-fected the extent and kinetics of the syneresis process.Whey drainage in mixed gels was found to follow a firstorder kinetic reaction. The effect of temperature onkinetic rate constant for whey drainage allowed us toestimate both the thermal coefficient and the activationenergy. The Q10 value for whey expulsion was �2.6,while Ea significantly decreased from 82.5 to57.6 kJmol�1 when the inoculum level increased from0.50 to 5%. Increasing temperature induced a significantincrease in permeability (which is related to porosity),syneresis rate and syneresis extent, while increasinginoculum level had the opposite effect. A significantinteraction between the coagulation kinetics as mea-sured by light backscatter parameters and syneresiskinetics was found. Whey expulsion with time waspredicted using a model that consisted of temperatureand light backscatter parameters with a coefficientof variation of 14.9%. This suggests that it may bepossible to develop a sensor capable of monitoringboth coagulation and syneresis process, which couldlead to greater control of the moisture content andan improvement of the final cheese homogeneityand quality.
ARTICLE IN PRESSM. Castillo et al. / International Dairy Journal 16 (2006) 153–163 163
Acknowledgements
The authors wish to thank the Wisconsin Center forDairy Research for the use of its facilities andReflectronics, Inc., for supplying the light backscattermeasurement equipment. During this research M.Castillo was supported by a post-doctoral grant fromthe program MECD/Fulbright from Spanish Ministryof Education Culture and Sports financed by theSpanish Secretariat of State for Education and Uni-versities and co-financed by the European Social Fund.This research was supported by the USDA CooperativeState Research, Education, and Extension Service(CSREES) project WIS04363.
References
Calvo, M. M., & Balcones, E. (2000). Some factors influencing the
syneresis of bovine, ovine, and caprine milks. Journal of Dairy
Science, 83, 1733–1739.
Castillo, M. (2001). Prediccion del tiempo de corte en la elaboracion de
queso mediante dispersion de radiacion de infrarrojo proximo. Ph.D.
thesis, University of Murcia, Spain.
Castillo, M., Jordan, M. J., Godoy, A., Laencina, J., & Lopez, M. B.
(2000a). Kinetics of syneresis in fresh goat cheese. Milchwis-
senschaft, 55, 566–569.
Castillo, M., Lucey, J. A., & Payne, F. A. (2005a). The effect of
temperature and inoculum concentration on rheological and light
scatter properties of milk coagulated by a combination of bacterial
fermentation and chymosin. Cottage cheese-type gels. International
Dairy Journal, this issue, doi:10.1016/j.idairyj.2005.02.005.
Castillo, M., Payne, F. A., Hicks, C. L., Laencina, J., & Lopez, M. B.
(2003). Effect of protein and temperature on cutting time
prediction in goats’ milk using an optical reflectance sensor.
Journal of Dairy Research, 70, 205–215.
Castillo, M., Payne, F. A., Hicks, C. L., & Lopez, M. B. (2000b).
Predicting cutting and clotting time of coagulating goat’s milk
using diffuse reflectance: Effect of pH, temperature and enzyme
concentration. International Dairy Journal, 10, 551–562.
Castillo, M., Payne, F. A., Wang, T., & Lucey, J. A. (2005b). The
effect of temperature and inoculum concentration on prediction of
both gelation time and cutting time. Cottage cheese-type gels.
International Dairy Journal, this issue, doi:10.1016/j.idairyj.
2005.02.006.
Dejmek, P., & Walstra, P. (2004). The syneresis of rennet-coagulated
curd. In P. F. Fox, P. L. H. McSweeney, T. M. Cogan, & T. P.
Guinee (Eds.), General Aspects: Cheese: Chemistry, Physics and
Microbiology (3rd ed.). Vol. 1. (pp. 71–103). London: Elsevier.
Grundelius, A. U., Lodaite, K., Ostergren, K., Paulsson, M., &
Dejmek, P. (2000). Syneresis of submerged single curd grains and
curd rheology. International Dairy Journal, 10, 489–496.
Kaytanli, M., Erdem, Y. K., & Tamer, I. M. (1993). Factors affecting
whey drainage rate of renneted skim milk gels: A kinetic approach.
Egyptian Journal of Dairy Science, 21, 185–191.
Lagoueyte, N., Lablee, J., Lagaude, A., & Tarodo de la Fuente, B.
(1994). Temperature affects microstructure of renneted milk gel.
Journal of Food Science, 59, 956–959.
Lodaite, K. (2002). Physical properties of rennet-induced skim milk gels.
Ph.D. thesis, Lund University, Sweden.
Lodaite, K., Ostergren, K., Paulsson, M., & Dejmek, P. (2000). One-
dimensional syneresis of rennet-induced gels. International Dairy
Journal, 10, 829–834.
Lucey, J. A. (2001). The relationship between rheological parameters
and whey separation in milk gels. Food Hydrocolloids, 15, 603–608.
Lucey, J. A. (2002). Formation and physical properties of milk protein
gels. Journal of Dairy Science, 85, 281–294.
Lucey, J. A., Munro, P. A., & Singh, H. (1998a). Whey separation in
acid skim milk gels made with glucono-d-lactone: Effects of heat
treatment and gelation temperature. Journal of Texture Studies, 29,
413–426.
Lucey, J. A., Tamehana, M., Singh, H., & Munro, P. A. (1998b).
A comparison of the formation, rheological properties and
microstructure of acid skim milk gels made with a bacterial
culture or glucono-d-lactone. Food Research International, 31,
147–155.
Lucey, J. A., Teo, C. T., Munro, P. A., & Singh, H. (1998c).
Microstructure, permeability and appearance of acid gels made
from heated skim milk. Food Hydrocolloids, 12, 159–165.
Lucey, J. A., Van Vliet, T., Grolle, K., Geurts, T., & Walstra, P.
(1997). Properties of acid casein gels made by acidification with
glucono-d-lactone. 2: Syneresis, permeability and microstructural
properties. International Dairy Journal, 7, 389–397.
Marshall, R. J. (1982). An improved method for measurement of the
syneresis of curd formed by rennet action on milk. Journal of Dairy
Research, 49, 329–336.
Nguang, D. W. H., Chen, X. D., & Ozkan, N. (2002). Thermal
properties and microstructure of ice cream. Ninth Asian Pacific
confederation of chemical engineering congress. September 29–
October 3, 2002, Christchurch, New Zealand.
Noel, Y., Ramet, J. P., Gervais, A., Lablee, J., & Cerf, O. (1989).
Propiedades fısicas del coagulo. In A. Eck (Ed.), El queso
(pp. 187–197). Barcelona: Omega, S.A.
Peri, C., Lucisano, M., & Donati, E. (1985). Studies on coagulation of
milk ultrafiltration retentates II. Kinetics of whey syneresis.
Milchwissenschaft, 40, 650–652.
Roefs, S. P. F. M., de Groot-Mostert, A. E. A., & Van Vliet, T. (1990).
Structure of acid casein gels. 1: Formation and model of gel
network. Colloids and Surfaces, 50, 141–159.
SAS (1999). Statistical Analysis System, Rel. 8.00. SAS Institute Inc.,
SAS Campus Drive, Cary, NC, USA.
St-Gelais, D., & Hache, S. (1995). Whey syneresis of milk enriched
with different retentate powders. Milchwissenschaft, 50,
71–75.
Van Dijk, H. J. M. (1982). Syneresis of curd. Ph.D. thesis, Wageningen
Agricultural University, The Netherlands.
Van Dijk, H. J. M., & Walstra, P. (1986). Syneresis of curd. 2: One-
dimensional syneresis of rennet curd in constant conditions.
Netherlands Milk and Dairy Journal, 40, 3–30.
Van Vliet, T., Van Dijk, H. J. M., Zoon, P., & Walstra, P. (1991).
Relation between syneresis and rheological properties of particle
gels. Colloid and Polymer Science, 269, 620–627.
Walstra, P., (1993). The syneresis of curd. In P. F. Fox (Ed.), General
Aspects: Cheese: Chemistry, Physics and Microbiology (2nd ed.).
Vol. 1 (pp. 141–191). London: Chapman & Hall.
Walstra, P., Geurts, T. J., Noomen, A., Jellema, A., & Van Boekel,
M. A. J. S. (2001). Ciencia de la leche y tecnologıa de los productos
lacteos. Zaragoza: Acribia, S.A.
Walstra, P., Van Dijk, H. J. M., & Geurts, T. J. (1985). The syneresis
of curd. 1: General considerations and literature review. Nether-
lands Milk and Dairy Journal, 39, 209–246.
Weber, F. (1989). El desuerado del coagulo. In A. Eck (Ed.), El Queso
(pp. 21–33). Barcelona: Omega, S.A.
Related Documents


