EFFECT OF TAX INCENTIVES ON FOREIGN DIRECT INVESTMENT IN THE OIL AND GAS SECTOR IN KENYA BY MARTHA WANGUI KANYANJUA A THESIS SUBMITTED TO SCHOOL OF BUSINESS AND ECONOMICS IN PARTIAL FULFILLMENT OF THE REQUIREMENTS FOR THE AWARD OF DEGREE OF MASTER IN TAX ADMINISTRATION AND CUSTOM MOI UNIVERSITY 2020

Welcome message from author
This document is posted to help you gain knowledge. Please leave a comment to let me know what you think about it! Share it to your friends and learn new things together.
Transcript

EFFECT OF TAX INCENTIVES ON FOREIGN DIRECT INVESTMENT IN
THE OIL AND GAS SECTOR IN KENYA
BY
MARTHA WANGUI KANYANJUA
A THESIS SUBMITTED TO SCHOOL OF BUSINESS AND ECONOMICS IN
PARTIAL FULFILLMENT OF THE REQUIREMENTS FOR THE AWARD
OF DEGREE OF MASTER IN TAX ADMINISTRATION AND CUSTOM
MOI UNIVERSITY
2020

ii
DECLARATION
Declaration by the Student:
This thesis is my own original work and has not been presented for award of a degree
in other examination body. No part of this work should be reproduced without my
consent or that of Moi University.
Signature:…………………………………………..Date:……………………………
MARTHA WANGUI
KESRA/105/0083/2017
Declaration by the Supervisors:
This thesis has been submitted with my approval as the university supervisor.
Signature:…………………………………………..Date:……………………………
DR. Bruce Ogaga
Kenya School of Revenue Administration
Signature:………………………………………..Date:………………………………
DR. Joel Tenai
Moi University

iii
DEDICATION
This work has been dedicated to my supporting supervisors Dr. Bruce and Dr. Tenai,
my family members for their uttermost support, encouragement, contribution and
critiques that were a pillar to the success of the write up. Also, to my friends for their
continued support and motivation during my entire period of my study. Thank you and
May the Almighty God bless you abundantly.

iv
ACKNOWLEDGEMENT
I wish to acknowledge the efforts of my supervisor Dr. Bruce who took time to guide
me through the writing of this document. Secondly is Moi University at large. Thirdly,
my friends and classmates for their moral support and companion throughout my
studies. Special thanks to my immediate family for the accorded support emotionally,
economically and for their unending love that has enabled me throughout my studies.
Above all God, for His sustenance and grace throughout my studies and in writing this
document

v
ABSTRACT
Over the years, foreign direct investment inflows to Kenya have not been consistent
with certain cycles of low inflows. This has been attributed to deterioration in economic
efficiency, as well as increasing problems with poor infrastructure and high costs of
living. Previous surveys have also described the lack of well-structured and attractive
tax incentives as a major barrier to the growth of FDI. The purpose of this study was to
assess the effect of tax incentives on foreign direct investment in the oil and gas sector
in Kenya. The specific objectives included: to determine the effect of capital
deductions, income tax, VAT incentives and import duty incentives on foreign direct
investment in the oil and gas sector in Kenya. The research was informed by the theory
of innovation diffusion, social exchange theory and stakeholders’ theory. Explanatory
research design was used in the study. The target population included five oil and gas
companies. The target respondents were 136 senior managers from five oil and gas
companies in Kenya. A census of all the managers was done. Primary data was
collected using structured questionnaires. The study applied quantitative methods to
analyze data. These included descriptive statistics (percentages, means and
frequencies). Further, inferential statistics (Pearson’s correlation and regression) were
conducted to determine the relationship between tax incentives and foreign direct
investment. The findings indicated that capital deductions (β1=0.377, P = .000); income
tax (β2= 0.286, P = .000); VAT incentives (β3= 0.124, P = .020); and import duty
incentives (β4= 0.375, P = .000) had a positive and significant effect on foreign direct
investment. The adjusted R2 of the regression model was 0.789. The study concluded
that tax incentives contribute significantly towards foreign direct investment in the oil
and gas sector. Based on the findings, the study recommended that the government
should strengthen aspects related to tax incentives. These include; wear and tear
allowances, investment allowances, industrial deductions, loss carry-forward,
withholding tax incentives, tax credit incentives, allowable deductions, exemption of
goods and services from VAT, import duty incentives on machinery, raw materials,
office equipment and customs duty. This study focused on the oil and gas sector in
Kenya. Further studies could be conducted in other sectors for comparison purposes.

vi
TABLE OF CONTENTS
DECLARATION ........................................................................................................... ii
DEDICATION .............................................................................................................. iii
ACKNOWLEDGEMENT ............................................................................................ iv
ABSTRACT ................................................................................................................... v
TABLE OF CONTENTS .............................................................................................. vi
LIST OF TABLES ......................................................................................................... x
LIST OF FIGURES ...................................................................................................... xi
OPERATIONAL DEFINITION OF TERMS ............................................................. xii
ABBREVIATIONS/ACRONYMS............................................................................. xiii
CHAPTER ONE .......................................................................................................... 1
INTRODUCTION........................................................................................................ 1
1.0 Chapter Overview .................................................................................................... 1
1.1 Background of the Study ......................................................................................... 1
1.1.1 Foreign Direct Investments ............................................................................... 3
1.1.2 Tax Incentives ................................................................................................... 4
1.1.3 The Oil and Gas Sector in Kenya ..................................................................... 6
1.2 Statement of the Problem ......................................................................................... 7
1.3 Objectives of the Study ............................................................................................ 8
1.3.1 General Objective ............................................................................................. 8
1.3.2 Specific Objectives ........................................................................................... 9
1.4 Research Hypotheses ............................................................................................... 9
1.5 Significance of the Study ......................................................................................... 9
1.6 Scope of the Study ................................................................................................. 10
CHAPTER TWO ....................................................................................................... 11
LITERATURE REVIEW ......................................................................................... 11
2.0 Introduction ............................................................................................................ 11
2.1 Review of Study Concepts ..................................................................................... 11
2.1.1 Foreign Direct Investment .............................................................................. 11
2.1.2 Tax Incentives ................................................................................................. 12
2.2 Theoretical Review ................................................................................................ 13
2.2.1 Theory of Innovation Diffusion ...................................................................... 13

vii
2.2.2 Social Exchange Theory ................................................................................. 14
2.2.3 Stakeholders Theory ....................................................................................... 15
2.3 Empirical Review................................................................................................... 18
2.3.1 Capital Deductions and FDI ........................................................................... 18
2.3.2 Income Tax and FDI ....................................................................................... 21
2.3.3 VAT Incentives and FDI ................................................................................. 24
2.3.4 Import Duty Incentives and FDI ..................................................................... 27
2.4 Critique of Literature Review ................................................................................ 30
2.5 Summary of Previous Studies and Research Gaps ................................................ 30
2.6 Conceptual Framework .......................................................................................... 34
CHAPTER THREE ................................................................................................... 35
RESEARCH METHODOLOGY ............................................................................. 35
3.1 Introduction ............................................................................................................ 35
3.2 Research Design..................................................................................................... 35
3.3 Target Population ................................................................................................... 35
3.4 Sample Size ............................................................................................................ 36
3.5 Research Instrument............................................................................................... 36
3.6 Data Collection Procedure ..................................................................................... 36
3.7 Pilot Testing ........................................................................................................... 37
3.7.1 Reliability of Research Instrument ................................................................. 37
3.7.2 Validity of Research Instrument ..................................................................... 38
3.8 Data Analysis and Presentation ............................................................................. 38
3.9 Regression Assumptions ........................................................................................ 39
3.9.1 Normality Test ................................................................................................ 39
3.9.2 Linearity Test .................................................................................................. 39
3.9.3 Heteroscedasticity Test ................................................................................... 40
3.9.4 Multicollinearity Test ..................................................................................... 40
3.9.5 Test of Autocorrelation ................................................................................... 40
3.10 Operationalization and Measurement of Variables.............................................. 41
CHAPTER FOUR ...................................................................................................... 42
DATA ANALYSIS, INTERPRETATION AND PRESENTATION .................... 42
4.1 Introduction ............................................................................................................ 42
4.2 Response Rate ........................................................................................................ 42

viii
4.3 Reliability Analysis ................................................................................................ 42
4.4 Test of Regression Assumptions ............................................................................ 43
4.4.1 Linearity Test .................................................................................................. 43
4.4.2 Normality Test ................................................................................................ 44
4.4.3 Multicollinearity Test ..................................................................................... 45
4.4.4 Heteroscedasticity Test ................................................................................... 45
4.4.5 Autocorrelation Test ....................................................................................... 46
4.5 Descriptive Analysis .............................................................................................. 46
4.5.1 Descriptive Statistics on Capital Deductions .................................................. 46
4.5.2 Descriptive Statistics on Income Tax Incentives ............................................ 48
4.5.3 Descriptive Statistics on VAT Incentives ....................................................... 49
4.5.4 Descriptive Statistics on Import Duty Incentives ........................................... 50
4.5.5 Descriptive Statistics on FDI .......................................................................... 51
4.6 Correlation Analysis .............................................................................................. 52
4.7 Multiple Regression Analysis ................................................................................ 54
4.7.1 Hypothesis Testing ......................................................................................... 56
4.8 Discussion of the key Findings .............................................................................. 57
CHAPTER FIVE ....................................................................................................... 60
SUMMARY, CONCLUSIONS AND RECOMMENDATIONS ........................... 60
5.1 Introduction ............................................................................................................ 60
5.2 Summary ................................................................................................................ 60
5.2.1 Capital Deductions .......................................................................................... 60
5.2.2 Income Tax ..................................................................................................... 61
5.2.3 VAT Incentives ............................................................................................... 61
5.2.4 Import Duty Incentives ................................................................................... 62
5.3 Conclusions ............................................................................................................ 63
5.4 Recommendations .................................................................................................. 64
5.4.1 Recommendations to Theory .......................................................................... 64
5.4.2 Recommendations to Policy and Practice ....................................................... 64
5.4.3 Suggestions for Further Studies ...................................................................... 65
REFERENCES ............................................................................................................ 67
APPENDICES ............................................................................................................. 74
Appendix I: Introduction Letter ............................................................................... 74

ix
Appendix II: Questionnaire ..................................................................................... 75
Appendix IV: Authorization Letter from KESRA ................................................... 80
Appendix V: NACOSTI Research Permit ............................................................... 81

x
LIST OF TABLES
Table 2.1: Summary of Literature Review and Research Gaps ................................... 32
Table 3.1: Target Population........................................................................................ 36
Table 3.2: Operationalization & Measurement of Variables ....................................... 41
Table 4.1: Response Rate ............................................................................................. 42
Table 4.2: Reliability Results ....................................................................................... 43
Table 4.3: Linearity Test; ANOVA ............................................................................. 44
Table 4.5: Multicollinearity Test Using VIF ............................................................... 45
Table 4.6: Breusch-Pagan / Cook-Weisberg test for heteroskedasticity ...................... 45
Table 4.7: Durbin-Watson test of Autocorrelation ...................................................... 46
Table 4.8: Descriptive Statistics on Capital Deductions .............................................. 47
Table 4.9: Descriptive Statistics on Income Tax Incentives ........................................ 48
Table 4.10: Descriptive Statistics on VAT Incentives ................................................. 49
Table 4.11: Descriptive Statistics on Import Duty Incentives ..................................... 50
Table 4.12: Descriptive Statistics on FDI .................................................................... 51
Table 4.14: Model Summary; Tax Incentives and FDI .............................................. 54
Table 4.15: ANOVA; Tax Incentives and FDI ........................................................... 54
Table 4.16: Coefficients; Tax Incentives and FDI ...................................................... 55
Table 4.17: Summary of Hypotheses Test ................................................................... 57

xi
LIST OF FIGURES
Figure 2.1: Conceptual Framework ............................................................................. 34

xii
OPERATIONAL DEFINITION OF TERMS
Tax Incentive refers to the tax obligation deduction, exclusion or exemption given as
an incentive to participate in a particular investment operation
(Prichard, 2016).
Foreign Direct Investment is the net inflows of investment from other countries to
Kenya through the oil and gas sector (Maiga et al., 2019).
Capital Deductions Incentives is another form of direct tax incentive, which provides
stipulated percentages of investment costs that could be deducted
from tax liabilities (Gitonga, 2017).
Import Duty Incentive refers to measures the government takes to reduce tax levied
on imported oil and gas products (Irokwe & Nnaji, 2017).
Income Tax Incentive is the government measure to reduce the amount of tax expected
from business undertakings over a given period of time (Lodhi,
2017).
VAT Incentives refers to measures the government takes to reduce the consumption
tax placed on a product whenever value is added at each stage of
the supply chain, from production to the point of sale (Narayana,
2015).

xiii
ABBREVIATIONS/ACRONYMS
AIBUMA African International Business and Management
CGT Capital Gains Tax
CGTR Capital Gains Tax Rate
FDI Foreign Direct Investment
GDP Gross Domestic Product
IMF International Monetary Fund
KES Kenya Shillings
LDCs Less Developed Countries
MENA Middle East and North Africa
MNE Multinational Enterprise
PWC Price Waterhouse Coopers
SPSS Statistical Package for Social Sciences
UK United Kingdom
UNCTAD United Nations Conference on Trade and Development
USA United States of America

1
CHAPTER ONE
INTRODUCTION
1.0 Chapter Overview
This chapter provides background of the study, statement of the problem, objectives,
hypotheses, significance and scope of the study. The purpose of the study was to
investigate the effect of tax incentives on foreign direct investment in the oil and gas
sector in Kenya.
1.1 Background of the Study
Foreign Direct Investment (FDI) has risen rapidly globally, because it is a significant
form of international capital inflows, as well as because of its ability to turn emerging
economies financially and politically (Adam & Tweneboah, 2009). The efforts of
developing countries to attract FDIs are based on potential positive effects on the
domestic economy, according to Njuguna (2016), such as increasing productivity,
complementing domestic private investment, technology transfer, management and
technical skills, the provision of an international production network, training of
employees, job creation and easy access. Global studies show that tax incentives are
one of the major factors driving FDI inflows into a given country (Loyford & Moronge,
2014).
FDI is the net inflows of investment from one economy to another, so FDI is calculated
by the net inflow, which is the remainder of the first inflows of investment after
withdrawal of the divestiture, estimated as a percentage of the GDP of the economy
(Shahbaz, Lean & Kalim, 2013). FDI is useful for multinational companies as it is a
way to reach the markets, access resources, and reduce production costs. It also benefits
the invested nation as it generates much-needed domestic investment capital, creates

2
job opportunities for locals, introduces new management skills and strategies, business
practices, technology and economic principles that ensure local markets, new industries
and increased growth in sales that contributes to economic growth (Karthik & Kannan,
2011).
In Africa, legitimate reasons as to why tax incentives are ideal for investments exist
although strong reasons also exist as to why the economic and fiscal costs could be
relatively higher than the returns. Tax incentives have struggled to achieve higher
investment in some countries. However, in some circumstances, without substantial
reductions in investment inflows into the host nation, the incentives have been
eliminated (UNCTAD, 2012).
While FDIs face many constraints, the absence of well-structured and attractive tax
incentives appears invariably to be a major obstacle to the growth of FDIs in previous
surveys. In African countries such as South Africa, Ghana and Nigeria among others,
tax incentives contribute to the promotion strategies of the government. Different
countries have adopted various tax incentives so as to boost growth, attract FDI,
promote technological transfer and diversify production. Taxes influence the net return
on capital and most policymakers consider it to have great impact on capital movements
between nations (Morisset & Pirna, 2011).
Kenya has become very active for oil exploration, with the entry of major companies
including Tullow oil, BG Group, Apache, Africa Oil, Marathon, Total, ENI, Anadarko
and Camac Energy (Skouloudis et al., 2011). As an economy, Kenya revolves around
the oil and gas sector because, as a primary revenue earner, it exerts a huge impact on
the economy. Oil and gas play a critical role in maintaining prices of goods and services

3
at their minimum levels. On the other hand, increased fuel prices may trigger high
transport costs leading to increased prices of consumer goods and services. In the global
energy system, oil and natural gas are major and dominant components (Roupas et al.,
2011).
In 2008, Kenya unveiled its 2030 vision with the goal of achieving global FDI
competitiveness and economic growth, among other items. In Kenya's FDI inflow
patterns, beginning with the period 1970-1980, there have been inconsistencies. The
relatively high level of development, good infrastructure, market size, growth and
openness to FDI led to the selection of Kenya as their regional hub by multinational
corporations at a time when other countries in the area had relatively closed regimes
(Kinuthia, 2010).
1.1.1 Foreign Direct Investments
Muema (2013) defined Foreign Direct Investments (FDI) as long-term investments
outside the investor's physical or economic limits. The FDI recipient country is
equipped with both the capital flow and the technology flow that will aid in its growth.
When a country wants to invest in another, the benefit it hopes to achieve must be
greater than the risks it must face. UNCTAD (2012) describes three different FDI
forms. There are: reinvested dividends, equity capital and other capital comprised
mainly of intercompany loans.
Foreign direct investment generates new employment opportunities as the transfer of
expertise and technical know-how as well as the provision of jobs is done while setting
up business, hiring and educating the locals in the host country. FDI reflects long-term

4
host-country obligations, according to Kinuthia (2010). It is a preferred form of
investment because it has no responsibilities to the host country.
Over the years, foreign direct investment has not been constant, with low inflows over
some periods being recorded. Due to a decline in economic productivity, as well as
increasing problems with poor infrastructure and high living costs, FDI in the oil and
gas sector was low in the 1980s and 2010s, which had a significant negative impact on
FDI inflows in Kenya (KPMG, 2012). In total, Kenya has more than 200 multinational
companies in all sectors, with the main traditional sources of FDI being Britain, the
USA, Germany, South Africa, the Netherlands, Switzerland, China and India (Selma,
2013).
For several foreign companies, Kenya serves as the East African business center. This
translates into the reliance of FDI on the inflow of capital, which, in turn, reflects the
supply of employment and the economy that these foreign investments help to develop.
Kenya's FDI average percentage growth between 2007 and 2016 was 40 percent (40
percent) with inflows mainly channelled to retail and consumer goods, technology,
media, telecommunications, minerals, oil and natural gas sectors from the UK, USA
and India (Ernest & Young, 2015). In 2016, FDI inflows amounted to USD 1076.9
million (KES 105.29 billion), up from USD 670 million (KES 65.51 billion) the year
before, a 60% (60%) increase. This money went mainly to the sectors of oil, gas and
manufacturing (UNCTAD, 2016).
1.1.2 Tax Incentives
Tax incentive is the tax obligation deduction, exclusion or exemption given as an
incentive to participate in a particular investment operation (Prichard, 2016). In Kenya,

5
investment allowances, tax exemptions or reduced tax rates, special economic zones
and tax credits are among the most prevalent tax incentives. In particular, tax incentives
are in the form of capital market incentives, capital credits, EPZ bonuses, and export
tax remissions.
Most developing countries prefer to use tax holidays as tax incentives. According to
UNCTAD (2000), tax holidays is an incentive where paying of CIT by new foreign
establishments is exempted for a specified period of time, likely five years in most
cases. Still, other tax liabilities the firm faces may also apply from the provision of the tax
holiday, for instance, import duties and VAT from raw materials. Tax holiday incentive
is a temporary measure and in most cases the exemptions of administration tax on firms
is rendered during holiday seasons (Munongo, Akanbi & Robinson, 2017).
Tax incentives expand the horizon of investment opportunities and also promote the
advancement of social welfare through incentives related to education and health care.
Additionally, tax incentives help to reduce overreliance on agricultural production
which is affected by market instabilities (Jirasavetakul & Rahman, 2018).
Proponents of tax benefits point out that, as a result of reduced tax costs, investors
receive a higher rate of return, enabling them to re-invest with the additional revenue
received. The host country thus increases its revenue, benefits from the transfer of
technology and attracts increased FDIs. In less developed countries (LDCs), it is also
argued that it is necessary to provide tax incentives to investors since these countries
usually have very poor investment climates, such as dilapidated infrastructure, political
uncertainty, macro-economic volatility and high business costs (Basu & Srinivasan,
2012).

6
Reducing the investment tax burden could mean reducing government spending or
transferring the tax burden to other tax bases, such as labor, for example. Tax policy
makers also need to understand whether investment taxes matter and how much they
do (Keen, 2012). A sound tax policy decision should carefully weigh the benefits of a
reduction in corporate taxes against the costs. It is clear that nations around the world
have engaged in the process of attracting FDI through various means and instruments,
including tax incentive economies (Keen, 2012).
1.1.3 The Oil and Gas Sector in Kenya
The oil and gas sector in Kenya is largely split into three segments: upstream
(exploration and production), mid-stream (storage, refining and transport) and
downstream (supply and distribution). The upstream section mainly includes the
processes of crude oil and natural gas exploration, growth and production (Barua,
2010).
In the midstream segment, processes involving the storage, refining and transportation
of crude oil into consumable oil and gas products are involved. There is only one
refinery in Kenya today, which is Kenya Petroleum Refineries Limited, based in
Mombasa. The downstream section includes the mechanism by which refined goods
are made available to customers by, for example, supply and distribution at
manufacturing and petrol stations. In Kenya today, with a multitude of players, there is
a reasonably well-developed network of transport pipelines, storage and retail outlets
(Barua, 2010).
The study centered on the upstream segment, which is involved in the processes of
crude oil and natural gas exploration, growth and production. Tullow Oil, Zarara, ENI,
7
Total and Africa oil are the main businesses that constitute the upstream segment. The
gas and oil sector is regarded as one of Kenya's key contributors to FDI inflows. Over
the years, however, FDI has not been consistent with some times of recorded low
inflows. This study therefore sought to investigate the effect of tax incentives on foreign
direct investment in the oil and gas sector in Kenya.
1.2 Statement of the Problem
Foreign direct investment plays an important role in the growth of economies
worldwide. In Kenya, FDI inflows are important for job development, the introduction
of new management skills and techniques, business practices, technology and economic
principles that ensure the growth of local businesses, new industries and increased
revenue that leads to economic growth (Karthik & Kannan, 2011). According to
Feldstein (2010), FDI integrates emerging technology, resulting in new methods of
production as well as diversification of the output and production of a range of products.
In the recent past, Kenya has continued to report low inflows despite the important role
played by FDI inflows. The report of the United Nations Conference on Trade and
Development (UNCTAD, 2016) reported that Kenya was among the countries that in
2016 received less inflows of foreign direct investment compared to the previous year.
The report showed, in particular, that FDI inflows to Kenya fell by 36% from Ksh 63.59
billion to Ksh 40.7 billion, even as inflows to East Africa grew by 13%. In addition, the
UNCTAD (2018) study reported that Kenya's FDI inflows dropped to $0.3 billion in
2018 from $0.7 billion in 2017, a 57.1 percent decline. This clearly indicates that
reduction in FDI inflows to Kenya is a persisting problem that needs attention.

8
The movement of individuals, capital and materials to invest in the host country
anywhere in the world can be influenced by a robust tax structure. Again, many
stakeholders agree that foreign investment is facilitated by a flexible tax policy and tax
incentives, thereby helping the host nation to stem the tide of unemployment that
generates economic growth (Easson & Zolt, 2012). Many studies have focused on the
role of tax incentives in promoting FDI, but their relative effect has not been clearly
defined (Voorpijl, 2011). The influence of tax incentives on foreign direct inflows is
important, Hartman (2014) and Young (2013) contend. Morisset (2013) and OECD
(2013) claim that the tax incentive strategy has had mixed results and has been criticized
by OECD countries and multilateral organizations because it has also been linked to
illicit capital flows. Morisset (2013) argued that the question is if, whether it had
provided incentives or none at all, the new investment would have come to the nation
or not if so then free-rider investors would benefit, while the treasury loses and the
economy reaps no net profit.
These issues have highlighted the need to clearly assess the impact of tax incentives on
FDI, both locally and globally. In addition, the studies reviewed in Kenya did not show
how tax incentives have an effect on FDI in the oil and gas sector. This study aimed to
fill the research vacuum by exploring the effect of tax incentives on foreign direct
investment in the oil and gas sector in Kenya.
1.3 Objectives of the Study
1.3.1 General Objective
The general objective of the study was to investigate the effect of tax incentives on
foreign direct investment in the oil and gas sector in Kenya.

9
1.3.2 Specific Objectives
i. To determine the effect of capital deductions on foreign direct investment in the
oil and gas sector in Kenya.
ii. To establish the effect of income tax on foreign direct investment in the oil and
gas sector in Kenya.
iii. To examine the effect of VAT incentives on foreign direct investment in the oil
and gas sector in Kenya.
iv. To establish the effect of import duty incentives on foreign direct investment in
the oil and gas sector in Kenya.
1.4 Research Hypotheses
i. H01: There is no significant effect of capital deductions on foreign direct
investment in the oil and gas sector in Kenya
ii. H02: There is no significant effect of income tax on foreign direct investment in
the oil and gas sector in Kenya
iii. H03: There is no significant effect of VAT incentives on foreign direct
investment in the oil and gas sector in Kenya
iv. H04: There is no significant effect of import duty incentives on foreign direct
investment in the oil and gas sector in Kenya
1.5 Significance of the Study
The study's findings provide a more precise and in-depth understanding of the effects
of tax incentives on foreign direct investment in the oil and gas sector in Kenya as a
whole and help shape the future policy formulation of the sector, thereby greatly
facilitating the achievement of the country's goals of improving the reliability and
efficiency of foreign direct investors.

10
The taxation regime for the oil and gas in Kenya, which is a specialized sector is still
very new and is still growing. Through the findings of this study, the policymakers will
find ways of balancing between attracting investment and optimizing tax revenue for
development.
The study will also be instrumental for new investors and those already present in
Kenya since it will arm them with knowledge while making investment decisions
Through this analysis the researcher was able to share a deeper and wider understanding
of the impact of tax incentives on foreign direct investment in the oil and gas sector in
Kenya, thus obtaining more knowledge in a field that the researcher may not be familiar
with. The results of the study will serve as literature for scientists to shed more light on
the effect of tax incentives on foreign direct investment in the oil and gas sector in
Kenya.
1.6 Scope of the Study
The objective of the study was to examine the effects of tax incentives on foreign direct
investment in Kenya's oil and gas sector. The oil and gas sector was ideal for the
research. The research was in reference to five oil and gas companies namely: Tullow
Oil, Zarara, ENI, Total and Africa oil that are still operating in Kenya to date. These
companies also have their main offices in Nairobi and therefore, it was easy for the
researcher to access them. The five oil and gas companies formed the study target
population. A census of all the five companies was done. The research was carried out
in 2020.

11
CHAPTER TWO
LITERATURE REVIEW
2.0 Introduction
The chapter presents the study concepts, review of past studies, theoretical review,
critical analysis, research gaps and conceptual structure.
2.1 Review of Study Concepts
This section provides review of the study concepts. It outlines the meaning and
measurements of the variables.
2.1.1 Foreign Direct Investment
In order to monitor the production and distribution of a company's activities in the host
country, FDI is the mechanism by which domestic individuals acquire ownership of
assets (Maiga, Oumarou & Coulibaly, 2019). Foreign direct investment is considered
by the International Monetary Fund (IMF) to be an international investment branch
where an investor acquires a long-term interest in an undertaking in one economy
residing in another economy. Not only does foreign direct investment carry money, but
it also speeds up the transition of technology, operational and management processes
and skills, as well as the strengthening of international business relations.
According to Shah and Ali (2016), FDI has for a long time been linked with the growth
of international business and remains the basis of operation of MNCs. FDIs are in most
cases created by MNCs and operate as a component of the parent corporation’s attempt
to defend its ability to gain profits from the control of intangible assets in line with
emerging competitive forces domestically and abroad. Lawana (2016) noted that FDI

12
is premised on gaining higher profits from control of business operations in foreign
countries.
The rise of FDI is regarded as a positive aspect in both the organization, social and
economic perspective. Tax incentives and tax reductions are used by countries as
instruments to stimulate FDI inflow. For instance, China has effortless reduced their
taxes from 30% to 15%-24% to steer investments endeavors in specific parts of the
country. Romania is another example whereby various companies have been exempted
to pay custom duties and corporate duties to allow investments in the country. Such
measures are directed to stimulate the countries’ economies, and in the end through
social contributions and the employee’s personal income tax will increase in the state
budget (Jirasavetakul & Rahman, 2018).
2.1.2 Tax Incentives
Tax incentives can be described as a tax liability deduction, exclusion or exemption
provided as an incentive to participate in a designated investment activity (Prichard,
2016). In Kenya, investment allowances, tax exemptions or reduced tax rates, special
economic zones and tax credits are among the most prevalent tax incentives. Tax
incentives specifically take the form of capital market incentives, Capital allowances,
EPZ benefits and tax remissions for exports.
Irokwe and Nnaji (2017) identified tax incentives as special arrangements in tax laws
to: attract, retain or increase investment in a specific field, stimulate growth in specific
areas and assist companies or individuals engaged in the activities specified. They
further noted that the underlying basis is to ensure the overall growth of the economy
and also the development of all industries. It can therefore be inferred that tax incentives

13
are tax concessions in order to stimulate or promote particular policies aimed at
stimulating investment in certain industries or geographical areas.
Tax incentives have been extensively used as drivers of investment. Countries such as
Ireland, Mauritius and Singapore have realized high levels of investment through
adoption of fiscal incentives. Despite the success attributed to incentives in some
countries, a number of others have not realized the anticipated investment outcomes
(Sunny & Shu, 2019).
By granting tax incentives, the horizon of investment opportunities is expanded. At the
same time, tax incentives promote the advancement of social welfare through incentives
related to education and health care. Additionally, tax incentives help to reduce
overreliance on agricultural production which is affected by market instabilities
(Jirasavetakul & Rahman, 2018).
2.2 Theoretical Review
This section provides a review of theories that underpin the study. These are theory of
innovation diffusion, social exchange theory and stakeholders’ theory.
2.2.1 Theory of Innovation Diffusion
Rogers (1995) introduced the theory of innovation diffusion that is based on the notion
of the spontaneous or planned dissemination of new ideas concerning the introduction
of innovation. Rogers describes innovation as a perceived fresh concept, practice or
object. The theory emphasizes that the perception of change is essential and that it
should be regarded as an innovation if and when the concept appears new to the
prospective adopter.

14
It is proposed that the nature of an invention in the innovation diffusion hypothesis is
seen as creating confusion in the minds of prospective adopters (Omesa, 2015). In this
situation, the absence of predictability and data relates to uncertainty. Among members
of a communicating social network, diffusion is further characterized as a method of
data exchange motivated by the need to decrease uncertainty. Uncertainty, along with
the comparative probabilities of each of these solutions, can be regarded as the degree
to which, in relation to the occurrence of a particular event, a set of solutions is viewed.
To minimize this ambiguity, those interested in considering the acceptance of
innovation are encouraged to look for data (Ajemije, 2020).
The theory argues that data is embodied by a technological innovation, so its
implementation acts to decrease uncertainty. The theory is important in this study since
it emphasizes the aspect of creating fresh thoughts that can assist improve an
organization performance. Likewise, in terms of attracting FDI, new ideas such as the
use of tax incentives will enable oil and gas companies to boost their efficiency. As
such, the innovation diffusion theory supports the utilization of tax incentives including
capital deductions, income tax, VAT incentives and import duty incentives in order to
enhance foreign investment inflow.
2.2.2 Social Exchange Theory
The Social Exchange Theory (SET) was developed by Homans (1958) and views
human beings as rationally seeking to maximize their material benefits from
transactions with others in a free and competitive market place. However, contemporary
SET theorists have recognized that the actions of human beings are not always the way
utilitarian thoughts portrayed them, though the assumption underlying SET is that in
their trade transactions with others, human beings are often trying to make a profit,

15
which is regulated to a significant extent by considerations of both material and non-
material costs and benefits (Binyamin, Friedman & Carmeli, 2018).
Roch, Shannon, Martin, Swiderski, Agosta and Shanock (2019) noted that the
reciprocation increases when both partners in an organization provide timely resources
to the other. The resources to be exchanged becomes impersonal when it involves
financial incentives or socio-emotional when it involves such attributes as care, respect,
and loyalty. Most notably, these relationships are used to explain the positive results
that come about when employees respond to perceived organizational support (Liaquat
& Mehmood, 2017). In an exchange arrangement, where the other has provided
advantages in the past or is expected to do so in the future, one party offers benefits to
the other party. One party will be willing to extend benefits to the other because in
return, they will expect to receive benefits in equal measure from the other (Nazir, Qun,
Hui & Shafi, 2018).
In this analysis, the theory of social trade supports the idea that the government provides
the oil and gas industry with tax incentives (capital deductions, income taxes, VAT
incentives and import duty incentives) in exchange for a rise in foreign direct
investment. Therefore, the theory describes the link in the oil and gas industry between
tax incentives and FDI inflows.
2.2.3 Stakeholders Theory
Edward Freeman (1984) introduced the theory that considers a stakeholder as a group
or individual with an impact on or is affected by an organization’s performance and
goal attainment. The stakeholder theory holds that organizational management should
identify persons of interest or groups that are affected by an organization or project,

16
understand their needs, and stipulate measures necessary to cater for the needs of the
interest groups and persons (Bonnafous-Boucher & Rendtorff, 2016). Highlighted
responsibilities towards stakeholders include efficient use of capital, timely provision
of accurate information, and effective business management. Taking Freeman’s
definition of stakeholders, internal and external stakeholders, based on their level of
power and interest, unilaterally determine the strategy of an organization.
Notably, stakeholders play a crucial role in strategy implementation and influence the
success of an organization. Freeman, Harrison and Zyglidopoulos (2018) noted that
effective stakeholder management involves proper management of the relationship
between an organization and its stakeholder. In particular, it’s essential for an
organization to focus on proper contracting, communication, motivation, and
management of partnerships. According to (Al-Nasser & Muhammed, 2017)
organization’s that address the needs and interests of stakeholders perform better than
organization’s that fail to pay attention to stakeholders.
The instrumental perspective of stakeholder management posits that maintaining
healthy relationships between stakeholders and an organization increases the firm’s
value, which has a positive implication on a firm’s overall performance (Bonnafous-
Boucher & Rendtorff, 2016). Effective management of performance drives favorable
interest by stakeholders towards the organization. Notably, stakeholders have a
perceived stake and expectations in an organization or project, and the perception often
influences behaviors, which could be destructive or constructive for an organization. In
essence, maintaining open and effective communication with stakeholders, whether
direct or indirect, influences their perceptions toward the firm, which affects their
response and behavior.

17
The principle is relevant in this analysis as it lays a foundation for stakeholder human
resource and communication management. In essence, addressing stakeholder human
resource and communication management needs in an organization directly fulfills the
premise of catering for the needs of the stakeholders. Furthermore, articulate
engagement of internal stakeholders informs the objective of stakeholder capacity
building particularly in the case of empowering internal stakeholders. In turn, it’s
possible to analyze the effect of the study objective and stakeholder engagement to
project performance.
According to Gross (2015), the theory evaluates the efficiency of a company's policy
based on the expectations of the stakeholders. Any company's performance draws
interest from a number of key parties. The main stakeholders interested in the
performance of the companies are investors/owners, vendors, clients and staff in the
case of small and medium enterprises. Stakeholders are therefore worried with the
company's behavior and operations to ensure enhanced profitability. Some of the
performance factors that stakeholders are interested in, based on the concept, include
sales, liquidity and returns on investment. Investors' interest is in returns on investment,
maximizing their wealth.
The stakeholder principle is imperative in this analysis as it brings out the expectations
that stakeholders have in regard to their company’s performance. Based on the theorist
argument, stakeholders expect the company to perform well and to yield high returns.
In the case of oil and gas industry, the expectation is that the industry will attract high
FDI inflows. The theory thus supports the dependent variable in this study which is
FDI.

18
2.3 Empirical Review
This section provides a review of past studies related to the study variables with an aim
of identifying prevailing research gaps.
2.3.1 Capital Deductions and FDI
Bernstein and Anwar (2014) developed a dynamic development model to analyze the
impact of tax policies on input demands and output supplies for manufacturers
operating in selected industries in Mexico, Turkey and Pakistan. The tax advantages
related to these sectors have included investment exemptions, accelerated capital
consumption allowances, reductions in corporate income tax rates and investment tax
credits. The results of the Bernstein-shah model suggest that for the six industries
studied in the three countries, tax incentives for investment and production decisions
are necessary. In addition, some tax incentives have been found to be more effective
than others in stimulating investment per dollar in Treasury revenue losses. Among the
incentive measures tested were investment allowances, accelerated depreciation
provisions and investment tax credits, which proved to be cost-effective instruments to
stimulate investment in Turkish industries.
Tapang (2018) looked at the effect of tax incentives on foreign direct investment in the
petroleum industry in Nigeria. In the petroleum industry, the tax incentive issue has not
really earned positive attention because individuals believe that the sector is wealthy
enough to pay all taxes. Although tax incentives are weak in the oil sector, they can't
be contrasted with what we have in the private sector. The issue of high tax rates,
numerous taxes, complex tax laws and a lack of sufficient tax-related education or
education is the ability to sustain and develop the petroleum sector. These have led to
an increase in the record of petroleum industry shortages in Nigeria. An ex-post-facto

19
system has been adopted for review. The findings have shown that the tax advantage
proxy for investment tax credits, non-productive leases and capital allowances has had
a major effect on foreign direct investment. It is inferred, on the basis of the findings,
that companies obtaining tax benefits will generate more work opportunities than
companies in highly taxed regions. A favorable investment climate is a powerful
prerequisite for the flow of sustainable physical investment in an economy. Tax
incentives have a positive impact on living standards and income from capital and
improve the option of goods at the disposal of clients.
Lawson and Bentum-Micah (2019) assessed the efficacy of targeted government
policies and investment agreements in developed countries in attracting FDI flows. The
influence of economic variables such as the existence of infrastructure, labor costs,
annual gross domestic product rise, actual effective exchange rate and tax incentives,
as well as bilateral investment treaties, on foreign direct investment inflows over a 30-
year period in Ghana has been explored in order to achieve this. The study found that
FDI inflows differ across the systemic break studied and that a limited percentage of
bilateral investment treaties are expressed as a contributing factor to FDI. National
policies have, however, proved to play an important role in attracting FDI into Ghana.
Tapang (2018) looked at the effect of tax incentives on foreign direct investment in the
petroleum industry in Nigeria. In the petroleum industry, the tax incentive issue has not
really earned positive attention because individuals believe that the sector is wealthy
enough to pay all taxes. Although tax incentives are weak in the oil sector, they can't
be contrasted with what we have in the private sector. The issue of high tax rates,
numerous taxes, complex tax laws and a lack of sufficient tax-related education or
education is the ability to sustain and develop the petroleum sector. These have led to

20
an increase in the record of petroleum industry shortages in Nigeria. An ex-post-facto
system has been adopted for review. The findings have shown that the tax advantage
proxy for investment tax credits, non-productive leases and capital allowances has had
a major effect on foreign direct investment. It is inferred, on the basis of the findings,
that companies obtaining tax benefits will generate more work opportunities than
companies in highly taxed regions. A favorable investment climate is a powerful
prerequisite for the flow of sustainable physical investment in an economy. Tax
incentives have a positive impact on living standards and income from capital and
improve the option of goods at the disposal of clients.
Mutisya (2019) has examined the impact of tax incentives involving investment
deduction allowances, industrial building allowances and export promotion incentives
on foreign direct investment in Kenya. An explanatory research design based on a 32-
year time series period starting from 1985 to 2016 followed this report. Secondary time
series knowledge was used in this study. As the data was quantitative in nature, it was
interpreted using descriptive and inferential statistics. The descriptive statistics
included frequency distributions, mean, standard deviation and percentages.
Correlation analysis and regression analysis of multivariates is used as inferential
statistics. The findings have shown that the investment deduction allowance has had a
positive and important effect on foreign direct investment in Kenya. The study
concludes that an export promotion incentive, followed by an industrial building
allowance and an investment deduction allowance, was the most significant impact on
foreign direct investment. The study shows that the government needs to educate the
general public about the capital allowances that are awarded to FDIs and to local
businesses. In addition, there should be an incentive for a short-term strategy tailored

21
for individual businesses to draw up FDIs, while a long-term strategy should be to
improve infrastructure, protect and reduce strict policies and regulations.
Gitonga (2017) explored the relationship between tax incentives and foreign direct
investment inflows by multinational firms in Kenya. The analysis gathered secondary
expertise. Data was gathered from a time series spanning twenty years (1995-2015).
The study findings demonstrated that there was a strong link between wear and tear
allowances and FDI inflows. This was an indication that the period of study (1995-
2015) FDI inflows of multinational corporations in Kenya was a result of attraction
from wear and tear allowances; a correlation coefficient of 0.5465 confirmed this
relationship. However, investment deductions and industrial building allowances had
no any significant relationship on FDI inflows.
The influence of tax incentives in attracting and maintaining FDI in export processing
zones was examined by Thuita (2017). For the analysis, a sample size of 72 employees
of companies operating under EPZs was chosen using a stratified method for companies
and a purposeful method for respondents. Using self-administered questionnaires, the
study used a descriptive survey design. The research showed that the use of capital
deductions substantially affects FDI attraction and retention. The study concludes that
tax incentives to boost the growth and expansion of foreign direct investors should be
increased. However, as it did not focus on the oil and gas market, the study poses a
contextual void.
2.3.2 Income Tax and FDI
Munongo and Ribinson (2018) conducted a research analysis on whether tax incentives
attract foreign direct investment within the Southern African Development Community

22
(SADC). This study provides a detailed analysis of the effects of each tax incentive on
the attraction of FDI to SADC by differentiating between the individual tax incentives
used in the field of SADC. The tax advantages used in the study are tax holidays,
corporate income tax, losses carried forward and decreased CIT in unique industries.
The results showed that tax holidays are explained positively by FDI and CIT and have
a negative impact on FDI inflows into SADC. Losses carried forward are negligible,
though decreased CIT negatively affects FDI inflows into SADC in particular sectors.
Hsu, Lee, Leon-Gonzalez and Zhao (2019) used the provincial-level panel data for 1998
to 2008 before the reform in order to study whether the tax incentive was a significant
determinant of foreign investment decisions. We find that the size of the market and the
geographical location have had a major impact on FDI inflows to China, but tax
incentive policies have not been a sufficient determinant of FDI inflows to China over
the periods studied, providing a justification for the termination of FDI tax incentives
at the time of the 2008 reform in China.
Murage et al. (2019) examined the relationship between tax incentives and FDI in the
East Africa Group Member States. A descriptive study design panel was used for the
evaluation of the relationship between tax incentives and foreign direct investment in
the Community Partner States of East Africa, including Tanzania, Rwanda, Kenya,
Burundi and Uganda. The research used secondary panel data from 2002 to 2017, which
covered a period of 16 years. The study found that the duration of losses carried forward
had no statistically significant effects on the inflow of FDI. Investment allowances,
however, had a statistically positive effect on the inflow of FDI into the EAC. The study
concluded that the investment allowance had a major influence on FDI inflows among
the partner states of the East African community.

23
Olaleye, Riro and Memba (2016) analyzed the impact of company income tax
advantages on foreign direct investments in Listed Nigerian Manufacturing Firms. The
study adopted a descriptive research design and gathered primary data using
questionnaires. With about 56,000 workers, the 74 listed manufacturing companies
were the target population of the study. A sample size of 352 respondents from thirty-
two (32) manufacturing firms was selected from seventy-four (74) firms using stratified
purpose sampling and respondents were divided into three layers; top, middle and lower
management classes. The descriptive statistics adopted were: frequencies, mean and
standard deviation, while inferential statistics consisted of correlation and regression
analysis. The results revealed a clear positive linear association between reduced
incentives for corporate income taxes and foreign direct investment.
Lodhi (2017) researched the incentivized tax policy and its impact on investments in
Pakistan. The analysis was mainly based on a quantitative investigation methodology
and was intended to provide insight into the effect of tax and tariff rate changes on
domestic investment, while evaluating and assessing the impact of tax and tariff rates
on FDI. The research used both ARDL and regression analysis methods to analyze the
relationship between the corporate tax rate, tariff rate, and domestic investment. The
study's results showed that the corporate tax rate was substantially negatively related to
domestic expenditure and FDI.
The effect of the corporate income tax rate on foreign direct investment (FDI) was
investigated by Mandinga (2015) for Small Island Developing States (SIDS). We plan
to verify whether the effective corporate income tax rate, the gross domestic product
(GDPc) per capita, the size and development of the economy, the degree of
transparency, the availability of natural resources, the growth of the financial sector and

24
the macroeconomic and political stability of the 22 SIDS countries studied between
2004 and 2013 have an impact on FDI activities. Based on data collected from the
World Bank, UNCTAD and PWC Annual Reports, empirical evidence is presented.
The results of the partial adjustment model with panel data show that FDI is negatively
linked to both the corporate income tax rate and the initial role of fiscal policy in
attracting FDI and the growth of the financial sector, demonstrating the inefficiency of
the domestic finance sector in supplying the capital needed by FDI. Furthermore, per
capita GDP, the size and growth of the economy, the degree of openness, and
macroeconomic stability are positively related to FDI.
2.3.3 VAT Incentives and FDI
Olaniyi, Oyedokun and Ajayi (2019) have examined the impact of tax policy incentives
on the inflows of foreign direct investment into Nigeria. The effects on the inflow of
foreign direct investment into the country of corporate income tax incentives, incentives
for petroleum gain taxes, incentives for value added taxes and incentives for customs
and excise duties was directly investigated from 1994 to 2016. This study adopted the
ex-post-facto style of research. The study found that customs and excise duties and
value-added tax incentives had a significant impact on foreign direct investment in the
region, while company income tax and oil tax incentives had a marginal effect on
foreign direct investment. The study concluded that a powerful driver of direct foreign
investment in Nigeria's economy is tax incentive policies.
The contribution of tax incentives to FDI inflows to Nigeria, Ghana and South Africa
was evaluated by Ugwu (2018), as well as the effect of such FDI inflows on exports
from those countries after the adoption of IFRSs from 1999-2015. The Ex-post-facto
research architecture was adopted. In order to collect and interpret secondary data,

25
descriptive and inferential statistics were used. The results showed that there was a
strong relationship between tax incentives and FDI and that FDI had no major impact
on exports from Nigeria, Ghana and South Africa. In addition, there was no major
difference in the effect of FDI on exports from all the countries analyzed in their pre-
and post-IFRS adoption periods. This means that the lower the corporate tax rate, the
higher the increase in other tax benefits, the higher the amount of FDI inflows to those
countries, and the significant amount of FDI inflows to those countries would have a
huge effect on exports.
As a case study using SMEs in Nyarugenge, the effect of tax incentives on the growth
of small and medium-sized enterprises (SMEs) in Rwanda was studied by Twesige and
Gasheja (2019). It has followed the approach of qualitative and quantitative analysis.
The population includes 49000 small and medium-sized enterprises working in the
district of Nyarugenge from the agricultural, manufacturing, service and tourism
sectors. A sample of 136 SMEs was measured using Silovin and Yemen's sample size
formula. In order to select the sample, basic methods of random and purposeful
sampling were used. The data set was analysed using descriptive statistics. A multiple
regression analysis was used to explain the relationship between variables. The study
showed that the relationship between tax incentives and the growth of small and
medium-sized enterprises was strongly positive and significant. The study concluded
that tax incentives are the key to sustainable SME development.
Narayana (2015) stressed in his study that the experiences of many developing
countries have shown that if properly designed and implemented, VAT will prove to be
a better resource mobilizer than the existing sales tax systems. Owolabi and Okwu
(2014) reviewed the importance of VAT and noted that developed countries are
26
increasingly realizing the essential position of value added tax as an instrument of
economic development.
Bahizi (2016) assessed the impact of monetary policy and tax incentives on attracting
FDI in Rwanda. Using a purposeful sample size of 80 respondents, the investigator
conducted the study using structured interviews, questionnaires, and secondary data.
The Tax Administration Body (RRA) and Foreign Private Companies conducted this
report. The investigator concluded that Rwanda's investment code is phenomenal,
attracting foreign investors. A significant measure is tax enforcement among foreign
investors in Rwanda. Rwanda's tax structure makes a major contribution to the
reduction of tax aversion among investors. The exemption is the most important tax
incentive form to be highlighted. The indirect impact on revenues can be beneficial
because new investments, realized by tax incentives, create new jobs and are related to
the results of generating tax revenue. Furthermore in Rwanda, other variables would
also appeal to FDI.
The results of research on tax incentives and foreign direct investment in the Middle
East and North Africa (MENA) region by Onyeiwu and Shrestha (2015) show that VAT
does not have a significant impact on the flow of FDI into the MENA region. In order
to attract FDI, certain MENA states should pay more attention to non-VAT. The
alternative hypothesis suggests that the listed Kenyan manufacturing companies have a
substantial relationship between VAT incentives and FDI.
Kuria (2017) analyzed the impact of corporate income tax incentives and VAT
incentives on EPZ corporations' outcomes in Kenya. The thesis adopted a methodology
of analysis which is descriptive and explanatory. The study used both primary and

27
secondary data. The results showed that the relationship between corporate income tax
incentives and VAT incentives and the performance of EPZ companies was positive
and substantial. Based on the findings, the study concluded that the government should
continue to grant tax exemptions in order to attract and maintain foreign investors in
the country.
2.3.4 Import Duty Incentives and FDI
Gumo (2013) examined the effect on foreign direct investment in Kenya of tax
incentives. The analysis adopted a descriptive design for research and gathered
secondary data. The study found that Kenya has numerous tax incentives provided to
resident businesses, including import duty. The results revealed a positive and
important correlation between import duty and inflows of FDI. The study concludes
that tax incentives would have a positive resulting effect on FDI and recommends that
in order to promote investment, the government should revisit its policy on tax
incentives and balance against accruing benefits, including by implementing evidence-
based tax incentives to reduce tax evasion. However, since it did not concentrate on the
oil and gas industry, which is the focus of the proposed report, the examined study poses
a contextual void.
The efficiency of tax incentives in attracting foreign direct investment to Ethiopia was
examined by Bora (2013). It also analyzes the differential effects of tax benefits on
various industries by splitting FDI into 10 sectors. Dummy variables are used in the
sectors under consideration to show the existence and absence of tax benefits, tax
holidays and exemption from customs duties. The study uses panel data on 10 industries
over the 1992-2012 period and an econometric model that covers tax holidays, customs
duty exemptions and control variables. The empirical result shows that only tax

28
holidays were found to be important to tax benefits, while in the general model, the
customs duty exemption was negligible. Economic openness was important among the
control variables. However if the sectoral allocation of FDI is taken into account, tax
holidays only have a significant effect on the manufacturing sector, while the customs
duty exemption has a significant impact on the building, energy and water supply
sectors. This outcome implies that FDI's exposure to tax incentives depends on the
sector to which the investment flows. Since it was conducted in Ethiopia, the analysis
under review presents a conceptual difference, while the proposed study will
concentrate on the Kenyan oil and gas industry.
In view of current evidence of tax incentive shortcomings, developing countries have
gradually resorted to using tax incentives to attract FDI. A common feature of many
investment codes in sub-Saharan Africa is tax incentives. Sub-Saharan African
countries see tax incentives as a means of attracting FDI, as there are no feasible
alternatives per se, and accept that tax incentives should be structured to ensure that
FDI advances socio-economic and technological development. Reliance on tax
incentives at the expense of maximizing domestic tax revenues, however, poses a
challenge to sustainable development. Ofori (2019) has analyzed Ghana and Kenya to
see which of them will better achieve this balance and to make suggestions on how this
balance can be improved. The analysis found that there is no successful tax incentive
design and administration. The recommendations suggest that legislative and
administrative reforms be made in order to make tax incentives more efficient.
One of the most significant stimuli for improving the host countries' economy is the
inflow of foreign direct investment. It is therefore not surprising that countries'
governments show a strong interest in foreign capital inflows and create favorable

29
conditions for investors. Investment rewards take different forms and are offered within
the framework of goal projects as well as regulated by laws. The study by Ślusarczyk
(2018) offers two of the most important examples of supporting FDI with tax incentives
in Poland: State funding for Special Economic Zones (SEZ) investors and,
subsequently, the exemption from property tax provided to investors by individual
municipalities. A study of the legal documents and public assistance reports published
in Poland, an evaluation of the activity of the Special Economic Zones and several other
validated studies were the subjects of the thesis. As a result of the considerations
undertaken, it is clear that foreign investors, as confirmed by the value of the capital
invested by them in the form of FDIs, frequently and significantly benefit from the
incentives offered by the Government of Poland. The reviewed study reveals a
conceptual gap because it did not specifically focus on import duty incentives as is the
case in the proposed work.
Ngure (2018) assessed tax incentives and their impact on the production of selected
manufacturing companies in Kenya. In particular, the study sought to investigate the
effect on the production of selected manufacturing companies in Kenya of incentives
for customs duties. The researchers followed a descriptive study style. As of 2016, the
study population consisted of all 725 manufacturing companies in all categories under
the Kenya Association of Manufacturers directory. A pooled panel regression model
was used to test the importance of the effect of the independent variables on the
dependent variable. The study period was 2017 and knowledge was collected from 2011
to 2016. Custom duty rewards were found to have a positive and important impact on
the company’s performance, even though their impact on performance was the least.
The report exposes a conceptual difference since it focuses on the output of

30
manufacturing companies, while FDI will be the subject of the proposed study. In
addition, because the checked work used secondary data, there is a methodological
discrepancy, which is used by primary data in the proposed research.
2.4 Critique of Literature Review
The reviewed studies investigated the connection between tax incentives and FDI.
However, most of these studies have been conducted in other countries such as Mexico,
China, Pakistan, Turkey and Nigeria (Lodhi, 2017; Bernstein & Anwar, 2014;
Feldstein, 2010; & Olaleye, Riro & Memba, 2016). The mentioned countries operate in
a different economic and political environment from that of Kenya. For example, China
is the second richest Country in the world and happens to be a developed country. It
would therefore be impractical to generalize findings of a study conducted in China to
fit in the Kenyan context.
On the other hand, local studies have attempted to investigate the effect of tax incentives
on FDI (Gitonga, 2017; Murage et al., 2019). However, these studies have aggregated
FDI inflows from all sectors. It is, therefore, difficult to tell the specific inflows through
the gas and oil sector. By examining the effects of tax incentives on foreign direct
investment in the oil and gas sector in Kenya, the current study sought to resolve these
limitations in literature.
2.5 Summary of Previous Studies and Research Gaps
A critical review of past literature shows that several conceptual, contextual and
empirical research gaps exist in attempts to research the effect of tax incentives on
foreign direct investment (FDI). Klemn and Parys (2009) performed an empirical study
to address the question of how effective tax incentives are in attracting investment. In

31
over 40 Latin American, Caribbean and African nations, information was gathered
between 1984 and 2014. The results have shown that lower corporate income tax rates
and longer tax holidays are effective at attracting FDI, but not at boosting gross private
fixed capital formation or growth. The study presents a contextual gap since it did not
focus on oil and gas sector. Furthermore, the study was conducted in other countries
and not Kenya.
The Babatunde and Adepeju (2012) empirical research on tax incentives showed that
tax incentives had a substantial effect on FDI in the Nigerian oil and gas market.
However, because it was conducted in Nigeria, which is a different setting from Kenya,
the study poses a contextual void.
There is also little literature in Kenya, particularly in the oil and gas sectors, on tax
incentives and foreign direct investment. The lack of adequate empirical literature in
Kenya on tax incentives and FDI inflows in the oil and gas sectors and the inconsistency
in previous studies' findings on the precise position of the effect of tax incentives on
FDI raise the question of whether tax incentives have been effective in attracting FDIs
in the oil and gas sector in Kenya.
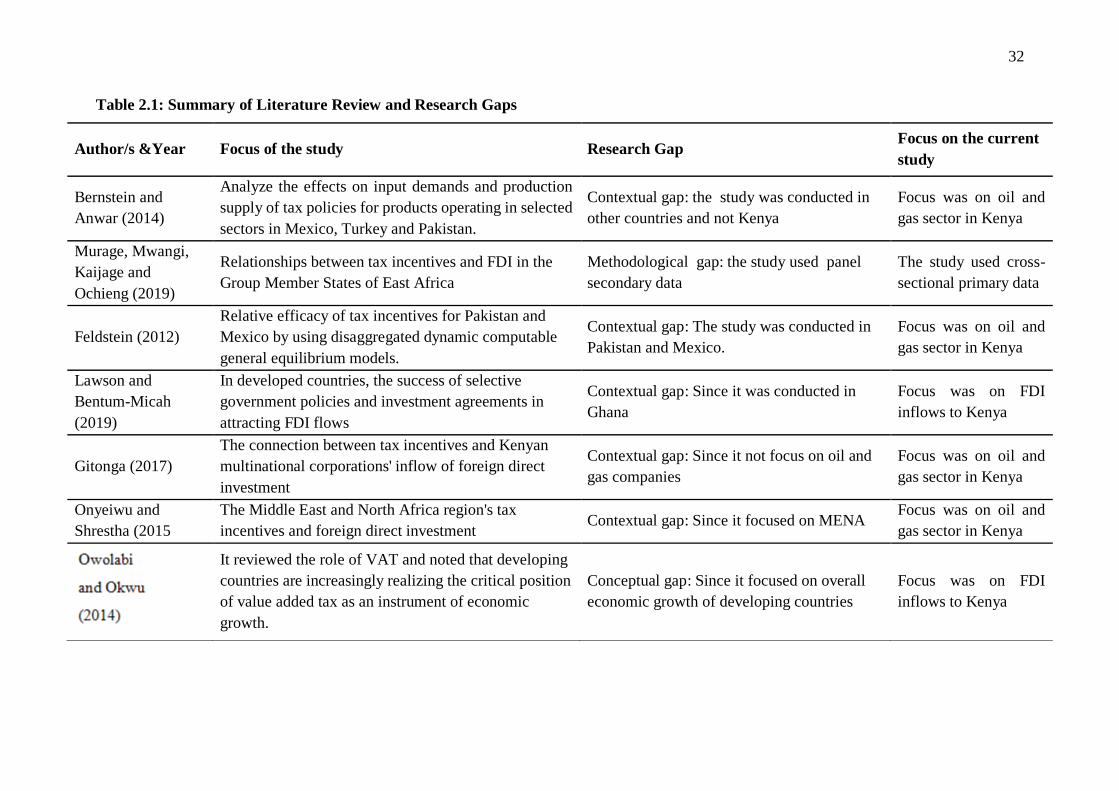
32
Table 2.1: Summary of Literature Review and Research Gaps
Author/s &Year Focus of the study Research Gap Focus on the current
study
Bernstein and
Anwar (2014)
Analyze the effects on input demands and production
supply of tax policies for products operating in selected
sectors in Mexico, Turkey and Pakistan.
Contextual gap: the study was conducted in
other countries and not Kenya
Focus was on oil and
gas sector in Kenya
Murage, Mwangi,
Kaijage and
Ochieng (2019)
Relationships between tax incentives and FDI in the
Group Member States of East Africa
Methodological gap: the study used panel
secondary data
The study used cross-
sectional primary data
Feldstein (2012)
Relative efficacy of tax incentives for Pakistan and
Mexico by using disaggregated dynamic computable
general equilibrium models.
Contextual gap: The study was conducted in
Pakistan and Mexico.
Focus was on oil and
gas sector in Kenya
Lawson and
Bentum-Micah
(2019)
In developed countries, the success of selective
government policies and investment agreements in
attracting FDI flows
Contextual gap: Since it was conducted in
Ghana
Focus was on FDI
inflows to Kenya
Gitonga (2017)
The connection between tax incentives and Kenyan
multinational corporations' inflow of foreign direct
investment
Contextual gap: Since it not focus on oil and
gas companies
Focus was on oil and
gas sector in Kenya
Onyeiwu and
Shrestha (2015
The Middle East and North Africa region's tax
incentives and foreign direct investment Contextual gap: Since it focused on MENA
Focus was on oil and
gas sector in Kenya
It reviewed the role of VAT and noted that developing
countries are increasingly realizing the critical position
of value added tax as an instrument of economic
growth.
Conceptual gap: Since it focused on overall
economic growth of developing countries
Focus was on FDI
inflows to Kenya

33
Author/s &Year Focus of the study Research Gap Focus on the current
study
Gumo (2013) The effect of tax incentives on Kenya's foreign direct
investment.
A contextual gap: since it did not focus on oil
and gas industry,
Focus was on oil and
gas sector in Kenya
Munongo and
Ribinson (2018)
Whether the tax incentives in the Southern African
Development Community (SADC) draw foreign direct
investment.
Contextual gap: The study was conducted in
southern African Development Community
The study was done in
Kenya.
Olaleye, Riro and
Memba (2016)
Impact on foreign direct investment in listed Nigerian
manufacturing companies of business income tax
incentives
Contextual gap: Focused on manufacturing
companies in Nigeria
Focus was on oil and
gas sector in Kenya
Lodhi (2017) Incentivized tax policy and its impact on Pakistani
investments
Contextual gap: The study was conducted in
Pakistan
The study was done in
Kenya
Bora (2013) Tax incentive effectiveness in attracting foreign direct
investment to Ethiopia.
Contextual gap: The study was conducted in
Ethiopia
The study was done in
Kenya.
Ślusarczyk (2018), Taxation incentives are a crucial factor in attracting
foreign direct investment to Poland.
Conceptual gap: The study did not
specifically focus on import duty incentives.
Focused on import
duty incentives
Ngure (2018) Tax incentives and their effect on the output of the
manufacturing companies selected in Kenya.
Methodological gap: The study used
secondary data.
The study utilized
primary data
Olaniyi, Oyedokun
and Ajayi (2019)
Impact on foreign direct investment inflows through
tax policy incentives in Nigeria.
Contextual gap: The study was conducted in
Nigeria
The study was done in
Kenya.
Ugwu (2018) Contribution of tax benefits to the influx of FDI to
Nigeria, Ghana and South Africa
Contextual gap: Focused on other countries in
Africa
The study was done in
Kenya.
Kuria (2017)
The impact on the results of EPZ companies in Kenya
of the corporate income tax incentive and VAT
incentive.
Conceptual gap: since it focused on
performance of EPZ firms and not FDI
inflows to Kenya
Focus was on FDI
inflows to Kenya

34
2.6 Conceptual Framework
A conceptual framework is a graphical illustration of the research concepts and how
they relate with each other, which have been or have to be studied in the research
graphically or in some other narrative form (Tamene, 2016). The independent variables
(tax incentives) include capital deductions, income tax incentives, VAT incentives and
import duty incentives. The dependent variable (FDI) is measured using corporate
social responsibility, technology diffusion and managerial skills.
Independent Variables Dependent Variable
Figure 2.1: Conceptual Framework
Source: Author (2019)
Capital Deductions
Investment allowance
Wear and tear allowances
Foreign Direct
Investment in the Oil
and Gas Industry
Corporate social
responsibility
Technology
diffusion
Managerial skills
VAT Incentives
Exempted goods and services
Zero rated goods and services
Import Duty Incentives
Machinery
Office Equipment
Income Tax
Loss carry-forward
Withholding tax Rate
H03
H02
H01
H04

35
CHAPTER THREE
RESEARCH METHODOLOGY
3.1 Introduction
The study sought to analyse the effect of tax incentives on foreign direct investment in
the oil and gas sector in Kenya. It provides a blueprint for knowledge collection,
calculation and study. Therefore the researcher discusses in this section the methods
and techniques used in data collection, processing and analysis.
3.2 Research Design
This research adopted an explanatory research technique. This design helps in
understanding the cause and effect relationship between research concepts (Rahi,
2017). In this report, the researchers sought to evaluate the influence of tax incentives
on foreign direct investment in Kenya's oil and gas field. Using an explanatory study
design, the investigator was thus able to assess the causal effect between tax incentives
and foreign direct investment.
3.3 Target Population
This is a well-defined or identified category of persons, groups of things, families,
businesses, facilities, elements or events that are being studied. Thus, a certain
specification that the researcher is researching should suit the population and the
population should be homogeneous (Cox, 2009). This research targeted five oil and gas
companies in Kenya including Tullow, Zarara, ENI, Total and Africa oil. The five
companies were purposively selected. The choice of the five companies was because
they are the only ones that are still active to-date. Further, senior managers formed
suitable respondents since they possessed adequate knowledge and information in

36
regard to the subject matter. Table 3.1 indicates the total target respondents as 136
managers.
Table 3.1: Target Population
Companies Managers
Tullow 30
Zarara 26
ENI 34
Total 30
Africa Oil 16
Total 136
3.4 Sample Size
Kothari (2014) observed that when a study population is relatively small, a census
should be conducted. In this study, the target respondent of 136 senior managers was
considered small and therefore a census was conducted.
3.5 Research Instrument
To each member of the target group, the researcher administered a survey instrument
(questionnaire). Using a standardized questionnaire, primary information was obtained
directly from respondents. Based on the goals of the report, the research instrument was
organized. The questionnaire consisted of questions concerning the variables in the
analysis. The investigator was thus able to investigate the effect of tax incentives on
foreign direct investment in the oil and gas sector in Kenya.
3.6 Data Collection Procedure
The research instruments were individually administered by the study to the target
respondents from five oil and gas companies: Tullow, Zarara, ENI, Total and Africa.

37
To ensure that all questionnaires were given to the respondents, the researcher exercised
care and control, and to do this, the researcher maintained a registry of questionnaires
that were administered and received.
3.7 Pilot Testing
The purpose of the pilot study was to test the reliability of the questionnaires. According
to Cooper and Schindler (2010), a pilot test is critical for testing the reliability of data
collection instruments. Cox (2009) describes the reliability of research as determining
whether the analysis would actually calculate what it was intended to measure or how
truthful the research outcomes would be. To detect design and instrumentation
vulnerabilities and to provide proxy data for sample collection, a pilot study was
conducted. In this survey, the questionnaire was administered randomly to 10 percent
of the target population. The respondents who participated in the pilot were excluded
from the main data collection. Riff, Lacy and Fico (2014) postulated that for pilot
research, 10% of the target population is sufficient.
3.7.1 Reliability of Research Instrument
Fisher (2009) defines reliability as the degree to which findings are consistent over time
and an accurate representation of the total population under analysis is referred to as
reliability and if the results of a study can be repeated under a similar methodology, the
research instrument is considered to be reliable. Kirk and Miller (2009) established
three types of reliability in quantitative research that relate to the degree to which a
measurement, repeatedly given, maintains the stability of a measurement over time and
the similarity of measurements over a given time period. Charles (2009) adheres to the
theory that through the test-retest process, the accuracy by which questionnaire test
items are answered or the ratings of individuals remain relatively the same can be

38
determined at two distinct times. The most common measure of internal consistency,
known as the Alpha of Cronbach (alpha), was used in this study. It illustrates the degree
to which it is possible to consider a number of test items as a single latent variable
calculation (Cronbach, 1951). The suggested value of 0.7 was used as a cut-off of
reliability for this study. The value of Cronbach alpha must be at least 0.7 or higher for
the research instrument to be reliable.
3.7.2 Validity of Research Instrument
Riff, Lacy and Fico (2014) noted that the accuracy and significance of inferences are
accurate, depending on the research findings. Fisher (2009) notes that validity
determines whether the study really measures what it was intended to assess or how
specific the research results are. The research was piloted by 10 percent of the target
population. The actual research did not involve these respondents. The pilot study
authorized the research instrument to be pre-tested. In order to enhance the validity and
reliability of the instrument, the clarity of the research instruments was developed for
the respondents. The pilot outcome allowed the investigator to fix contradictions that
were seen to emerge from the tools, which meant that what was expected was
calculated.
3.8 Data Analysis and Presentation
The quantitative data obtained using questionnaires was analyzed using descriptive
statistics and presented by means of percentages, means and frequencies. The SPSS
software aided the analysis. In addition, to evaluate the relationship between tax
incentives and foreign direct investment, the study used inferential statistics (Pearson's
correlation and regression analysis). Frequency tables and maps were used to display
the results. The analytical model which directed the research was:
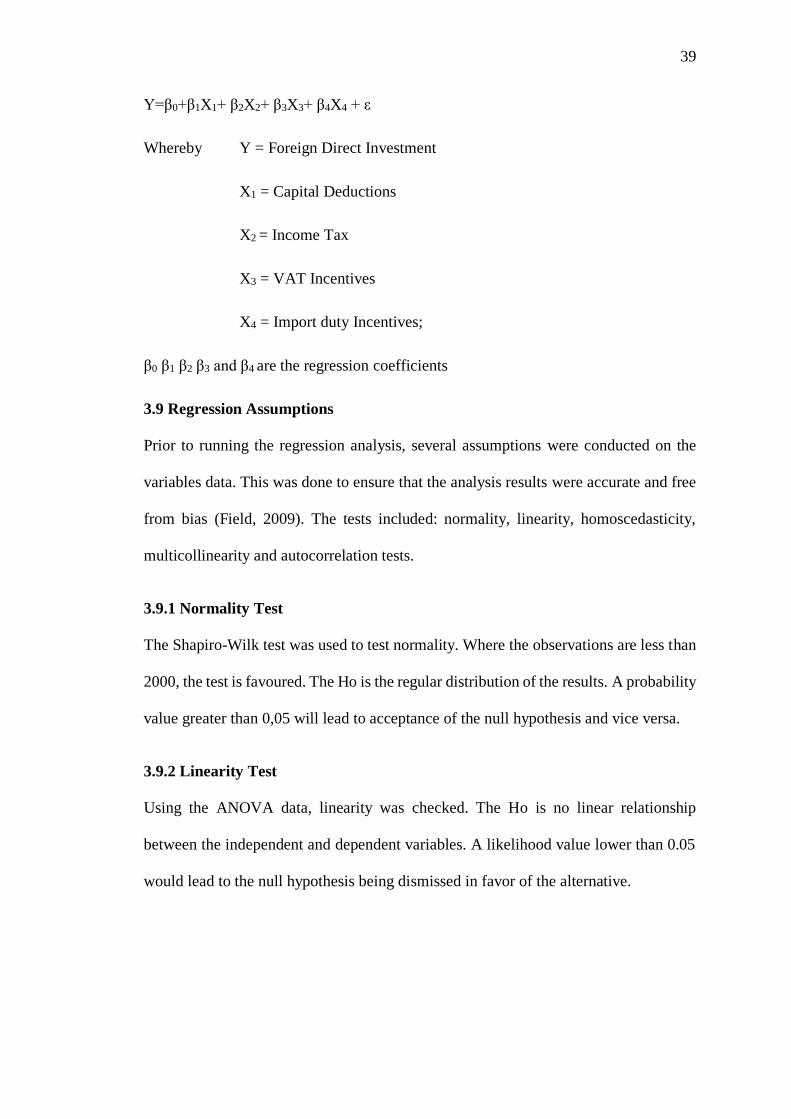
39
Y=β0+β1X1+ β2X2+ β3X3+ β4X4 + ε
Whereby Y = Foreign Direct Investment
X1 = Capital Deductions
X2 = Income Tax
X3 = VAT Incentives
X4 = Import duty Incentives;
β0 β1 β2 β3 and β4 are the regression coefficients
3.9 Regression Assumptions
Prior to running the regression analysis, several assumptions were conducted on the
variables data. This was done to ensure that the analysis results were accurate and free
from bias (Field, 2009). The tests included: normality, linearity, homoscedasticity,
multicollinearity and autocorrelation tests.
3.9.1 Normality Test
The Shapiro-Wilk test was used to test normality. Where the observations are less than
2000, the test is favoured. The Ho is the regular distribution of the results. A probability
value greater than 0,05 will lead to acceptance of the null hypothesis and vice versa.
3.9.2 Linearity Test
Using the ANOVA data, linearity was checked. The Ho is no linear relationship
between the independent and dependent variables. A likelihood value lower than 0.05
would lead to the null hypothesis being dismissed in favor of the alternative.

40
3.9.3 Heteroscedasticity Test
Heteroskedasticity occurs when for free variables, the ward variable exhibits
inconsistent fluctuation across the range. The Breusch-Pagan / Godfrey test (1979) was
used to test for heteroscedasticity. The null hypothesis is that the error term variance is
constant. The null hypothesis is denied if it is P< 0.05. If P>0.05, on the other hand, the
null hypothesis is accepted, which means a constant variance of the error term.
3.9.4 Multicollinearity Test
Where there is a close relation between at least two autonomous variables,
multicollinearity exists. The prescient strength of individual variables reduces the
closeness of multicollinearity. The Variance Inflation Factor (VIF) has been used to
verify multi-collinearity. A VIF of less than 3 shows no multicollinearity for all the
independent variables, whereas a VIF of more than 10 shows a multi-collinearity
problem (Field, 2009).
3.9.5 Test of Autocorrelation
The autocorrelation test was conducted using the Durbin-Watson autocorrelation test
to determine whether the residual is serially correlated or not. The Durbin Watson test
indicates a test statistic with a value of 0 to 4, where: 2 denotes no autocorrelation; 0 to
2<2 denotes a positive autocorrelation; while >2 denotes a negative autocorrelation.
The rule of the decision is that statistical test values are relatively normal in the 1.5 to
2.5 range. Values may be cause for concern beyond this set (Field, 2009).

41
3.10 Operationalization and Measurement of Variables
Table 3.2: Operationalization & Measurement of Variables
Variable
Type of
variable Indicators
Source/
Author
Type of
Questions
Tool of
Analysis
Foreign
Direct
Investment
Dependent
-Technology
diffusion
-Corpoate social
Responisbility
-New managerial
skills
Onyeiwu
and
Shrestha
(2015)
Questionnaire
-Likert scale
Descriptive,
regression
Analysis.
Capital
Incentives Independent
-Investment
allowance
-Wear and tear
allowances
Gitonga
(2017)
Questionnaire
-Likert scale
Descriptive,
regression
Analysis.
Income
Tax Independent
-Withholding tax
rate
-Allowable
deductions
-Loss carry
forward
Olaleye,
Riro and
Memba
(2016)
Questionnaire
-Likert scale
Descriptive,
regression
Analysis.
VAT
Incentives Independent
- Exempted goods
and services
- Zero rated goods
and services
Kuria
(2017)
Questionnaire
-Likert scale
Descriptive,
regression
Analysis.
Import
duty
Incentives
Independent
-Machinery
-Raw materials
-Office
Equipment
Ślusarczy
k (2018),
Questionnaire
-Likert scale
Descriptive,
regression
Analysis.

42
CHAPTER FOUR
DATA ANALYSIS, INTERPRETATION AND PRESENTATION
4.1 Introduction
The data analysis, presentation, and interpretation of the research findings are discussed
in this chapter. The study analyzed the effects of tax incentives on foreign direct
investment in Kenya's oil and gas field.
4.2 Response Rate
This section provides the response rate results.
Table 4.1: Response Rate
Response Frequency Percentage
Returned 108 79.4%
Unreturned 28 20.6%
Total 136 100%
Source: Research Data (2020)
The findings in Table 4.1 indicate that out of the 136 questionnaires administered to the
respondents, 108 were properly filled and returned. This represented 79.4% response
rate. The remaining 28 questionnaires were either unreturned or not valid. A return rate
above 50 percent is sufficient for study (Mugenda & Mugenda, 2003). This meant that
the response rate was satisfactory in this sample.
4.3 Reliability Analysis
This section presents reliability results for each variable. The findings are shown in
Table 4.2.

43
Table 4.2: Reliability Results
Variables
Number of items Cronbach's
Alpha Comment
Foreign Direct Investment 5 0.761
Capital Deductions 4 0.769
Income Tax 5 0.764
VAT Incentives 4 0.753
Import Duty Incentives 4 0.733
Overall 0.756
Source: Research Data (2020)
The results in Table 4.2 indicate that FDI had an alpha coefficient of 0.761; capital
deductions, 0.769; income tax, 0.764; VAT incentives, 0.753; and import duty
incentives, 0.733. The overall alpha coefficient was 0.756>0.7. This implied that all the
items measuring the study variables were dependable.
4.4 Test of Regression Assumptions
This section presents results on the evaluation of the assumptions of regression. The
assumptions were: linearity, normality, heteroscedasticity, multicollinearity, and
autocorrelation. The aim of testing these assumptions was to guarantee that the findings
were correct and bias-free.
4.4.1 Linearity Test
Linearity test was checked using the ANOVA and results shown in Table 4.3.
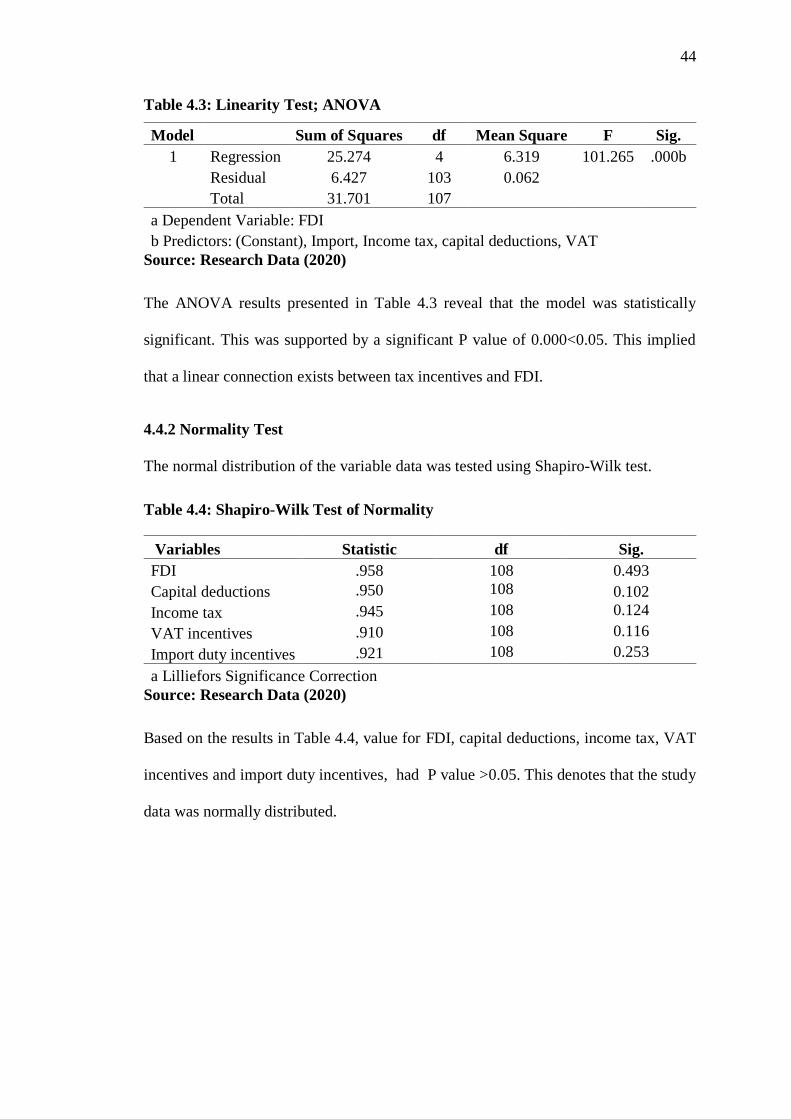
44
Table 4.3: Linearity Test; ANOVA
Model Sum of Squares df Mean Square F Sig.
1 Regression 25.274 4 6.319 101.265 .000b
Residual 6.427 103 0.062 Total 31.701 107 a Dependent Variable: FDI b Predictors: (Constant), Import, Income tax, capital deductions, VAT
Source: Research Data (2020)
The ANOVA results presented in Table 4.3 reveal that the model was statistically
significant. This was supported by a significant P value of 0.000<0.05. This implied
that a linear connection exists between tax incentives and FDI.
4.4.2 Normality Test
The normal distribution of the variable data was tested using Shapiro-Wilk test.
Table 4.4: Shapiro-Wilk Test of Normality
Variables Statistic df Sig.
FDI .958 108 0.493
Capital deductions .950 108 0.102
Income tax .945 108 0.124
VAT incentives .910 108 0.116
Import duty incentives .921 108 0.253
a Lilliefors Significance Correction
Source: Research Data (2020)
Based on the results in Table 4.4, value for FDI, capital deductions, income tax, VAT
incentives and import duty incentives, had P value >0.05. This denotes that the study
data was normally distributed.

45
4.4.3 Multicollinearity Test
Table 4.5: Multicollinearity Test Using VIF
Tolerance VIF
Capital deductions 0.401 2.492
Income Tax 0.439 2.276
VAT incentives 0.214 4.664
Import duty incentives 0.206 4.849
a Dependent Variable :FDI
Source: Research Data (2020)
The results in Table 4.5 indicate that the variables capital deductions, income tax, VAT
incentives and import duty incentives had VIF values less than 10. According to Hair,
Black and Babin (2010), VIF value of less than 10 denotes no multi-collinearity.
Therefore, the study established that the independent variables were not highly
correlated.
4.4.4 Heteroscedasticity Test
Table 4.6: Breusch-Pagan / Cook-Weisberg test for heteroskedasticity
Ho: Constant variance
Variables: fitted values of FDI
chi2(1) = 4.95
Prob > chi2 = 0.0644
Source: Research Data (2020)
Results in Table 4.6 indicate a probability value of 0.0644>0.05. The Ho was therefore
not rejected. Therefore, the error term was homoscedastic implying that there was no
problem of heteroskedasticity.

46
4.4.5 Autocorrelation Test
Table 4.7: Durbin-Watson test of Autocorrelation
Mod
el R
R
Square
Adjusted R
Square
Std. Error of the
Estimate
Durbin-
Watson
1
.893
a 0.797 0.789 0.24979 1.723
a Predictors: (Constant), Income tax, capital deductions, VAT
b Dependent Variable:
FDI
The findings in Table 4.7 display a Durbin-Watson value of 1.723, varying from 1.5 to
2.5, suggesting that the null hypothesis of no autocorrelation was accepted and that the
residuals were not autocorrelated.
4.5 Descriptive Analysis
This section presents descriptive results relating to the study variables. The specific
descriptive statistics included: percentages, mean and standard deviation.
4.5.1 Descriptive Statistics on Capital Deductions
The study sought to evaluate the effects of capital deductions on foreign direct
investment in Kenya's oil and gas field. The following scale was used: strongly disagree
(1) disagree (2) neutral (3) agree (4) and strongly agree (5).

47
Table 4.8: Descriptive Statistics on Capital Deductions
Statements SD D N A SA M
Std.
dev
Capital allowances are a tool
used to stimulate investment
in Kenya's oil and gas
market. 3.7% 13.9% 5.6% 36.1% 40.7% 4.0 1.2
The oil and gas companies
receive capital deductions
inform of wear and tear
allowances 5.6% 18.5% 2.8% 36.1% 37.0% 3.8 1.3
The oil and gas companies
receive capital deductions
inform of investment
allowances 2.8% 16.7% 0.9% 46.3% 33.3% 3.9 1.1
The oil and gas companies
receive capital deductions
inform of industrial
deductions 8.3% 19.4% 4.6% 28.7% 38.9% 3.7 1.4
Aggregate mean 3.8 1.2
Source: Research Data (2020)
The results in Table 4.8 show that the most of the participants with an overall mean
score of 3.8 and a standard deviation of 1.2 agreed with the capital deduction claims.
Participants accepted that capital allowances are a tool used to promote investment in
Kenya's oil and gas sector (mean=4.0), the oil and gas companies receive capital
deductions inform of wear and tear allowances (mean=3.8), the oil and gas companies
receive capital deductions inform of investment allowances (mean=3.9), and the oil and
gas companies receive capital deductions inform of industrial deductions (mean=3.7).
This implied that the oil and gas firms receive incentives in form of capital deductions.
This is expected to enhance FDI through the oil and gas sector. The findings are
consistent with those of Lawson and Bentum-Micah (2019) who found that policies on
capital deductions are essential in promoting foreign investment.

48
4.5.2 Descriptive Statistics on Income Tax Incentives
The study sought to examine the effect of the income tax on foreign direct investment
in Kenya's oil and gas field. Using the 5-point scale: strongly disagree with (1) disagree
with (2) neutral (3) agree with (4) and strongly agree with (5), the respondents
expressed their degree of agreement with the income tax claims.
Table 4.9: Descriptive Statistics on Income Tax Incentives
Statements SD D N A SA M
Std.
dev
Introduction of income tax
plays a major part in Kenya’s
tax policy. 3.7% 13.9% 6.5% 36.1% 39.8% 3.9 1.2
The oil and gas sector receives
income tax incentive in form
of loss carry-forward. 2.8% 11.1% 4.6% 36.1% 45.4% 4.1 1.1
The withholding tax benefits
are offered by the oil and gas
industry. 4.6% 8.3% 2.8% 41.7% 42.6% 4.1 1.1
Tax credit incentives are being
offered to the oil and gas
industry. 5.6% 10.2% 4.6% 41.7% 38.0% 4.0 1.2
The permissible deductions are
obtained by the oil and gas
industry. 7.4% 9.3% 0.9% 42.6% 39.8% 4.0 1.2
Aggregate mean 4.0 1.1
Source: Research Data (2020)
The results in Table 4.9 show that most respondents agreed to claims on income tax
benefits with an aggregate mean score of 4.0 and a standard deviation of 1.1.
Participants accepted that the implementation of income tax plays a major role in
Kenya's tax policy (mean=3.9), the oil and gas sector receives income tax benefits in
the form of carry-forward losses (mean=4.1), the oil and gas sector receives
withholding tax incentives (mean=4.1), the oil and gas sector receives tax credit
incentives (mean=4.0), and the oil and gas sector receives tax incentives (mean=4.1),
This meant that benefits in the form of income tax were earned by oil and gas firms and
this could encourage FDI inflows in the oil and gas sector. Olaleye, Riro and Memba
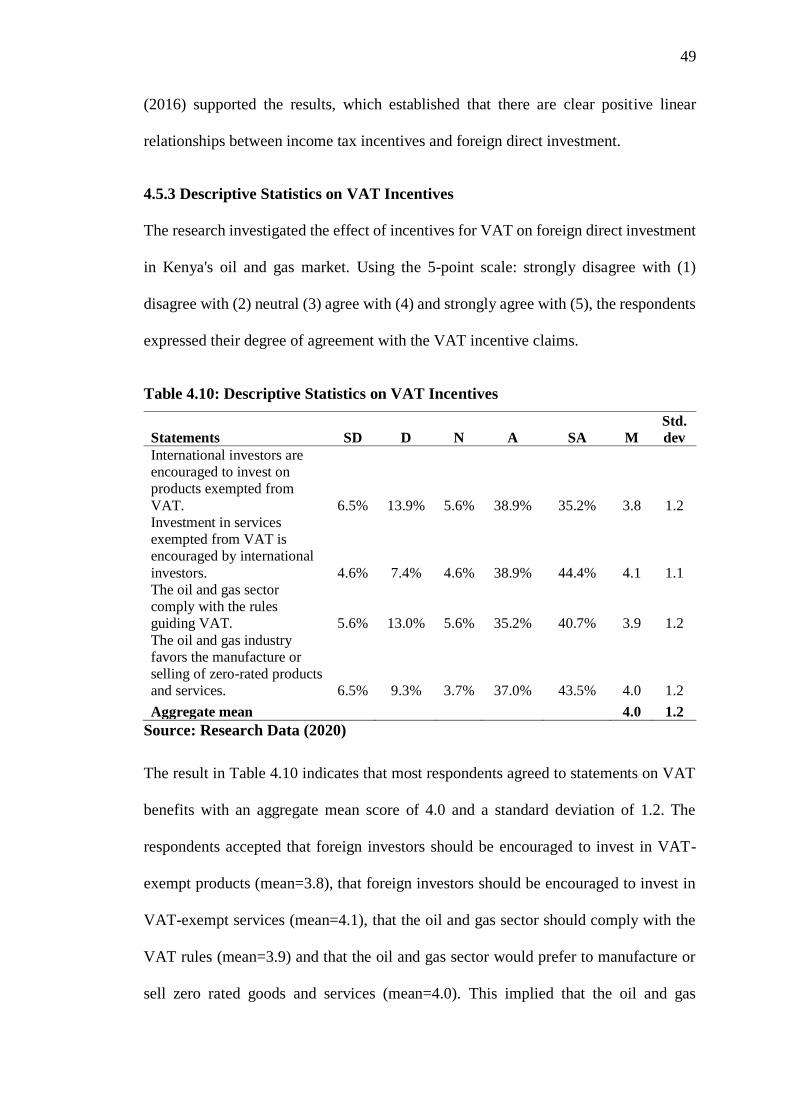
49
(2016) supported the results, which established that there are clear positive linear
relationships between income tax incentives and foreign direct investment.
4.5.3 Descriptive Statistics on VAT Incentives
The research investigated the effect of incentives for VAT on foreign direct investment
in Kenya's oil and gas market. Using the 5-point scale: strongly disagree with (1)
disagree with (2) neutral (3) agree with (4) and strongly agree with (5), the respondents
expressed their degree of agreement with the VAT incentive claims.
Table 4.10: Descriptive Statistics on VAT Incentives
Statements SD D N A SA M
Std.
dev
International investors are
encouraged to invest on
products exempted from
VAT. 6.5% 13.9% 5.6% 38.9% 35.2% 3.8 1.2
Investment in services
exempted from VAT is
encouraged by international
investors. 4.6% 7.4% 4.6% 38.9% 44.4% 4.1 1.1
The oil and gas sector
comply with the rules
guiding VAT. 5.6% 13.0% 5.6% 35.2% 40.7% 3.9 1.2
The oil and gas industry
favors the manufacture or
selling of zero-rated products
and services. 6.5% 9.3% 3.7% 37.0% 43.5% 4.0 1.2
Aggregate mean 4.0 1.2
Source: Research Data (2020)
The result in Table 4.10 indicates that most respondents agreed to statements on VAT
benefits with an aggregate mean score of 4.0 and a standard deviation of 1.2. The
respondents accepted that foreign investors should be encouraged to invest in VAT-
exempt products (mean=3.8), that foreign investors should be encouraged to invest in
VAT-exempt services (mean=4.1), that the oil and gas sector should comply with the
VAT rules (mean=3.9) and that the oil and gas sector would prefer to manufacture or
sell zero rated goods and services (mean=4.0). This implied that the oil and gas

50
companies receive VAT incentives and this is likely to increase FDI inflows through
the sector. The results were consistent with those of Owolabi and Okwu (2014), who
observed that developing countries are increasingly recognizing the crucial role of value
added tax as an instrument of economic growth.
4.5.4 Descriptive Statistics on Import Duty Incentives
The study sought to assess the effects on FDI in the oil and gas sector in Kenya of
import duty incentives. Using the 5-point scale: strongly disagree with (1) disagree with
(2) neutral (3) agree with (4) and strongly agree with (5), the respondents expressed
their degree of agreement with the import duty incentive claims. In Table 4.11, the
results are shown.
Table 4.11: Descriptive Statistics on Import Duty Incentives
Statements SD D N A SA M
Std.
dev
Oil and gas companies
receive import duty
incentives on machinery 5.6% 13.0% 4.6% 49.1% 27.8% 3.8 1.1
Oil and gas companies
receive import duty
incentives on raw materials 2.8% 9.3% 4.6% 34.3% 49.1% 4.2 1.1
Oil and gas companies
receive import duty
incentives on office
equipment 4.6% 16.7% 1.9% 41.7% 35.2% 3.9 1.2
Oil and gas companies
receive import duty
incentives in form of
customs duty 0.9% 14.8% 2.8% 33.3% 48.1% 4.1 1.1
Aggregate mean 4.0 1.1
Source: Research Data (2020)
The findings in Table 4.11 show that the majority of respondents, with an aggregate
mean score of 4.0 and a standard deviation of 1.1, agreed to claims on import duty
benefits. The participants agreed with the argument that import duty discounts on
machinery are earned by oil and gas firms (mean=3.8), oil and gas companies receive
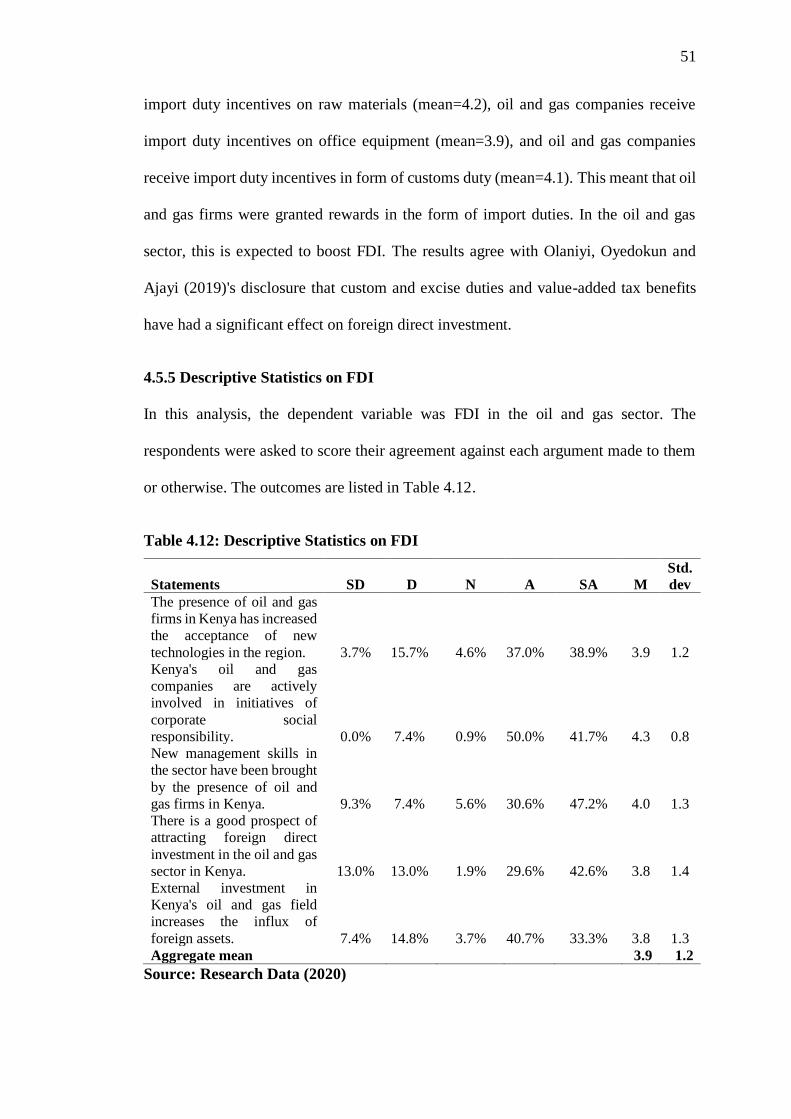
51
import duty incentives on raw materials (mean=4.2), oil and gas companies receive
import duty incentives on office equipment (mean=3.9), and oil and gas companies
receive import duty incentives in form of customs duty (mean=4.1). This meant that oil
and gas firms were granted rewards in the form of import duties. In the oil and gas
sector, this is expected to boost FDI. The results agree with Olaniyi, Oyedokun and
Ajayi (2019)'s disclosure that custom and excise duties and value-added tax benefits
have had a significant effect on foreign direct investment.
4.5.5 Descriptive Statistics on FDI
In this analysis, the dependent variable was FDI in the oil and gas sector. The
respondents were asked to score their agreement against each argument made to them
or otherwise. The outcomes are listed in Table 4.12.
Table 4.12: Descriptive Statistics on FDI
Statements SD D N A SA M
Std.
dev
The presence of oil and gas
firms in Kenya has increased
the acceptance of new
technologies in the region. 3.7% 15.7% 4.6% 37.0% 38.9% 3.9 1.2
Kenya's oil and gas
companies are actively
involved in initiatives of
corporate social
responsibility. 0.0% 7.4% 0.9% 50.0% 41.7% 4.3 0.8
New management skills in
the sector have been brought
by the presence of oil and
gas firms in Kenya. 9.3% 7.4% 5.6% 30.6% 47.2% 4.0 1.3
There is a good prospect of
attracting foreign direct
investment in the oil and gas
sector in Kenya. 13.0% 13.0% 1.9% 29.6% 42.6% 3.8 1.4
External investment in
Kenya's oil and gas field
increases the influx of
foreign assets. 7.4% 14.8% 3.7% 40.7% 33.3% 3.8 1.3
Aggregate mean 3.9 1.2
Source: Research Data (2020)

52
The results in Table 4.12 show that the majority of respondents agreed with statements
on FDI with an overall mean score of 3.9 and a standard deviation of 1.2. Participants
accepted that the involvement of oil and gas companies in Kenya has increased the
adoption of new technologies in the sector (mean=3.9), oil and gas companies operating
in Kenya are actively engaged in corporate social responsibility activities (mean=4.3),
the presence of oil and gas companies in Kenya has introduced new management skills
in the sector (mean=4.0), foreign direct investment in the oil and gas sector in Kenya is
highly likely (mean=3.8) and foreign involvement in the oil and gas sector in Kenya
increases the flow of foreign assets (mean=3.8). This implied that new technology
adoption, corporate social responsibility activities, new managerial skills and foreign
assets are key indicators of FDI inflows in the oil and gas sector. The increase in FDI
attraction in the sector can be attributed to tax incentives.
4.6 Correlation Analysis
This section presents findings on the correlation between technology acceptance
aspects and tax compliance.

53
Table 4.13: Correlation Matrix
FDI
Capital
Deductions
Income
tax
VAT
incentive
Import
Duty
FDI Pearson Correlation 1
Sig. (2-tailed) Capital
Deductions Pearson Correlation
.794*
* 1
Sig. (2-tailed) .000 Income
tax Pearson Correlation
.744*
* .745** 1
Sig. (2-tailed) .000 .000 VAT
incentive Pearson Correlation
.656*
* .488** .406** 1
Sig. (2-tailed) .000 .000 .000 Import
Duty Pearson Correlation
.717*
* .512** .444** .785** 1
Sig. (2-tailed) .000 .000 .000 .000
N 108 108 108 108 108
** Correlation is significant at the 0.01 level (2-tailed). Source: Research Data (2020)
The findings in Table 4.13 indicate that capital deductions (r =.794**, P = .000), had a
strong positive and significant correlation with FDI. This means that the rise in capital
deductions in the oil and gas sector is substantially associated with FDI. The results
also reveal that income tax incentive (r =.744**, P = .000), had a strong positive and
significant correlation with FDI. This means that there is a strong link between the rise
in income tax incentives and FDI in the oil and gas industry.
The results further shows that VAT incentive (r =.656**, P = .000), had a strong
positive and significant correlation with FDI. This means that there is a strong link
between the rise in VAT rewards and FDI in the oil and gas industry. Finally, the
findings reveal that that import duty incentive (r =.717**, P = .000), had a strong
positive and significant correlation with FDI. This means that there is a strong link
between the rise in import duty benefits and FDI in the oil and gas market.

54
4.7 Multiple Regression Analysis
The main goal of the study was to investigate the effect of tax incentives on foreign
direct investment in the oil and gas sector in Kenya. Having separately established the
existence of a significant relationship of each of the four predictors (capital deductions,
income tax, VAT incentives and import duty incentives) with FDI, It was important to
decide how the FDI was jointly affected by a combination of the four variables.
Therefore to test the relationship between variables, a multiple linear regression
analysis was carried out. Tables 4.14, 4.15 and 4.16 include, respectively, the model
description, ANOVA and coefficient results.
Table 4.14: Model Summary; Tax Incentives and FDI
Model R R Square Adjusted R Square Std. Error of the Estimate
1 .893a 0.797 0.789 0.24979
a Predictors: (Constant), Import, Income tax, capital deductions, VAT
Source: Research Data (2020)
The results in Table 4.14 show that 79 percent (adjusted R2= .789) of the total variations
in the FDI were jointly explained by all four predictor variables in this analysis. The
modified R-squared was chosen because (P=0.571>0.05) the constant value in Table
4.16 is negligible. The findings implied that the tax incentives (capital deductions,
income tax, VAT incentives and import duty incentives) contribute greatly towards FDI
inflows in the oil and gas sector.
Table 4.15: ANOVA; Tax Incentives and FDI
Model Sum of Squares df Mean Square F Sig.
1 Regression 25.274 4 6.319 101.265 .000b
Residual 6.427 103 0.062 Total 31.701 107 a Dependent Variable: FDI b Predictors: (Constant), Import, Income tax, capital deductions, VAT
Source: Research Data (2020)

55
In Table 4.15, the ANOVA regression model shows a F statistic of 101.265 and a
recorded P value of 0.000. Therefore, the proposed model is statistically relevant (good
fit) in predicting the dependent variable, as the P value is less than the alpha value (P <
.05).
Table 4.16: Coefficients; Tax Incentives and FDI
Model
Unstandardized
Coefficients
Standardized
Coefficients
B Std. Error Beta t Sig.
1 (Constant) 0.115 0.202 0.568 .571
Capital deductions 0.339 0.063 0.377 5.389 .000
Income Tax 0.296 0.069 0.286 4.279 .000
VAT incentives 0.178 0.079 0.124 2.252 .020
Import duty
Incentives 0.314 0.082 0.375 3.837 .000
a Dependent Variable: FDI Source: Research Data (2020)
There are equivalent (Likert) scales for all predictor variables, but constant value is
negligible in the model, hence the use of standardized beta coefficients. The
hypothesized model Y = β0 + β 1X1 + β 2X2 + β 3X3 + β 4X4 + e is estimated as follows:
Y = 0.377X1+0.286X2+0.124X3+0.375X4
Where:
Y = Foreign Direct Investment
X1 = Capital Deductions
X2 = Income Tax
X3 = VAT Incentives
X4 = Import duty Incentives

56
The multiple regression results in Table 4.16 reveal that capital deductions (β1= 0.377,
P = .000) is meaningful and positively related to FDI. This implied that a one unit
increase in capital deductions would increase FDI inflows by 0.377 units.
The results also indicate that income tax (β2= 0.286, P = .000) is meaningful and
positively connected to FDI. This implied that a one unit increase in income tax
incentives would increase FDI inflows by 0.286 units.
The findings further reveal that VAT incentives (β3= 0.124, P = .020) is meaningful
and positively connected to FDI. This implied that a one unit increase in VAT
incentives would increase FDI inflows by 0.124 units.
In addition, the results indicate that import duty incentives (β4= 0.375, P = .000) is
meaningful and positively connected to FDI. This implied that a one unit increase in
import duty incentives would increase FDI inflows by 0.375 units.
Furthermore, from the model, the most significant predictor of FDI is capital deductions
(β= 0.377), followed by import duty incentives (β= 0.375), followed by income tax (β=
0.286), and lastly VAT incentives (β= 0.124).
4.7.1 Hypothesis Testing
The null hypothesis (H01) that there is no major impact of capital deductions on foreign
direct investment in the oil and gas sector in Kenya was denied based on the regression
results in Table 4.16. This meant that capital deductions had a substantial impact on
FDI in Kenya's oil and gas segment.

57
The null hypothesis (H02) that the income tax may not have a major impact on foreign
direct investment in Kenya's oil and gas sector has been denied. This meant that the
income tax had a huge impact on FDI in Kenya's oil and gas segment.
Further the null hypothesis (H03) that there is no major impact of VAT incentive on
foreign direct investment in the oil and gas sector in Kenya was rejected. This meant
that VAT incentives had a huge impact on FDI in Kenya's oil and gas market.
Moreover the null hypothesis (H04) that import duty incentives have no major impact
on foreign direct investment in the oil and gas sector in Kenya has been dismissed. This
meant that import duty incentives had a huge impact on FDI in Kenya's oil and gas
market.
Table 4.17: Summary of Hypotheses Test
No Hypotheses P value Decision
H01 There is no major impact of capital deductions
on FDI in the oil and gas sector in Kenya
0.000<0.05 Rejected
H02 Income tax may not have a major impact on FDI
in Kenya's oil and gas sector
0.000<0.05 Rejected
H03 There is no major impact of VAT incentive on
FDI in the oil and gas sector in Kenya
0.020<0.05 Rejected
H04 Import duty incentives have no major impact on
FDI in the oil and gas sector in Kenya
0.000<0.05 Rejected
Source: Research data (2020)
4.8 Discussion of the key Findings
The reliability results indicated that the items measuring capital deductions, income tax,
VAT incentives, import duty and FDI were reliable. This was confirmed by Cronbach
alpha coefficients greater than 0.7. From the descriptive statistic findings, most of the

58
participants agreed with statements relating to the study variables. This was confirmed
by aggregate means of 3.8, 4.0, 4.0, 4.0 and 3.9 for capital deductions, income tax, VAT
incentives, import duty and FDI respectively.
Furthermore the results of the correlation suggested that the relationship between
capital deductions, income tax, incentives for VAT, import duty and FDI was positive
and important. This was confirmed by correlation value of 0.794, 0.744, 0.656 and
0.717. The P values <0.05 also indicated a strong relationship between tax incentive
components and FDI.
The regression findings indicated that capital deductions had a positive and significant
effect on FDI (β1= 0.377, P = .000). This implied that capital deductions contribute
significantly towards attracting foreign investment. The results are in line with those of
Lawson and Bentum-Micah (2019), who found that capital deduction policies play an
important role in attracting FDI. However, the findings disagreed with Gitonga (2017)
conclusion that investment deductions and industrial building allowances had no any
significant relationship on FDI inflows.
The results also revealed that income tax incentives had a positive and significant effect
on FDI (β2= 0.286, P = .000). This implied that income tax incentives contribute
significantly towards FDI. Olaleye, Riro and Memba (2016) supported the results,
which established that there are clear positive linear relationships between income tax
incentives and foreign direct investment. However the findings were in contrast to the
claim by Murage et al. (2019) that losses carried forward did not have a statistically
meaningful effect on FDI inflow.

59
The findings further indicated that VAT incentives had a positive and significant effect
on FDI (β3= 0.124, P = .020). This implied that VAT incentives contribute significantly
towards FDI. The findings were consistent with those of Owolabi and Okwu (2014),
who observed that developed countries are increasingly realizing the crucial role of
value added tax as an instrument of economic development. Similarly, Olaniyi,
Oyedokun and Ajayi (2019) found that there were major effects on foreign direct
investment from value-added tax incentives. In addition, Kuria (2017) found that there
was a positive and important relationship between VAT rewards and the success of EPZ
companies.
Lastly, the findings indicated that import duty incentives had a direct and meaningful
effect on FDI (β4= 0.124, P = .000). This implied that import duty incentives contribute
significantly towards FDI. Olaniyi, Oyedokun and Ajayi (2019) agreed with the
disclosure that custom and excise duties and value-added tax benefits had a significant
effect on foreign direct investment. The findings, however, contradict Bora (2013)
assertion that in attracting FDI, custom duty exemption was negligible.

60
CHAPTER FIVE
SUMMARY, CONCLUSIONS AND RECOMMENDATIONS
5.1 Introduction
The review of results, conclusions, recommendations and suggestions for further study
is provided in this chapter. This is achieved in accordance with the study objectives.
5.2 Summary
5.2.1 Capital Deductions
The study's first objective was to assess the effects of capital deductions on foreign
direct investments in Kenya's oil and gas market. The majority of respondents noted
that the oil and gas sector earns capital deductions from the descriptive statistical
results, reminding them of wear and tear allowances, expenditure allowances and
industrial deductions.
The findings of the correlation analysis showed that a substantially positive relationship
exists between capital deductions and FDI. A correlation value of .794 and a P value of
0.000 were used to endorse this. The results of the regression showed that capital
deductions had a significant and meaningful impact on FDI. This led to the rejection of
the null hypothesis in favor of the alternative that the deduction of capital had a
substantial impact on FDI in Kenya's oil and gas market. The results align with those
of Lawson and Bentum-Micah (2019), who discovered that capital deduction policies
play an important role in attracting FDI. In addition, the results were consistent with
the findings of Bernstein and Anwar (2014) that tax incentives such as investment
allowances were more successful than others in stimulating investment per dollar of
treasury income loss. Nonetheless, the findings contradicted with Gitonga (2017)
61
assertion that investment deductions and industrial building allowances had no any
significant relationship on FDI inflows.
5.2.2 Income Tax
The second objective of the analysis was to assess the effects of the income tax on
foreign direct investment in Kenya's oil and gas field. From the descriptive statistics
results, majority of the respondents observed that the oil and gas sector receive income
tax incentives inform of loss carry-forward, withholding tax incentives, tax credit
incentives and allowable deductions.
The findings of the correlation analysis showed that a substantially positive relationship
exists between income tax and FDI. This was accompanied by a .744 correlation value
and a 0.000 P value. The results of the regression showed that income tax had a positive
and meaningful impact on FDI. This led to the rejection of the null hypothesis in favor
of the alternative that the income tax had a substantial impact on FDI in Kenya's oil and
gas market. The results were corroborated by those of Olaleye, Riro and Memba (2016),
who found that income tax incentives and foreign direct investment have good positive
linear relationships. On the other hand, the findings disagreed with the postulation of
Murage et al. (2019) that losses carried forward did not have a statistically important
effect on the inflow of FDI. The results also contradicted the assertion by Munongo and
Ribinson (2018) that losses carried forward are negligible FDI determinants.
5.2.3 VAT Incentives
The third goal of the study was to examine the impact of VAT incentives on foreign
direct investment in the oil and gas sector in Kenya. Most of the respondents decided
from the results of the descriptive statistics that foreign investors would be encouraged

62
to invest in goods and services excluded from VAT, that the oil and gas sector would
comply with VAT regulations, and that the oil and gas sector would prefer to
manufacture or sell zero rated goods and services.
The findings of the correlation analysis showed that the relationship between VAT
rewards and FDI is substantially positive. A correlation value of .656 and a P value of
0.000 were used to endorse this. The results of the regression showed that rewards for
VAT had a positive and meaningful impact on FDI. This led to the rejection of the null
hypothesis in favor of the alternative that the incentives for VAT had a substantial
impact on FDI in Kenya's oil and gas market. The findings were consistent with
Owolabi and Okwu (2014)'s assertions that the crucial role of value added tax as an
instrument of economic growth is increasingly recognized among developing countries.
Similarly, Olaniyi, Oyedokun and Ajayi (2019) found that there were major effects on
foreign direct investment from value-added tax incentives. In addition, Kuria (2017)
found that there was a positive and important relationship between VAT rewards and
the success of EPZ companies.
5.2.4 Import Duty Incentives
The study's fourth objective was to assess the impact of import duty incentives on
foreign direct investment in Kenya's oil and gas market. Most of the respondents
accepted, from the descriptive statistical findings, that oil and gas firms earn discounts
for import duties on machinery, raw materials, office equipment and customs duties.
The correlation study's results showed that there is a significantly positive relationship
between import duty incentives and FDI. This was accompanied by a .717 correlation
value and a P value of 0.000. The results of the regression showed that there was a

63
positive and important effect of import duty incentives on FDI. This resulted in the
rejection of the null hypothesis in favor of the alternative that import duty incentives
had a significant effect on foreign direct investment in the oil and gas market of Kenya.
The results were close to those of Olaniyi, Oyedokun and Ajayi (2019), who found that
tax benefits for customs and excise duties had a big impact on foreign direct investment.
Nonetheless, the findings contradicted Bora (2013) observation that custom duty
exemption was insignificant in attracting FDI.
5.3 Conclusions
From objective one results, the study concluded that capital deductions have a
statistically significant and direct connection with FDI. Furthermore, when combined
with other variables, capital deductions had a significant predictive ability to determine
inflows of FDI. The wear and tear allowances, investment allowances and industrial
deductions were identified as key aspects of capital deductions that determine FDI in
the oil and gas sector.
Based on the findings of objective two, the study concluded that income tax incentives
have a statistically significant and direct connection with FDI. Furthermore, when
combined with other variables, income tax incentives had a significant predictive ability
to determine inflows of FDI. The loss carry-forward, withholding tax incentives, tax
credit incentives and allowable deductions were found to be key aspects of income tax
incentives that determine FDI in the oil and gas sector.
In line with the findings of objective three, the research concluded that VAT incentives
have a statistically significant and direct connection with FDI. Furthermore, when
combined with other variables, VAT incentives had a significant predictive ability to

64
determine FDI in the oil and gas sector in Kenya. The exemption of goods and services
from VAT and zero rated goods and services were identified as critical aspects of VAT
incentives that promote FDI in the oil and gas sector.
From the findings of objective four, the study concluded that import duty incentives
have a statistically significant and direct connection with FDI. Moreover, when
combined with other variables, import duty incentives had a significant predictive
ability to determine inflows of FDI. The import duty incentives on machinery, raw
materials, office equipment and customs duty were found to be essential in attracting
foreign investment.
Generally, the government through the Ministry of Petroleum and Mining ,The National
Treasury and The Kenya Revenue Authority should review the fiscal policy governing
the Oil and Gas operations in Kenya , this is necessary so as to ensure that the fiscal
regime is favourable to the country and to the investors.
5.4 Recommendations
In view of the foregoing conclusions, the study made several recommendations as
presented below.
5.4.1 Recommendations to Theory
The study established a significant relationship between tax incentives and foreign
direct investments. The study, therefore, makes significant contribution to theory in
terms of predicting the effect of tax incentives and foreign direct investments.
5.4.2 Recommendations to Policy and Practice
The analysis established that capital deductions have a significant positive effect on
foreign direct investment in the oil and gas sector. The study recommends the need for

65
the government to improve the capital deductions given to investors. In particular, the
government should strengthen the following aspects: wear and tear allowances,
investment allowances and industrial deductions
The study also found that income tax incentives have a significant positive effect on
FDI in the oil and gas sector. The study recommends the need for the government to
improve the income tax incentives given to investors in the oil and gas sector. In
particular, the government should strengthen the following aspects: loss carry-forward,
withholding tax incentives, tax credit incentives and allowable deductions.
The study further established that VAT incentives have a significant positive effect on
FDI in the oil and gas sector. The study recommends the need for the government to
streamline policy relating to VAT incentives. In particular, the government should
strengthen the following aspects: exemption of goods and services from VAT and zero
rated goods and services.
In addition, the study found that import duty incentives have a significant positive effect
on FDI in the oil and gas sector. The study recommends the need for the government to
improve import duty incentives given to investors. In particular, the government should
strengthen the following aspects: import duty incentives on machinery, raw materials,
office equipment and customs duty.
5.4.3 Suggestions for Further Studies
The study analyzed the effects of tax incentives on foreign direct investment in Kenya's
oil and gas field. A similar analysis may be done for comparative purposes in other
fields. This will clarify the nature of the analysis and allow the results to be generalized.
The study focused on four components (capital deductions, income tax, VAT incentives

66
and import duty incentives), which accounted for 79 percent of variations in the
dependent variable. Future studies could consider other aspects that can be attributed to
the remaining 21 percent.

67
REFERENCES
Abubakar, Z., Haruna, M. A., & Ahmed, B.A. (2012). The role of Nigerian investment
promotion commission (NIPC) in attracting foreign direct investment.
European Scientific Journal, 8(7), 149 – 161.
Adam, A. M. & Tweneboah, G. (2009). Foreign Direct Investment and Stock Market
Development: Ghana’s Evidence, International Research Journal of Finance
and Economics, 26(2), 44-69.
Ajemije, T. C. (2020). Influence of technology on entrepreneurial innovative ability
and sustainability in Nigeria.
Babatunde, O., & Adepeju, S. (2012). The effect of tax incentives on foreign direct
investment in the oil and gas sector in Africa. IOSR Journal of Business and
Management 6(1),01-15.
Bahizi, C. (2016). The impact of tax laws and tax incentives on foreign direct
investment in Rwanda (2010 – 2015).
Bailey. P, Farmer D. Jessop, (2008). Business principles and management, 3rd edition,
Pitman, London, UK.
Barthel, F., Busse, M., Krever, R., & Neumayer, E. (2010). The Relationship between
Double Taxation Treaties and Foreign Direct Investment. In Lang, M. et al.
(Eds.), Tax Treaties: Building Bridges between Law and Economics (pp. 3-18).
Amsterdam: IBFD.
Barua, J. J. (2010). Challenges facing supply chain management in the oil marketing
companies in Kenya. Unpublished MBA thesis, University of Nairobi.
Basu, A., & Srinivasan, K. (2012). Foreign Direct Investment in Africa--Some Case
Studies. International Monetary Fund (IMF) Working Paper No. WP/02/61,
Washington, DC.
Bernstein, J. & Anwar, S. (2014). Taxes, incentives and production: The case of
Pakistan. International Tax and Public Finance, 1,227–245.
Binyamin, G., Friedman, A., & Carmeli, A. (2018). Reciprocal care in hierarchical
exchange: Implications for psychological safety and innovative behaviors at
work. Psychology of Aesthetics, Creativity, and the Arts, 12(1), 79.
Bloningen, B.A., & Davies, R.B. (2013). Do bilateral tax treaties promote foreign
direct investment? In Hartigan, J. (Eds.), Handbook of International Trade (pp.
526-546). Boston, MA: Blackwell Publishers.
Bonnafous-Boucher, M., & Rendtorff, J. D. (2016). Stakeholder Theory in Strategic
Management. In Stakeholder Theory (pp. 21-39). Springer, Cham.
Bora, S. (2013). The effectiveness of tax incentives in attracting Foreign Direct
Investment to Ethiopia. The Hague, The Netherlands Vienna.

68
CITA (2014). Tax companion in Nigeria. Lagos: Federal Inland Revenue Service
Cooper, D.R and Schindler, P.S (2010). Business Research Methods, Tata McGraw-
Hill, 8th Edition, New Delhi, India
Cox, T. Jr., (2009). The importance of research in determining foreign direct
investments, International Journal of Taxation Reviews, Vol. 2 No.4
Cronbach, L. J. (1951). Coefficient alpha and the internal structure of
tests. psychometrika, 16(3), 297-334.
Desai, M. A., Foley, C.F., & Hines. Jr, J. R. (2014). Foreign direct investment in a
world of multiple taxes, Journal of Public Economics, 88(12), 2727–2744.
Edmiston, K.D., Mudd, S., & Talev, N.T. (2013). Incentives targeting, influence
peddling and foreign direct investment
Egger, P., Larch, M., Pfaffermayr, M., & Winner, H. (2016). The impact of endogenous
tax treaties on foreign direct investment: theory and evidence. The Canadian
Journal of Economics, 39(3), 901-931.
Ernest & Young (Ey). (2014). Africa by numbers: A focus on Kenya: Special report
issued for World Economic Forum on Africa. Nairobi: Africa Project Access,
Business Monitor International: EY analysis.
Fakile, A.S., & Adegbile, F.F. (2011). Tax incentives: Tool for attracting foreign n
direct investment in Kenyan economy. International Journal of Research in
Commerce and Management,.2(2), 87.
Feldstein, M. (ed.) (2012). The effects of taxation on capital accumulation. Chicago:
University of Chicago Press. 160
Field, A. (2009). Discovering statistics using SPSS. Sage publications
Fisher, C. (2009). Researching and Writing a Dissertation: A Guidebook for Business
Students. Essex, England: Pearson Education Limited
Freeman, R. E., Harrison, J. S., & Zyglidopoulos, S. (2018). Stakeholder Theory by R.
Edward Freeman.
Friedman, M. (2006). An interview with. Inside the Economist's Mind: Conversations
with Eminent Economists, 110.
Gitonga, F. K. (2017). The relationship between tax incentives and foreign direct
investment inflows of listed multinational corporations in kenya.
Gross, R. (2015). Measuring organizational performance: A new approach to triple
bottom line reporting and stakeholder engagement. British Journal of Business
and Management Research, 2(1), 69-80.

69
Gumo, O. M. (2013). The effect of tax incentives on foreign direct investments in
kenya. An unpublished MBA project, university of Nairobi.
Hartman, D. G. (2014). Tax policy and foreign direct investment in the United States,
National Tax Journal, 37, 475-488.
Homans, G. C. (1958). Social behavior as exchange. American journal of
sociology, 63(6), 597-606.
Hsu, M., Lee, J., Leon-Gonzalez, R., & Zhao, A. Y. (2019). Tax incentives and foreign
direct investment in China. Applied Economics Letters, 26(9), 777-780.
Hubbard, G. (2009). Measuring organizational performance: beyond the triple bottom
line. Business strategy and the environment, 18(3), 177-191.
Irokwe, U. I., & Nnaji, P. O. (2017). Tax incentives and Microfinance Business in
Nigeria: A study of selected Microfinance Banks in Rivers State. IOSR Journal
of Economics and Finance, 8(2).
Jirasavetakul, L. B. F., & Rahman, J. (2018). Foreign Direct Investment in New
Member State of the EU and Western Balkans: Taking Stock and Assessing
Prospects. International Monetary Fund.
Karthik, R. & Kannan, N. (2011). Impact of foreign direct investment on stock market
development: A study with reference to India. International Journal of
Management (IJM), 2(2), 75-92.
Keen, M. (2012). The German tax reform of 2010. International Tax and Public
Finance, 9(5), 603–621.
Kinuthia, B.K. (2010). Determinants of Foreign Direct Investment in Kenya; New
Evidence. Paper submitted for the annual African International Business and
Management (AIBUMA) Conference in Nairobi in August 2010
Kirk and Miller (2009). Principals of Management, 3rd edition, London Publishers,
London, UK
Kuria, J. (2017). Effects of corporate income and value added tax incentives on the
performance of export processing zone (EPZ) firms in Kenya.
Lawana, N. (2016). The impact of foreign direct investment on labour productivity of
the automotive sector in South Africa (Doctoral dissertation, University of Fort
Hare).
Lawson, J., Du, K., & Bentum-Micah, G. (2019). The Impact of Macroeconomic
Variables, Investment Incentives and Government Agreements on FDI Inflows
in Ghana. Journal of Economics and Business, 2(3).
Liaquat, M., & Mehmood, K. (2017). Organization Citizenship Behavior: Notion of
Social Exchange Theory. Journal of Business and Social Review in Emerging
Economies, 3(2), 209-216.
70
Lodhi, K. M. (2017). Tax incentives and impact on investment in Pakistan. Abasyn
University Journal of Social Sciences, 10(1), 192-211.
Loyford, M. M., & Moronge, M. (2014). Effects of economic factors on performance
of FDI in Kenya. European Journal of Business Management, 1(11), 181-200.
Maiga, O. A., Oumarou, I., & Coulibaly, S. K. (2019). Foreign Direct Investment and
International Trade in WAEMU-Panel Causality and Long-term Relationship
Analysis. Review of Economics, 70(2), 193-212.
Mandinga, C. A. V. C. (2015). The effect of corporate income tax rate on foreign direct
investment in small island developing states.
Morisset, J. (2013). Using tax incentives to attract foreign direct investment. The World
Bank Group, Private Sector and Infrastructure Network, View Point, Note
No.25x.
Morisset, J., & Pirna, N. (2011). How Tax Policy and Incentives Affect Foreign Direct
Investment: A. Review. Working Paper No. 2509, The World Bank.
Muema, J. (2013). An Analysis of the Determinants of Foreign Direct Investment in
Kenya. Unpublished MBA project, University of Nairobi
Mugenda, O. M., & Mugenda, A. G. (2012). Research Methods: Quantitative and
Qualitative. Nairobi, Kenya: Acts Press.
Munongo, S., & Ribinson, Z. (2018). Do tax incentives attract foreign direct
investment? The case of the Southern African Development Community. The
Journal of Accounting and Management, 7(3).
Munongo, S., Akanbi, O. A., & Robinson, Z. (2017). Do tax incentives matter for
investment? A literature review. Business and Economic Horizons
(BEH), 13(1232-2017-2411), 152-168.
Murage, D., Mwangi, M., Kaijage, E., & Ochieng, D. E. (2019). Tax incentives and
foreign direct investment relationship in the east Africa community partner
states. DBA Africa Management Review, 9(3).
Mutisya, A.N. (2019). Effect of tax incentives on foreign direct investment In Kenya.
International Journal of Business Management & Finance 3(2): 51-64,
Mwega, F.M., and R.W. Ngugi. (2013). Foreign direct investment in Kenya in Ajayi,
S.I. (eds) Foreign direct investment in Sub-Saharan Africa: Origins, targets,
impact and potential, African Economic Research Consortium, Nairobi.
Narayan, P. (2015). The Macroeconomic impact of the IMF recommended VAT policy
for the Fiji economic: Evidence from a GCE model. In review of Urban &
Regional Development Studies 15, 226-237). Tokyo: Blackwell Publishing Ltd.

71
Nazir, S., Qun, W., Hui, L., & Shafi, A. (2018). Influence of social exchange
relationships on affective commitment and innovative behavior: Role of
perceived organizational support. Sustainability, 10(12), 4418.
Ngure, P. M. (2018). Tax Incentives And Performance Of Selected Manufacturing
Firms In Kenya (Doctoral Dissertation, Kenyatta University).
Njuguna, W. K. (2016). The relationship between exchange rates and foreign direct
investment in Kenya. Unpublished MSC Project, University of Nairobi
Nwafor, M. (2010). Agricultural investment for growth and poverty reduction in
Nigeria. International Food Policy Research Institute (IFPRI), nssppb13 (1)
Obida, G. W., & Nurudeen, A. (2010). Determinants of foreign direct investment in
Kenya: An Empirical Analysis, Global Journal of Human Social Science, 10(1),
26 – 34.
OECD. (2013). OECD Benchmark Definition of Foreign Direct Investment: Fourth
Edition 2008. Paris: OECD.OECD. (2010) OECD Factbook. Paris.
Ofori, P. (2019). Tax incentives for attracting foreign direct investment in sub-Saharan
Africa: A comparative study of Ghana and Kenya.
Olaleye, M. O., Riro, G. K., & Memba, F. S. (2016). Effect of reduced company income
tax incentives on foreign direct investment in listed Nigerian manufacturing
companies.
Olaniyi, T. A., Oyedokun, G. E., & Ajayi, R. O. (2019). Tax policy incentives on
foreign direct investment in Nigeria. Fountain University Osogbo Journal of
Management, 3(3).
Omesa, A. N. (2015). The effect of process innovation on financial performance in
utility companies in Kenya: a case study of the Kenya power and lighting
company (Doctoral dissertation, University of Nairobi).
Onyeiwu, S., & Shrestha, H. (2015). Tax incentives and foreign direct investment in
the MENA Region, Paper for presentation at the 12TH Annual Conference of
the Economic Research Forum.
Owolabi, S.A. & Okwu, A.T (2014) Empirical evaluation of contribution of value
added tax to development of Lagos State Economy. Euro Journals Publishing,
Inc, Paper 97/137/139, International Monetary Fund, Washington. D.C.
Prichard, W. (2016). Reassessing tax and development research: A new dataset, new
findings, and lessons for research. World Development, 80, 48-60.
Rahi, S. (2017). Research design and methods: A systematic review of research
paradigms, sampling issues and instruments development. International
Journal of Economics & Management Sciences, 6(2), 1-5.

72
Riff, D., Lacy, S., & Fico, F. (2014). Analyzing media messages: Using quantitative
content analysis in research
Roch, S. G., Shannon, C. E., Martin, J. J., Swiderski, D., Agosta, J. P., & Shanock, L.
R. (2019). Role of employee felt obligation and endorsement of the just world
hypothesis: A social exchange theory investigation in an organizational justice
context. Journal of Applied Social Psychology, 49(4), 213-225.
Rogers, E. M. (1995). Diffusion of Innovations: modifications of a model for
telecommunications. In Die diffusion von innovationen in der
telekommunikation (pp. 25-38). Springer, Berlin, Heidelberg.
Selma, K. (2013). The effects of foreign direct Investments for host country’s economy.
European journal of interdisciplinary studies, 5(1).
Shah, M. H., & Ali, Z. (2016). What Drives Foreign Direct Investment to
BRICS?. Shah, MH, & Ali, (2016), 51-66.
Shahbaz, M., Lean, H. H. & Kalim, R. (2013). The impact of foreign direct investment
on stock market development: Evidence from Pakistan. Ekonomskaistraživanja-
Economic Research, 26(1), 17-32.
Ślusarczyk, B. (2018). Tax incentives as a main factor to attract foreign direct
investments in Poland. Revista» Administratie si Management Public
«(RAMP), (30), 67-81.
Sunny, S. A., & Shu, C. (2019). Investments, incentives, and innovation: geographical
clustering dynamics as drivers of sustainable entrepreneurship. Small Business
Economics, 52(4), 905-927.
Tamene, E. H. (2016). Theorizing conceptual framework. Asian Journal of Educational
Research Vol, 4(2).
Tapang, A. T. (2018). Effect of Tax Incentives on Foreign Direct Investment in the
Petroleum Industry in Nigeria. International Journal of Economics and
Business Management, 4(7), 30-39.
Thuita, G. W. (2017). An investigation of the effect of tax incentives on the FDIs: a
case of EPZs in Athi River Kenya.
Trela, I. & Whailey, J. (2011). Taxes outward orientation and growth performance in
the Republic of Korea, in Khalilzadeh-Shirazi, J. and Shah, A., (eds.) Tax policy
in developing countries. Washington: The World Bank.
Twesige, D., & Gasheja, F. (2019). Effect of tax incentives on the growth of small and
medium-sized enterprises (SMEs) in Rwanda: A case study of SMEs in
Nyarugenge district. Journal of Accounting and Taxation, 11(5), 89-98.
Ugwu, J. I. (2018). Tax incentives and foreign direct investment (FDI): Implication for
export promotion innigeria, Ghana and South Africa, Post IFRS
Adoption. International Journal in Management & Social Science, 6(9), 31-52.

73
Uma, S. (2009), Research Methods for Business: A Skill Building Approach. 4th edition,
Wiley India, New Delhi
UNCTAD (2012). World Investment Report, 2012: Towards A New Generation of
Investment Policies. New York and Geneva: United Nations Conference on
Trade and Development.
UNCTAD (2018). Global Investment Trends Monitor Report. Retrieved from
https://kenyanwallstreet.com/kenyas-fdi-reduce-by-57-the-lowest-level-in-
years-unctad/
UNCTAD, (2010). Global Investment Trends Monitor, United Nations, New York and
Geneva: United Nations Conference on Trade and Development Publications.
UNCTAD. (2016). World investment report 2016 – FDI from developing and
transitioning economies: Implications for development. New York and Geneva:
United Nations Publications.
Voorpijl, R. (2011). Foreign direct investment in Kenya: The gains and losses of
foreign involvement. Radbound University Nijmegen. MSC Project. Nijmegen
Young, K. H., (2013). The effects of taxes and rates of return on foreign direct
investment in the United States, National Tax Journal, 41, 109-121.

74
APPENDICES
Appendix I: Introduction Letter
Dear (Respondent)
RE: VOLUNTARY PARTICIPATION IN DATA COLLECTION
I am a student pursuing a Masters’ degree in tax and customs at Moi University and
currently undertaking a research project on “Effect of tax incentives on foreign direct
investment in the oil and gas sector in Kenya”
You have been selected for this study to fill the questionnaire. Kindly respond to the
questions in the attached questionnaire. The information provided will exclusively and
solely be used for academic purposes and will be treated with utmost confidentiality.
Upon request, you will be furnished with a copy of the final report.
Your cooperation will be highly appreciated.
Yours Faithfully,
MARTHA WANGUI KANYANJUA

75
Appendix II: Questionnaire
This research questionnaire seeks to establish the effect of tax incentives on foreign
direct investment in the oil and gas sector in Kenya. The study is strictly for academic
purpose.
(Tick and fill were appropriate)
SECTION A: CAPITAL DEDUCTIONS
1. Kindly indicate how you rate the following statements relating to capital
deductions. Use a scale of 1-5 where; 1 = strongly disagree, 2= disagree, 3 = neutral,
4 = agree, 5 = strongly agree.
CAPITAL DEDUCTIONS 1 2 3 4 5
Capital allowance is a method used to encourage investment in
the oil and gas sector in Kenya.
The oil and gas companies receive capital deductions inform of
wear and tear allowances
The oil and gas companies receive capital deductions inform of
investment allowances
The oil and gas companies receive capital deductions inform of
industrial deductions

76
SECTION B: INCOME TAX
2. What is your level of agreement with the following statements that relate to income
tax? Use a scale of 1-5 where; 1 = strongly disagree, 2= disagree, 3 = neutral, 4 =
agree, 5 = strongly agree.
INCOME TAX 1 2 3 4 5
Introduction of income tax plays a major part in Kenya’s tax
policy.
The oil and gas sector receives income tax incentive in form
of loss carry-forward.
The oil and gas sector receives the withholding tax
incentives.
The oil and gas sector receives the tax credit incentives.
The oil and gas sector receives the allowable deductions.
SECTION C: VAT INCENTIVES
3. To what extent do you agree with the following statements that relate to VAT
incentives in your organization? Use a Use a scale of 1-5 where; 1 = strongly
disagree, 2= disagree, 3 = neutral, 4 = agree, 5 = strongly agree.
VAT INCENTIVES 1 2 3 4 5
Foreign investors are encouraged to invest on goods exempted
from VAT.
Foreign investors are encouraged to invest on services exempted
from VAT.
The oil and gas sector comply with the rules guiding VAT.

77
The oil and gas sector prefer to produce or sell zero rated goods
and services.
SECTION D: IMPORT DUTY INCENTIVES
4. To what extent do you agree with the following statements that relate to import duty
incentives in your organization? Use a scale of 1-5 where; 1 = strongly disagree, 2=
disagree, 3 = neutral, 4 = agree, 5 = strongly agree.
IMPORT DUTY INCENTIVES 1 2 3 4 5
Oil and gas companies receive import duty
incentives on machinery
Oil and gas companies receive import duty
incentives on raw materials
Oil and gas companies receive import duty
incentives on office equipment
Oil and gas companies receive import duty
incentives in form of customs duty

78
SECTION E: FOREIGN DIRECT INVESTMENT
5. Kindly indicate how you rate achievement of the following facets of foreign direct
investment? Use a scale of 1-5 where; 1 = strongly disagree, 2= disagree, 3 =
neutral, 4 = agree, 5 = strongly agree.
FOREIGN DIRECT INVESTMENT 1 2 3 4 5
The presence of oil and gas companies in Kenya has
enhanced new technology adoption in the sector.
Oil and gas companies operating in Kenya are
actively involved in corporate social responsibility
activities.
The presence of oil and gas companies in Kenya has
introduced new managerial skills in the sector
There is high prospect in the attraction of foreign
direct investment into the oil and gas sector in
Kenya.
Foreign participation in the oil and gas sector in
Kenya increases the flow of foreign assets.
THANKS FOR YOUR COOPERATION

79
Appendix III: Map of Oil Blocks and Selected list of Active Oil and Gas Companies
in Kenya
Source: Ministry of Petroleum and Mining (2020)
No. Companies Block
1 Tullow Oil Block 10BAA,10BB,12A,13T,12B
2 Zarara Blocks L4, L13
3 ENI Blocks L21, L23, L24
4 Total Block L22
5 Africa Oil Block 9

80
Appendix IV: Authorization Letter from KESRA

81
Appendix V: NACOSTI Research Permit
Related Documents