EFFECT OF SUBSURFACE CONDITIONS ON FLEXIBLE PAVEMENT BEHAVIOR: NON-DESTRUCTIVE TESTING AND MECHANISTIC ANALYSIS by Md. Fazle Rabbi A thesis submitted in partial fulfilment of the requirements for the degree of Master of Science in Civil Engineering Boise State University December 2018

Welcome message from author
This document is posted to help you gain knowledge. Please leave a comment to let me know what you think about it! Share it to your friends and learn new things together.
Transcript

EFFECT OF SUBSURFACE CONDITIONS ON FLEXIBLE PAVEMENT
BEHAVIOR: NON-DESTRUCTIVE TESTING AND MECHANISTIC ANALYSIS
by
Md. Fazle Rabbi
A thesis
submitted in partial fulfilment
of the requirements for the degree of
Master of Science in Civil Engineering
Boise State University
December 2018

© 2018
Md. Fazle Rabbi
ALL RIGHTS RESERVED
BOISE STATE UNIVERSITY GRADUATE COLLEGE
DEFENSE COMMITTEE AND FINAL READING APPROVALS
of the thesis submitted by
Md. Fazle Rabbi
Thesis Title: Effect of Subsurface Conditions on Flexible Pavement Behavior: Non-
Destructive Testing and Mechanistic Analysis
Date of Final Oral Examination: 8 November 2018
The following individuals read and discussed the thesis submitted by student Md. Fazle
Rabbi, and they evaluated his presentation and response to questions during the final oral
examination. They found that the student passed the final oral examination.
Debakanta Mishra, Ph.D. Chair, Supervisory Committee
Bhaskar Chittoori, Ph.D. Member, Supervisory Committee
Mandar Khanal, Ph.D. Member, Supervisory Committee
The final reading approval of the thesis was granted by Debakanta Mishra, Ph.D., Chair
of the Supervisory Committee. The thesis was approved by the Graduate College.

iv
DEDICATION
Dedicated to all scholars pursuing knowledge advancement for the human race.

v
ACKNOWLEDGEMENTS
I would like to express my sincere gratitude to my advisor, Dr. Debakanta Mishra,
who always encouraged me to do innovative research. His welcoming nature, kind
appreciation, timely feedback, and unparalleled guidance motivated and made me the
confident researcher I had always aspired to be. I could not have imagined having a better
advisor and mentor for my Master’s thesis.
I express my appreciation to Dr. Bhaskar Chittoori and Dr. Mandar Khanal for
serving on my supervisory committee. I would also like to acknowledge the support and
help of all of my professors at Boise State University. My thesis would not have been
possible without their valuable knowledge sharing both inside and outside the class. I am
grateful to my professors Dr. Arvin Farid and Dr. Clare Fitzpatrick for mentoring me with
the concepts and fundamentals of Finite Element Methods.
I extend my sincere thanks to all the members of Idaho Transportation Department
(ITD) and URETEK, USA. I feel honored to have worked with Mr. Mike Santi (Materials
Engineer, ITD), Mr. Dan Harelson (Project Manager of District-5), and Mr. John
Arambarri (Materials Engineer, ITD District 3) during the course of my thesis. I also want
to thank all the members of “Mishra Research Group” for helping me overcome my
language difficulties and in developing a solid understanding of different aspects of this
thesis. I owe my deepest gratitude to Kody Johnson, Beema Dahal, Kazi Moinul Islam,
Aidin Golrokh, S M Naziur Mahmud, Mir Md Tamim, Amit Gajurel, Md Touhidul Islam,

vi
Thomas Robbins, Mariah Fowler, Aminul Islam, Md Jibon, Shahjalal Chowdhury and all
the graduate students of the Civil Engineering Department at Boise State.
Finally, I would like to say that all these amazing people gave me sweet memories
that I will cherish for the rest of my life.

vii
ABSTRACT
The behavior of flexible pavements under traffic and environmental loading can be
significantly affected by subsurface conditions. Inadequate support conditions under the
surface can lead to excessive pavement deformations, often leading to structural and
functional failure. This research effort focused on assessing the effects of base/subbase and
subgrade layer conditions on flexible pavement behavior. The results of this study are
presented in the form of two journal manuscripts.
The first manuscript focuses on utilizing pavement structural and functional
evaluation data in making pavement rehabilitation decisions. Visual distress surveys and
Falling Weight Deflectometer (FWD) testing are often carried out by agencies as a part of
their pavement preservation programs. Although back-calculation of individual layer
moduli from FWD data is a common approach to assess the pavement’s structural
condition, the accuracy of this approach is largely dependent on exact estimates of
individual layer thicknesses. Considering the lack of pavement layer thickness information
for all locations, this study used Deflection Basin Parameters (DBPs) calculated from FWD
test data to make inferences regarding the structural condition of individual pavement
layers in conventional flexible pavements. The adequacy of DBPs to assess the structural
condition of individual pavement layers was assessed through Finite-Element (FE)
Modeling. Subsequently, four selected pavement sections in the state of Idaho were
analyzed based on this method to recommend suitable rehabilitation strategies.

viii
The second manuscript focused on studying how improvements to subsurface
layers can affect the flexible pavement behavior over expansive soil deposits. A recently
completed research study at Boise State University investigated a particular section of US-
95 near the Idaho-Oregon border that has experienced significant differential heave due to
expansive soils. Laboratory characterization of soil samples indicated the presence of
highly expansive soils up to depths of 7.6 m (26 ft.) from the pavement surface. Through
subsequent numerical modeling efforts, a hybrid geosynthetic system comprising geocells
and geogrids was recommended for implementation during pavement reconstruction. This
research effort focused on evaluating the suitability of polyurethane grout injection as a
potential remedial measure for this pavement section. Laboratory testing of unbound
materials treated with a High-Density Polyurethane (HDP) demonstrated that resilient
modulus and shear strength properties could be improved significantly. Finite Element
modeling of the problematic US-95 pavement section indicated that depending on the
treated layer thickness, the differential heave magnitude can be reduced significantly,
presenting polyurethane injection as a potential nondestructive remedial measure.
ix
TABLE OF CONTENTS
DEDICATION ............................................................................................................... iv
ACKNOWLEDGEMENTS ............................................................................................. v
ABSTRACT ..................................................................................................................vii
LIST OF TABLES ...................................................................................................... xiii
LIST OF FIGURES ...................................................................................................... xiv
CHAPTER 1: INTRODUCTION AND BACKGROUND ............................................... 1
Problem Statement ............................................................................................... 1
Background .......................................................................................................... 3
Manuscript - 1 .......................................................................................... 3
Manuscript - 2 .......................................................................................... 4
Research Objectives, Tasks, and Manuscripts Prepared ........................................ 6
Organization of the Thesis ................................................................................... 7
References: .......................................................................................................... 7
MANUSCRIPT ONE – USING FWD DEFLECTION BASIN PARAMETERS FOR
NETWORK-LEVEL PAVEMENT CONDITION ASSESSMENTS ............................... 9
Abstract ............................................................................................................... 9
Introduction ....................................................................................................... 10
Objectives and Scope ......................................................................................... 12
FWD Testing as a Part of Routine Pavement Condition Evaluation .................... 13
Commonly Used DBPs ...................................................................................... 14

x
Finite Element Modeling of FWD Testing on Flexible Pavements...................... 16
Model Generation and Optimization................................................................... 18
Geometry ........................................................................................................... 18
Mesh .................................................................................................................. 19
Material Elastic Modulus Range Selection ......................................................... 21
Verification of DBP Range Threshold Values .................................................... 23
Using DBPs for Network-Level Pavement Assessment: Case Study ................... 28
Background on Selected Pavement Sections ....................................................... 29
Pavement Condition from Visual Distress Survey .............................................. 31
Pavement Structural Condition Assessment using DBPs .................................... 33
Inferences Concerning the Entire Pavement Structure using DBPs ..................... 33
Deflection under the Load Plate (W0 or D0) ............................................ 33
Inferences Concerning the Upper Pavement Layers ............................................ 35
Surface Curvature Index (SCI)................................................................ 35
Base Layer Index (BLI) .......................................................................... 36
Inferences Concerning Intermediate Pavement Layers........................................ 37
Middle Layer Index (MLI)...................................................................... 37
Inferences Concerning Lower Pavement Layers ................................................. 38
Base Curvature Index (BCI) ................................................................... 38
Lower Layer Index ................................................................................. 39
Deflection under the 7th Sensor (W60 or D60) ........................................ 40
Implementation as a Network-Level Pavement Rehabilitation Selection
Approach ........................................................................................................... 41
Summary and Conclusions ................................................................................. 43

xi
References ......................................................................................................... 44
MANUSCRIPT TWO – USE OF POLYMER GROUTING TO REDUCE
DIFFERENTIAL HEAVE IN PAVEMENTS OVER EXPANSIVE SOILS .................. 47
Abstract ............................................................................................................. 47
Introduction ....................................................................................................... 48
Background and Problem Statement ................................................................... 49
Research Objectives and Tasks .......................................................................... 50
Review of Published Literature .......................................................................... 51
Laboratory Testing of Geomaterials ................................................................... 53
Development of Polymer Injection System in the Laboratory ............................. 54
Effect of Polyurethane Grout Injection on the Mechanical Properties of
Aggregates and Soils .......................................................................................... 56
Resilient Modulus Test Results .......................................................................... 56
Quick Shear Test Results: .................................................................................. 59
Numerical Modeling of Flexible Pavement Sections Constructed over Expansive
Soil Subgrades ................................................................................................... 59
Pavement Layer Configuration and Material Property Assignment ..................... 60
Model Geometry Optimization ........................................................................... 64
Element Selection and Mesh Optimization ......................................................... 65
Effect of Polyurethane Grout Injection on Pavement Surface Heave ................... 66
Limitations of Current Study .............................................................................. 69
Summary and Conclusions ................................................................................. 70
Acknowledgments.............................................................................................. 70
References ......................................................................................................... 71
xii
SUMMARY, CONCLUSIONS AND RECOMMENDATIONS FOR FUTURE
RESEARCH .................................................................................................................. 74
Summary ........................................................................................................... 74
Conclusions & Limitations ................................................................................. 75
Manuscript # 1........................................................................................ 75
Manuscript # 2........................................................................................ 76
Recommendations for Future Research .............................................................. 76
Manuscript # 1........................................................................................ 76
Manuscript # 2........................................................................................ 77

xiii
LIST OF TABLES
Table 1-1: Individual Research Tasks mapped with Respective Manuscripts....................7
Table 2-1: Deflection Basin Parameters and Corresponding Threshold Values Obtained
from Literature: (a) (Chang et al., 2014); (b) (Horak et al, 2015) ............. 15
Table 2-2: Pavement Layer Properties used during the Simulation Efforts ..................... 23
Table 2-3: Range of Modulus Values Assigned to Different Pavement Layers, and the
Corresponding Variations in Deflection Basin Parameters ...................... 26
Table 2-4: Variation of DBPs (Expressed as Percentages) with Variations in Individual
Pavement Layer Modulus ....................................................................... 26
Table 2-5: Subsurface Investigation Data for (a) US-95, and (b) SH-55 Sections ........... 31
Table 2-6: Summary of Distress Types, Extent, and Corresponding Condition Ratings for
the Four Selected Roadway Segments (1 in. = 25.4 mm; 1 mile = 1.6 km)
............................................................................................................... 32
Table 3-1: Laboratory Test Results: Elastic Modulus Improvement ............................... 58
Table 3-2: Materials Properties used in the Modeling: (a) Control Section; (b) HDP-
Treated Geomaterials .............................................................................. 62
Table 3-3: Comparing the Model-Predicted Nodal Displacements for Pavement Sections
with Treated and Untreated Base and Subgrade Layers ........................... 69
xiv
LIST OF FIGURES
Figure 2-1: Snapshot of the ABAQUS model of the Pavement Section Analyzed,
showing Relevant Dimensions ................................................................ 20
Figure 2-2: Variation of Pavement Surface Deflection with Variation of Pavement Layer
Modulus ................................................................................................. 23
Figure 2-3: Variation of Surface Deflection Basin Shape and Basin Parameters with
Varying (a) HMA, (b) Base and (c) Subgrade Modulus .......................... 24
Figure 2-4: Relationship between Layer Modulus and Deflection Basin Parameter
Threshold Values: (a) Middle Layer Index or MLI; (b) Lower Layer Index
or LLI ..................................................................................................... 28
Figure 2-5: Pavement Layer Profiles for the (a) I-84, (b) US-95, and (c) SH-55 Pavement
Sections (1 mile = 1.6 km) ...................................................................... 30
Figure 2-6: Deflection at the Center of the Loading Plate (D0) for the Selected Pavement
Sections (a) I-15, (b) I-84, (C) US-95, (d) SH-55 .................................... 35
Figure 2-7: Surface Curvature Index (SCI) / Base Layer Index (BLI) Values for the
Selected Pavement Sections Showing the Threshold Ranges
Recommended by Researchers in the US as well as in South Africa: (a) I-
15, (b) I-84, (C) US-95, (d) SH-55 .......................................................... 37
Figure 2-8: Middle Layer Index (MLI) Values for the Selected Pavement Sections (a) I-
15, (b) I-84, (C) US-95, (d) SH-55 .......................................................... 38
Figure 2-9: Base Curvature Index (BCI)/ Lower Layer Index(LLI) Values for the
Selected Pavement Sections (a) I-15, (b) I-84, (c) US-95, (d) SH-55 ....... 39
Figure 2-10: Deflection Measured by the 7th Sensor (D60) for the Selected Pavement
Sections (a) I-15, (b) I-84, (C) US-95, (d) SH-55 .................................... 41
Figure 3-1: Photographs Showing: (a) Comparatively Uniform Dispersion of Polymer;
and (b) Non-Uniform Disperse of Polymer (Stephens and Honeycutt,
Online Documentation) .......................................................................... 53

xv
Figure 3-2: Photographs Showing the Four Material Types Tested in the Laboratory: (a)
Sand, (b) GAB, (c) #57 Stone, & (d) Expansive Soil (US-95) ................. 54
Figure 3-3: Method-1 and 2 Samples Preparation mold and Extracted Samples ............. 55
Figure 3-4: Flow Chart Depicting Different Steps in the Laboratory Testing Protocol .... 56
Figure 3-5: Resilient Modulus Test (AASHTO T-307) Results for Control and HDP-
Treated (a) Base Materials; and (b) Expansive Soil Subgrade ................. 57
Figure 3-6: Quick Shear Test (AASHTO T-307) Results of Control and URETEK
Treated Base Materials (Sand, Gap, #57 Stone & Expansive Subgrade
Soil) ....................................................................................................... 59
Figure 3-7: Simplified Representative Pavement Section of US-95 Roadway ................ 61
Figure 3-8: Snapshot of the ABAQUS Model showing the Location and Dimension of the
Water Source .......................................................................................... 63
Figure 3-9: Effect of Model Dimension on Predicted Maximum Surface Displacement . 65

1
CHAPTER 1: INTRODUCTION AND BACKGROUND
Problem Statement
The United States has the world’s largest transportation system, with a road
network spanning more than 3.9 million miles. (www.fhwa.dot.gov/ohim/onh/onh.pdf).
The pavements in this large network become deteriorated over time due to traffic and
environmental loading. Generally, pavement sections deteriorate at an increasing rate.
Initially, the rate of deterioration is comparatively slow when there are few distresses in
the pavement. However, with time, distresses due to traffic loading and environmental
exposure increase, accelerating subsequent damage to the pavement. Pavement
maintenance and rehabilitation are two major strategies generally used to increase
pavement service life (Johnson 2018). Typically, maintenance activities target
improvement of the pavement surface at early stages of distresses. This slows down the
rate of pavement deterioration by correcting small pavement defects before they worsen
and contribute to further damage in the pavement layer. However, beyond reasonable
pavement distress limits, maintenance activities are no longer an effective option to correct
pavement distress. In such cases, pavement rehabilitation activities are required to repair
the damaged pavement layers. In some cases, complete reconstruction is the only option.
Thorough identification and documentation different distress types, along with structural
and functional pavement evaluations are essential in prioritizing maintenance,
rehabilitation and reconstruction activities.

2
According to guidelines provided by the American Association of State Highway
and Transportation Officials (AASHTO), two major levels of pavement management
decisions are included in a Pavement Management System (PMS): (1) network level and
(2) project level. Network-level decisions are concerned with programmatic and policy
issues for an entire network. These decisions include: establishing pavement preservation
policies, identifying priorities, estimating funding needs, and allocating budgets for
Maintenance, Rehabilitation, and Reconstruction (MR&R) (Alkire 2009; AASHTO-1993).
Project-level decisions address engineering and technical aspects of pavement
management, i.e., the selection of site-specific MR&R actions for individual projects and
groups of projects. The entire success of a PMS depends on the availability of sufficient
data to evaluate the pavement network, and establish an efficient project level pavement
preservation strategy. Whether evaluating a huge pavement network or selecting a
particular pavement treatment strategy, the most influential factors are traffic interruption
and cost. For this reason, over the last few decades, nondestructive evaluation processes
and treatment technologies are becoming increasingly popular due to significant time and
cost reductions. One common nondestructive pavement structural evaluation technique
involves Falling Weight Deflectometer (FWD) testing. In FWD testing, surface
displacements induced due to the application of an impulse load are used to make
inferences about the structural condition of the pavement. Once the need for rehabilitation
has been established for a particular pavement sections, different alternatives can be
considered before the most sustainable and resilient rehabilitation approach is selected.
The research effort documented in the current master’s thesis focused on
nondestructive pavement evaluation as well as the implementation of one particular

3
nondestructive rehabilitation approach. First, the effects of subsurface conditions on
pavement response under loading are studied by utilizing the FWD testing approach.
Subsequently, polyurethane grout injection has been studied as a potential rehabilitation
measure to reduce the problem of recurrent differential heaves on flexible pavements
constructed over expansive soil deposits.
Background
Manuscript - 1
The Idaho Transportation Department (ITD) is currently in the process of
rehabilitating several sections of highways across the state. Depending on their
geographical location, these highway segments are often built over different subgrade
conditions, and are exposed to different levels of truck traffic & environmental conditions.
Rehabilitation design is therefore carried out at the district level after collection of relevant
project information. Due to time and resource constraints, extensive evaluation of
pavement structural condition across the network is often not feasible. Accordingly,
functional evaluation results with limited structural assessment data are often used to make
pavement maintenance and rehabilitation decisions. However, the success of pavement
maintenance and rehabilitation decisions are largely dependent not only on the functional
quality of the pavement, but also on its structural condition. Visual distress surveys and
nondestructive pavement structural evaluation technique such as FWD testing are often
carried out by agencies as part of their pavement preservation programs. Although back-
calculation of individual layer moduli from FWD data is a common approach to assess a
pavement’s structural condition, the accuracy of this approach is largely dependent on
exact estimates of individual layer thicknesses. Coring operations to determine pavement

4
layer thicknesses require significant time and resource commitments, and hence cannot
always be accommodated within an agency’s operational constraints. Ground Penetrating
Radar (GPR) is one way to assess pavement layer thickness. However, like coring data,
GPR testing data is not usually available in the PMS. Therefore, an alternative analysis
method to assess the pavement’s structural condition from FWD data is desired for those
cases where layer thickness data is not available. In manuscript-01, the research is primarily
focused on the combined use of visual distress survey data and Deflection Basin Parameters
(DBPs) calculated from FWD test data to make inferences regarding the structural
condition of individual pavement layers in a network level database. The manuscript
(Chapter 2 of this thesis) evaluates the accuracy of different DBPs through a detailed
numerical modeling effort. Subsequently, the DBP approach is used to evaluate the
structural condition of four different highway segments selected within the state of Idaho.
The usability of the DBP approach as a network-level tool for pavement rehabilitation
decisions is explored.
Manuscript - 2
Flexible pavement sections constructed over expansive soil deposits often undergo
significant damage due to the volume changes in the underlying soil strata induced by
moisture fluctuations. Repetitive changes in volume of the underlying soil mass leads to
corresponding changes in support conditions underneath the pavement; this change in
volume often manifests itself through pavement surface distresses such as cracking and
surface undulations. Generally, in cases where the expansive soil deposits are confined to
shallow depths underneath the pavement surface, conventional rehabilitation treatments
such as pre-wetting, chemical stabilization, removal and replacement, etc., can be pursued.

5
However, such treatment strategies become impractical for cases where the expansive soil
deposit lies more than 1 m (3 ft.) underneath the pavement surface. In such cases,
implementation of alterative remedial measures that can reinforce the pavement section,
and dissipate the soil-generated swelling stresses is desired. Several research initiatives
have been undertaken regarding this issue and it was found that uniform dissipation of
excessive swelling energy/stress within the pavement layers is very effective for heave
mitigation.
Recurrent damage caused by the expansive soil strata underneath a particular stretch
of US-95 north of the Oregon-Idaho border has led ITD to explore different stabilization
alternatives to minimize the costs associated with recurrent maintenance and rehabilitation
activities. A recently completed research study at Boise State University conducted
extensive laboratory characterization of soil samples obtained from the corresponding
pavement section, and it was observed that the expansive soil deposits were often deeper
than 2 m (6 ft.) from the pavement surface thus rendering chemical stabilization-based
approaches impractical. In the second manuscript, the effectiveness of a High-Density
Polymer (HDP) grout injection as a remedial measure to address the problem of recurrent
pavement damage due to expansive soils is explored; such an approach can be particularly
useful as it will not require removal of the existing pavement layers. HDP expanding
polymer grout injection has the potential to result in the formation of a “flexible layer”
within the pavement system where the polymer-soil or polymer-aggregate mixture can
serve to uniformly dissipate the swell pressures from the underlying soil layers. Laboratory
testing and numerical modeling was utilized to assess the suitability of HDP injection as a
potential remedial measure to reduce recurrent heaving in pavement sections constructed
6
over expansive soil deposits; findings from this study have been reported in Chapter 3 of
this thesis.
Research Objectives, Tasks, and Manuscripts Prepared
The overall objective of this master’s thesis research was to quantify how changes
in subsurface conditions can affect the response and performance of flexible pavement
sections. The research work has been reported in the form of two different manuscripts.
The first manuscript focused on the use of nondestructive testing using FWD to draw
inferences regarding the substructure layer conditions. To do so, the research task was
divided into two parts. First, the applicability of Deflection Basin Parameters (DBPs) and
their thresholds were evaluated using a commercial finite element modeling software
ABAQUS®. Once accuracy of DBPs were established for typical pavement configurations,
the next task involved using the DBPs to evaluate four pavement sections across Idaho.
The four highway segments represented different functional classifications, were built over
varying subgrade conditions, and are subjected to varying levels of truck traffic. Detailed
outcomes of this evaluation approach have reported in Chapter 2 of this master’s thesis
emphasizing primary advantages, and highlighting inherent assumptions and
shortcomings.
The primary objective of the second manuscript was to evaluate the effectiveness
of HDP grout injection into the base or subgrade layer in a flexible pavement system as an
alternative remedial measure to mitigate the problem of differential heave. The research
tasks carried out to fulfill this objective can be broadly categorized into two groups. First,
laboratory tests were carried out to establish the resilient modulus and shear strength
properties of different unbound materials (aggregates and soils) used in the study.

7
Subsequently, Finite Element modeling was carried out to assess how the surface heaves
can be reduced by injecting the HDP into the base/subbase or subgrade layers. Findings
from these tasks have been detailed in Chapter 3 of this thesis. Table 1-1, lists the individual
tasks carried out under the scope of this master’s thesis, and maps each of the tasks to the
technical manuscripts prepared.
Table 1-1: Individual Research Tasks mapped with Respective Manuscripts
Tasks Name Manuscript
1 The accuracy and applicability check of DBPs using Finite Element
modeling Manuscript #1
2 Field Application of DBPs with Visual Distress Data for PMS
1 Laboratory Characterization of HDP grout injection in Base and Subgrade
soil Manuscript #2
2 Numerically evaluate the effectiveness of HDP grout injection to reduce
differential heaving of pavements due to underlying expansive soil layers.
Organization of the Thesis
This Master’s thesis document comprises four chapters. Chapter 2 contains results
reported in the first manuscript. The title of the manuscript is, “Using FWD Deflection
Basin Parameters for Network-Level Pavement Condition Assessments”. Chapter 3
contains findings reported in manuscript # 2, titled “Use of Polymer Grouting to Reduce
Differential Heave in Pavements over Expansive Soils”. Chapter 4 summarizes results and
findings from the two manuscripts, and presents recommendations for future research
tasks.
References:
AASHTO Guide for Design of Pavement Structures 1993, Published by the American, 7
Association of State Highway and Transportation Officials, Washington DC, 1993
8
Alkire, B. D. (2009), “Pavement Management Systems Overview”, Michigal
Technological University, Civil and Environmental Engineering / MTU / Houghton
/MI/49931/ revised August 2009.www.cee.mtu.edu/~balkire /CE5403/Lec2.pdf
Federal Highway Administration Office of Highway, “Our Nation’s Highways” U.S.
Department of Transportation Information Management Publication No. FHWA-
PL-98-015 HPM-40/2-98(20M), https://www.fhwa.dot.gov/ohim/onh/onh.pdf
Johnson D., (2018) “Pavement management basics and benefits: A strategy of prevention”.
ASPHALT- the magazine of asphalt institute. http://asphaltmagazine.com/
pavement-management-basics-and-benefits-a-strategy-of-prevention/

9
MANUSCRIPT ONE – USING FWD DEFLECTION BASIN PARAMETERS FOR
NETWORK-LEVEL PAVEMENT CONDITION ASSESSMENTS1
Abstract
Decisions regarding the selection and implementation of appropriate pavement
rehabilitation methods is usually based on pavement functional and structural condition
data. Visual distress surveys and Falling Weight Deflectometer (FWD) testing are often
carried out by agencies as parts of their pavement preservation programs. Although
backcalculation of individual layer moduli from FWD data is a common approach to assess
a pavement’s structural condition, the accuracy of this approach is largely dependent on
exact estimates of individual layer thicknesses. Coring operations to determine pavement
layer thicknesses require significant time and resource commitments, and hence cannot
always be accommodated within an agencies’ operational constraints. Accordingly,
alternative analysis methods to assess the pavement’s structural condition from FWD data
are often desired. An ongoing research study at Boise State University is focusing on
combined usage of pavement structural and functional evaluation data for making
pavement rehabilitation decisions. Considering the lack of pavement layer thickness
information for all locations, this study is using Deflection Basin Parameters (DBPs)
calculated from FWD test data to make inferences regarding the structural condition of
1 This chapter includes results already reported in the following publication. Contribution of the
coauthor is sincerely acknowledged: Rabbi, M. F., and Mishra, D. (2018). “Using FWD Deflection Basin
Parameters for Network-Level Pavement Condition Assessments”. Submitted to the International Journal
of Pavement Engineering (Under Review)
10
individual pavement layers. This manuscript presents findings from this study, and
establishes DBPs as reasonable alternatives to be used in network-level pavement condition
evaluation practices. The adequacy of DBPs to assess the structural condition of individual
pavement layers was first assessed through Finite-Element Modeling. A series of analyses
were performed by assigning typical modulus values to individual pavement layers, and
the corresponding DBPs were calculated. The calculated DBP values mostly fell within
typical ranges specified in the literature for different layer conditions. Once the DBPs were
established as adequate alternatives for making network-level pavement assessment
decisions, four selected pavement sections in the state of Idaho were analyzed based on
this method, and the results were compared against those obtained from visual distress
assessment routines.
Introduction
The success of an effective pavement maintenance and preservation program relies
heavily on adequate functional and structural assessment of the pavement network. State
and local transportation agencies often adhere to manual pavement condition ratings,
windshield surveys, and/or the use of automated distress survey vehicles to maintain a
database of pavement functional conditions. Structural assessment of pavements on the
other hand, is commonly accomplished through some form of deflection testing, often
using Falling Weight Deflectometers (FWDs), or more recently using Rolling Weight
Deflectometers (RWD) or Traffic Speed Deflectometers (TSD). A well-performing
pavement network is characterized by satisfactory functional as well as structural
condition. Pavement distress surveys usually rate the ride quality and condition of the

11
pavement surface, whereas structural condition assessment using FWD can evaluate the
condition of individual pavement layers through backcalculation of layer moduli.
The accuracy of any backcalculation approach is largely dependent on the exact
estimates of individual layer thicknesses. Highway agencies often carry out coring
operations, or Ground Penetrating Radar (GPR) scans to establish individual pavement
layer thicknesses. Coring operations are significantly time consuming, and resource
intensive. Similarly, not all agencies have yet adopted GPR into regular practice to
establish pavement layer thicknesses at the network level. Accordingly, alternative (and
relatively quick) analysis methods to assess the pavement’s structural condition from FWD
data are desired. One such method involves the use of Deflection Basin Parameters (DBPs),
which are indicators of the pavement deflection basin shape. Several researchers in the past
(Horak 1987; Kim et al. 2000; Gopalakrishnan and Thompson 2005; Horak 2008; Donovan
2009; Talvik and Aavik 2009; Carvalho et al. 2012; and Horak et al. 2015) have highlighted
the effectiveness of deflection basin parameters in evaluating the structural condition of in-
service pavements. One of the most significant studies involving in-depth analysis of the
pavement deflection data was carried out under the scope of the National Cooperative
Highway Research Program (NCHRP) (Kim et al. 2000). This study involved the analysis
of field as well as synthetic pavement deflection data to evaluate the significance of
different DBPs, and attempted to develop empirical equations to predict individual
pavement layer moduli from the DBPs without going through the rigors of backcalculation.
With the design and development of modern FWD equipment and increased
emphasis on pavement management systems, agencies are moving towards extensive FWD
testing across entire roadway networks. Although recent trend has been to use RWDs or

12
TSDs for network-level pavement assessment, these equipment are still not widely
available (a total of two-three devices are available throughout the United States), and
therefore, their use by highway agencies is not very common. Most highway agencies still
rely on FWD testing at a network level to develop a database of pavement condition data
under their respective pavement management programs. This data, combined with
automated distress survey results can be used to identify structural deficiencies in
individual pavement layers, ultimately leading to the selection and implementation of
appropriate maintenance and rehabilitation methods. However, the usefulness of FWD test
data without detailed information on individual pavement layer thicknesses still remains
uncertain as far as the state of practice among transportation agencies is concerned.
Objectives and Scope
The primary objective of this research effort was to assess the suitability of
Deflection Basin Parameters (DBPs) established through FWD testing as indicators of
pavement structural condition at a network level. First, an extensive review of published
literature was carried out to identify typical DBPs and corresponding threshold values
proposed by researchers as indicators of pavement structural condition. This was followed
by finite-element analysis of typical flexible pavement section configurations to calculate
representative DBP values under simulated FWD loading. An extensive parametric
analysis was conducted to establish ranges for DBP values for different layer modulus
values assigned to individual pavement layers. DBP values established for these simulated
pavement sections were compared against typical threshold values proposed in the
literature. Once the suitability of DBPs as pavement structural condition indicators was
established, four different pavement sections were selected across the state of Idaho, and

13
their structural conditions were established using FWD data. Inferences related to the
structural condition of these pavement sections were combined with functional evaluation
records to propose suitable rehabilitation measures for implementation by the Idaho
Transportation Department (ITD). This integration of pavement structural and functional
condition assessments has been proposed as a suitable approach for pavement maintenance
and rehabilitation selection.
FWD Testing as a Part of Routine Pavement Condition Evaluation
The pavement management programs implemented by most state transportation
agencies typically involve Falling Weight Deflectometer (FWD) testing. Usually, FWD
testing across the entire pavement network managed by a transportation agency is
scheduled at periodic intervals. Moreover, pavement sections that are already identified for
rehabilitation/reconstruction are also tested on “as-needed” basis, and the corresponding
data is used in the design of the rehabilitated sections. Although FWD testing of pavement
sections is usually carried out as part of the routine pavement evaluation program, the data
is not used unless a particular pavement section has been identified for rehabilitation/
reconstruction. Based on current practice, pavement sections are typically selected for
rehabilitation/reconstruction based on their functional condition assessment (such as visual
distress survey, roughness measurements, etc.) results only. This approach is based on the
assumption that deterioration in the structural health of a pavement section ultimately leads
to deterioration in the functional condition, and therefore selecting pavements for
rehabilitation/reconstruction based on functional condition data is acceptable. However,
the functional condition of a pavement section does not automatically identify the layer(s)
contributing towards the condition deterioration. Accordingly, detailed understanding of

14
the structural health of individual pavement layers can facilitate the selection of optimal
maintenance/rehabilitation approaches. Implementing “relatively quick” methods to get a
good understanding of pavement structural health from FWD data will encourage
transportation agencies to implement this practice to a greater extent. One such “relatively
quick” approach to make inferences regarding the pavement structural condition from
FWD data involves the use of DBPs
Commonly Used DBPs
Researchers in the past have defined different DBPs to make inferences about the
structural conditions of individual pavement layers. These definitions, although similar in
most cases, occasionally differ from each other. Moreover, threshold values for different
DBPs demarcating the boundaries between different structural condition ratings differ from
one agency to another. The current research effort made use of two distinct sets of DBP
definitions used by practitioners and researchers in the field of pavement engineering. The
first set was developed and is used in South Africa (Horak 1987; Horak 2008, Horak et al,
2015), whereas the second set was developed for use in the United States (Kim et al. 2000).
Mathematical expressions used to calculate these DBPs have been given below. Note that
Dr in the following expressions represents the surface deflection in µm (or mils) measured
by a sensor placed at a distance of ‘r’ mm (or in.) from the center of the load plate.
DBPs Used in the United States
0 12
24 36
Surface Curvature Index (SCI):
Base Curvature Index (BCI):
Note:
Sensor positions are marked in inches (1 in. = 25.4 mm)
Deflections are measured in mils (1 mil = 0.001 in.)
SCI D D
BCI D D

15
DBPs Used in South Africa
0 300
300 600
600 900
Base Layer Index (BLI):
Middle Layer Index (MLI):
Lower Layer Index (LLI):
Note:
Sensor positions are marked in mm
Deflections are measured in m (1 m = 0.001
BLI D D
MLI D D
LLI D D
mm)
Table 2-1, lists different DBPs and corresponding threshold values as found in the
literature. Table 2-1-a lists the DBPs and threshold levels commonly used in the US,
whereas Table 2-1-b lists DBPs and corresponding threshold values used in South Africa.
Table 0-1: Deflection Basin Parameters and Corresponding Threshold Values
Obtained from Literature: (a) (Chang et al., 2014); (b) (Horak et al, 2015)
(a) (Chang et al., 2014);
Inference
Related To
Threshold Ranges
(mils) Inference
Surface Curvature
Index (SCI) Asphalt Layer
< 4 Very Good Asphalt Layer
4 - 6 Good Asphalt Layer
6 – 8 Fair Asphalt Layer
8 – 10 Poor Asphalt Layer
> 10 Very Poor Asphalt Layer
Base Curvature
Index (BCI) Base Layer
< 2 Very Good Base Layer
2-3 Good Base Layer
3-4 Fair Base Layer
4-5 Poor Base Layer
> 5 Very Poor Base Layer
Deflection of the
Sensor at 60-in.
offset (W60)
Subgrade Layer
< 1 Very Good Subgrade Layer
1 – 1.4 Good Subgrade Layer
1.4 – 1.8 Fair Subgrade Layer
1.8 – 2.2 Poor Subgrade Layer
> 2.2 Very Poor Subgrade Layer

16
(b) (Horak et al, 2015)
Performance
Indicator
Inference Related
to
Categorization Based on Structural
Condition
Sound Warning Severe
D0 (µm) Entire Pavement
Structure < 625 625 – 925 > 925
Base Layer Index
(BLI, µm) Base Layer < 250 250 – 475 > 475
Middle Layer Index
(MLI,µm)
Subbase/Subgrade
Layer < 115 115 – 225 > 225
Lower Layer Index
(LLI, µm)
Subbase/Subgrade
Layer < 65 65 – 120 > 120
From the definition of the DBPs, it can be clearly seen that same numeric value of
DBP is sometimes denoted by different names in the two conventions. For example, the
Surface Curvature Index (SCI) has the same numeric value as the Base Layer Index (BLI).
However, the threshold value for SCI (see Table 2-1-a) are specified to make inferences
regarding the asphalt layer, whereas threshold values for BLI (see Table 2-1-b) are used to
makes inferences about the structural condition of the base layer. Considering these
differences, the current study adopted an approach where the inferences drawn from the
DBPs have incorporated both the US and South African practices.
Finite Element Modeling of FWD Testing on Flexible Pavements
Once commonly used DBPs and the corresponding threshold values were identified,
the next task involved mechanistic evaluation of the suitability of these parameters as
indicators of the structural quality for individual pavement layers. This involved
calculating the DBPs for pavement sections with typical layer configurations and
properties, and comparing them against threshold values specified in the literature.
Establishing the approximate relationships between DBP values and corresponding moduli
of various pavement layers could provide a means to evaluating the suitability of the
literature-proposed threshold values for implementation by state and local transportation

17
agencies. This was accomplished through Finite Element Modeling (using a general
purpose finite element analysis software package, ABAQUS®) of representative pavement
sections comprising layers with different modulus values. Threshold values suggested by
Horak et al. (2015) were used to categorize the pavement structural response based on the
predicted surface deflection values under simulated FWD loading.
A typical 3-layer pavement section comprising a 115-mm thick Hot-Mix Asphalt
(HMA) layer overlying a 152.4-mm thick granular base layer constructed over a subgrade
layer of infinite depth was modelled during this research effort. All layers were modelled
as linear-elastic; the viscoelastic nature of HMA and stress-dependent behavior of unbound
(base and subgrade) layers were ignored for this analysis. Although these simplifying
assumptions can be treated as limitations of the modeling approach, they should not
significantly limit the applicability of the findings from this research study, as has been
established in the literature. Researchers in the past (Xie et al. 2015; Tarefder & Ahmed
2013) have successfully used linear-elastic models to simulate FWD testing of flexible
pavement systems. Tarefder and Ahmed (2013) argue that under the short-duration impact
loading (pressure ~700 kPa) as during typical FWD testing, the HMA layer can be safely
assumed to exhibit linear-elastic behavior. Furthermore, application of 700kPa stress on
the surface of the pavement typically does not generate failure/yield stress in the HMA or
base layers; stress states sufficiently below the failure stress levels means the assumption
of linear-elastic behavior is reasonable.
The authors do recognize that temperature can have a significant effect on the
viscoelastic behavior of HMA. However, as FWD testing is typically carried out when
pavement temperatures are between 70° and 90°F, the effect of temperature variation on

18
central deflection is often insignificant. As per the 1993 AASHTO design guide (AASHTO
1993) the variation in central deflection during FWD testing introduced by temperature
changes can be approximately 20%. This variation was considered to be insignificant
during this research effort, and therefore, a linear-elastic, constant modulus modeling
approach was pursued. The authors are well-aware of this being a limitation of the current
analysis approach; future research efforts will focus on considering the non-linear behavior
of individual pavement layers. Results from such analyses will be presented in future
publications.
Model Generation and Optimization
Modeling a pavement section under FWD loading can be accomplished using several
different approaches, such as: (1) 2-Dimensional, (2) 3-Dimensional, (3) Quarter-Cube,
and (4) Axi-symmetric models. Although different simplifications can often be used with
reasonable accuracy depending on the model and loading configurations, three-
dimensional models have been shown to be the best alternative as far as capturing all three
directional response components is concerned (Kim 2007). Moreover, significant increase
in computational power over the past decade has eliminated the major limitations
associated with 3-D finite element modeling. Accordingly, the current study utilized a 3-D
FE model to simulate FWD testing of flexible pavement systems.
Geometry
Reviewing the literature and common practices for pavement construction by various
agencies, a three layer (HMA, base and subgrade) pavement configuration was selected as
the primary model. As already mentioned, the layer thickness selected for the initial model
were 114 mm (4.5 in.), 152 mm (6.0 in.) and 12192 mm (480 in.) for HMA, base and

19
subgrade, respectively. Here the thickness of HMA and base are the minimum typical
thicknesses used for interstate and state highway road construction. The thickness of the
subgrade layer was selected so that presence of the rigid boundary at the bottom does not
affect the simulation results.
Mesh
The accuracy of the simulation results is highly dependent on mesh refinement,
construction and the aspect ratio of elements. Smooth transitioning of stress and strain
between elements is very important for convergence of the model (Kim 2007). Analysis
time is also a very important consideration. In general, decreasing the precision of a model
will decrease the analysis time. The computational time associated with a fine mesh is
generally higher than that for a coarser mesh. In this model, the generation of mesh directly
underneath the FWD loading area was done using a wedge-shaped mesh element; the
element type used was C3D6, a 6-node linear triangular prism-type element. The
surrounding influence areas were meshed using hex-shaped elements: C3D8R, an 8-node
linear brick element. As C3D8R elements are susceptible to hour-glassing, active hourglass
controls were used to minimize this effect (ABAQUS 2015). Reduced integration elements
were used to increase the overall computational efficiency. Except for the central FWD
loading zone (where higher deflections are expected), all other areas of the model were
meshed using a structural mesh technique to significantly increase the model efficiency.
To reduce the overall model convergence time, only the central zone of interest (DBP
calculation zone) used a finer mesh (see Figure 2-1).

20
Figure 0-1: Snapshot of the ABAQUS model of the Pavement Section Analyzed,
showing Relevant Dimensions
As boundary conditions have a significant effect on the stress-strain behavior
exhibited by the simulated pavement section, model size was another important
consideration during this verification process. Initially, a model size of 4000 mm X 4000
mm (in the horizontal direction) was selected. Later, the model dimensions were gradually
increased until no change in the simulation results were observed due to change in model
size. Note that increasing the model size also resulted in an increase in the computational
time requirements. Several researchers in the past have studied the effects of model size
and boundary conditions on simulation results. Kim (2007) mentioned that axisymmetric
modeling and inappropriate treatment of boundary conditions can significantly affect the
model accuracy. He also performed an axisymmetric finite element analysis to study the
truncation effects of boundary conditions, and proposed that the effect of boundary
conditions is negligible if the domain size is larger than 20 times radius of the loading area
21
in the horizontal direction, and larger than 140 times the radius in the vertical direction
(Kim 2007). Previously, Duncan et al. (1968) had observed that to eliminate boundary
effects, the model geometry had to be extended to a depth of 50 times the radius of the
loading area in vertical direction, and 12 times in horizontal direction. Uddin et al. (1994)
also performed a study to determine the optimum domain size for a three-layer pavement
configuration. The layer thicknesses used were similar to the primary model used in this
study. They concluded that the optimum domain size required was: 18.3 m (length) x 26.6
m (width) x 12.2 m (depth). The dimensions suggested by Uddin et al. (1994) were used in
the current study during preparation of the base model. However, it was observed that for
larger deflections (very low modulus values assigned to individual layers), these
dimensions needed to be changed to eliminate boundary effects. After fixing the model
domain size, the model mesh size was optimized for both low and high modulus case
scenarios. Once the mesh size was stabilized, mesh optimization was performed by making
the mesh coarser outside the central area of interest. Later, the accuracies of the model-
predicted deflection values were checked by comparing with the commonly used axi-
symmetric pavement analysis software, KENLAYER (Huang 2004). The comparisons
were carried out with extreme (within reasonable limits) modulus values assigned to the
individual pavement layers.
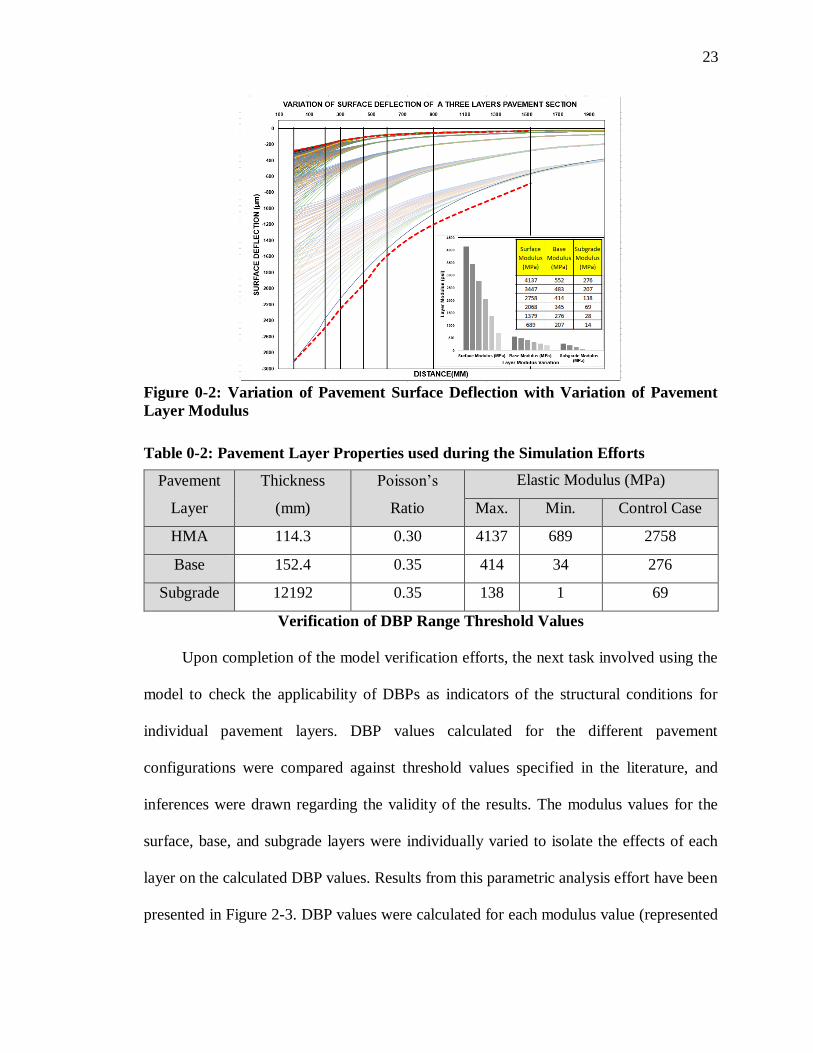
Material Elastic Modulus Range Selection
Initially, a range of possible elastic properties of HMA, base and subgrade were
selected upon discussions with agency pavement engineers. The material properties upper
and lower limits are shown in Figure 2-2 (table inset). Here, the upper limit of modulus is
taken to be representative of a “well-performing” pavement layer, whereas the lower limit

22
indicates a “poor” pavement layer. Six different modulus values were assigned to each of
the three pavement layers, resulting in a total of 6 x 6 x 6 = 216 pavement sections that
were simulated under FWD loading conditions.
Comparing the FE model-generated results against those from KENLAYER, it was
observed that the model performed significantly well when the modulus values assigned to
the individual pavement layers were in the intermediate-to-high range; the results from the
FE model differed slightly (still less than 10% difference in the predicted deflection values)
from those predicted by KENLAYER when significantly low modulus values were
assigned to the pavement layers. In Figure 2-2, the red dotted lines show the deflected
shape plotted using KENLAYER. The group of solid lines (consisting of 216 combinations
of various layer modulus values) in between the KENLAYER lines are the deflection
basins obtained from the ABAQUS model for the different combination of modulus values.
Later, this model was used for the DBP verification effort. Although layer thicknesses are
also important governing factors that influence the deflection basin, only one set of
thicknesses were considered in this study to verify the suitability of DBPs as structural
condition indicators for pavement layers. Table 2-2, lists the range of modulus values
assigned to different layers in this modeling effort.
23
Figure 0-2: Variation of Pavement Surface Deflection with Variation of Pavement
Layer Modulus
Table 0-2: Pavement Layer Properties used during the Simulation Efforts
Pavement
Layer
Thickness
(mm)
Poisson’s
Ratio
Elastic Modulus (MPa)
Max. Min. Control Case
HMA 114.3 0.30 4137 689 2758
Base 152.4 0.35 414 34 276
Subgrade 12192 0.35 138 1 69
Verification of DBP Range Threshold Values
Upon completion of the model verification efforts, the next task involved using the
model to check the applicability of DBPs as indicators of the structural conditions for
individual pavement layers. DBP values calculated for the different pavement
configurations were compared against threshold values specified in the literature, and
inferences were drawn regarding the validity of the results. The modulus values for the
surface, base, and subgrade layers were individually varied to isolate the effects of each
layer on the calculated DBP values. Results from this parametric analysis effort have been
presented in Figure 2-3. DBP values were calculated for each modulus value (represented

24
by a line on the plot). It is observed that for very low modulus values, the deflections are
considerably high.
(a1) (a2)
(b1) (b2)
(c1) (c2)
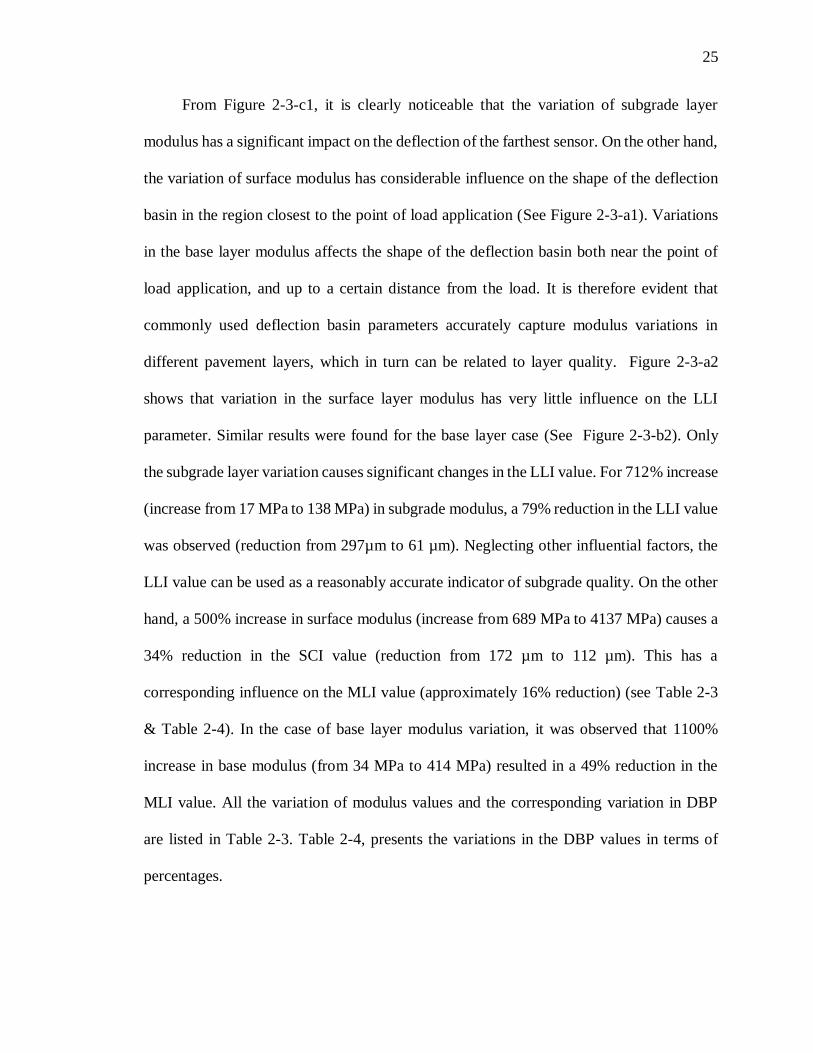
Figure 0-3: Variation of Surface Deflection Basin Shape and Basin Parameters with
Varying (a) HMA, (b) Base and (c) Subgrade Modulus
25
From Figure 2-3-c1, it is clearly noticeable that the variation of subgrade layer
modulus has a significant impact on the deflection of the farthest sensor. On the other hand,
the variation of surface modulus has considerable influence on the shape of the deflection
basin in the region closest to the point of load application (See Figure 2-3-a1). Variations
in the base layer modulus affects the shape of the deflection basin both near the point of
load application, and up to a certain distance from the load. It is therefore evident that
commonly used deflection basin parameters accurately capture modulus variations in
different pavement layers, which in turn can be related to layer quality. Figure 2-3-a2
shows that variation in the surface layer modulus has very little influence on the LLI
parameter. Similar results were found for the base layer case (See Figure 2-3-b2). Only
the subgrade layer variation causes significant changes in the LLI value. For 712% increase
(increase from 17 MPa to 138 MPa) in subgrade modulus, a 79% reduction in the LLI value
was observed (reduction from 297µm to 61 µm). Neglecting other influential factors, the
LLI value can be used as a reasonably accurate indicator of subgrade quality. On the other
hand, a 500% increase in surface modulus (increase from 689 MPa to 4137 MPa) causes a
34% reduction in the SCI value (reduction from 172 µm to 112 µm). This has a
corresponding influence on the MLI value (approximately 16% reduction) (see Table 2-3
& Table 2-4). In the case of base layer modulus variation, it was observed that 1100%
increase in base modulus (from 34 MPa to 414 MPa) resulted in a 49% reduction in the
MLI value. All the variation of modulus values and the corresponding variation in DBP
are listed in Table 2-3. Table 2-4, presents the variations in the DBP values in terms of
percentages.
26
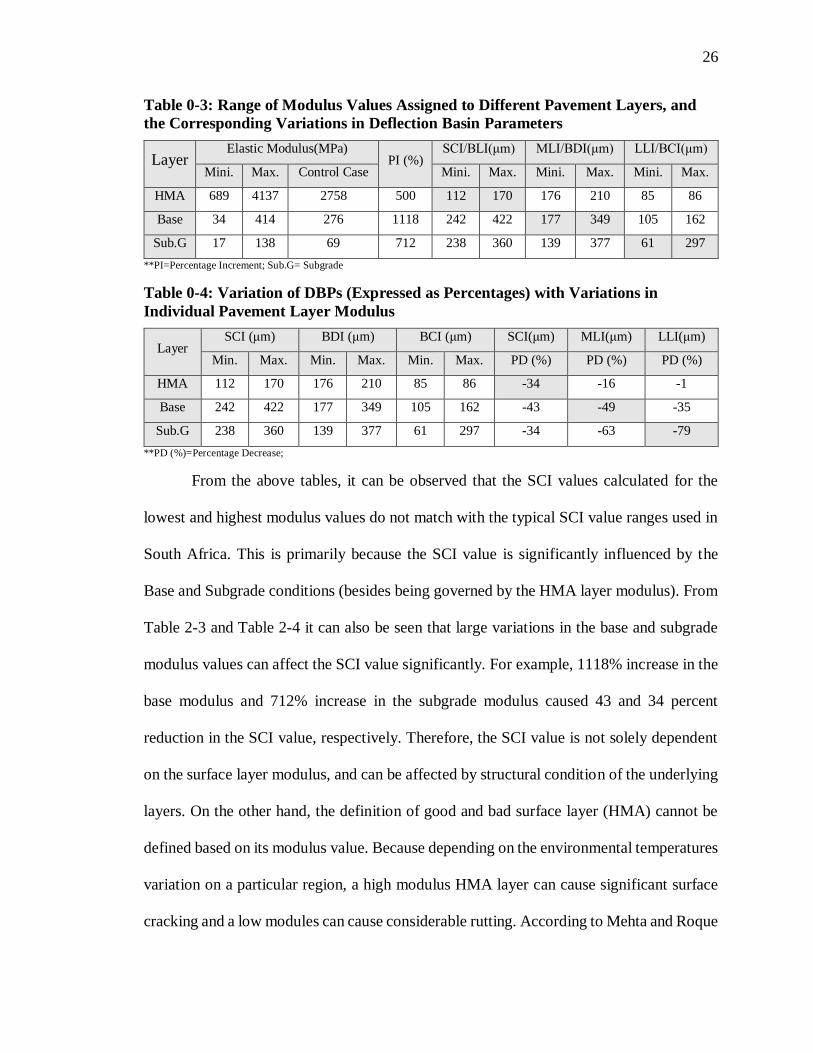
Table 0-3: Range of Modulus Values Assigned to Different Pavement Layers, and
the Corresponding Variations in Deflection Basin Parameters
Layer Elastic Modulus(MPa)
PI (%) SCI/BLI(μm) MLI/BDI(μm) LLI/BCI(μm)
Mini. Max. Control Case Mini. Max. Mini. Max. Mini. Max.
HMA 689 4137 2758 500 112 170 176 210 85 86
Base 34 414 276 1118 242 422 177 349 105 162
Sub.G 17 138 69 712 238 360 139 377 61 297
**PI=Percentage Increment; Sub.G= Subgrade
Table 0-4: Variation of DBPs (Expressed as Percentages) with Variations in
Individual Pavement Layer Modulus
Layer SCI (μm) BDI (μm) BCI (μm) SCI(μm) MLI(μm) LLI(μm)
Min. Max. Min. Max. Min. Max. PD (%) PD (%) PD (%)
HMA 112 170 176 210 85 86 -34 -16 -1
Base 242 422 177 349 105 162 -43 -49 -35
Sub.G 238 360 139 377 61 297 -34 -63 -79
**PD (%)=Percentage Decrease;
From the above tables, it can be observed that the SCI values calculated for the
lowest and highest modulus values do not match with the typical SCI value ranges used in
South Africa. This is primarily because the SCI value is significantly influenced by the
Base and Subgrade conditions (besides being governed by the HMA layer modulus). From
Table 2-3 and Table 2-4 it can also be seen that large variations in the base and subgrade
modulus values can affect the SCI value significantly. For example, 1118% increase in the
base modulus and 712% increase in the subgrade modulus caused 43 and 34 percent
reduction in the SCI value, respectively. Therefore, the SCI value is not solely dependent
on the surface layer modulus, and can be affected by structural condition of the underlying
layers. On the other hand, the definition of good and bad surface layer (HMA) cannot be
defined based on its modulus value. Because depending on the environmental temperatures
variation on a particular region, a high modulus HMA layer can cause significant surface
cracking and a low modules can cause considerable rutting. According to Mehta and Roque

27
(2003), ninety-five percent of the deflection measured on the surface of the pavement due
to the load is case of subgrade condition and remaining five are the attribution of pavement
system above subgrade. Hence, SCI thresholds as a performance indicator of HMA layer
always may not be indicative of the true condition of HMA layer.
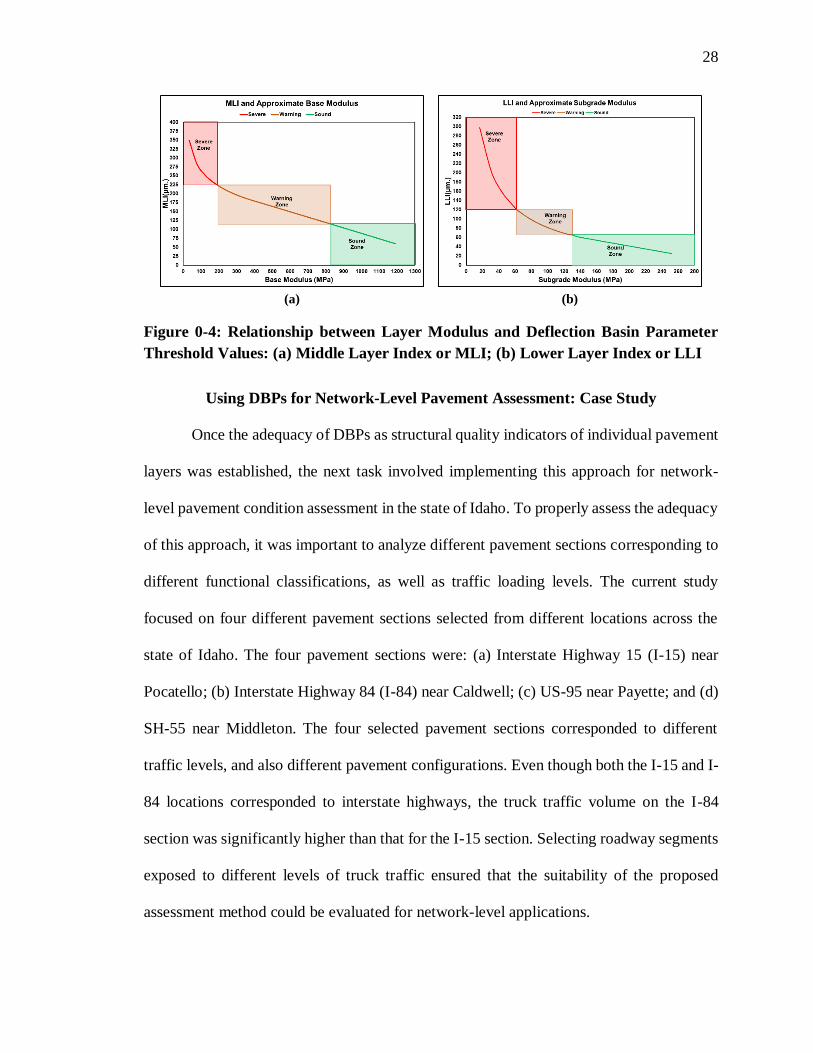
Generally, subgrade layer modulus values less than 69 MPa (~10 ksi) are
considered as bad subgrade and above 137 MPa (~20ksi) are considered as good. Figure
2-4-b shows that for subgrade modulus values lower than 62 MPa (~9 ksi), the value of
LLI increases beyond the South Africa-suggested upper limit of 120μm (upper limit of
Warning Zone). Similarly, when the value of Subgrade modulus increases beyond 130 MPa
(~19ksi), the LLI value falls below the 65 μm value; LLI values below this value are
considered to be indicative of very good subgrade conditions. Similar trends can be
observed from Figure 2-4-a for the MLI parameter. MLI values lower than 115 μm
correspond to base modulus values higher than 860 MPa (~125ksi), whereas MLI values
higher than 220 μm represents base modulus values lower than 203 MPa (~29 ksi).
The above discussions establish that typical threshold values for the MLI and LLI
parameters implemented in South Africa match with typical layer modulus values (for the
base and subgrade layers, respectively) indicative of different base and subgrade structural
conditions. However, similar conclusions cannot be drawn for the HMA layer based the
numerical modeling results. Therefore, it appears that implementing the DBP thresholds to
make inferences about base and/or subgrade conditions may be acceptable, whereas solely
depending on the SCI parameter to make inferences about the HMA layer may not provide
a complete picture of the surface layer conditions.
28
(a) (b)
Figure 0-4: Relationship between Layer Modulus and Deflection Basin Parameter
Threshold Values: (a) Middle Layer Index or MLI; (b) Lower Layer Index or LLI
Using DBPs for Network-Level Pavement Assessment: Case Study
Once the adequacy of DBPs as structural quality indicators of individual pavement
layers was established, the next task involved implementing this approach for network-
level pavement condition assessment in the state of Idaho. To properly assess the adequacy
of this approach, it was important to analyze different pavement sections corresponding to
different functional classifications, as well as traffic loading levels. The current study
focused on four different pavement sections selected from different locations across the
state of Idaho. The four pavement sections were: (a) Interstate Highway 15 (I-15) near
Pocatello; (b) Interstate Highway 84 (I-84) near Caldwell; (c) US-95 near Payette; and (d)
SH-55 near Middleton. The four selected pavement sections corresponded to different
traffic levels, and also different pavement configurations. Even though both the I-15 and I-
84 locations corresponded to interstate highways, the truck traffic volume on the I-84
section was significantly higher than that for the I-15 section. Selecting roadway segments
exposed to different levels of truck traffic ensured that the suitability of the proposed
assessment method could be evaluated for network-level applications.

29
Background on Selected Pavement Sections
Figure 2-5, shows the variation in pavement layer thicknesses within the selected
segments of I-84, US-95, and SH-55 as extracted from boring logs and GPR data; no such
data was readily available for the I-15 section. It is important to note that gathering
complete construction and maintenance histories of in-service pavements is often not
possible for state and local transportation agencies. Maintenance on small sections of
pavements are often carried out in small increments as seasonal funds become available.
Unless the maintenance activities are completed in the form of a formal construction
project with plans and specifications, detailed records are not maintained, and hence
extracting information regarding the exact layer thicknesses, last resurfacing activity, etc.
often become a challenging task. All desired data concerning the four roadway segments
selected in this study could not be obtained. Nevertheless, all available data have been
compiled, and have been used to make inferences during analysis of the FWD and visual
distress survey data. Note Figure 2-5-a shows a sudden change in the base layer thickness
near standardized mile posts 4.0 and 5.0. These two locations correspond to two overhead
structures, and a Cement Treated Base (CTB) was used at these locations to ensure
sufficient vertical clearance. The authors hypothesize that the sudden change in layer
configuration and/or the presence of the overhead structures somehow resulted in the
drastically different layer thicknesses obtained from GPR surveys (due to some form of
interference). However, it should be noted that this is just a hypothesis, and the authors
have not been able to gather any evidence to support or contradict this hypothesis.

30
(a)
(b)
(c)
Figure 0-5: Pavement Layer Profiles for the (a) I-84, (b) US-95, and (c) SH-55
Pavement Sections (1 mile = 1.6 km)
Table 2-5, presents the subgrade layer information for the US-95 and SH-55
segments as established from laboratory testing of borehole samples. As seen from the
Table 2-5, the laboratory-determined R-values for the SH-55 section was higher (average
R value = 53.8) than that for the US-95 section (average R-value = 46.4) indicating better

31
subgrade conditions. Similarly, from Figure 2-5, the thickness of the crushed base layer for
the SH-55 segment is relatively more consistent compared to that for the US-95 segment.
This, combined with the R-values reported in Table 2-5 indicate better base and subgrade
layer conditions for the SH-55 segment compared to the US-95 segment, which is most
likely due to reduced subgrade intrusion into the base layer. These inferences will be
evaluated later in this manuscript using the DBPs.
Table 0-5: Subsurface Investigation Data for (a) US-95, and (b) SH-55 Sections
(a) US - 95
Bore Hole Number 1 2 3 4 5 6 7 8
Liquid Limit 31 18 21 19 20 16 23 43
Plastic Limit 24 NP NP NP NP NP NP 24
R Value 36 69 42 32 46 60 47 39
Unified Classification ML GP-GM ML SM SM SM ML CL
(b) SH - 55
Bore Hole Number 1 2 3 4 5 6
Liquid Limit 23 21 31 25 24 22
Plastic Limit NP NP NP NP NP NP
R Value 47 60 62 N/A 49 51
Unified Classification ML ML SM CL-ML ML ML
Pavement Condition from Visual Distress Survey
The first step in assessing the pavement conditions involved synthesis of pavement
condition data from ITD’s visual distress survey database (ITD Pathway Website).
Individual distress levels were then compared with threshold values used by ITD to assess
the pavement condition (ITD, 2014). Surface cracking is usually reported by ITD in the
form of a Cracking Index (CI), where CI = 5 indicates a brand new pavement with no

32
cracks, and CI = 0 represents a completely failed pavement (ITD 2011). Pavement
roughness on the other hand, is represented using two different indices. The first one,
International Roughness Index (IRI) (Paterson 1986) is an international standard, and is
usually measured in mm/m or inch/mile (1 mm/m = 63.5 inch/mile). The IRI values are
then scaled by ITD to calculate a Roughness Index (RI), where RI = 0.0 indicates a “very
rough” pavement surface, with RI = 5.0 indicating a “very smooth” pavement surface.
Table 2-6, lists different distress types and corresponding indices/magnitudes for the four
selected roadway segments along with the corresponding condition ratings. Note that all
four roadway segments can be categorized as “Interstates” or “Arterials”, to compare with
the corresponding threshold values.
Table 0-6: Summary of Distress Types, Extent, and Corresponding Condition Ratings
for the Four Selected Roadway Segments (1 in. = 25.4 mm; 1 mile = 1.6 km)
Distress Type Distress Severity / Magnitude
Pavement
Section I-15 I-84 US-95 SH-55
Value Rating Value Rating Value Rating Value Rating
Cracking Index 2.6 Fair 3.8 Good 2.2 Poor 1.6 Poor
International
Roughness Index
(IRI, in./mi)
< 95 Good 56
(avg.) Excellent
90.5
(avg.) Good
156
(avg.) Poor
Roughness Index
(RI) 3.40 Good 3.95 Good 3.33 Good 2.51 Fair
Average Rut
Depth (in.) 0.43” Fair 0.24” Good 0.46” Fair 0.24” Good
*The data was taken from ITD’s visual distress survey database. IRI values for the I-84, US-95, and SH-55 segments were
extracted from reports prepared by ITD. IRI values for the I-15 segment are extracted from the visual distress survey database
From Table 2-6, it is evident that the I-84 segment is in “Good” condition as far as
cracking is concerned. The I-15 segment is in “Fair” condition, whereas both US-95 and
SH-55 sections are in “Poor” condition. Based on the RI values, the two interstate sections
appear to be smoother than the two low-volume segments. The SH-55 segment has the
lowest RI value, indicating a relatively rough surface. However, note that based on ITD’s

33
threshold values, this segment is rated as “Fair” for roughness. As far as rutting is
concerned, the I-15 and US-95 segments are in “Fair” condition, whereas the I-84 and SH-
55 segments are in “Good” condition.
Pavement Structural Condition Assessment using DBPs
Once the functional conditions of the four pavement sections were established, the
next step involved using the DBPs to make inferences about their structural conditions, and
evaluate whether or not there was a link between the functional and structural condition
assessments. Results from these evaluation efforts are presented in the following
subsections.
Inferences Concerning the Entire Pavement Structure using DBPs
Deflection under the Load Plate (W0 or D0)
Deflection under the load plate (often expressed as W0 or D0) can be used as an
indicator for the overall structural condition of the entire pavement structure. Note that all
deflection data presented in this paper have been normalized to a load value of 53.37 kN
(12000 lb) as is the practice in the state of Idaho. Figure 2-6 shows the variation in the D0
magnitude with mile post for the four roadway segments. Note that all DBP graphs in this
manuscript have been plotted using both English and SI units on two vertical axes.
However, threshold values corresponding to particular DBPs have been marked on the
graphs using the unit originally used by the developers. For example, threshold values for
D0 have been given by Horak (2008) using SI units, and have been marked on Figure 2-6
accordingly. Based on the trends presented in Figure 2-6, both the interstate highway
segments (I-15 and I-84) appear to be in sound structural condition. This is expected as
interstate highway pavements are usually designed targeting high structural capacity. The

34
other two highway segments on the other hand, exhibited significantly higher D0 values
(average D0 value ≈ 700 µm). Based on the D0 values, portions of the roadway segments
extended into “severe” structural condition, thus highlighting the need for immediate
structural rehabilitation. At this point, a comparison can be made between results from the
visual distress survey, and inferences based on the D0 values. As listed in Table 2-6, the
Cracking Index values for the US-95 and SH-55 section indicated “poor” surface condition.
This is directly translated to the D0 values for these two segments that indicate “warning”
to “severe” structural conditions.
(a) I-15 (b) I-84
0 1 2 3 4 5 6 7
0
10
20
30
40
50
60
Std. Mile Post (miles)
D0(m
ils)
Sound Zone
Warning Zone
Severe Zone
0
200
400
600
800
1000
1200
1400
1600
D0(
m)
0 1 2 3 4 5 6 7 8 9
0
10
20
30
40
50
60
Std. Mile Post (miles)
D0(m
ils)
Sound Zone
Warning Zone
Severe Zone
0
200
400
600
800
1000
1200
1400
1600
D0(
m)
0 1 2 3 4 5 6 7 8 9 10 11
0
10
20
30
40
50
60
Std. Mile Post (miles)
D0(m
ils)
Sound Zone
Warning Zone
Severe Zone
0
200
400
600
800
1000
1200
1400
1600
D0(
m)
0 1 2 3 4 5 6
0
10
20
30
40
50
60
Std. Mile Post (miles)
D0(m
ils)
Sound Zone
Warning Zone
Severe Zone
0
200
400
600
800
1000
1200
1400
1600
D0(
m)

35
(c) US-95 (d) SH-55
Figure 0-6: Deflection at the Center of the Loading Plate (D0) for the Selected
Pavement Sections (a) I-15, (b) I-84, (C) US-95, (d) SH-55
Inferences Concerning the Upper Pavement Layers
Surface Curvature Index (SCI)
The Surface Curvature Index (SCI) calculated as the difference between the
deflections measured at the center of the load plate to that at a distance of 305 mm (12 in.)
can be used as an indicator of the structural quality of the upper layers (asphalt layer in
particular) of the pavement system (Kim et al. 2000). Note that small SCI values indicate
structurally sound upper layers in the pavement structure Figure 2-7 shows the SCI values
for the four selected pavement sections. From the Figure 2-7, the upper layers in both I-84
and I-15 segments appear to be in good condition, with the I-84 section being in relatively
better condition (no data point above 127 µm or 5.0 mils). This is in direct agreement with
trends observed from the Cracking Index (CI) values; based on the CI values, the I-15
section was rated as “fair” whereas the I-84 section was rated as “good”. Note that the other
pavement performance indicators such as the IRI value, Roughness Index (RI), and Rut
Depths exhibit the same trend, indicating that the upper layers of the I-84 segment are in
comparatively better condition than those for the I-15 segment. Therefore, the SCI value
when used as a structural quality indicator for the asphalt layer, leads to similar inferences
as extracted from the visual distress survey data.
SCI values for the US-95 and SH-55 segments indicate “poor” to “very poor”
condition of the upper layers. As shown in Figure 2-7-c, SCI values for the US-95 segment
increase significantly after standardized milepost 6.5. Close inspection of the visual distress
survey database indicated that this section of the roadway segment exhibited excessive

36
surface cracking compared to the other sections. Therefore, trends observed from the SCI
could be directly corroborated from field data, and clearly indicated an asphalt layer in
“poor” to “very poor” structural condition. At this point it is important to note that from
the numerical modeling verification effort, the SCI values did not directly correspond to
typical modulus values observed for HMA layers in practice.
Base Layer Index (BLI)
The Base Layer Index (BLI) is numerically identical to the SCI. However, per the
South African standard (Horak 2008; Horak et al. 2015), the BLI value is used as an
indicator of the structural condition of the base layer. Combining the two conventions, it
can be said that the BLI (or SCI) value indicates the structural condition of the upper layers
of the pavement structure, which in turn is related to the nature of stress dissipation by the
upper layers. Different threshold values are used for the SCI and the BLI as the inferences
concern different layers within the pavement structure. Figure 2-7, presents both SCI and
BLI values (numerically identical) for the four pavement sections under consideration.
Threshold values used in the US (Chang et al. 2014) have been marked on primary ordinate
axis, whereas threshold BLI values used in South Africa (to make inferences about the base
layer) have been presented along the secondary ordinate axis. As seen from the Figure 2-
7, the base layers for I-15 and I-84 segments appear to be structurally sound whereas those
for the US-95 and SH-55 segments appear to be in need of rehabilitation. As already
mentioned, the I-84 section comprises a cement-stabilized base layer whose effect gets
directly reflected through the low BLI values.

37
(a) I-15 (b) I-84
(c) US-95 (d) SH-55
Figure 0-7: Surface Curvature Index (SCI) / Base Layer Index (BLI) Values for the
Selected Pavement Sections Showing the Threshold Ranges Recommended by
Researchers in the US as well as in South Africa: (a) I-15, (b) I-84, (C) US-95, (d) SH-
55
Inferences Concerning Intermediate Pavement Layers
Middle Layer Index (MLI)
The Middle Layer Index is used as an indicator of the structural quality of the
subbase/subgrade layer. In absence of detailed information about the pavement layer
configuration, the MLI value can be used to make inferences about the intermediate and
lower pavement layers. As before, MLI values for the I-15 and I-84 segments indicate
structurally sound subbase/subgrade layers, whereas the data for US-95 and SH-55
segments indicate underlying layers in need of repair (see Figure 2-8).

38
(a) I-15 (b) I-84
(c) US-95 (d) SH-55
Figure 0-8: Middle Layer Index (MLI) Values for the Selected Pavement Sections (a)
I-15, (b) I-84, (C) US-95, (d) SH-55
Inferences Concerning Lower Pavement Layers
Base Curvature Index (BCI)
The Base Curvature Index (BCI) is used as an indicator of base quality per the
conventions used in the US. Kim et al. (2000) observed that BCI was a good indicator of
subgrade quality. BCI values calculated for the four selected roadway segments have been
plotted in Figure 2-9. As shown in the figure, the base layers for the I-15 and I-84 segments
appear to be in “good” or “very good” condition. Parts of the base along the SH-55 segment
appear to be in “poor” condition. However, a larger portion of the base along US-95

39
appears to be in structurally worse condition compared to the SH-55 section. Once again,
this matches with the observation that the base layer along SH-55 is more consistent in
thickness compared to that for US-95. As already mentioned, this may be a result of
increased subgrade intrusion into the base layer along the US-95 segment.
(a). I-15 (b). I-84
(c). US-95 (d). SH-55
Figure 0-9: Base Curvature Index (BCI)/ Lower Layer Index(LLI) Values for the
Selected Pavement Sections (a) I-15, (b) I-84, (c) US-95, (d) SH-55
Lower Layer Index
The Lower Layer Index (LLI) is numerically identical to the BCI, and is used to
make inferences about structural condition of the subgrade layer. Figure 2-9, shows the
LLI values for the four roadway segments along with the threshold levels separating the
“sound”, “warning”, and “severe” zones. As observed from the other DBPs, the subgrade

40
layers for the interstate highway segments appear to be in significantly better condition
compared to the US-95 and SH-55 roadway segments. The subgrade for SH-55 appears to
be in relatively better condition compared to that for US-95.
Deflection under the 7th Sensor (W60 or D60)
Deflection under the 7th sensor, often denoted as W60 or D60 can be used as an
indicator of subgrade condition. This stems directly from the nature of stress distribution
in flexible pavements, where upper layers in the pavement structure affect the surface
deflection at locations relatively close to the point of load application. Moving radially
away from the load, the surface deflection is governed to a large extent by properties of the
subgrade layer. It is therefore common practice to use the surface deflection recorded by
the 7th sensor (at a distance of 1524 mm from the center of the loading plate) as an indicator
of the structural condition of the subgrade layer.
Based on the D60 values (see Figure 2-10), the US-95 and SH-55 segments are in
significantly worse condition compared to the I-15 and I-84 sections. Furthermore, the
subgrade along the SH-55 segment appears to be in relatively better condition compared to
that along US-95. This is in direct agreement with the R-value trends as well as the
inference regarding lower subgrade intrusion along the SH-55 segment. Interestingly, the
D60 trace for I-84 shows two distinct “spikes” near standardized milepost values 0.25 and
3.0. Close inspection of site conditions indicated that these two locations corresponded to
two underpasses. The structural discontinuity caused by the underpasses somehow resulted
in very high D60 values for these two locations. This may even be due to excessive
vibrations of the geophone caused by stress wave reflections from the near-by structure.
Nevertheless, the primary observations from the D60 plots concern the distinctively worse

41
subgrade conditions for US-95 and SH-55 compared to the two interstate highway
segments.
(a). I-15 (b). I-84
(c). US-95 (d). SH-55
Figure 0-10: Deflection Measured by the 7th Sensor (D60) for the Selected Pavement
Sections (a) I-15, (b) I-84, (C) US-95, (d) SH-55
Implementation as a Network-Level Pavement Rehabilitation Selection Approach
As already mentioned, surface distresses observed from the visual distress surveys
could be directly linked to the structural condition of individual pavement layers through
the use of DBPs. The DBPs essentially capture the shape of the deflection basin, which is
a function of the load distribution characteristics of the pavement structure. Use of the
42
DBPs can help engineers identify problematic layers within a pavement structure to
facilitate the selection of appropriate rehabilitation methods. This phenomenon can be
clearly illustrated by taking examples of the I-15 and US-95 segments analyzed in the
current research effort. Both the I-15 and US-95 segments were classified as “Good” per
the Roughness Index (RI) criterion, and “Fair” per the Rutting criterion. The I-15 segment
was classified as “Fair” based on the Cracking Index value, whereas the US-95 segment
was classified as “Poor” based on the CI value (see Table 2-6). This information may lead
an engineer to infer that the surface layer in US-95 is problematic, and hence pavement
resurfacing may appear to be a reasonable approach to improve the pavement condition.
However, detailed analysis of the DBPs clearly indicated that the base and subgrade layers
along the US-95 segment were in “poor” structural condition, and hence rehabilitation
activities along this roadway segment should target improvement of the underlying layers.
More importantly, this information could be extracted without the need for backcalculation
of layer moduli from the FWD data. This is particularly advantageous for in-service
pavements for which detailed layer thickness data may not be readily available. With the
advent of modern FWD equipment capable of testing several miles of road segments per
day without significantly affecting the traffic flow conditions, collection of network-level
FWD data is now common practice among state and local transportation agencies. This
data can be used for “quick calculation” of the DBPs, which can then be matched against
standard threshold values to assess the structural conditions of individual pavement layers.
Such a rapid, reliable, and cost-effective analysis approach will help engineers with
educated decisions on pavement rehabilitation method selection.

43
Summary and Conclusions
This paper presented findings from on ongoing research study at Boise State
University focusing on the development of a network-level pavement rehabilitation
selection approach based on the analysis of visual distress survey data and calculation of
Deflection Basin Parameters (DBPs) from Falling Weight Deflectometer (FWD) test data.
First, a numerical modeling effort was carried out to mechanistically verify the validity of
different DBPs, and their typical threshold values recommended by researchers. A total of
216 pavement sections were analyzed by assigning a range of modulus values to the HMA,
base, and subgrade layers. Results from the numerical modeling effort indicated that
typically used DBP threshold values for the base and subgrade layers were in general
agreement with typical ranges of layer moduli observed in practice. However, the DBP
corresponding to the surface layer (Surface Curvature Index or SCI) was significantly
affected by moduli of the underlying layers, and therefore, cannot be used as the primary
indicator of surface layer conditions.
This was followed by detailed structural and functional evaluation of four different
roadway segments across the state of Idaho. The objective was to assess whether or not
combined use of DBPs along with the functional condition data will facilitate better
understanding of different pavement layer conditions. Integrated analysis of the visual
distress data and the DBPs could accurately identify problematic layers within a pavement
section. The primary advantage of this method based on the analysis of DBPs is that it does
not rely on pavement layer thickness data. Adopting this unified assessment approach, the
research team successfully recommended suitable rehabilitation methods to the Idaho
Transportation Department (ITD). Continued work along this line can facilitate integration
44
of this assessment method into the network-level pavement maintenance program in Idaho
to facilitate effective and economical pavement preservation practices.
References
AASHTO Guide for Design of Pavement Structures 1993, Published by the American, 7
Association of State Highway and Transportation Officials, Washington DC, 1993
ABAQUS. ABAQUS Documentation, Dassault Systèmes, Providence, RI, USA. (2015)
Carvalho, R., R. Stubstad, R. Briggs, O. Selezneva, E. Mustafa, and A. Ramachandran.
(2012) "Simplified Techniques for Evaluation and Interpretation of Pavement
Deflections for Network-Level Analysis". Report No. FHWA-HRT-12-023, Office
of Infrastructure Research and Development, Federal Highway Administration.
Chang, C. M., D. Saenz, S. Nazarian, I. N. Abdallah, A. Wimsatt, T. Freeman, and E. G.
Fernando. (2014) "TxDOT Guidelines to Assign PMIS Treatment Levels". Report
No. FHWA/TX-14/0-6673-P1, Texas Department of Transportation, Austin, TX.
Donovan P. R., (2009), “Analysis of Unbound Aggregate Layer Deformation Behavior
from Full Scale Aircraft Gear Loading with Wander” (Doctoral dissertation),
University of Illinois at Urbana-Champaign, Urbana, Illinois,2009
Duncan, J. M., Monismith, C. L., and Wilson, E. L. (1968). “Finite Element Analyses of
Pavements.” Highway Research Record 228, TRB, National Research Council,
Washington, D.C., pp. 18-33.
Gopalakrishnan, K., and M. R. Thompson. (2005) "Use of Deflection Basin Parameters to
Characterize Structural Degradation of Airport Flexible Pavements". In
Proceedings of the ASCE Geo-Institute and Geosynthetics 2005 Congress, 2005,
pp. 1-15.
Horak, E. (2008) "Benchmarking the Structural Condition of Flexible Pavements with
Deflection Bowl Parameters". Journal of the South African Institution of Civil
Engineering, Vol. 50, No. 2, 2008, pp. 2-9.

45
Horak, E. (1987) "Aspects of Deflection Basin Parameters Used in a Mechanistic
Rehabilitation Design Procedure for Flexible Pavements in South Africa". Ph.D.,
Civil Engineering, University of Pretoria
Horak, Emile; Emery, S. and Maina, J. (2015) “Review of Falling Weight Deflectometer
Deflection Benchmark Analysis on Roads and Airfields”, Conference on Asphalt
Pavement for South Africa (CAPSA-2015), Sun City, South Africa
Huang, Y.H., (2004) “Pavement analysis and design”, 2nd Edition, Accession Number:
01384968; Record Type: Publication; Source Agency: ARRB Group Ltd. ISBN:
0131424734 (book); Files: ATRI. https://trid.trb.org/view/1152727
ITD (2011) "Pavement Rating Manual 2010", https://itd.idaho.gov/highways/docs/
ITD%20Pavement%20Rating%20Manual%202011.pdf.
ITD. (2014) "Idaho Transportation System Pavement Performance Report", Previously
at:https://itd.idaho.gov/newsandinfo/docs/pm/ITD%202014%20Performance%20
Report.pdf.
ITD Pathway Website. http://pathweb.pathwayservices.com/idaho. Accessed 30 July 2016.
Kim, Y. R., S. R. Ranjithan, J. D. Troxler, and B. Xu. (2000) "Assessing Pavement Layer
Condition Using Deflection Data". Report No. NCHRP 10-48, National
Cooperative Highway Research Program, Transportation Research Board, National
Research Council. http://onlinepubs.trb.org/onlinepubs/nchrp/docs/NCHRP10-
48_FR.pdf
Kim, M (2007) “Three Dimensional Finite Element Analysis of Flexible Pavements
Considering Nonlinear Pavement Foundation Behavior”, PhD, Dissertation,
University of Illinois at Urbana-Champaign, 2005 http://ict.illinois.edu/files/
2014/09/Minkwan_Kim_Dissertation.pdf
Mehta, Y., & Roque, R. (2003). “Evaluation of FWD data for determination of layer
moduli of pavements”. Journal of Materials in Civil Engineering, 15(1), 25-31.
Paterson, W. (1986) "International roughness index: Relationship to other measures of
roughness and riding quality". Transportation Research Record, No. 1084, 1986.

46
Talvik, O., and A. Aavik. (2009) "Use of FWD deflection basin parameters (SCI, BDI,
BCI) for pavement condition assessment". The Baltic Journal of Road and Bridge
Engineering, Vol. 4, No. 4, 2009, pp. 196-196.
Tarefder, R.A., M.U. Ahmed,(2013), “Modeling of the FWD Deflection Basin to Evaluate
Airport Pavements”, International Journal of Geo-mechanics DOI:
10.1061/(ASCE)0899-1561(2003)15:1(25)
Uddin, W., Zhang D. and Fernandez F., (1994) “Finite Element Simulation of pavement
Discontinuities and Dynamic Load Response” Transportation Research Record
Issue Number: 1448 Publisher: Transportation Research Board ISSN: 0361-1981
Xie, Z., J. Shen, Z. Guo, & L. Cong (2015). Effect of Distresses on Deflection Basins and
Backcalculation Modulus of Asphalt Pavement with Cement-Treated Base.
International Journal of Pavement Research & Technology, 8(4), 283-288.
doi:10.6135/ijprt.org.tw/2015.8(4).283

47
MANUSCRIPT TWO – USE OF POLYMER GROUTING TO REDUCE
DIFFERENTIAL HEAVE IN PAVEMENTS OVER EXPANSIVE SOILS2
Abstract
Flexible pavement sections constructed over expansive soil deposits often undergo
significant damage due to the volume changes in the underlying soil strata. In cases where
expansive soil deposits are confined to shallow depths, conventional rehabilitation methods
such as pre-wetting, chemical stabilization, removal and replacement, etc. can be pursued.
However, such treatment strategies become impractical in cases where the expansive soil
deposit lies more than 1 m (3 ft.) underneath the pavement surface. In such cases,
implementation of alternative remedial measures are desired to dissipate the soil-generated
swelling stresses. A recently completed research study at Boise State University
investigated the differential heaving problem along a particular section of US-95 near the
Idaho-Oregon border. Laboratory characterization of soil samples indicated the presence
of highly expansive soils up to depths of 7.6 m (26 ft.) from the pavement surface. Through
subsequent numerical modeling efforts, a hybrid geosynthetic system comprising geocells
and geogrids was recommended for implementation during pavement reconstruction. A
follow-up research study has focused on evaluating the suitability of polyurethane grout
injection as a potential remedial measure for this pavement section. Laboratory testing of
2 This chapter includes results already reported in the following publication. Contribution of the
coauthors is sincerely acknowledged: Rabbi, M. F., Boudreau, R. L., Chittoori, B., Sotirin, M., and Mishra,
D. (2018). “Use of Polymer Grouting to Reduce Differential Heave in Pavements over Expansive Soils”.
Submitted to the Ground Improvement Journal (Under Review)
48
unbound materials treated with a High-Density Polyurethane (HDP) indicated significant
improvements in resilient modulus and shear strength properties. Finite Element (FE)
modeling of the problematic pavement section indicated that depending on the treated layer
thickness, the differential heave magnitude can be reduced by up to 75% compared to
untreated sections. For the particular section of US-95 studied, 25-38% reduction in
differential heaving can potentially be achieved through polyurethane grout injection
shapes.
Key Words: Expansive Soils, Polyurethane Grout Injection, High-Density, Polyurethane
(HDP), Differential Heave, Finite Element Modeling
Introduction
A study sponsored by the National Science Foundation (NSF) reported that every
year maintenance/rehabilitation costs associated with infrastructure damage due to
expansive soils are significantly higher than other natural disasters such as floods and
earthquakes (Jones Jr and Holtz 1973). The yearly cost of damage was reported to be
approximately $2.3 billion (Gromko 1994). Besides repairs to structures damaged by
expansive soils, maintenance and rehabilitation efforts also focus on soil
stabilization/treatment to address the root cause(s) of the problem. Common approaches
involve chemical stabilization, pre-wetting, removal and replacement, etc. However, such
treatment alternatives become impractical in cases where the expansive soil deposit extends
beyond 1 m (3 ft.) from the surface. Exposing soil layers that are deeper than 1 m (3 ft.)
from the surface for treatment/replacement can be extremely uneconomical. In such
scenarios, in-situ stabilization alternatives need to be explored. For flexible pavement
sections constructed over expansive soil deposits, polyurethane grout injection can be a

49
viable treatment alternative to reduce recurrent differential heaving and cracking of the
surface. A recently completed research study at Boise State University evaluated the
effectiveness of polyurethane grout injection as an alternative remedial measure to address
the problem of recurrent pavement damage in flexible pavements constructed over
expansive soil deposits. If found effective, the injection of High-Density Polyurethanes
(HDPs) can be particularly useful as it does not require removal of the existing pavement
layers. Injection of HDPs into existing pavement layers has the potential to result in the
formation of a “flexible layer” (through polyurethane-soil or polyurethane-aggregate
mixing) that can uniformly dissipate the swell pressures from the underlying soil layers.
Background and Problem Statement
A recently completed research study at Boise State University (sponsored by the
Idaho Transportation Department, ITD) investigated the problem of recurrent differential
heaving along a particular section of US-95 near the Idaho-Oregon border. Constructed
over an expansive soil deposit, this roadway section has been experiencing recurrent
pavement damage over the past several decades. Several rehabilitation and reconstruction
efforts have been carried out over the years with limited or partial success. Extensive
laboratory characterization of soil samples collected from underneath the problematic
roadway section indicated very high Montmorillonite contents. Moreover, the expansive
soil deposit often extended up to depths of beyond 7.6 m (26 ft.) from the pavement surface.
Presence of the expansive soil deposit at such depths renders the application of
conventional stabilization methods impractical. Through numerical modeling efforts, the
research team recommended a hybrid geo-synthetic system (comprising geogrids and
geocells) for placement within the base layer during pavement reconstruction efforts. The
50
hybrid geosynthetic layer was found to be able to uniformly dissipate the soil-generated
swelling pressures, thereby reducing damage caused to the pavement surface (Chittoori et
al. 2016a; Chittoori et al. 2018). Large-scale box testing in the laboratory exhibited
considerably reduced differential heave magnitudes when the unbound base layer was
reinforced using the hybrid geosynthetic system (Tamim 2017). A subsequent research
effort has focused on evaluating the suitability of polyurethane grout injection as a potential
nondestructive remedial measure to address the recurrent surface damage along this
particular roadway section. Laboratory testing and numerical modeling were carried out to
quantify the effect of polyurethane grout injection on the magnitude of differential heave
observed at the pavement surface. Findings from this research effort are documented in
this manuscript.
Research Objectives and Tasks
The primary objective of this research effort was to evaluate the effectiveness of
polyurethane grout injection as an alternative “nondestructive” remedial measure for
differential heave mitigation. The research task was divided in two phases. In phase-I,
laboratory testing was carried out to evaluate the effect of High-Density Polyurethane
(HDP) injection on the mechanical properties of unbound aggregates and expansive soils.
The laboratory testing involved: (1) resilient modulus testing, and (2) rapid shear strength
testing. Moreover, visual inspection of the specimens was carried out to assess the extent
of HDP permeation for different injection procedures. In total, three types of base materials
and one type of expansive soil were tested in the laboratory. The laboratory testing was
designed to address two primary research questions: (1) Can uniform permeation of the
HDP into the soil and aggregate specimens be accomplished in a laboratory setting? and

51
(2) Does the HDP have a significant effect on the mechanical properties (resilient modulus
and shear strength) of the unbound materials? The primary challenge during the laboratory
testing effort involved preparing HDP-treated aggregate and soils samples in a manner that
was representative of actual field conditions. As no specifications or guidelines were
available to prepare polyurethane-treated aggregate and soil specimens, three different
methods of specimen preparation were investigated. Phase-II of the study involved
numerical modeling of flexible pavement sections constructed over expansive subgrade
layers. The first step in the numerical modeling process was to simulate the differential
heaving induced in flexible pavements due to moisture infiltration into the expansive soil
deposits. The next step involved simulating flexible pavement sections comprising
polyurethane-stabilized base and subgrade layers. Model-predicted results were compared
to quantify the effects of HDP injection into the base and expansive subgrade layers.
Review of Published Literature
Although several researchers have studied the effect of polyurethane injection on
unbound layer performance under traffic (vehicular and railway) loading, very limited
research initiatives have focused on studying the behavior of polyurethane-treated layers
under upheaval pressures originating from expansive soils. The success of polyurethane
grout injection into soil/aggregate layers is strongly dependent on the extent of permeation
of the HDP into the material being treated. Generally, the HDP spreads easily within
aggregate base layers, and can create a stabilized layer that is relatively uniform and has
an increased modulus. Keene et al.(2012) reported that in coarse grained aggregates like
ballast, the polymer can permeate easily through the void space during injection and
expansion, and can form a uniform geo-composite layer. However, the effect of

52
polyurethane grout injection on low-permeability clayey soil behavior is not very well
understood. Sasaki (Sasaki 2008) reported that generation of a homogeneous polymer-
treated samples is almost impossible. He also found that polymer grout can propagate for
distances of more than a meter through voids in dried expansive clay soil. Due to this
propagation of polymer grout in the soil the permeability of treated soil decreases (Sasaki
2008). As the swelling behavior is directly related to moisture permeation into the soil,
reduced permeability can contribute towards a reduction in swelling potential. Buzzi et al.
(Buzzi, Fityus and Sloan 2010) found, both through laboratory and field experiments, that
the swelling potential of an expansive soil is reduced upon treatment with polymer grout.
Furthermore, it was also reported that the yield stress of expansive soils increased
significantly upon polymer treatment. However, the above-mentioned benefits are
contingent upon ‘proper’ dispersion of the HDP within the layer being treated. Several
small- and large-scale testing initiatives have focused on studying the permeation of HDP
within aggregate/soil layers. Some laboratory studies mentioned that injected polyurethane
grout can permeate easily in coarse materials, whereas others reported that injection into
fine materials/cracked soil contributes towards filling up of the cracks without significantly
affecting the rest of the soil (Sasaki 2008; Yu 2013; Getzlaf 2006; Mark et al. 2010) .Figure
3-1-a (Stephens and Honeycutt, Online Documentation) shows that the polyurethane
treatment results in the formation of a relatively continuous composite layer, whereas
Figure 3-1-b shows an instance of non-uniform permeation of the grout. The following
sections present details about the laboratory testing effort carried out under the scope of
the current study to quantify the effect of polyurethane grout injection into aggregate and
soil specimens.

53
(a) (b)
Figure 0-1: Photographs Showing: (a) Comparatively Uniform Dispersion of
Polymer; and (b) Non-Uniform Disperse of Polymer (Stephens and Honeycutt, Online
Documentation)
Laboratory Testing of Geomaterials
Three types of base/subbase materials were selected for laboratory characterization:
(1) Natural Sand (Sand); (2) Graded Aggregate Base (GAB); and (3) #57 Stone. The
expansive soil material tested was collected from underneath the problematic section of
US-95 near the Idaho-Oregon border. Extensive laboratory characterization of this soil was
conducted under the scope of another research study, and detailed results have been
published elsewhere (Chittoori et al. 2016; Islam 2017; Chittoori, Mishra and Islam 2018;
Tamin 2017). Liquid Limit (LL) values for this soil were found to range between 44% and
185%, with Plasticity Index (PI) values ranging between 25%-136%. Photographs of the
materials tested in the laboratory have been included in Figure 3-2.
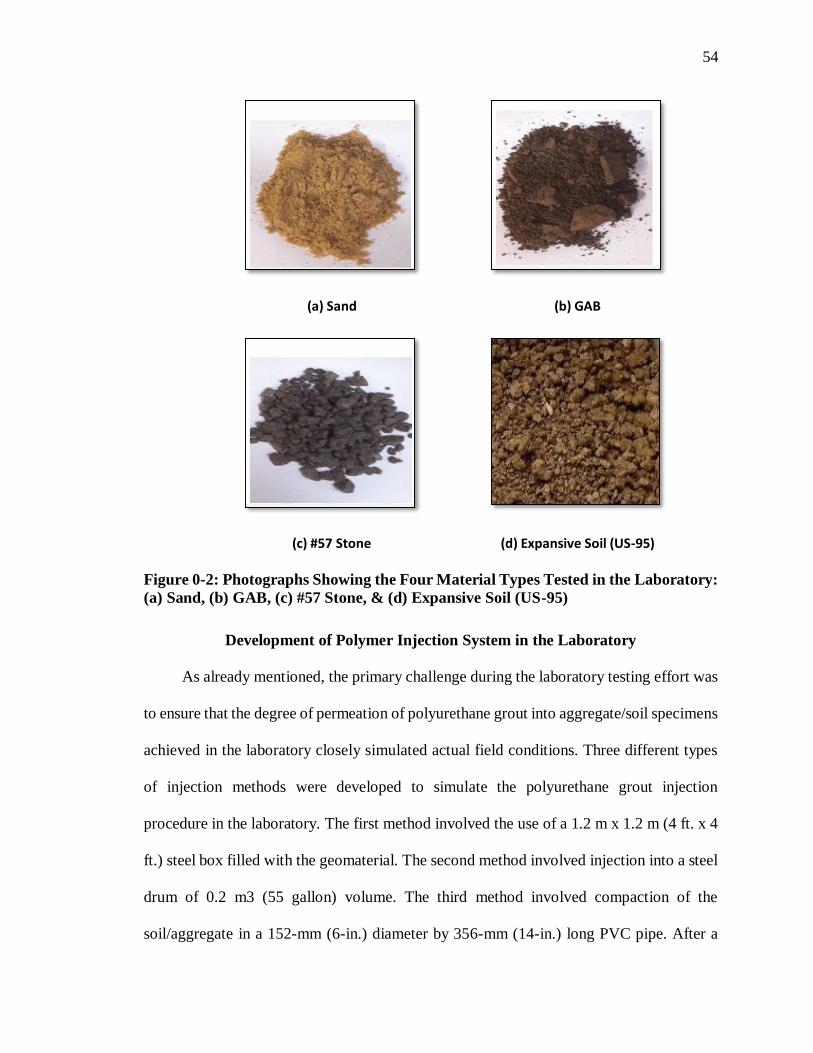
54
(a) Sand (b) GAB
(c) #57 Stone (d) Expansive Soil (US-95)
Figure 0-2: Photographs Showing the Four Material Types Tested in the Laboratory:
(a) Sand, (b) GAB, (c) #57 Stone, & (d) Expansive Soil (US-95)
Development of Polymer Injection System in the Laboratory
As already mentioned, the primary challenge during the laboratory testing effort was
to ensure that the degree of permeation of polyurethane grout into aggregate/soil specimens
achieved in the laboratory closely simulated actual field conditions. Three different types
of injection methods were developed to simulate the polyurethane grout injection
procedure in the laboratory. The first method involved the use of a 1.2 m x 1.2 m (4 ft. x 4
ft.) steel box filled with the geomaterial. The second method involved injection into a steel
drum of 0.2 m3 (55 gallon) volume. The third method involved compaction of the
soil/aggregate in a 152-mm (6-in.) diameter by 356-mm (14-in.) long PVC pipe. After a
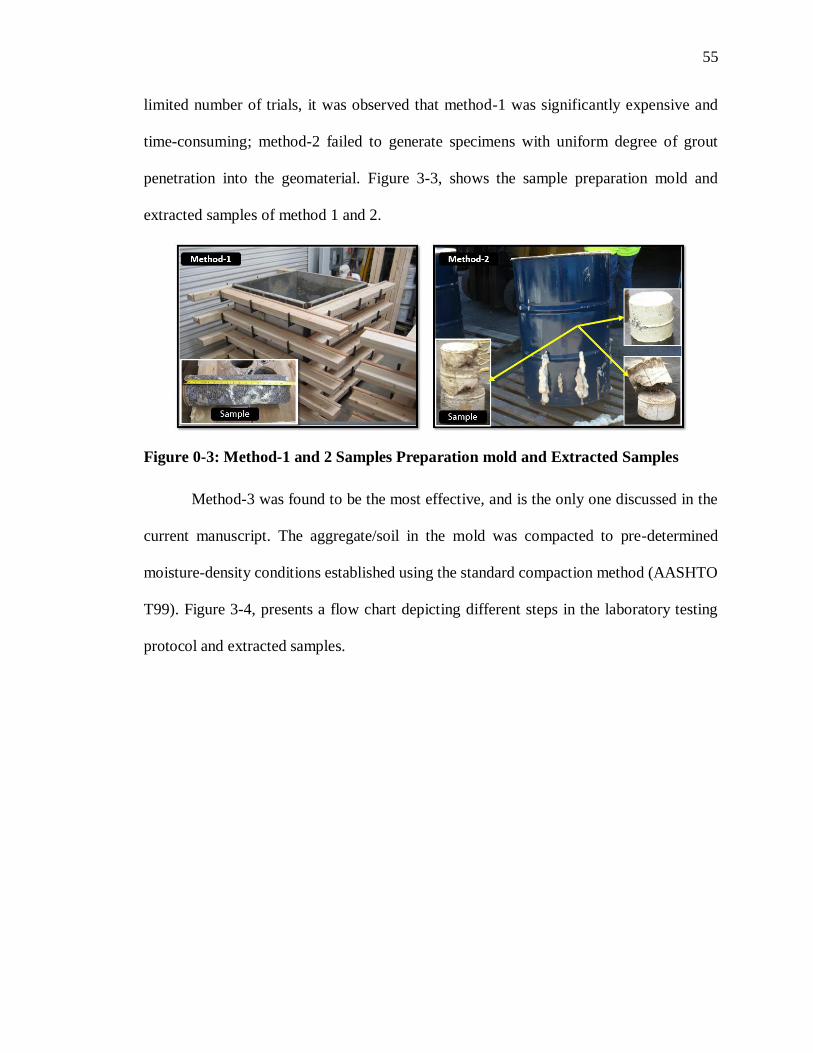
55
limited number of trials, it was observed that method-1 was significantly expensive and
time-consuming; method-2 failed to generate specimens with uniform degree of grout
penetration into the geomaterial. Figure 3-3, shows the sample preparation mold and
extracted samples of method 1 and 2.
Figure 0-3: Method-1 and 2 Samples Preparation mold and Extracted Samples
Method-3 was found to be the most effective, and is the only one discussed in the
current manuscript. The aggregate/soil in the mold was compacted to pre-determined
moisture-density conditions established using the standard compaction method (AASHTO
T99). Figure 3-4, presents a flow chart depicting different steps in the laboratory testing
protocol and extracted samples.

56
Figure 0-4: Flow Chart Depicting Different Steps in the Laboratory Testing Protocol
Effect of Polyurethane Grout Injection on the Mechanical Properties of Aggregates
and Soils
Triaxial testing was conducted in the laboratory to quantify the effect of polyurethane
grout injection on aggregate/soil resilient modulus and shear strength. Resilient modulus
testing was carried out per the AASHTO T-307 protocol; upon completion of the resilient
modulus testing, quick shear testing was carried out by subjecting the same specimen to a
controlled rate of axial deformation (1% axial strain per minute up to 5% strain). Results
from the laboratory tests are discussed in the following sections.
Resilient Modulus Test Results
Figure 3-5 shows the resilient modulus test results for both untreated and HDP-
treated base (Figure 3-5-a) and subgrade (Figure 3-5-b) materials. As seen from Figure 3-
5-a, HDP injection into the GAB and #57 Stone did not have a significant effect on the
resilient modulus values. However, pronounced increase in resilient modulus was observed
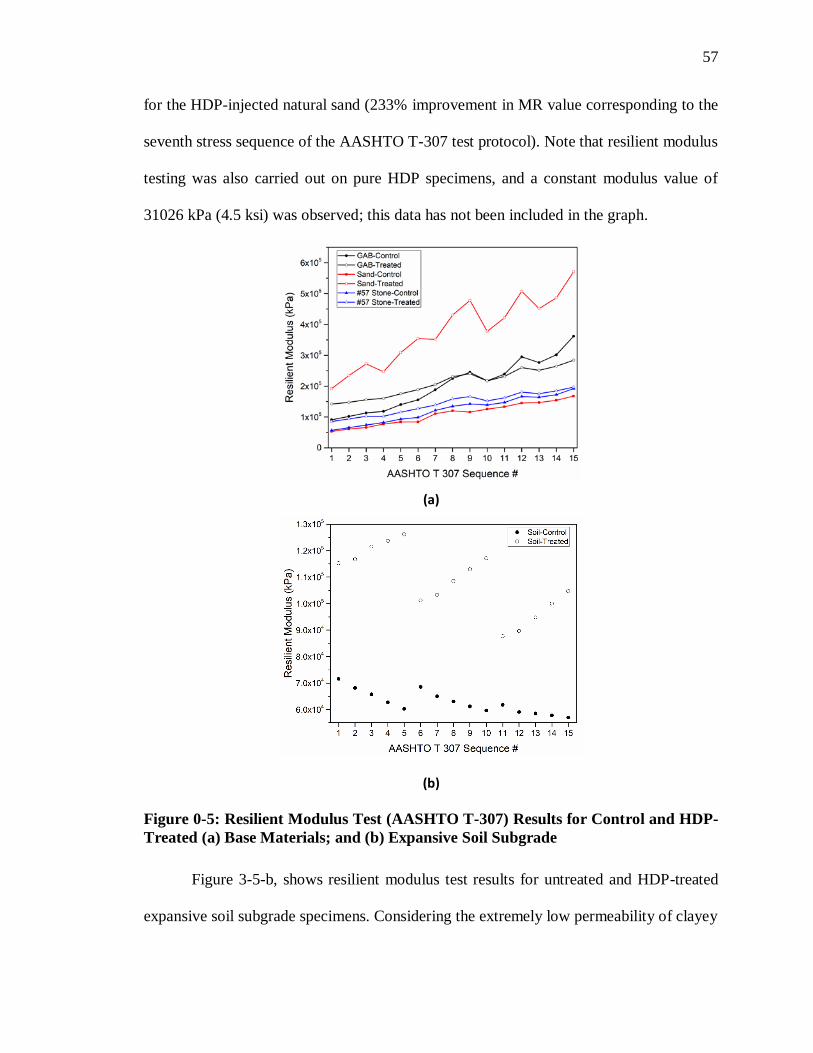
57
for the HDP-injected natural sand (233% improvement in MR value corresponding to the
seventh stress sequence of the AASHTO T-307 test protocol). Note that resilient modulus
testing was also carried out on pure HDP specimens, and a constant modulus value of
31026 kPa (4.5 ksi) was observed; this data has not been included in the graph.
(a)
(b)
Figure 0-5: Resilient Modulus Test (AASHTO T-307) Results for Control and HDP-
Treated (a) Base Materials; and (b) Expansive Soil Subgrade
Figure 3-5-b, shows resilient modulus test results for untreated and HDP-treated
expansive soil subgrade specimens. Considering the extremely low permeability of clayey

58
soils, the degree of grout penetration into clayey soil specimens is not likely to be the same
as that in aggregate specimens. Accordingly, a natural hypothesis would be that the grout
would contribute to densification of the expansive soil mass owing to the increased level
of confinement within the PVC tube. It was therefore of interest to quantify the level of
densification (and subsequent potential increase in stiffness) of the subgrade due to the
pressure exerted by the expanding polyurethane grout. Subgrade soil specimens for
resilient modulus testing were prepared following a procedure similar to that for the base
materials. Resilient modulus testing was carried out following AASHTO T-307 protocols.
Even though expansive soil specimens were significantly less permeable compared
to the base materials specimens, the HDP-treated soil sample showed considerably higher
resilient modulus values compared to the untreated specimens (see Figure 5-2-a). Three
replicate samples were tested in laboratory, and the results were considerably consistent
with a coefficient of variation of 10.7%. This indicated that the specimen preparation
approach developed in the laboratory led to repeatable specimen behavior under repeated
loading. Table 3-1 lists the summary modulus values (corresponding to a Bulk Modulus, θ
= 275.8 kPa during AASHTO T-307 testing) for all four materials under untreated and
HDP-treated conditions.
Table 0-1: Laboratory Test Results: Elastic Modulus Improvement
Geo Materials
Types
Resilient Modulus E, kPa (psi) PI* (%) Comments
Untreated Treated
GAB 221000 (32000) 221000 (32000) 0% No Change
Sand 124000 (18000) 413000 (60000) 233% Significant Change
#57 Stone 138000 (20000) 159000 (23000) 15% Minor Change
Subgrade 65000 (9427) 104000 (15084) 60% Considerable Change
*Note: PI is Percent Increase
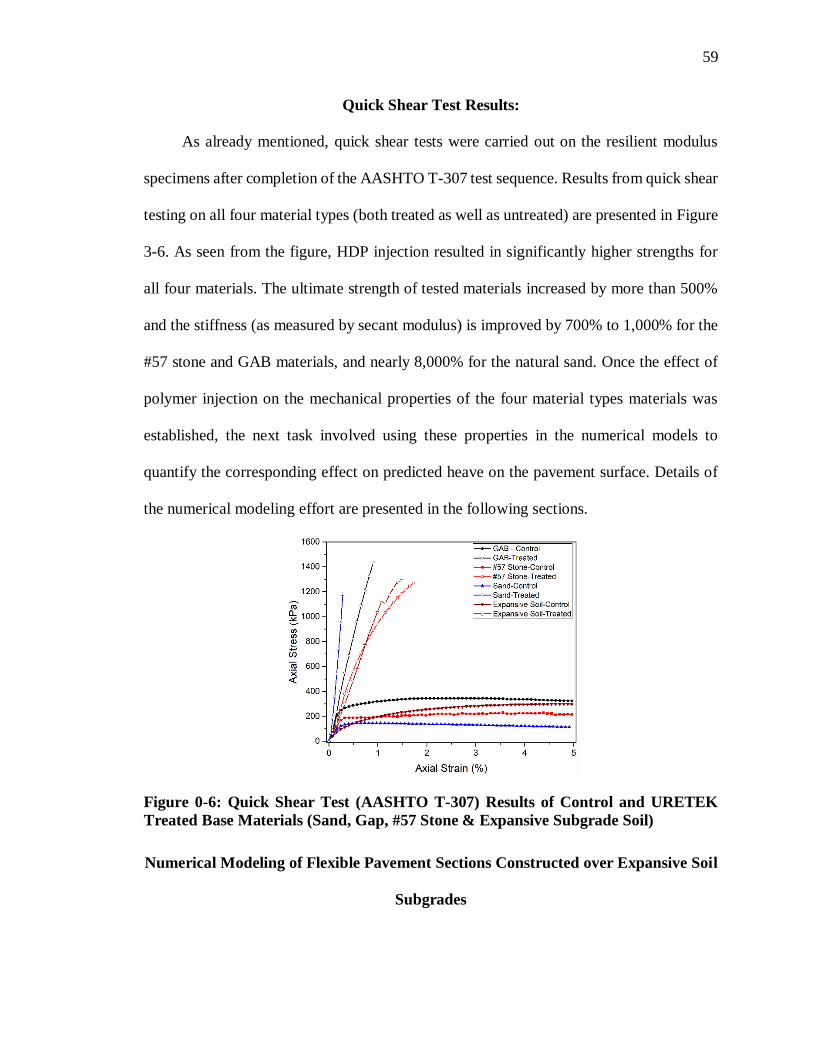
59
Quick Shear Test Results:
As already mentioned, quick shear tests were carried out on the resilient modulus
specimens after completion of the AASHTO T-307 test sequence. Results from quick shear
testing on all four material types (both treated as well as untreated) are presented in Figure
3-6. As seen from the figure, HDP injection resulted in significantly higher strengths for
all four materials. The ultimate strength of tested materials increased by more than 500%
and the stiffness (as measured by secant modulus) is improved by 700% to 1,000% for the
#57 stone and GAB materials, and nearly 8,000% for the natural sand. Once the effect of
polymer injection on the mechanical properties of the four material types materials was
established, the next task involved using these properties in the numerical models to
quantify the corresponding effect on predicted heave on the pavement surface. Details of
the numerical modeling effort are presented in the following sections.
Figure 0-6: Quick Shear Test (AASHTO T-307) Results of Control and URETEK
Treated Base Materials (Sand, Gap, #57 Stone & Expansive Subgrade Soil)
Numerical Modeling of Flexible Pavement Sections Constructed over Expansive Soil
Subgrades
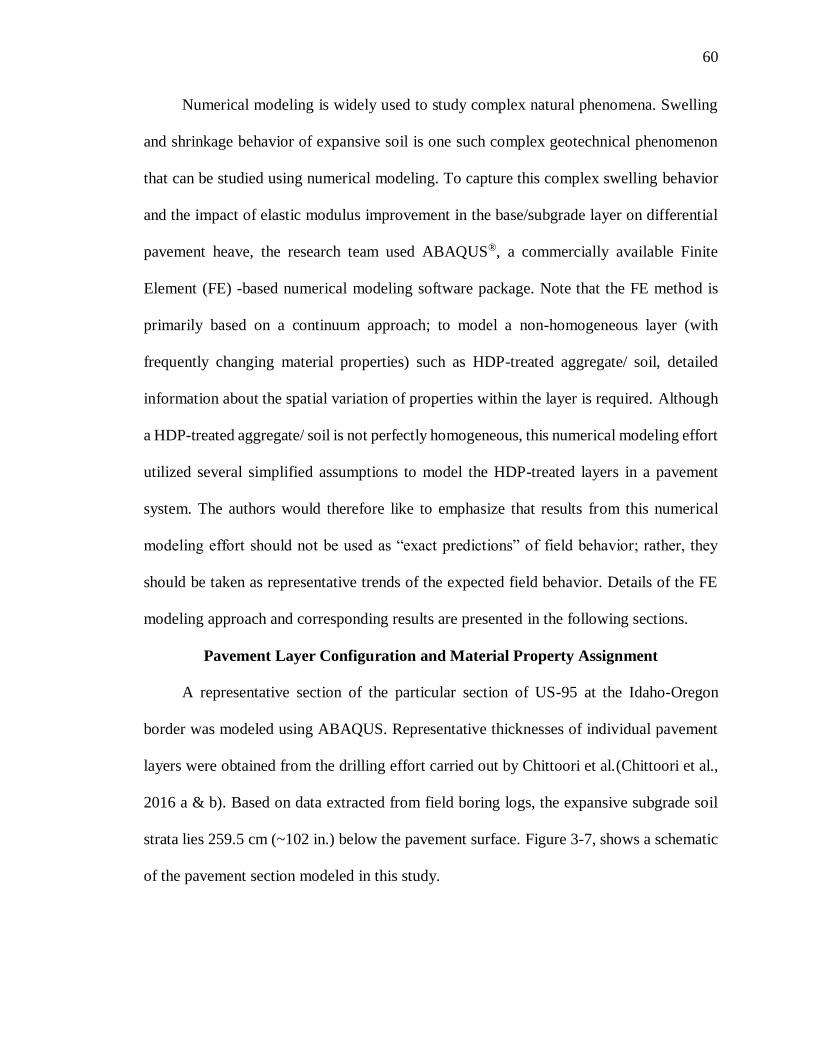
60
Numerical modeling is widely used to study complex natural phenomena. Swelling
and shrinkage behavior of expansive soil is one such complex geotechnical phenomenon
that can be studied using numerical modeling. To capture this complex swelling behavior
and the impact of elastic modulus improvement in the base/subgrade layer on differential
pavement heave, the research team used ABAQUS®, a commercially available Finite
Element (FE) -based numerical modeling software package. Note that the FE method is
primarily based on a continuum approach; to model a non-homogeneous layer (with
frequently changing material properties) such as HDP-treated aggregate/ soil, detailed
information about the spatial variation of properties within the layer is required. Although
a HDP-treated aggregate/ soil is not perfectly homogeneous, this numerical modeling effort
utilized several simplified assumptions to model the HDP-treated layers in a pavement
system. The authors would therefore like to emphasize that results from this numerical
modeling effort should not be used as “exact predictions” of field behavior; rather, they
should be taken as representative trends of the expected field behavior. Details of the FE
modeling approach and corresponding results are presented in the following sections.
Pavement Layer Configuration and Material Property Assignment
A representative section of the particular section of US-95 at the Idaho-Oregon
border was modeled using ABAQUS. Representative thicknesses of individual pavement
layers were obtained from the drilling effort carried out by Chittoori et al.(Chittoori et al.,
2016 a & b). Based on data extracted from field boring logs, the expansive subgrade soil
strata lies 259.5 cm (~102 in.) below the pavement surface. Figure 3-7, shows a schematic
of the pavement section modeled in this study.

61
Figure 0-7: Simplified Representative Pavement Section of US-95 Roadway
Material properties for the aggregates and soils (both for untreated as well as treated
conditions) used in this modeling effort were obtained from the laboratory test results. No
testing was conducted on the Hot-Mix Asphalt (HMA) layer, and therefore, representative
properties obtained from literature were used in the model. The HMA layer was modeled
as linear-elastic, whereas the untreated base and subgrade layers were modeled as elasto-
plastic (using the Mohr-Coulomb plasticity model). Expansive behavior of the subgrade
layer was modeled using sorption and swelling data established in the laboratory (Chittoori
et al, 2016 a & b; Islam 2017). For the moisture swelling model, the volume change
behavior of expansive subgrade soil was determined by volumetric swelling testing
(Chittoori et al. 2016 a & b; Islam 2017; Tamim 2017). The HDP-treated base and subgrade
layers were modeled as linear-elastic, which closely simulates the stress-strain behavior of
polyurethane grout-injected specimens tested in the laboratory. Material properties used in
the modeling are listed in Table 3-2.

62
Table 0-2: Materials Properties used in the Modeling: (a) Control Section; (b) HDP-
Treated Geomaterials
(a) Control Section
Properties HMA Sand GAB #57 Stone Expansive Subgrade
Mass Density, kg/m3(ρ lb/ft3 ) 2387(149) 1587(99) 2291(143) 1538(96) 1025(64)
Elastic Modulus, E, MPa(ksi) 5171(750) 124(18) 221(32) 138(20) 65(9.41)
Poisson’s Ratio, ν 0.3 0.35 0.35 0.35 0.4
Internal Angle of Friction, ϕ *** 30 40 40 10
Angle of Dilation, ψ *** 13 13 13 3
Cohesion, c’, kPa(psi) *** 2(0.29) 2(0.29) 2(0.29) 75(10.8)
(b) HDP-Treated Geomaterials
Properties Treated Sand Treated GAB Treated #57 Stone Treated
Subgrade
Mass Density, kg/m3(ρ lb/ft3) 1674(104.5) 2291(143) 1538(96) 1265(79)
Elastic Modulus, E, MPa(ksi) 414(60) 221(32) 159(23) 103(15)
Poisson’s Ratio, ν 0.35 0.35 0.35 0.35
Internal Angle of Friction, ϕ *** *** *** ***
Angle of Dilation, ψ *** *** *** ***
Cohesion, c’, kPa (psi) *** *** *** ***
The expansive behavior of a particular soil strata in the field is primarily affected
by: (1) mineralogical characteristics and swell potential of the soil; and (2) moisture access
conditions (governed by drainage and other geographic characteristics). Exact location of
the moisture access conditions in the field is prohibitively difficult to identify. Therefore,
a few simplified assumptions were made regarding the moisture boundary conditions for
the expansive soil layer. In this model, the entire subgrade layer was modeled as expansive,
but moisture access was limited to a certain pre-defined location. This leads to a localized
increase in moisture content which ultimately distributes within the subgrade layer based

63
on the laboratory-established permeability and suction properties (Chittoori et al. 2016 a &
b; Islam 2017). The resulting volume change in the subgrade layer causes differential
heaving on the pavement surface. The moisture access was limited to a 152 cm x 152 cm
(5 ft. x 5 ft.) region at the interface between the subgrade and the base (see Figure 3-8).
Note that details on how this dimension for the moisture source was established has been
presented elsewhere(Chittoori et al. 2016 a & b; Islam 2017); the primary objective was to
generate a model with surface heaving patterns similar to what was observed in the field.
Figure 0-8: Snapshot of the ABAQUS Model showing the Location and Dimension of
the Water Source
Initial saturation conditions, as well as soil-water characteristic curves for the
expansive soil were input into the model based on laboratory test results. Some of the soil
parameters required to model moisture flow through the expansive soil deposits are: (1)
initial void ratio (e0), (2) initial pore water pressure (U0), and (3) initial saturation level
(S0). More details on laboratory testing carried out to establish these properties can be
found elsewhere (Chittoori et al. 2016 a & b; Islam 2017).

64
Model Geometry Optimization
The thickness and properties of other layers present in the pavement structure can
significantly affect the differential heave. The mechanism of volume change experienced
by the expansive soil layer can be affected by the geologic formation surrounding it. A soil
layer that has sufficient room to expand will not cause significant damage to the
surrounding layers. However, moisture content change in a tightly confined expansive soil
layer can exert very high pressures on the adjacent layers. This is an important aspect to
consider while deciding on the model geometry to simulate pavement surface heaving due
to volume changes in the underlying expansive soil layer. During the modeling effort it
was observed that relative location of the fixed boundaries with respect to the water source
had a significant effect on the heave observed on the pavement surface. A sensitivity study
was first carried out to establish the dimensions of the model to closely simulate heaving
patterns observed in the field. Two types of dimensional optimization studies were carried
out: (1) to establish the optimal vertical (Y) dimension; and (2) to establish the optimal
horizontal (X and Z) directions. Figure 3-9, presents results from this geometry
optimization effort. The scatter plot in Figure 3-9, presents results from the vertical (Y)
dimension optimization, whereas the bar charts present results from the horizontal (X and
Z) dimension optimization. As seen from the figure, gradually increasing the subgrade
layer thickness from 3 m to 20 m had a significant effect on the predicted surface
displacement magnitudes. However, increasing the subgrade layer thickness beyond 20 m
did not have as significant an impact on the predicted surface displacements. Similarly,
increasing horizontal dimensions from 20 m to 30 m resulted in a reduction in the predicted
surface displacement at the center of the model from 10.5 cm to 9.0 cm. Once the model

65
dimension approached 50 m, the predicted surface displacement magnitudes stabilized.
Based on these results, the horizontal dimensions of the model were fixed at 50 m x 50 m.
The depth of the subgrade was fixed at 20 m.
Figure 0-9: Effect of Model Dimension on Predicted Maximum Surface Displacement
Element Selection and Mesh Optimization
The use of appropriate element type and mesh size is integral to ensure accurate
predictions from FE analyses. Element types used in this study to model different pavement
layers were selected based on the material properties being modeled. The HMA and base
layers were modeled using 8-noded, linear, hexahedral, reduced integration elements with
hourglass control (C3D8R in ABAQUS) (ABAQUS 2016). The expansive soil, on the
other hand, was modeled using 8-noded brick elements with trilinear displacement and
trilinear pore pressure (C3D8RP in ABAQUS). Note that the C3D8RP element has the
ability to simulate fluid flow through partially- or fully-saturated porous media (ABAQUS
2016).

66
In this modeling effort, the size of the FE mesh was optimized after several trial
analyses. Mesh size optimization was carried out based on predicted surface heave
magnitudes. Note that a biased-meshing approach was used to reduce the computational
time requirements. Each simulation with the fine mesh required approximately 48-65 hours
to run on a standard desktop computer with 20 GB RAM and a 3.6 GHz Intel® Xeon®
processor. Using the biased-mesh reduced this computational time requirement to
approximately 2 hours. A comparative study was undertaken to compare the model-
predicted results between a fine and a coarse mesh. A maximum difference of 5% was
obtained when the surface heaving magnitudes were compared. It was therefore concluded
that using a biased-mesh will not significantly affect the overall findings from this research
study. All results reported in this manuscript correspond to models with biased-meshes.
Effect of Polyurethane Grout Injection on Pavement Surface Heave
Results from FE modeling of pavement sections comprising HDP-treated
base/subgrade layers are presented in this section. Note that different analyses were carried
out to study the effect of HDP injection into the base layer or the subgrade layer. In either
case, it was assumed that strategic placement of the injection ports will result in a 61-cm
(2-ft.) thick composite layer generated by mixing of grout and soil/aggregate. Note that this
assumption is reasonable for cases where the HDP is injected into the base layer (high
permeability of the base layer ensures uniform permeation of the grout). However, in cases
where the HDP is injected into the subgrade layer, the assumption of uniform permeation
to generate a 61-cm (2-ft.) thick homogeneous layer is not very realistic. Nevertheless, this
simplifying assumption was made to simulate the effect of a localized increase in subgrade
modulus on the differential heave observed on this surface.
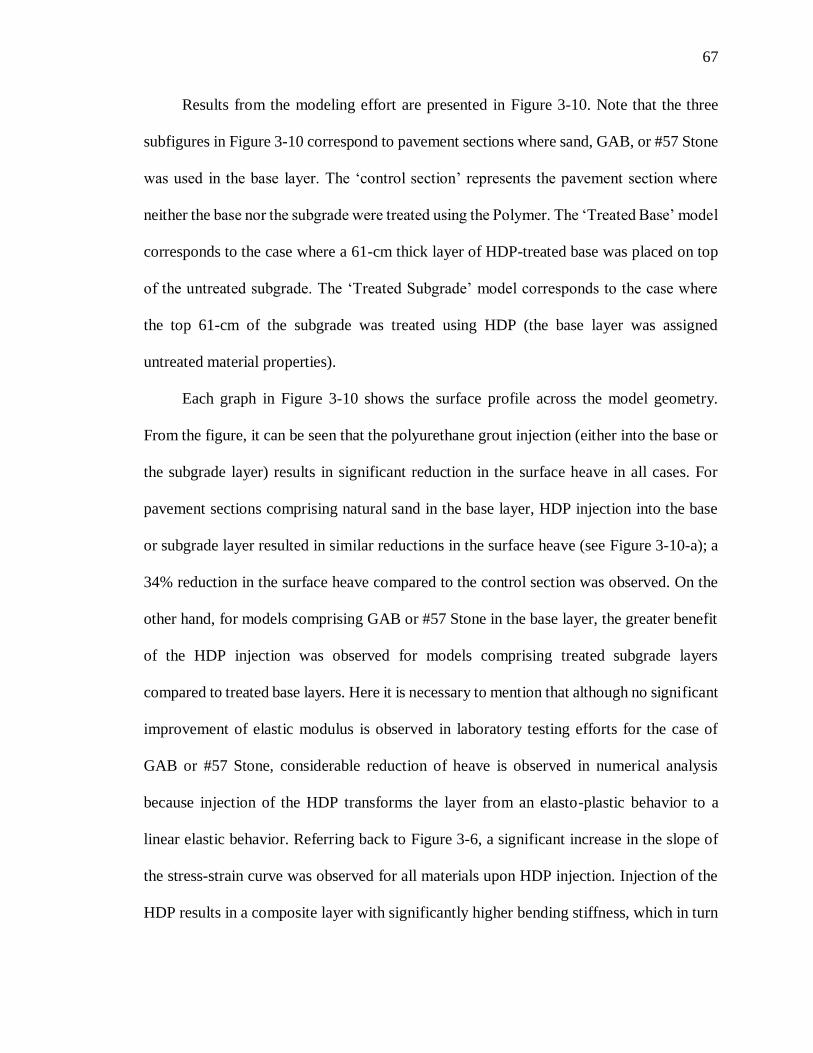
67
Results from the modeling effort are presented in Figure 3-10. Note that the three
subfigures in Figure 3-10 correspond to pavement sections where sand, GAB, or #57 Stone
was used in the base layer. The ‘control section’ represents the pavement section where
neither the base nor the subgrade were treated using the Polymer. The ‘Treated Base’ model
corresponds to the case where a 61-cm thick layer of HDP-treated base was placed on top
of the untreated subgrade. The ‘Treated Subgrade’ model corresponds to the case where
the top 61-cm of the subgrade was treated using HDP (the base layer was assigned
untreated material properties).
Each graph in Figure 3-10 shows the surface profile across the model geometry.
From the figure, it can be seen that the polyurethane grout injection (either into the base or
the subgrade layer) results in significant reduction in the surface heave in all cases. For
pavement sections comprising natural sand in the base layer, HDP injection into the base
or subgrade layer resulted in similar reductions in the surface heave (see Figure 3-10-a); a
34% reduction in the surface heave compared to the control section was observed. On the
other hand, for models comprising GAB or #57 Stone in the base layer, the greater benefit
of the HDP injection was observed for models comprising treated subgrade layers
compared to treated base layers. Here it is necessary to mention that although no significant
improvement of elastic modulus is observed in laboratory testing efforts for the case of
GAB or #57 Stone, considerable reduction of heave is observed in numerical analysis
because injection of the HDP transforms the layer from an elasto-plastic behavior to a
linear elastic behavior. Referring back to Figure 3-6, a significant increase in the slope of
the stress-strain curve was observed for all materials upon HDP injection. Injection of the
HDP results in a composite layer with significantly higher bending stiffness, which in turn
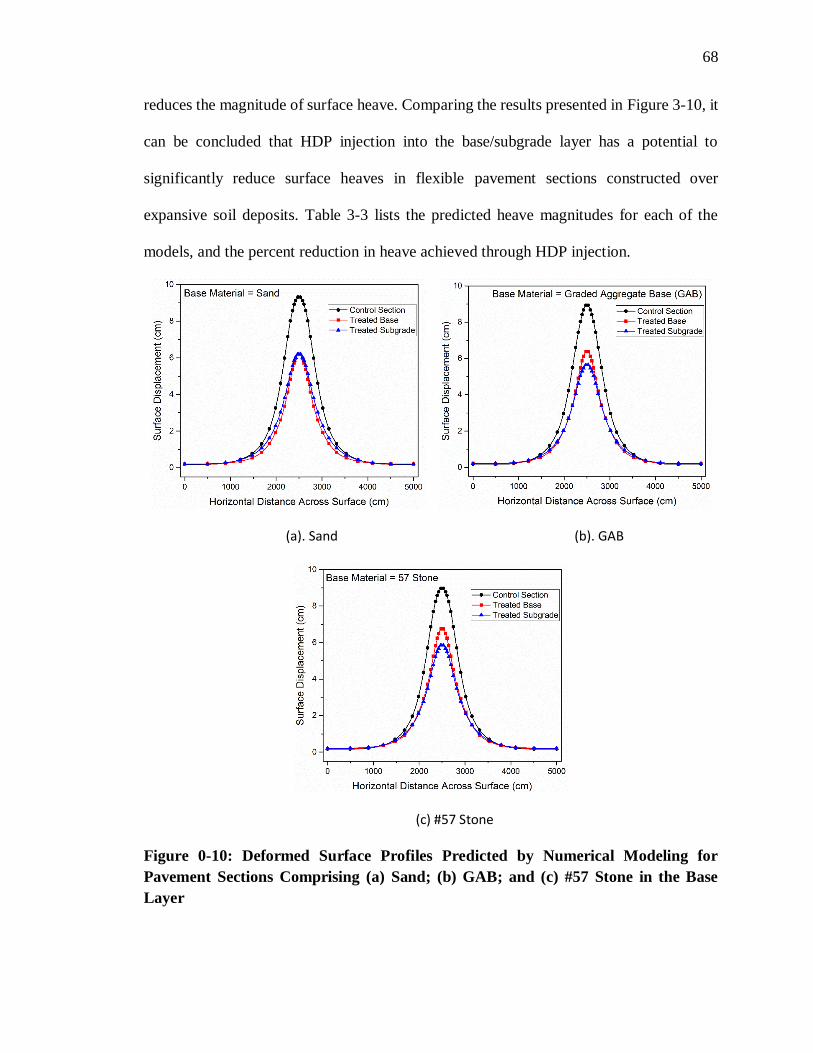
68
reduces the magnitude of surface heave. Comparing the results presented in Figure 3-10, it
can be concluded that HDP injection into the base/subgrade layer has a potential to
significantly reduce surface heaves in flexible pavement sections constructed over
expansive soil deposits. Table 3-3 lists the predicted heave magnitudes for each of the
models, and the percent reduction in heave achieved through HDP injection.
(a). Sand (b). GAB
(c) #57 Stone
Figure 0-10: Deformed Surface Profiles Predicted by Numerical Modeling for
Pavement Sections Comprising (a) Sand; (b) GAB; and (c) #57 Stone in the Base
Layer
69
Table 0-3: Comparing the Model-Predicted Nodal Displacements for Pavement
Sections with Treated and Untreated Base and Subgrade Layers
Base Material: Sand Base Material: GAB Base Material: #57 Stone
Control Treated-
Base
Treated-
Subgrade Control
Treated-
Base
Treated-
Subgrade Control
Treated-
Base
Treated-
Subgrade
Disp.
(cm)
Disp.
(cm)
Disp.
(cm)
Disp.
(cm)
Disp.
(cm)
Disp.
(cm)
Disp.
(cm)
Disp.
(cm)
Disp.
(cm)
Max 9.31 6.19 6.21 8.94 6.37 5.65 8.98 6.75 5.86
Min. 0.18 0.19 0.20 0.17 0.20 0.22 0.17 0.19 0.21
Heave 9.14 5.99 6.01 8.76 6.17 5.43 8.81 6.56 5.65
DHR *** 34 34 *** 30 38 *** 25 36
*DHR: Differential Heave Reduction (%)
Limitations of Current Study
Simplifications and assumptions made during the laboratory testing and modeling
stages of the current study can be related to certain associated limitations: (1) HDP
injection in the laboratory was carried out in a PVC tube, which can lead to significant
confining pressures during expansion of the polymer. Such confining pressure levels may
not be attained during field injection; (2) the water source in the model was defined at one
particular location, and was assigned a fixed dimension. This is most likely different from
actual field conditions where moisture flow into the pavement substructure can occur at
multiple locations; (3) the HDP-treated layers were assumed to be homogeneous in nature
and 61-cm thick. Although these numbers may not be very realistic for field conditions
(especially when HDP is injected into the subgrade layer), the purpose is to highlight how
the increased modulus and change in stress-strain behavior of the HDP-injected
geomaterial can lead to significantly reduced heaves on the pavement surface. More
accurate modeling of the homogeneous nature of HDP-injected layers can be possible only
if large-scale box tests are conducted, and the spatial variation of aggregate/soil and HDP

70
mixing is quantified. Nevertheless, exact quantification of this spatial variation is
impossible in actual field applications.
Summary and Conclusions
This manuscript presented findings from a recent research effort at Boise State
University that evaluated the effectiveness of polyurethane grout injection as a potential
remedial measure to reduce the differential heaving in flexible pavement sections
constructed over expansive soil deposits. Three different base material types and one
expansive soil were characterized in the laboratory under both untreated as well as treated
conditions to establish the resilient modulus and shear strength properties. Significant
increase in the resilient modulus properties were observed for the natural sand and
expansive soil materials. However, all four materials exhibited significantly higher shear
strength properties upon treatment with the High-Density Polyurethane (HDP). Due to
higher permeability of the base materials, greater degree of grout permeation was achieved
during base treatment compared to subgrade treatment. HDP injection resulted in
significant densification of the expansive soil specimen. Results from Finite Element (FE)
modeling of flexible pavement sections constructed over expansive subgrades indicated
significantly reduced surface heaves for models comprising HDP-treated base/subgrade
layers. Findings from this study indicate that polyurethane grout injection can be an
effective approach to reduce surface heaving in flexible pavement sections constructed
over expansive soil deposits.
Acknowledgments
The authors would like to thank Kazi Moinul Islam, Mir Md. Tamim, and Sikha
Neupane, graduate students in the Civil Engineering Department at Boise State University

71
for conducting all laboratory experiments on the expansive soil. Kazi Moinul Islam was
involved in the initial stages of this modeling effort. Funding for this modeling effort was
provided by URETEK USA, Inc. The contents of this paper reflect the views of the authors
who are responsible for the facts and the accuracy of the data presented herein. This paper
does not constitute a standard, specification, or regulation.
References
ABAQUS-2016. ABAQUS Documentation. Dassault Systemes, Providence, RI.
Buzzi, O., Fityus, S. and Sloan, S. W. (2010), “Use of Expanding Polyurethane Resin to
Remediate Expansive Soil Foundations”. Vol. 634, 2010, pp. 623–634.
https://doi.org/10.1139/T09-132.
Chittoori, B., Mishra, D., Islam, K. M. and Neupane, S., (2016a). Final Report, Project
Title: KEY 19112, US-95, Elephant Butte Swelling Clay Laboratory
Characterization of Soils”. 2016.
Chittoori, B., Mishra, D., Islam, K. M. and Tamim. M. M. (2016 b). Final Report, Project
Title: Key 19112, US-95, Elephant Butte Swelling Clay Phase 2: Numerical
Analysis of Alternate Pavement Sections.
Chittoori, B., Mishra, D. and Islam, K. M., (2018) Forensic Investigations into Recurrent
Pavement Heave from Underlying Expansive Soil Deposits. Transportation
Research Record: Journal of the Transportation Research Board.
Chittoori, B., Mishra, D. and Islam, K. M.(2018), “Forensic Investigations into Recurrent
Pavement Heave from Underlying Expansive Soil Deposits” National Academy of
Sciences: Transportation Research Board 2018, DOI: 10.1177/0361198118758625
Getzlaf, D. (2006). The value of using microfine cement in engineering wellbore designs,
on: http://www.microblend.ca/
Gromko, G. J., (1994) “Review of Expansive Soils”. Journal of Geotechnical and
Geoenvironmental Engineering, 1974, pp. 667–687. https://trid.trb.org/view/
139397
72
Islam, Kazi Moinul, (2017), "Subsurface Characterization of Flexible Pavements
Constructed Over Expansive Soil Subgrades and Selection of Suitable
Rehabilitation Alternatives" (2017). Boise State University Theses and
Dissertations. 1305. https://doi.org/10.18122/B2QM6M
Jones Jr, E., and Holtz, W. G., (1973) “Expansive Soils - The Hidden Disaster”. Civil
Engineering, Vol. 43, No. 8, 1973. https://trid.trb.org/view/133235
Keene, A., Edil, T. B. and Tinjum, J. M., (2012) “Mitigating Ballast Fouling Impact and
Enhancing Rail Freight Capacity”. National Center for Freight & Infrastructure
Research & Education Department of Civil and Environmental Engineering,
College of Engineering University of Wisconsin–Madison.
http://www.wistrans.org/cfire/documents/FR_CFIRE0407.pdf
Sasaki, Y., (2008) “Characterisation of Expanded Polymer Resin and Expansive Soil
Composites”. No. February, 2008. A degree of Master of Philosophy at the
University of Newcastle.
Stephens, M., and B. Honeycutt. (Unknown) “Structural Resin Injection: For Structural
and Soil Stabilization Solutions”. Collected from a presentation.
Tamim, Mir Md. (2017), "Evaluating the Effectiveness of a Hybrid Geosynthetic
Reinforcement System to Mitigate Differential Heave on Flexible Pavement due to
Expansive Subgrades" (2017). Boise State University Theses and Dissertations.
1367. https://doi.org/10.18122/B2H13R
Mark, P., Mike, T. and Brown, R. W., (2010), "Improving Soil Stiffness Beneath
Pavements Using Polyurethane Injection" Permeable Pavement Design and
Technology Session, of the 2010 Annual Conference of the Transportation
Association of Canada. http://conf.tac atc.ca/english/resourcecentre/readingroom
/conference/conf2010/docs/p2/popik-2.pdf
Yu, L., (2013) "The application of polyurethane grout in roadway settlements issues".
Martech, Edmonton, Alberta, Canada Rocky Wang, Roger Skirrow Engineering
Service Division, Alberta Transportation, Edmonton, Canada.

73
http://www.transportation.alberta.ca/PlanningTools/GMS/Conference%20Papers/
Conference%20papers%20resource/GeoMon2013Paper400.pdf

74
SUMMARY, CONCLUSIONS AND RECOMMENDATIONS FOR FUTURE
RESEARCH
Summary
This thesis summarized two specific problems and their corresponding
nondestructive, time-efficient solutions. The first problem addressed in manuscript # 1
(Chapter 2 of the thesis) was associated with pavement structural evaluation on a network
level in the absence of pavement layer thickness data. In this manuscript, the feasibility of
using Deflection Basin Parameters (DBPs) as a quick analysis approach (independent of
layer thickness information) was first investigated using the finite element method. This
approach was subsequently applied to evaluate the current conditions of four different
roadway segments selected across the state of Idaho. This analysis effort concluded that
for typical pavement configurations, some of the inferences, regarding the structural
conditions of individual pavement layers, drawn using DBPs, are as reliable as results from
rigorous back-calculation efforts.
The second problem addressed in manuscript # 2 (Chapter 3 of the thesis) was
associated with the need to mitigate recurrent differential heaving problem in flexible
pavement sections constructed over expansive soil deposits. In this manuscript, the
feasibility of High-Density Polymer (HDP) grout injection as an alternative nondestructive
solution to mitigate the differential heaving problem was investigated. For this purpose,
both laboratory testing and numerical simulations were carried out. Findings from this

75
research indicated that that adequate permeation of HDP grout into particular soil layer can
significantly change its behavior. Results from the numerical modeling efforts confirmed
that the level of confinement around the expansive soil layer can significantly change its
behavior. Findings from this study indicated that HDP grout injection in flexible pavement
sections constructed over expansive soils can potentially be used as an alternative
nondestructive approach to mitigate the problem of recurrent differential heaving.
However, the success of this approach is largely dependent on the extent of permeation of
the grout into the layer being treated.
Conclusions & Limitations
Manuscript # 1
Following conclusions were drawn based on the research reported in Chapter 2 of
this thesis.
1. DBPs are can be used as reliable alternatives to extensive back-calculation of
layer moduli form FWD data, and can be particularly useful for network-level
analysis of pavement structural conditions.
2. DBPs can be used to make relatively accurate assessments of the structural
condition of pavement layers; the results are significantly more reliable for
base or subgrade layers, compared to surface layers.
3. As DBPs are highly depended on pavement temperature and applied load
levels, the threshold values may need to be adjusted when the temperature and
loading conditions are different from usual operating conditions.
4. DBPs can be used along with functional evaluation data to make more
“informed” decisions during the selection of pavement rehabilitation methods.
76
Manuscript # 2
Following conclusions were drawn based on the research reported in Chapter 3 of
this thesis.
1. HDP grout injection could be used as an alternative nondestructive approach to
mitigate differential heaving in pavements constructed over expansive soils.
2. HDP grout treatment can significantly increase in the resilient modulus values
for natural sand and expansive clayey soils.
3. HDP grout injection can significantly improve the shear strength of soils and
aggregates.
4. Permeability of the material being treated is the single most important factor
governing the effectiveness of HDP grout as a treatment option.
Recommendations for Future Research
Manuscript # 1
1. The numerical model used in the current study to validate the DBP approach
was static in nature. FWD testing on the other hand, is a dynamic testing.
Accordingly, consideration of dynamic properties of individual pavement
layers can improve the reliability and accuracy of the model;
2. The current study did not consider visco-elastic nature of the HMA layer, or the
stress-dependent modulus of soils and aggregates. Consideration of these
aspects will ensure more “realistic” simulation of actual pavement response
under loading.

77
Manuscript # 2
1. HDP injection in the laboratory was carried out in a PVC tube, which can lead
to significant confining pressures during expansion of the polymer. Such
confining pressure levels may not be attained during field injection;
2. The water source in the model was defined at one particular location, and was
assigned a fixed dimension. This is most likely different from actual field
conditions where moisture flow into the pavement substructure can occur at
multiple locations;
3. The HDP-treated layers were assumed to be homogeneous in nature, and 61-
cm thick. Although these numbers may not be very realistic for field conditions
(especially when HDP is injected into the subgrade layer), the purpose was to
highlight how the increased modulus and change in stress-strain behavior of the
HDP-injected geometrical can lead to significantly reduced heaves on the
pavement surface.
4. More accurate modeling of the HDP-injected layers can be possible only if
large-scale box tests are conducted, and the spatial variation of aggregate/soil
and HDP mixing is quantified. Nevertheless, exact quantification of this spatial
variation is impossible in actual field applications.
Related Documents