Noble International Journal of Economics and Financial Research ISSN(e): 2519-9730 ISSN(p): 2523-0565 Vol. 03, No. 05, pp: 59-70, 2018 Published by Noble Academic Publisher URL: http://napublisher.org/?ic=journals&id=2 Open Access 59 Effect of Stock Market Development on Economic Growth: A Case of Nairobi Securities Exchange, Kenya Wycliffe Mukulu Musyoka a* , Evans Geoffrey Mogeni b , David Musimbi Murunga c , Pollyne Mbithe Mutunga d a* University of Nairobi, School of Economics: Nairobi, Kenya b Machakos University, Department of Economics, school of business and Economics: Machakos, Kenya c Kenyatta University, School of Economics d Mount Kenya University, Department of Economics, School of Business and Economics: Thika,Kenya Abstract: Nairobi securities Market has not been performing to the expectation of many Kenyan. The collapse of its two stock brokers almost the same time as caused a lot of anxiety and affected most of individual investors in this institution. This issue interwoven with the under subscription of initial public over (LPO) such as cooperative bank of Kenya and British American Insurance is a clear sign of deterioration in this institution. In relation to newly industrialized countries like Asian tigers which at some point were at par with Kenyan economy but now Kenya is far much behind. The listed companies in stock markets in these economies are much higher compares to the one listed in NSE. This paper carried empirical investigation mainly to establish the short run and long run relationship between stock market development and economic growth in Kenya. The annual secondary data was used for period running from 1992 to 2011.The study used the Ordinary Least squares (OLs) Method to run regression and Error correction model. The economic growth rate was proxied by GDP per capita growth rate. The stock market development was assumed to measure by market capitalization, equity turnover and total shares traded .The study also employed two other variables which were felt to be very crucial in both stock market and economic growth. These were investment and human capital development proxied by university student enrolment. The counteraction test results showed that there was long run relationship between indicators of stock market development and economic growth in Kenya. These results are supported by unit root test graphs. Further investigation by Error Correction Model (ECM) indicated that market capitalization series has negative relationship with economic growth whilst investment series showed very strong and positive relationship with economic growth rate series. The study finds out that stock market development affects economic growth through providing pool of cheap fund for investment. The policy recommendation to the policy makers is that NSE is very crucial institution to be taken into to consideration if Kenya has to realize the dream of being regional financial hub by 2030 by accelerated development to boost domestic and international resource mobilization. The areas policy makers needs to focus on are various incentives, enhanced competiveness and attractiveness of NSE, regulations of individual and institution investors, stock brokers players and privatization of state own enterprises. Keywords: Inflation, Economic Growth, East Africa Community. 1. Introduction 1.1. Background In 1990s there had been great interest in stock market worldwide due to the rising need to mobilize funds to finance investments and ventures. This was a period of dynamics in global financial markets which called for stock markets to grow in response to demand for funds. The endogenous growth literatures of previous decade had pointed out the need of financial development in economic growth and showed clearly without finance, even with the best invention at hand, there could be no impact on economic growth. Financial market liquidity is very much critical as Hicks (1969) puts it, that new technologies inventions by themselves did little to industrial revolution in England, but till the time when there were more developed financial markets that was able to inject large amount of capital to develop long turn projects which later were referred as industrial revolution. This means industrial revolution had

Welcome message from author
This document is posted to help you gain knowledge. Please leave a comment to let me know what you think about it! Share it to your friends and learn new things together.
Transcript

Noble International Journal of Economics and Financial Research ISSN(e): 2519-9730 ISSN(p): 2523-0565
Vol. 03, No. 05, pp: 59-70, 2018
Published by Noble Academic Publisher URL: http://napublisher.org/?ic=journals&id=2
Open Access
59
Effect of Stock Market Development on Economic Growth: A
Case of Nairobi Securities Exchange, Kenya
Wycliffe Mukulu Musyokaa*
, Evans Geoffrey Mogenib, David Musimbi Murunga
c, Pollyne
Mbithe Mutungad
a*University of Nairobi, School of Economics: Nairobi, Kenya
bMachakos University, Department of Economics, school of business and Economics: Machakos, Kenya
cKenyatta University, School of Economics
dMount Kenya University, Department of Economics, School of Business and Economics: Thika,Kenya
Abstract: Nairobi securities Market has not been performing to the expectation of many Kenyan. The collapse
of its two stock brokers almost the same time as caused a lot of anxiety and affected most of individual investors in
this institution. This issue interwoven with the under subscription of initial public over (LPO) such as cooperative
bank of Kenya and British American Insurance is a clear sign of deterioration in this institution. In relation to newly
industrialized countries like Asian tigers which at some point were at par with Kenyan economy but now Kenya is
far much behind. The listed companies in stock markets in these economies are much higher compares to the one
listed in NSE. This paper carried empirical investigation mainly to establish the short run and long run relationship
between stock market development and economic growth in Kenya. The annual secondary data was used for period
running from 1992 to 2011.The study used the Ordinary Least squares (OLs) Method to run regression and Error
correction model. The economic growth rate was proxied by GDP per capita growth rate. The stock market
development was assumed to measure by market capitalization, equity turnover and total shares traded .The study
also employed two other variables which were felt to be very crucial in both stock market and economic growth.
These were investment and human capital development proxied by university student enrolment. The counteraction
test results showed that there was long run relationship between indicators of stock market development and
economic growth in Kenya. These results are supported by unit root test graphs. Further investigation by Error
Correction Model (ECM) indicated that market capitalization series has negative relationship with economic growth
whilst investment series showed very strong and positive relationship with economic growth rate series. The study
finds out that stock market development affects economic growth through providing pool of cheap fund for
investment. The policy recommendation to the policy makers is that NSE is very crucial institution to be taken into
to consideration if Kenya has to realize the dream of being regional financial hub by 2030 by accelerated
development to boost domestic and international resource mobilization. The areas policy makers needs to focus on
are various incentives, enhanced competiveness and attractiveness of NSE, regulations of individual and institution
investors, stock brokers players and privatization of state own enterprises.
Keywords: Inflation, Economic Growth, East Africa Community.
1. Introduction 1.1. Background
In 1990s there had been great interest in stock market worldwide due to the rising need to mobilize
funds to finance investments and ventures. This was a period of dynamics in global financial markets
which called for stock markets to grow in response to demand for funds. The endogenous growth
literatures of previous decade had pointed out the need of financial development in economic growth and
showed clearly without finance, even with the best invention at hand, there could be no impact on
economic growth. Financial market liquidity is very much critical as Hicks (1969) puts it, that new
technologies inventions by themselves did little to industrial revolution in England, but till the time when
there were more developed financial markets that was able to inject large amount of capital to develop
long turn projects which later were referred as industrial revolution. This means industrial revolution had
Noble International Journal of Economics and Financial Research
60
to wait for financial revolution. Stock market is one of financial markets where there was mass
recognition of its important role to economic wellbeing worldwide (Yartey, 2008).
This period also was a turnaround in political and economic ideologies and policies which favors
the free markets and capitalism leading to greater demand for capital which needed a quick solution. Most
of developed world promoted stock exchange as a cornerstone for their economic progress. In developing
countries, the need for privatization and liberalization of state owned enterprises pushed the stock market
to the threshold as a tool of economic growth. The equity financing (Share finance) has been in increase in
the current world due to its numerous advantages. In Kenya there have been a number of initial public
offerings (IPOs) in recent past, in which over ninety percent has been oversubscribed. This shows that
Kenyan do practice the shares financing for the firms ,but still Kenya faces some challenges hence part of
business sector has depended mainly on short-term financing such as overdrafts to finance even long-term
capital. Based on the maturity matching concept, such financing is risky. If all firms have to grow and be
competitive in free market there is need to have an appropriate mix of short- and long-term capital (Ngugi,
2003) and (Domirgue-Kunt and Levine, 1996).
The capital market consists of the primary and the secondary markets. The primary market is the
one in which underwriters help companies raise capital in the form of IPOs or by issuing seasoned stocks
and bonds to investors. The secondary market is the one in which shareholders can resell their shares to
other interested buyers on the stock exchange or the over-the counter market. There is need to develop
financial markets and attracts the foreign portfolio inflows and some countries have introduced regulatory
reforms to allow capital market development. There has been hardly little and up to date empirical study
on the important of stock market development to short and long run economic growth for the third world.
King. and Levine (1993) Found positive and significant correlation between stock market development
and economic growth but used cross-sectional approach. The cross-sectional approach has several
drawbacks such as inability to sort country specific effects, (Matu, 2007).
Stock market development increases the level of investment in the economy through mobilization of
saving which in turn lead to growth .Positive real interest rate increases the level of financial depth due to
high savings hence high productivity of capital.
The Vision 2030 (Kenya, 2007), the country’s long-term development plan aspires for GDP growth
rate of at least 10 percent, while enhancing financial sector development and stability of which the Stock
market is a vital institution (Schumpeter, 1934). The Vision foresees Kenya as a regional financial hub for
financial services in the entire East African Community. With this in mind, a robust and developed
financial sector will remain critical. Indeed, the Vision appreciates the need for a complimentary growth
relationship between financial sector development and economic growth. Until before the recent
restructuring of the market, the level of activity in the in the bourse was quite low. This has caused for
years, the business sector to depend mainly on short-term financing such as overdrafts to finance even
long-term capital (Odhiambo, 2010).
If the country is to achieve the growth targets as envisaged in the Vision, it will need to boost the
level of savings and investments both in the Private and public sector, an opportunity guaranteed by a
developed stock market.
1.2. Research Questions The research questions are as follows.
i. What is the effect of stock market capitalization on economic growth?
ii. What is the impact of total value shares traded to economic growth?
iii. How does the turnover Ratio in the stock market influence economic growth?
iv. What is the effect of investment ratio and university enrolment ratio as control variables on stock
market development?
v. What are the policy implications from the study?
1.3. Objectives of the study The general objective of this study is to investigate the relationship between stock market
development and economic growth in Kenya.
Specifically, the study intends to achieve four key objectives;
i) To examine the effect and direction of stock market capitalization on economic growth.
ii) To determine the effect of total value shares traded to economic growth.
iii) To establish the turnover Ratio in the stock market influence on economic growth.

Noble International Journal of Economics and Financial Research
61
iv) To examine the effect of investment and university enrolment ratios as control variables on
stock market development.
v) To draw policy recommendations from the research findings.
2. Literature Review 2.1. Theoretical Literature
The theoretical literature adopted the endogenous growth theory which dates back to Ramsey
(1928). An endogenous growth model is one in which the long-run growth rate of output per worker is
determined by variables within the model, not an exogenous rate of technological progress as in a
neoclassical growth model such as those following from Ramsey (1928) and Solow (1956). Endogenous
growth economists believe that improvements in productivity can be linked to a faster pace of innovation
and extra investment in human capital. This means there is a central role for knowledge as a determinant
of economic growth. Therefore the proxy for both human capitals development and investment is crucial
for this study.
There endogenous growth theory takes that there are potential increasing returns from higher levels
of capital investment in a given economy and therefore emphasizes that private investment in Research
and Development is the central source of technical progress The key scholars in growth models are Romer
P. M. (1986), Lucas (1988), and Rebelo (1991) who have concluded that Endogenous growth models
show that economic growth performance is related to financial development, technology and income
distribution.
2.2. Empirical Literature Review Osei (1998) under took an Analysis of factors affecting the development of an emerging capital
market in Ghana stock market. The study looks at the institutional factors affecting the development of the
Ghana stock market. The study took a closer analysis on the impact of the listing of Ashanti Goldfields
Corporation on the development of the Ghana stock market. Whereby the study establishes that the
institutional factors particularly the legal and regulatory framework that ensure the protection and security
of investors are in place, and that the call-over system of transactions is very transparent.
Osei (1998) Used the law of one price and the random walk test and establishes that the GSE is
"weak-form" inefficient. The study also finds that the listing of AGC has had tremendous impact on the
GSE in many ways including improving market liquidity and market turnover.
Filer et al. (1999) took an empirical study on whether financial development in anyway causes
economic growth or it is a just a consequence of increased economic activity. The study made use of a
causality framework and took Granger-causality tests to provide evidence of a positive and significant
causal relationship going from stock market development to economic growth, particularly for less
developed countries. The study found evidence that stock markets, especially in more developed
economies, incorporate expected future growth into current prices, a result that is consistent with efficient
market hypotheses
The study was similar to that of Jalloh (2009) with a slight different in that the latter was more
specific to Sierra Leone stock exchange roles on financial markets. Filer et al. (1999) were interested in
comparing the role of stock markets in developing countries and developed countries therefore there is a
need for the study on Kenyan stock market development and how it causes economic development.
Osinubi (2001) study examined whether stock market promotes economic growth in Nigeria by
employing ordinary least squares regression (OLS) using the data from 1980 to 2000. The results
indicated that there is a positive relationship between economic growth and all the stock market
development variables used. With 99 percent R-squared and 98 percent adjusted R-squared, the result
showed that economic growth in Nigeria is adequately explained by the model for the period between
1980 and 2000.
Zhu et al. (2002) took an investigative study on Stock Market Liquidity and Economic Growth
which is a form of a critical appraisal of the Levine-Zervos model, whereby Levine and Zervos (1998)
presented cross-country econometric evidence showing that, in a sample of 47 countries, stock market
liquidity contributed a significant positive influence on GDP growth. The study shows that the Levine-
Levine and Zervos (1998) results are not robust to alternative specifications because of the incomplete
manner in which they controlled for outliers in their data. They showed that when one property controls
for outliers, stock market liquidity no longer exerts any statistically observable influence on GDP growth.
Ngugi (2003) took study on Liquidity of the stock market in Nairobi stock Exchange. Liquidity is
very vital for the market to play a significant role in the development and facilitating mobilisation of long-

Noble International Journal of Economics and Financial Research
62
term capital. The study invoke the microstructure theory in empirical analysis testing for market response
to the following main changes: shifts in trading system, tightening of the regulatory system, reform of
taxation policy, and relaxation of capital controls. The study used descriptive statistics and simple
regression analyses and found that the level of stock returns influence to a large extent the volume of
trading activities given high quality of information while volatility is partially attributed to information
asymmetry and adequacy of the market microstructure infrastructure including the tightness of disclosure
rules.
Caporale et al. (2003) examined the hypothesis of endogenous growth models which asserts that
financial development causes higher growth through its influence on the level of investment and its
productivity. They exploited techniques recently developed to test for causality in VARs. The evidence
obtained from a sample of four countries suggests that investment productivity is the channel through
which stock market development enhances the growth rate in the long run. This study has examined the
hypothesis that stock market development affects economic growth through its impact on investment.
Ngugi and Njiru (2005) took the study that explores the development of the Nairobi Stock
Exchange primary market since its inception in 1953 by use of a historical perspective approach. The
study attempted to capture the factors surrounding the development of the market, using a sample of 20
firms that had made public offers since 1980.
Matu (2007) using cointegration test the results of the study suggested that stock market
development in Kenya has positive and significant impact on economic growth in long run. The study
used Vector Autoregression (VAR) model. The findings were consistent with that of Levine and Zervos
(1998) and Nyakerario (2007). But this study employs ordinary least squares regression (OLS) using the
data from 1989 to 2010 and try to incorporate more variables for stock market development using Gross
Domestic Product per capita (GDPPc) as a proxy for economic growth.
3. Methodology 3.1. Theoretical Framework
New growth theories broadly intend to relax the assumption of diminishing return to capital in the
neoclassical growth models. They view all production inputs as some form of reproducible capital (Romer
P., 1987) called it “state of knowledge.’’ Along with these approaches a simple model was developed by
Rebelo (1991) and called it AK model.
tt AKY --------------------------------------------------------------------------------------------------- (3.1)
Where: Kt is a broad measure of capital that is a composite of physical capital and human capital
stock and A denotes state of technology. The production function is linear and does not yield diminishing
return to capital and hence the steady-state growth rate can be shown as equation (2).
sAg ------------------------------------------------------------------------------------------------- (3.2)
g -denotes steady-state growth rate
-denotes depreciation of capital.
s -denotes saving rate (marginal propensity to save MPS) which is assumed to be equal to
investment.
This implies that the steady-state growth rate is positive (given sA greater than ) whereby the
level of income per capita will rise without limit. This means that the increase in saving rate permanently
will increase growth rate per capital. AK model also suggests that the poor nations whose production
process is at similar degree of technological progress will always grow at the same rate as rich nations
regardless of their initial level of income (Solow model)
The theories noted that not all savings is invested some fraction is lost in what is called
disintermediation activities (u) in order to come up with equation (3)
tt Iusy --------------------------------------------------------------------------------------------------- (3.3)
Then given some saving is lost and technology (A) has constant return to scale to capital, steady–
state growth rate per capital will be as shown in equation (4)

Noble International Journal of Economics and Financial Research
63
suAg ----------------------------------------------------------------------------------------------- (3.4)
This implies that financial development may increase saving rates due to confidence with savers and
availability of investment opportunities attributed to resource allocation which is a key role of financial
markets. Equation (4) implies that financial development may increase marginal productivity of capital
stock and also it implies that financial development will increase the proportion of savings that goes to
investment by reducing disintermediation activities ( suIeui )(. ) hence increasing saving rates. This
mean if financial development is increased the efficiency in managing savings is enhanced and
intermediation activities are reduced which further reduces the loss in savings.
3.2. Model Specification The regression model took the following functional form:
)5.3(),,,,( UERINVgrTRSTRMCRfY
Y: Represents Economic growth proxied by per capita GDP growth rate (GDPPC)
MCR: Market capitalization ratio
STR: Total shares traded Ratio
TR: Turnover ratio
INVGR: Investment growth rate
UEGR: University student enrollment growth rate
The specific regression equation is shown by equation (3.6)
)6.3(4321 UEGRINVGRTRSTRMCRGDPPCGR
)7.3(21 TRSTRMCRGDPPCGR
The model is a one-stage test of the hypothesis of whether the stock market affects economic
growth. This is motivated by the well-known theoretical study of Levine (1991) who proposes that
investing in the stock market alleviates both the liquidity shock and the productivity shock that firms
would otherwise face. Firms not facing liquidity shocks will have a higher level of investment leading to a
higher growth rate (Solow, 1956).
3.3. Measurement of Stock Market and Control Variables Two features characterize this approach to the measurement questions. First, by being able to draw
data from a single data source, this overcomes the consistency and measurement problems that are
associated with using of two different data sources. Second, to maximize the use of information extracted
from the data by using several and different measures of stock market development, as opposed to a single
composite measure.
3.3.1. Market Capitalization Ratio (MCR) This measure equals the value of listed shares divided by GDP. The assumption behind this measure
is that overall market size is positively correlated with the ability to mobilize capital and diversify risk on
an economy-wide basis.
3.3.2. Total Value of Shares Traded Ratio (STR) This measure equals total value of equities traded on the stock market exchange divided by GDP.
The total value traded ratio measures the organized trading of firm equity as a share of national output and
therefore should positively reflect liquidity on an economy-wide basis. The total value traded ratio
complements the market capitalization ratio, although a market may be large, there may be little trading.
3.3.3. Gross Domestic Product Per Capita Growth rate (GDPPCGR) This was used as a proxy for economic growth (endogenous variable in OLS) since GDP per capital
is a good measure of economic growth though may not be good measure of economic development.

Noble International Journal of Economics and Financial Research
64
3.3.4. Investment Growth Rate (INVGR) This measures the growth rate of the amount of wealth which is saved in the economy for the
purpose of investment .This variable is also used as a control variable because investment is an important
determinant of economic growth.
3.3.5. University Student Enrollment Growth Rate (UER) University students’ enrollment growth rate was used as a proxy for knowledge and human capital
development. This variable is also used as a control variable since human capital is deemed to be an
important determinant of economic growth.
3.4. Testing for Unit Roots When analyzing time series data, it is advisable first to determine whether the series is stationary or
not. To do this it involves testing for unit roots to correctly test hypothesis concerning the relationship
between two variables having unit roots (integrated of at least order one).The test is therefore whether the
time series are 1(1) which is a necessary condition. The Augmented Dickey Fuller (ADF) can be used to
test whether a time series is stationary or not. The ADF regression equation to test unit root in time series
can be written as follows.
titi
k
itt yTyy 1211 ---------------------------------------------------------------- (3.8)
Whereby ty and ty are the level and first difference of the relevant time series, T is the time trend
variable and and21,, are parameters. t is error term with zero mean and constant variance.
3.5. Co integration Test Once the variables are I (1) is important to determine whether there is a stable non –spurious (co
integrated) relationship in level form. Granger (1986), Engle and Granger (1987) (E-G) approach is one of
best and commonly used to analyses the stationary of residuals from levels regression. It is assumed that
in long run the error term of regression equation should be zero. The cointegration test is based on the
following regression equation
tt
m
jtt T 1011 ---------------------------------------------------------- (3.9)
Where denotes the residuals from the co integrating regression of empirical equation (3.8). The
null hypothesis is that equals to 0 and alternative is less than 0.
3.6. Error Correction models (ECM) Error correction model is used to test short run dynamics, that measure any dynamic adjustment
between the first difference of the variable (endogenous variable) and exogenous variables and two long
run relationships that measure any relation between the level of the exogenous and endogenous variables.
The long run relationship between two variables for instance yt and xt, the static model can be as follows.
ttt xy
Then ECM can be defined as:
ttt xy ; is a co integrating coefficient and t is the error from a regression of yt and Xt.

Noble International Journal of Economics and Financial Research
65
4. Empirical Results and Data Analysis
4.1. Analysis of the Result 4.1.1. Descriptive Statistics
Table 4.1. Definition of Variable, Frequency and Source
Variables Description Source
GDPPCGR Gross Domestic Product Per Capita growth rate( Annual data) Economic Survey
MCR Market Capitalization Ratio (Annual data) i.e MC/GDP CMA/NSE
TR Turnover Ratio ( annual data) i.e Equity Turnover/GDP CMA/NSE
STR Total shares Traded ratio (annual data) volume of shares traded/GDP CMA/NSE
INVGR Investment Growth rate (annual data) MoF-
StatistalAnnex
UEGR University Student Enrollment (annual data) Statistical Abstract
Source: Author’s Computation from data set
Table 4.1 shows the summary of definition of the variables used in this study and there frequency
and sources. Table 4.2. Descriptive Statistics
GDPPCGR INVGR UEGR STR TR MCR
Mean 0.105 0.118 0.078 0.0675 1.721 30.0965
Maximum 0.220 0.290 0.2500 0.2800 5.870 181.100
Minimum -0.020 -0.040 -0.0700 0.0100 0.150 7.0200
Observations 20 20 20 20 20 20
Source: Author’s Computation from data set
From table 4.2 the observation in each variable is seems to have been spread too much from the
mean, for instance MCR has mean of 30.1 with the lowest observation of 7.02 and the highest being 181.1
.
4.2. Stationarity Test All the variables used in this study like any other variable like any other times series data are must
be tested for stationarity test after which the cointegration test is run to determine the possibility of
variables integration at level and then investigate the long run relationship between the depended variable
and independent variable. Then late the causality test is curried.
The run stationarity test this study uses the graphical method and augmented Dickey Fuller test
(ADF) and the full result are annexed at the appendix. Table 4.3 shows the summary of result of the unit
root test by use of ADF Test.
Table 4.3. Summary of Stationarity Test Result-Augmented Dickey Fuller test (ADF test)
Variable In levels In 1st differences observation
GDPPCGR I (1) I (0) 20
INVGR I (I) I (0) 20
UEGR I (1) I (0) 20
STR I (2) I (1) 20
TR I (1) I (0) 20
MCR I (2) I (1) 20
Source: Author’s Computation from data set
Table 4.4. Summary of Stationarity Test T-values
Variables Level (t-Calc) Difference (t-Calc) Stationary Status after difference
GDPPCGR -0.756826 -6.981936 1ST
at 1% Stationary
INVGR -1.708516 -2.208299 1st at 5% Stationary
EUGR -2.603082 -2.961462 1st at 10% Stationary
STR -0.797024 -4.194540 2nd
at 5% Stationary
TR -3.021558 -3.262666 1st at 1% Stationary
MCR 0.931172 -1.748491 2nd
at 10% Stationary
Source: Author’s Computation from data set

Noble International Journal of Economics and Financial Research
66
The result of Stationarity test shows that all variables except MCR and STR becomes stationary
after first difference with constant and linear trend at different significance level which implies that they
are integrated of order one I (1) at level.MCR and STR becomes stationary after the second difference
with constant and linear trend at 10% and 5% significance levels respectively implying that the two
variables are integrated of order two I(2) at level.
Since the variables are not stationary at level next is to test co integration for long run relationship.
4.2.1. Co Integration Test The stationary test concluded that most of the series at integrated of order one i.e I (1) and this
allows for the analysis of cointegration relationship among the variables Matu (2007).Most of the
macroeconomic time series data are non-stationary and this is the reason a stationarity test is run. If unit
root is found to stationarise them one conducts differencing of the data. But the differencing of the series
lead to the loose of long run relationship because the economic theory gives equilibrium values in levels
and not in the form of differences. When a group of time series data of which the individual series is non-
stationary they could be stationary after integration. The interest here is to determine if they integrate and
the integrating (long run equilibrium) relationship among the dependent variable and independent
variable. The cointegration test was done by obtaining residuals through the running ordinary least
squares (OLS) with the help of E-Views. This is what is called Angle and Granger two step-procedures.
The table 4.5 shows the result of the cointegration.
Table 4.5. Test for Cointegration: Angle and Granger two step-Procedure
Null Hypothesis: Residual has a unit root
Exogenous: None
Lag Length: 0 (Automatic - based on SIC, maxlag=2)
t-Statistic Prob.*
Augmented Dickey-Fuller test statistic -2.452618 0.0173
Test critical values: 1% level -2.692358
5% level -1.960171
10%
level
-1.607051
Source: Author’s Computation from data set
Mackinnon (1996) one-sided p-values.Warning: Probabilities and critical values calculated for 20
observations and may not be accurate for a sample size of 19
Since each explanatory variable had his own ability and level to influence the dependent variable in
long run it was important to determine the amongst the explanatory variables which one best explains the
dependent variable better in long run. The table 4.6 shows the result of OLS for the regression run
between the GDPPCGR and INVGR which emerged the best model amongst other explanatory variables.
Table 4.6. Long Run Relationship
Dependent Variable: GDPPCGR
Method: Least Squares
Date: 08/07/12 Time: 11:30
Sample: 1992 2011
Included observations: 20
Variable Coefficient Std. Error t-Statistic Prob.
INVGR 0.336311 0.171503 1.960959 0.0655
C 0.065315 0.023894 2.733571 0.0136
R-squared 0.176026 Mean dependent var 0.105000
Adjusted R-squared 0.130250 S.D. dependent var 0.060914
S.E. of regression 0.056809 Akaike info criterion -2.803615
Sum squared resid 0.058090 Schwarz criterion -2.704041
Log likelihood 30.03615 Hannan-Quinn criter. -2.784177
F-statistic 3.845360 Durbin-Watson stat 0.735066
Prob(F-statistic) 0.065544
Source: Author’s Computation from data set
Noble International Journal of Economics and Financial Research
67
The long run relationship between economic growth and investment 17 percent indicated bt R-
squared. This reflects the theoretical relationship between GDPPCGR and INVGR which in line with the
literature and the economic theory. The model fit is not perfect but it was the best out of all other
repressors.
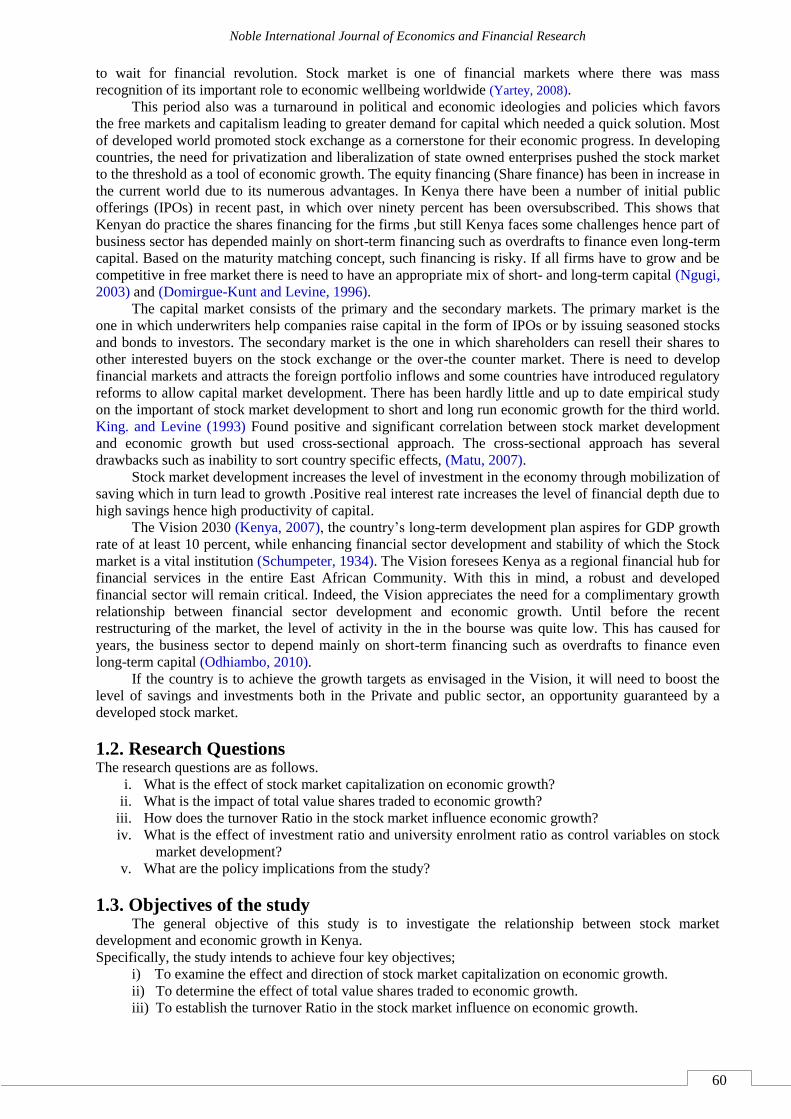
4.2.2. Error Correction Mechanism (ECM) The cointegration revealed the long run relationship between stock market development and
economic growth in Kenya with investment taking the lions share amongst the regressors in causing
economic growth, this may not the case in short run Odhiambo (2010).In short run there might be
disequilibrium between actual values of the variable and the long run equilibrium values. Error correction
model is an important innovation in time series econometrics even after cointegration is confirmed. It is
used to investigate the presence of equilibrium between the short run dynamics of variables and long run
equilibrium values of the same. This dynamical system works in a way that the deviation of the current
status from its own long run relationship is fed in its long run dynamics.
The residual from the long run equation was then lagged once and included in the error correction
mechanism (ECM) as proposed by Breausch and Wicken1988. In this mechanism, it is possible to
estimate both the short-run and the long-run in a single error correction mechanism. The result are shown
on table 4.7 after dropping UEGR,STR and TR to up with the best model that fit the data.
Table 4.7. Error Correction Mechanism (ECM)
Dependent Variable: D(GDPPCGR)
Method: Least Squares
Date: 08/07/12 Time: 12:08
Sample (adjusted): 1994 2011
Included observations: 18 after adjustments
Variable Coefficie
nt
Std. Error t-Statistic Prob.
Residual(-1) -
0.449361
0.179940 -2.497291 0.0267
D(INVRGR) 0.348988 0.107917 3.233867 0.0065
D(INVRGR(-1)) 0.311082 0.144644 2.150674 0.0509
D(MCR(-1)) -
0.003686
0.001979 -1.862492 0.0853
C -
0.003606
0.010036 -0.359271 0.7252
R-squared 0.664171 Mean dependent var -0.001667
Adjusted R-squared 0.560839 S.D. dependent var 0.059136
S.E. of regression 0.039189 Akaike info criterion -3.410712
Sum squared resid 0.019965 Schwarz criterion -3.163386
Log likelihood 35.69641 Hannan-Quinn criter. -3.376609
F-statistic 6.427542 Durbin-Watson stat 1.790244
Prob(F-statistic) 0.004420
Source: Author’s Computation from data set
From the results above, the adjusted R-squared of 56% and R-square of 66% is reasonable to enable
the conclusion that our model fits well serial data used in this study. F-Calculated = 6.42 is greater than
the F- Critical = 2.9 implying the null hypothesis that all the coefficients are equal to zero is rejected.
The residual term is negative and statistically significant at 5% level. The coefficient represents an error
correction term that ensures once the system has deviated from the equilibrium it is possible and able to
revert to it in the medium to long term. This is important characteristic for the model to be termed as fit
for sample data.
A 1% increase in INVGR leads to 34% increase in GDPPCGR, holding all other factors constant.
This result is in line with a priori expectations and relevant literature (Caporale et al., 2003). The MCR is
statistically significance at 5% level and negatively influencing economic growth. This is expected
because Market capitalization is a measure of the size of the stock market but linkage between the stock
market and economy is the investment. The size of the stock market may be following the economic
growth and not really cause it (Goldsmith, 1969), Filer et al. (1999). Stock market Capitalization is not

Noble International Journal of Economics and Financial Research
68
really a measure of stock market development but stock market growth. Since TR is a complement of
MCR similar impact is expected. The other variables were not fitting well with ECM model hence
excluded them. This does not mean they are not statistically significant. Under normal regression without
normalizing the data STR is statistically significance at 10% level.1% increase in STR will cause a 3.4%
increase in GDPPCGR. This result could be spurious since it was done running stationary test.
5. Conclusion This paper has examined the hypothesis that stock market development has positive effects on
economic growth. The stock market development to this far there is no doubt it promotes economic
growth in Kenya. The stock market promotes economic progress through the role it plays in saving and
investment. The stock market does this by pooling funds and other resources together for investors to tub
for their long term projects. Stock market takes this position through providing an important mechanism
for effective and efficient mobilization and allocation of savings Caporale et al. (2003).
The study made an attempt to place the above role in Kenyan scenario between the periods of 1992
to 2011 using very important known indicators of stock market development. The relationship between
stock market and economic growth has been found positive linked through investment. The data are
consistent with the views that stock market is stimulate economic growth by opening an opportunity for
investors to use pool together fund their project and ventures and increase the efficiency in which the
economy can utilize these resources. The data in the study was able to link the long run economic growth
with investment (King. and Levine, 1993). Cointegration and error correction mechanism helped to
distinguish between the long run and short run impart of stock market development and economic growth
in Kenya. A well-managed stock market will perform resource allocative functions (allocate resources to
productive uses) in the economy. This is done through shares pricing whereby the shares from well-
managed profitable firms will be highly valued than those from unsuccessful and loss making firms. This
rewarding mechanism lowers the cost of capital, this leads to major allocation of new investment
resources and in wholesome boost economic growth. The impact of resources allocation role is much
higher than other functions of the like corporate control and risk diversification at the levels of savings
mobilization (Tennant et al., 2011).
6. Policy Recommendation There has been a quite comprehensive and vast literature in this area of study and the empirical
result for this study shows that there are strong link between the stock market development and economics
growth in Kenya. This mean that it is pertinent to recommend that there is need to have concerted efforts
towards enhancing the link between stock market development and economic growth more specially the
equity market to pool more and more fund for the investment. The stock market is known to be the source
of cheap fund for investment compared to money market and other sources. Proxy for investment showed
a strong long run relationship between investment and economic growth in Kenya. The study recommends
some measures that will take into consideration the short term and long term plans to develop the Nairobi
Securities Market (NSE).The development of NSE means financing the economic growth. There is need
to deepen financial and capital markets and set some limits to which institutional and individual will be
allowed to invest on security markets. Further there is need to formulate and implement a policy to
encourage institutional investors to be listed on NSE by having incentives like tax holidays or preferred
corporate (reduced) tax rate below 30% for a period of not less than 10 years. A special incentive for
sovereignty bonds need to incorporated in a pack of the other incentives. This is internationalization of
NSE operation through enhancing competiveness and attractiveness. The policy may also set the
institutional minimum capitalization of twenty billion of which after attainment must be listed on NSE.
These incentives will assist in market expansion; provide diversification for individual investors’
opportunities and reduce volatility. This will promote effectiveness and efficiency at NSE (Matu 2007).
The study has identified the significance of stock market development to economic growth in
Kenya. This is the great policy implication and the stock market development policy marker should
address it on the view of promoting the stock market systems growth. In order to fully utilize the
securities market in Kenya as a mean of enhancing corporate governance the government should
accelerate the conversion of the state owned corporate to private enterprises by trading the shares they
control in NSE. There are number of State owned enterprises enlisted by privatization commission of
Kenya for privatization (such as National bank of Kenya).This will enhance domestic resource
mobilization through stock market development which makes sure that the pool for resources for
investment are available. The policies to address on regulations institutional investors and stock brokers
Noble International Journal of Economics and Financial Research
69
through was not on this empirical study but fall of Nyaga stock brokers and Discounts stock brokers were
a major blow to NSE development and can’t be left out at this point. The other areas to be addressed are
privatization, reduction of impediment to NSE and easy restriction on international capital flow. The
future of NSE is bright given it is going demutualization process whereby some of the challenges facing
NSE will be address thereafter. The more the listings of companies in the stock market the more the
shares traded and volume of sales which in turn means more investment. The investment was found to be
major variable influencing the economic growth. The study emphasize on enhancing investment
efficiency through stock market development as a means of resource mobilization.
References Caporale, G. M. P., Howells, G. A. and Soliman, M. (2003). Endogenous growth models and stock market
development: Evidence from Four countries; South Bank University London press. 9-13.
Domirgue-Kunt, A. and Levine, R. (1996). Stock Market,corporate finance and economic growth. World
Bank Economic Review, 10(2): 223-39.
Engle, R. F. and Granger, C. W. J. (1987). Co-integration and Error-Correction: Representation,
Estimation and Testing, Econometrica. 55: 251-76.
Filer, R. K., Hanousek, J. and Campos, N. F. (1999). Do Stock Markets Promote Economic Growth?
Working Paper Number 267. 1-5.
Goldsmith, R. W. (1969). Financial Structure and Economic Growth: A Cross-Country Comparison of
Banks. New Haven: Yale University Press.
Granger, C. W. J. (1986). Developments in the study of cointegrated economic variables, Oxford Bulletin
of Economics and Statistics. 48: 213-28.
Hicks, J. (1969). A theory of Economic History. Oxford, U.K ; University press.
Jalloh, M. (2009). The role of financial markets in economic growth.Waifem regional course on
operations and regulation of capital market, Accra, Ghana. 27-31.
Kenya, R. o. (2007). Kenya Vision 2030; Long Term national planning strategy, Nairobi, Government
Printer.
King. and Levine, R. (1993). Finance and Growth: Schumpeter might be right. The Quarterly Journal of
Economics, 108(3): 717-38.
Levine, R. and Zervos, S. (1998). Stock Markets, Banks, and Economic Growth. The American Economic
Review, 88(3): 537-58.
Lucas, R. E. (1988). On the Mechanics of Economic Development. Journal of Monetary Economics,
22(1): 3-42.
Mackinnon, J. G. (1996). Numerical distribution functions for unit root and cointergration. Journal of
Applied Econometrics,Vol 11(6): 601-18.
Matu, R. W. (2007). Impact of stock market development to economic growth; Case study of Nairobi stock
Market, University of Nairobi Press. 2-10.
Ngugi, R. W. (2003). What Defines Liquidity of the Stock Market?. The Case of the Nairobi Stock
Exchange. Discussion Paper No. 29. Kenya Institute for Public Policy Research and Analysis.
Ngugi, R. W. and Njiru, R. (2005). Growth of the Nairobi Stock Exchange Primary Market. Discussion
Paper No. 47. Kenya Institute for Public Policy Research and Analysis.
Nyakerario, R. M. (2007). Liberalization, Stock Market Development and Investment Efficiency in
Africa. KIPPRA Discussion paper on International Review of Business Research Papers, 3(4):
183-91.
Odhiambo, N. M. (2010). Stock Market Development and Economic Growth in South Africa: An Ardl-
BoundsTesting approach; Department of Economics, Unisa, Pretoria University press. 1-9.
Osei, K. A. (1998). Analysis of factors affecting the development of an emerging capital market: The case
of the Ghana stock market. AERC Research Paper 76; Nairobi. African Economic Research
Consortium press: 37-40.
Osinubi, T. S. (2001). Does Stock Market Promote Economic Growth In Nigeria? Nigeria, Oyo
State,Ibadan: Department of Economics, Faculty of the Social Sciences, University of Ibadan.
Ramsey, F. P. (1928). A mathematical theory of saving. The economic journal, 38(152): 543-59.
Rebelo, S. T. (1991). Long-Run Policy Analysis and Long-Run. Journal of Political Economy, 99(3):
500-21.
Romer, P. (1987). Crazy explanations for the productivity slowdown; URL:
http://www.nber.org/chapters/c11101. Chapter of a book pages 163-210. The MIT Press.

Noble International Journal of Economics and Financial Research
70
Romer, P. M. (1986). Increasing returns and long-run growth. Journal of Political Economy, 94(5): 1002-
37.
Schumpeter, J. A. (1934). The theory of economic development, An Inquiry into Profits, Capital, Credit,
Interest, and the Business Cycle. Harvard University press, Cambridge, MA.
Solow, R. M. (1956). A contribution to the theory of economic growth. The Quarterly Journal of
Economics, 70(1): 65-94.
Tennant, D., Kirton, C. and Abdulkadri, A. (2011). Modelling the Effects of Financial Sector Functions
on Economic Growth in a Developing Country: A Cointegration and Error Correction approach.
The Journal Developing Areas, 44(2): 183-205.
Yartey, C. A. (2008). The Determinants of Stock Market Development in Emerging Economies: Is South
Africa Different’, IMF Working Paper 08/38, IMF, Washington DC. 6-28.
Zhu, A., Ash, M. and Pollin, R. (2002). Stock Market Liquidity and Economic Growth: A critical
appraisal of the Levine/Zervos model; Department of Economics and Political Economy Research
Institute (PERI) University of Massachusetts- Amherst, MA 01002, working paper series no.47. 1-
7.
Related Documents