Faculty of Bioscience Engineering Academic year 2011– 2012 Title of Master’s dissertation Effect of soil properties on availability and mobility of Selenium Name: Azong Valery Funwie Promotors: Prof. dr. ir. Gijs Du Laing, Prof. dr. ir. Filip Tack Tutor: Srikanth Lavu Master’s dissertation submitted in partial fulfilment of the requirements for the degree of Master of Science in Environmental Sanitation August 24th, 2012

Welcome message from author
This document is posted to help you gain knowledge. Please leave a comment to let me know what you think about it! Share it to your friends and learn new things together.
Transcript
Faculty of Bioscience Engineering
Academic year 2011– 2012
Title of Master’s dissertation
Effect of soil properties on availability and mobility of Selenium
Name: Azong Valery Funwie
Promotors: Prof. dr. ir. Gijs Du Laing, Prof. dr. ir. Filip Tack
Tutor: Srikanth Lavu
Master’s dissertation submitted in partial fulfilment of the requirements for the degree of
Master of Science in Environmental Sanitation
August 24th, 2012

i

ii
Acknowledgments
This study would not have been possible without the assistance and support of the following:
Firstly my promoters Prof. dr.ir Gijs Du Laing and Prof. dr.ir Filip Tack for the opportunity
they gave me to pursue the study.
Secondly to my tutor Srikanth Lavu and the staff of the Lab especially Joachim Neri for their
guidance and support throughout the study.
To my family for the moral support
To my classmates and friends for making my stay in Belgium a pleasant one
Finally to GOD Almighty for His guidance and blessings throughout my stay in Belgium.

iii
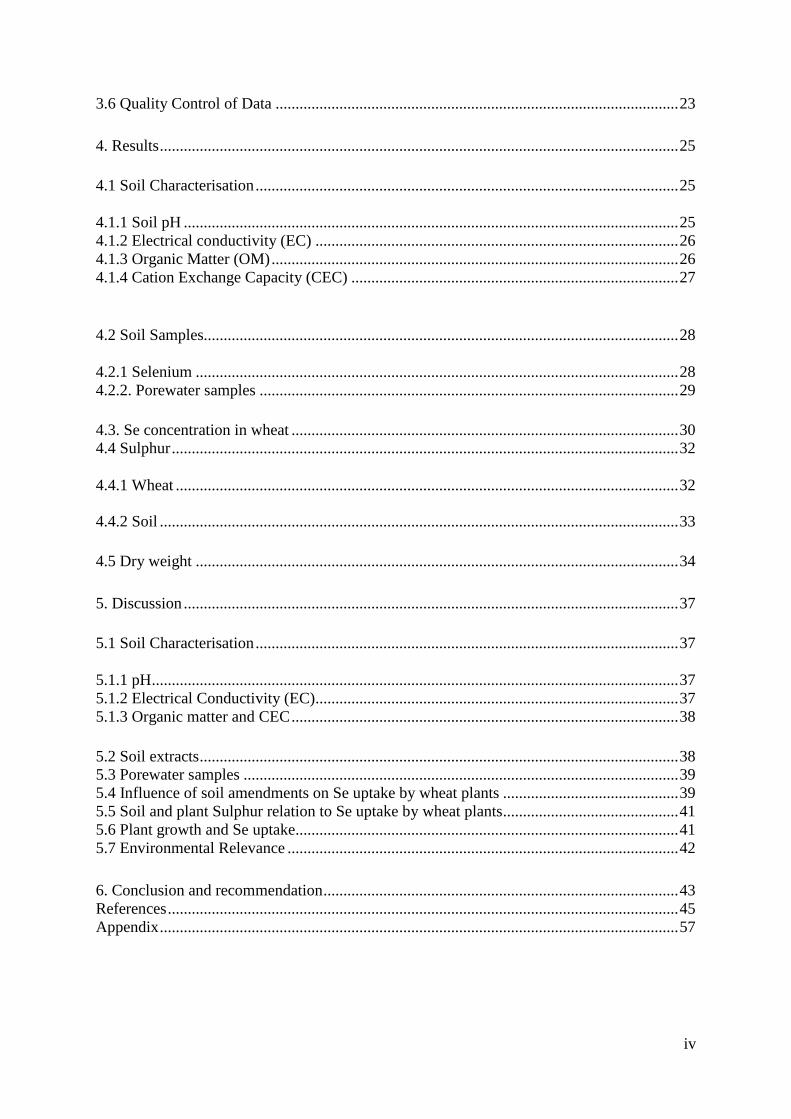
Table of contents
Acknowledgments...................................................................................................................... ii Table of contents ...................................................................................................................... iii List of figures ............................................................................................................................. v List of tables ............................................................................................................................... v
List of abbreviations ................................................................................................................. vi Abstract .................................................................................................................................... vii 1. Introduction ............................................................................................................................ 1
1.1 Background .......................................................................................................................... 1 1.2 Rationale .............................................................................................................................. 2 1.3 Objectives ............................................................................................................................ 3
2. Literature review ................................................................................................................... 4
2.1 Occurrence ........................................................................................................................... 4 2.2 Forms of Occurrence of Se .................................................................................................. 5
2.3 Factors determining Se uptake by plants ............................................................................. 6
2.3.1 Redox potential and pH .................................................................................................... 6 2.3.2 Organic Matter .................................................................................................................. 7 2.3.3 Soil type ............................................................................................................................ 8
2.3.4 Presence of other ions ....................................................................................................... 9 2.3.5 Plant Species ................................................................................................................... 10
2.3.6 Microbial activity ............................................................................................................ 13
2.3.7 Influence of soil amendments on Se uptake ................................................................... 13
2.4 Soil ageing ......................................................................................................................... 15
2.5 Importance of Se for humans ............................................................................................. 15
3. Materials and methods ......................................................................................................... 17
3.1 Experimental Set up ........................................................................................................... 17 3.2 Soil characterisation ........................................................................................................... 20
3.2.1 pH determination ............................................................................................................ 20
3.2.2 Electrical conductivity (EC) ........................................................................................... 20
3.2.3 Organic Matter ................................................................................................................ 21
3.3.4 Cation Exchange Capacity (CEC) .................................................................................. 21
3.4 Multi-element soil extracts ................................................................................................ 21 3.5 Chemical Analysis ............................................................................................................. 22
3.5.1 Plant Samples .................................................................................................................. 22 3.5.2 Porewater samples .......................................................................................................... 23 3.5.3 Soil Extracts .................................................................................................................... 23
iv
3.6 Quality Control of Data ..................................................................................................... 23
4. Results .................................................................................................................................. 25
4.1 Soil Characterisation .......................................................................................................... 25
4.1.1 Soil pH ............................................................................................................................ 25 4.1.2 Electrical conductivity (EC) ........................................................................................... 26
4.1.3 Organic Matter (OM) ...................................................................................................... 26 4.1.4 Cation Exchange Capacity (CEC) .................................................................................. 27
4.2 Soil Samples....................................................................................................................... 28
4.2.1 Selenium ......................................................................................................................... 28 4.2.2. Porewater samples ......................................................................................................... 29
4.3. Se concentration in wheat ................................................................................................. 30 4.4 Sulphur ............................................................................................................................... 32
4.4.1 Wheat .............................................................................................................................. 32
4.4.2 Soil .................................................................................................................................. 33
4.5 Dry weight ......................................................................................................................... 34
5. Discussion ............................................................................................................................ 37
5.1 Soil Characterisation .......................................................................................................... 37
5.1.1 pH .................................................................................................................................... 37 5.1.2 Electrical Conductivity (EC)........................................................................................... 37 5.1.3 Organic matter and CEC ................................................................................................. 38
5.2 Soil extracts ........................................................................................................................ 38 5.3 Porewater samples ............................................................................................................. 39
5.4 Influence of soil amendments on Se uptake by wheat plants ............................................ 39 5.5 Soil and plant Sulphur relation to Se uptake by wheat plants............................................ 41
5.6 Plant growth and Se uptake................................................................................................ 41
5.7 Environmental Relevance .................................................................................................. 42
6. Conclusion and recommendation ......................................................................................... 43 References ................................................................................................................................ 45 Appendix .................................................................................................................................. 57

v
List of figures
Figure 3.1. Experimental set up…………………………………………………………..…19
Figure 4.1. Effect of amendments on soil organic content at T-0 (B = Barium, C=Compost,
PM= pig manure, CM= cow manure)………………………………………………………..26
Figure 4.2. Effect on amendments on soil CEC at T-0 (B: Barium, C: Compost, PM: pig
manure, CM: cow manure)…………………………………………………………………...27
Figure 4.3. Wheat Se concentration grown on: (a) Compost amended soil, (b) pig manure
amended soil, (c) Cow manure amended soil, (d) Lime amended soil, (e) reference treatment
soil. The plants grown on soils spiked with selenate are plotted on a separate axis to those that
were grown on non-spiked soils and soils spiked with selenite……………………………...31
Figure 4.4. S concentration and Se concentration in wheat (T-0: after 2 weeks of stabilisation,
T-1 and T-2: after 1 and 2 months, respectively)…………………………………………….33
Figure 4.5. Soil sulphur and plant selenium concentration (T-0: after 2 weeks of stabilisation,
T-1 and T-2: after 1 and 2 months, respectively)…………………………………………….34
Figure 4.6. Plant dry weight and Se concentration (T-0: after 2 weeks of stabilisation, T-1 and
T-2: after 1 and 2 months, respectively)……………………………………………………...35
Figure 4.7. Correlation of soil-extractable Se and total Se content of wheat………………...36
List of tables
Table 2.1. Chemical forms of Se in the environment………………………………………….5
Table 3.1. Soil amounts used in experiment…………………………………………………17
Table 3.2. Dry weight of amendments………………………………………………………17
Table 3.3. Selenium and sulphur concentrations in reference materials used for quality control
(average ± standard deviation, n = 3)………………………………………………………...23
Table 3.4. Results of replicate analysis of plant selenium and sulphur concentrations for
assessing the analytical variability (average ± standard deviation, n = 3)…………………...24
Table 4.1. Effect of amendments on soil pH (T-0: after 2 weeks of stabilisation, T-1 and T-2:
after 1 and 2 months, respectively)…………………………………………………………..25
Table 4.2. Effect of amendments on soil electrical conductivity (T-0: after 2 weeks of
stabilisation, T-1 and T-2: after 1 and 2 months, respectively)………………………………26
Table 4.3. Se concentrations in soil extracts (mg kg-1
)……………………………………...28
Table 4.4. Se concentration in the porewater (µg L-1
)………………………………………29
Table 4.5. S concentration in wheat (mg kg-1
)………………………………………………32
Table 4.6. S concentration from aqua regia extracts (mg kg-1
)……………………………...33
Table 4.7. Plant dry weight (g)……………………………………………………………….35

vi
List of abbreviations
EDTA: Ethylenediaminetetraacertic acid
S: Sulphur
Se: Selenium
CaCl2: Calcium chloride

vii
Abstract
The effect of soil properties on selenium (Se) mobility and availability to wheat was
investigated to develop strategies for more cost-effective and environmentally safe Se
supplementation. This was done using wheat (Triticum aestivum) plants grown on sandy
loam soils each amended with 5% inorganic (CaCO3) and organic (compost, cow manure and
pig manure) treatments and spiked with 1 mg kg-1
of sodium selenate or sodium selenite. The
control (reference treatment) consisted of an extra treatment spiked with 1 mg kg-1
barium
selenate. The influence of soil ageing on Se mobility and plant availability was also assessed.
Firstly the soil was characterised, including three soils extractions using CaCl2, EDTA and
aqua regia. Also pore water was collected using Rhizon samplers. The results showed that
plants grown on selenate spiked soils had higher Se concentrations compared to plants grown
on selenite spiked soils. In the soils amended with organics, the Se concentration in plants
grown on soils spiked with selenate or selenate was lowest when using cow and pig manure
than when compost is used. Liming of the soil led to an increased Se uptake by plants when
applied to soil in form of selenate. The uptake of Se supplied to the plants in the form of
sodium selenate was found to be higher than barium selenate. Considering the variability in
Se uptake by wheat, there is a risk of environmental contamination especially of ground
water when Se is applied to the soil in the form of selenite and on soils which are amended
with cow and pig manure irrespective of the form in which Se is applied to the soil. However,
organic amendments like compost and cow manure may also supplement the Se
concentration available for plant uptake when used as soil amendments.

1
1. Introduction
1.1 Background
Essential trace elements play a vital role in life considering their use in the synthesis of bio-
molecules on which human and animal life depends. Selenium is an example of an essential
trace element which since the 1970s was well recognized as an essential micronutrient for
human and animal health because of its biological role as a component of the antioxidant
enzyme glutathione peroxidase (GSH-Px; EC. 1.11.1.9), which scavenges hydrogen peroxide
and lipid hydroperoxides to prevent oxidative damage in body tissues (Rotruck et al., 1973).
Aside the essentiality of Se as a micro nutrient, it is also considered as a toxic element to
humans and animals (Ohlendorf, 1989). The toxic effects are mainly as a result of excess
intake or failure of the mechanism regulating its concentration.
Dietary Se levels required by animals are within the range 0.05-0.3 mg Se kg-1
dry matter
(DM), depending on the animal species and the level of vitamin E in the feed (Ohlendorf,
1989; Mayland, 1994; Oldfield et al., 1994). In cereals and cereal products, Se concentration
ranges from 10 to 550 mg kg-1
on a fresh weight basis (FAO, WHO, 2001). The fact that Se
has a very narrow range between dietary deficiency and toxicity (40 µg d-1
and 400 µg d-1
,
respectively; Fordyce, 2007) makes it necessary to control its intake by humans and other
animals, and hence important to understand the relationship between environmental exposure
and health. Thus, increasing the Se content of plants without exceeding the toxic levels for
humans and animals is of major concern considering the Se related health effects.
Through time, low Se concentrations in certain regions of the world have resulted in various
diseases such as the alkali disease, white muscle disease, heart disorder (Keshan disease) and
bone and joint condition (Kashin-Beck disease ) in various parts of China (Fordyce, 2005).
Contrary to this, there are also regions in the world with very high soil Se concentrations.
Due to this variability, Se intake by humans will also show great variability based on the
location. This varies from 7-11 mg d-1
in the Keshan disease area, to several thousands mg
day-1
in the selenosis area in the Enshi county of central China. In Europe, Se intake by adults
is in the range of 30-100 mg d-1
(Combs, 2001).

2
In Se rich and deficient areas, human Se uptake and health effects are dependent on Se uptake
by food crops from the soil, which in turn depends on the plant availability of different Se
forms that may occur. Selenium forms in the environment include selenide, elemental Se,
selenite, selenate and organic Se (e.g. selenomethionine). Amongst these, selenate has been
reported to be the most bioavailable form for plants (Adriano, 1986).The plant bioavailability
also depends on soil factors which include pH, redox condition, soil texture, mineralogy,
organic matter content and the presence of competitive ions (Fordyce, 2007).
It has been estimated that between 0.5 and 1 billion people globally may have inadequate
intakes of Se, and these include populations in developed countries such as Western Europe
(Combs, 2001). It is therefore of paramount importance to develop strategies to improve Se
uptake in such countries. It is therefore of paramount importance to develop strategies to
improve Se uptake in such countries, without inducing toxicity for the human population or
the environment.
1.2 Rationale
Higher plants differ widely in their ability to accumulate Se (Rani et al., 2005; Zhang et al.,
2007). Mayer (1997) reported that dietary Se repletion may reduce cancer incidence in people
at high risk who live in areas with low soil Se. In an attempt to supplement the Se intake by
humans several strategies were put into practice which include foliar application, inorganic
fertilization, seed treatment and soil incorporation of fly ash, municipal refuse incinerator
ash, or sewage sludge (Logan et al., 1987; Mayland et al., 1989; Arthur et al., 1992).
Wheat (Triticum aestivum) and its products were reported to be among the most effective
crops for Se supplementation (Lyons et al., 2003; Hawkesford and Zhao, 2007). Fox et al.
(2005) compared the efficiency of Se absorption from three food sources by humans using
intrinsic labelling with the stable isotopes 77
Se or 82
Se. They found that Se absorption was
significantly higher for wheat (81%) and garlic (78%) compared to fish (56%). Due to the
high uptake of Se, wheat would be a good choice for enhancing intake by humans.
It is worth considering that different types of fertilisers may influence Se bioavailability and
subsequent uptake by wheat. This constitutes the backbone of this study in which the effect of

3
liming and using different organic amendments (compost, cow manure, pig manure) on the
Se mobility, availability and uptake by wheat will be investigated.
1.3 Objectives
The main goal of this study is to explore how different amendments affect Se availability and
mobility in the soil, and its uptake by plants.
The specific objectives are:
1) To investigate the effect of lime, compost, pig and cow manure amendments on Se
mobility, availability and uptake by wheat in a sandy loam soil spiked with 1 mg Se
kg-1
in the form of selenate or selenite.
2) To investigate the impact of soil ageing after Se fertilisation on Se mobility,
availability and uptake by wheat and how these ageing effects depend on soil
amendment and type of Se fertilizer.
This will enable us to obtain insights into the influence of organic and inorganic soil
amendments and soil ageing on Se mobility, availability and uptake by wheat, leading to
more cost–effective and environmentally safe Se supplementation.

4
2. Literature review
2.1 Occurrence
Selenium is a naturally occurring metalloid, essential to human and animal health in trace
amounts but harmful in excess (Fordyce, 2007). Its essentiality to plants still remains
controversial (Minorsky, 2003). Selenium is found in water, air and soil at various
concentrations as a result of natural and anthropogenic activities.
Geology exerts a fundamental control on the concentration of Se in soils on which we grow
the crops and animals that form the human food chain. Hence, with the varying geological
conditions worldwide, Se-rich and Se-deficient areas occur, and thus, varying concentrations
in crops and animals. In general terms, sedimentary rocks contain greater concentrations of
Se than igneous rocks, with exceptionally low levels of 0.1 mg kg-1
in sedimentary rocks like
limestone and sandstones (Fordyce, 2005). Exceptions to this low value in sedimentary rocks
are observed in clays and shales (Neal, 1995). Also, very high concentrations have been
observed in phosphatic rocks probably reflecting similarities between organically derived
phosphate (PO43-
) and selenate (SeO42-
) anions (Fleming, 1980; Jacobs, 1989; Nriagu, 1989;
Neal, 1995). The world mean concentration of Se in soils is 0.4 mg kg-1
(Fordyce, 2005).
The anthropogenic sources are a result of using Se and its compounds for a variety of
purposes, including red pigmentation in glass and ceramics, use in photocopiers, catalysts,
antiseptics against dandruff and fungi in pharmaceutical industries, extraction and processing
of copper and lead, combustion of coal and petroleum fuels, use of phosphate fertilizers,
sewage sludge and manure on land, etc.
Since plants represent a major uptake route of this element by humans an in-depth study of
environmental biogeochemistry controls on distribution and mobility of Se is a prerequisite to
understanding Se- related health effects. These health effects are not only dependent on the
total soil Se concentration but also on the bioavailable forms that can be readily taken up by
plants (Fordyce 2005).
Moxon (1937) was the first to examine the relationship between geology, soil Se
concentrations, uptake into plants, and health outcome in animals. In his study, he reported

5
that soils capable of producing Se-rich vegetation toxic to livestock were found over black
shale and sandstone deposits in the Great Plains of the United States. Subsequent studies (
Muth and Allaway, 1963) focusing on Se-deficiency related diseases in animals led to
production of one of the first maps of the Se status of soils, vegetation and animals, and the
establishment of the classic Great Plain seleniferous soil types.
2.2 Forms of Occurrence of Se
The major forms of Se in the environment include selenide, elemental Se, selenite, selenate
and organic Se (e.g. selenomethionine) (Adriano, 1986). These, their oxidation states and
chemical forms are shown in Table 2.1.
Table 2.1. Chemical forms of Se in the environment.
Oxidative state Chemical forms
Se2-
Selenide (Se2-
, HSe-, H2Seaq)
Se0 Elemental Selenium (Se
0)
Se4+
Selenite (SeO32-
,HSeO3-, H2SeO3aq)
Se6+
Selenate (SeO42-
, HSeO4-, H2SeO4aq)
Organic Se Selenomethionine, Selenocysteine
Source: Jacobs (1989) and Neal (1995).
The different oxidation states determine the forms available for plant uptake. Of these,
selenate is the main bioavailable form followed by selenite. This is explained by the chemical
similarity of sulphur (S) and Se in terms of their oxidation states. Hence, plants can easily
take up selenate through the sulphur pathway (Dahillon and Dahillon, 2004) and therefore
represent a major route through which humans obtain their safe concentration of Se. Selenate
is taken up by plant roots via the high affinity of sulphate transporters (Terry et al., 2000).
There is little know about the selenite uptake mechanism by plants but it was suggested that
selenite is taken up by plant roots via passive diffusion (Shrift and Ulrich 1969; Arvy, 1993).
Selenite is strongly adsorbed by soil minerals and thus has a low bioavailability to plants,
whereas selenate is much more bioavailable (Gissel-Nielsen et al., 1984). Li et al. (2008)
reported that in wheat roots selenite can be taken up by phosphate transporters via a
metabolically-dependent active process. Selenite, upon uptake, is rapidly assimilated into
organic forms in roots and has a low mobility in xylem transport. On the contrary, selenate is
6
not readily assimilated into organic forms, but is highly mobile in xylem transport.
Furthermore, selenite appears to inhibit the transport of selenate in the xylem.
It is estimated that perhaps 50% of Se in some soils is held in organic compounds (Fordyce,
2005). Selenomethionine has been extracted from soils and has been found to be two to four
times more bioavailable to plants than inorganic selenite while selenocysteine is less
bioavailable than selenomethionine (Jacobs, 1989; Mayland, 1994; Neal, 1995).
2.3 Factors determining Se uptake by plants
Selenium mobility and uptake by plants and animals are dependent on its bioavailability. This
is dependent on a number of bio-physical parameters which include pH, redox condition,
chemical form of the element or speciation, soil texture, mineralogy, organic matter content
and the presence of competitive ions in the soil. Hence an understanding of these parameters
is essential for the prediction and remediation of health risks from Se as soils that contain
adequate total Se concentrations can result in Se deficiency if the element is not in a readily
bioavailable form (Fordyce, 2007).
2.3.1 Redox potential and pH
Although transformation between selenite and selenate is a slow process, both forms may co-
exist under the conditions prevalent in agricultural soils (Geering et al., 1968). The oxidising
conditions and pH will therefore determine the forms available for plant uptake. Selenite is
the dominant Se species under moderate redox soil conditions, where it is strongly adsorbed
by iron and aluminium oxides and hydroxides, resulting in limited plant availability and a
low potential for leaching (Elrashidi et al., 1987). The same author also reported that selenate
is the dominant species under high redox soil conditions. Under this high redox condition,
selenate is weakly adsorbed by electrostatic forces of attraction (Jackson and Miller, 1999),
resulting in high plant availability and potential for leaching. Adsorption of these Se forms in
soils also depends on the soil pH. In acidic and neutral soils, selenite is insoluble while in
neutral and alkaline soils, selenate is more available for plant uptake (Fordyce, 2005). This
has been confirmed in experimental studies with 10 times more uptake of Se in Se-selenate
enriched soils compared to Se-selenite enriched soils (Jacobs, 1989; Neal, 1995).

7
Thermodynamic calculations also show that selenate should be the predominant form in
alkaline and well-oxidized soils (pe + pH > 15), and selenite in well-drained mineral soils
with pH from acidic to neutral (7.5 < pe + pH < 15) (Elrashidi et al., 1987).
Elemental Se, selenides and selenium sulphide salts tend to exist in reducing, acidic and
organic rich environments only, which due to their low oxidation potential and solubility,
these species are not bioavailable to plants (Fordyce, 2005). Therefore, in any study of the
selenium status of soil, consideration of the likely bioavailability is important. Of the several
different chemical techniques used to assess bioavailability, the most widely accepted
indicator is the water-soluble Se content (Jacobs, 1989; Tan, 1989; Fordyce et al., 2000b).
The carbonate levels in soils have also been reported to play an important role in buffering
acidic soils to a neutral and slightly alkaline pH (Singh et al., 1998; Vandecasteele et al.,
2002b). Their effect on soil pH will also determine Se availability in soils.
2.3.2 Organic Matter
The influences of organic matter on Se bioavailability are two fold: the binding of Se by soil
organic matter and the decomposition of Se containing organic matter, releasing Se in either a
bioavailable or non-bioavailable form.
A reduction in plant Se with increased organic C in soils was reported by Bisbjerg and
Gissel-Nielsen (1969) and Levesque (1974). The main mechanism is due to fixation by
organometallic complexes. This has been confirmed in experimental set-ups where the uptake
of selenate from organic rich soils is 10 times smaller than in mineral soils (Joacobs, 1989;
Niels, 1995). This was further confirmed in a pot experiment by Johnsson (1991), during
which it was revealed that an increase in organic matter content decreased the Se
concentration in wheat grains from 1350 to 160 µg kg-1
. An indication of the effect on
bioavailability is portrayed in an experiment by Neal and Sposito (1991) who investigated the
effects of organic carbon amendments on selenate immobilisation in soils and found that
addition of dextrose resulted in a transformation of a large portion (64-90%) of added Se042-
into organically associated forms. A similar study on Se bioavailability was carried out by
Dhillon et al. (2010), who reported that incubating naturally occurring selenium forms with
organic amendments led to a substantial decrease (20%-26%) of easily available (water-

8
soluble and extractable) forms of Se and a corresponding increase of (13%-62%) in the less
available (organic matter and metal oxide bound) Se forms.
Another mechanism illustrating the effects of organic amendments to soils on the reduction
of Se bioavailability is the reduction of oxidised forms to elemental Se (Tokunaga et al.,
1996). In seleniferous soils, the accumulation of Se by canola and wheat has been reported to
decrease considerably when treated with organic amendments (Sharma et al., 2011).
Organic matter does not decrease bioavailability but may serve as a supplementary source of
Se to plants. Zawislanski and Zavarin (1996) using sequential extraction techniques
suggested that a large portion of total Se in soils can be in the organic fraction. They
concluded that the release of low molecular-weight Se compounds during organic matter
decomposition may eventually be a source of Se for plant uptake. Information on plant
availability of Se from different seleniferous plant residues and animal manures is thus
needed to better understand Se budget in the environment and to determine strategies for
lowering Se concentrations in soils and to supplement animal diets (Ajawa et al., 1998).
Organic amendments may also introduce large amounts of low-molecular weight organic
acids to soils which strongly affect nutrient mobility and plant availability (Baziramakenga
and Simard, 1998). Selenium retention by various organic manures may depend upon the
type of monocarboxylic and multicarboxylic organic ligands released into the soil during
decomposition (Sharma et al., 2011). Dissolved polysaccharides such as starch, amylopectin,
water-soluble lignin, cellulose acetate, chitosan and carboxymethlcellulose in soils can
immobilise Se by forming stable compounds with selenate (Ferri and Sangiorgio, 1999). A
characterisation of the biochemical nature of organic amendments was thus proposed by
Sharma et al. (2011) to better understand the differences in their efficiency of reducing Se
bioavailability.
2.3.3 Soil type
Soils originate from rocks via the process of weathering. Excessive soil Se concentrations
(greater than 3 mg kg-1
) occur in areas of North America, China and Ireland, whereas
deficient soil Se concentrations (less than 0.125 mg kg-1
) occur in Siberia, New Zealand and

9
the Keshan area of China (Broadley et al., 2006). These are due to differences in the parent
material, which represents an important factor in determining the Se concentrations in soils
(Spadoni et al., 2007). Seleniferous soils therefore originate from a seleniferous parent
material. With such high soil concentrations, one may expect to find high concentrations in
plants and animals. Seleniferous soils with total Se ranging from 0.50 to 4.55 mg kg-1
have
also been identified in Hoshiarpur and Nawanshehar districts of Punjab, India (Dhillon and
Dhillon, 1991). These are alkaline and calcareous in nature with a major portion of the total
Se existing in readily available forms (Dhillon and Dhillon, 2004). Soils with a Se
concentration greater than 0.5 mg kg-1
have been found to produce vegetation absorbing Se at
levels toxic for animal consumption (Dhillon et al., 1992). An exception to this was observed
in Hawaii with up to 20 mg kg-1
total Se but without any effect on vegetation and livestock
because the element was held in iron and aluminium complexes in the humid lateritic soils of
that region (Oldfield, 1999). In Se deficient soils, the Se content of livestock is supplemented
through application of Se to soils by farmers (Gissel-Nielsen et al., 1984; Rimmer et al.,
1990).
An important source of Se in diets is wheat grain and its products, which contributes 22 % of
dietary Se in countries like the UK (Rayman, 2000). However concentrations of Se in
European wheat are generally low (Hawkesford and Zhao, 2007), likely to be caused by low
Se supply from the soil.
2.3.4 Presence of other ions
A significant positive correlation (r > 0.84) has been reported between S and Se content for
raya, rice, maize and wheat (Rani et al., 2005). Sulphate and phosphate ions have an
influence on Se uptake in soils by competing for fixing sites in the soil and plants. Sulphate
inhibits Se uptake by plants with greater effect on selenate compared to selenite. A
synergistic relation interaction between selenate and sulphate was reported by Smith and
Watkinson (1984) and Mikkelsen et al. (1988a, b) who observed that elevated concentrations
of Se in the root zone might increase the plant S accumulation when sulphate concentrations
are low in the root zone. Contrary to this, an antagonistic relationship between sulphate and
selenate was also reported, firstly, by Hurd-Karrer (1938) and subsequently confirmed by
others: Shrift, (1954); Gissel-Nielsen (1973); Spencer (1982); Dhillon and Dhillon (2000);

10
Terry et al., (2000); Adams et al., (2002). Thus, the presence of abundant sulphate in the root
zone of plants could reduce the Se uptake by plants resulting from the antagonistic interaction
between sulphate and selenate ions for plant uptake or may simply reflect a dilution of plant
Se due to increased plant growth as a result of S addition to S-deficient soils (Mikkelsen et
al., 1989). This effect also implies that the main form of Se taken up by wheat is selenate,
because uptake of selenite is not inhibited by sulphate (Li et al. 2008). The threshold S
concentration at the root zone determining the antagonistic or synergistic effect is not known
(Rani et al., 2005).
Selenate does not accumulate in the roots of plants when taken up (Läuchli, 1993), rather it is
translocated to the chloroplasts where it follows the S assimilation pathway (Terry et al.,
2000). This substitute for S leads to the formation of selenoamino acids which enhances
ethylene production (Konze et al., 1978). This can in turn modify the membrane lipid
composition (Thompson et al., 1982), increase membrane permeability and K+
leakage
(Vangronsveld et al., 1993).
Examples of these selenoaminoacids include selonomethionine and selenocysteine.
Selenocysteine may be incorporated into proteins in place of cysteine which affects the
formation of disulfide bridges. This alters the protein structure, leading to inactivation of the
protein, hence reduced enzyme activities and eventual poisoning of the plant (Brown and
Shrift, 1982). This was confirmed by Sharma et al. (2008) who reported deterioration in the
quality of wheat and oilseed rape based on lipid and protein concentrations due to Se
accumulation. Cartes et al. (2006) also reported a decrease in Se incorporation into soluble
proteins in response to increased amounts of S applied to soil. Phosphate addition to soil
increases Se uptake by plants as they readily adsorb on soil displacing selenite from fixation
sites making it more bioavailable. Increased phosphate concentration also dilutes the Se
content of plants by inducing increased plant growth (Jacobs, 1989; Mayland, 1994; Neal,
1995).
2.3.5 Plant Species
Plants vary considerably in their physiological response to excess Se in the growth medium
(Terry et al., 2000), hence determining the Se related health problems in humans and animals

11
(WHO, 1987; Neal, 1995). Appreciable differences in the uptake and transport of various Se
compounds in plants have been reported by Yu and Gu (2007). In contaminated soils
cultivating Se accumulating plants has been suggested for lowering the Se levels (Banuelos,
2001). Brassica species have been deployed in phytoremediation of Se in soils. These were
reported to have a potential for reducing up to 40% of total soil Se under greenhouse
conditions and up to 20% under field conditions after one growing season (Banuelos, 2000).
In seleniferous regions, plants belonging to the cruciferae family absorb much greater
amounts of Se compared to those belonging to the graminae family (Dhillon and Dhillon,
1997).
Toxicity of Se can thus be related to the differences in ability of different plant species to
accumulate the element based on the environmental concentrations. Rosenfield and Beath
(1964) were the first to classify plants in three groups based on ability of Se uptake:
- Se-accumulator plants which grow well in high Se soils and can absorb more than
1000 mg kg-1
;
- Secondary Se-absorbers which absorb between 50-100 mg Se kg-1
;
- Low absorbers (mostly grains and grasses) which accumulate less than 50 mg Se kg-1
.
The variability in absorption is due to differences in metabolism of Se. Plants contain many
different Se compounds and the main form in non-accumulator species is protein-bound
selenomethionine. However, selenocysteine and selenonium have also been reported (Jacobs,
1989; Niels, 1995). In accumulator plants, Se metabolism is based on water-soluble non-
protein forms such as Se-methlylselenomethionine. The exclusion of Se from proteins in
accumulator plants is thought to be the basis of Se tolerance (Jacobs, 1989; Niels, 1995).
Plants also have the ability to reduce selenate to elemental Se0 and selenide Se
2- forming
volatile organic compounds like dimethylselenide and dimethyldiselenide, which are all
released during respiration giving rise to a ‘‘garlic’’ odour characteristic of Se-accumulating
plants (Mayland, 1994).
The mechanism of absorption also influences the concentration in the plant. Both selenate
and organic Se compounds are absorbed by plant roots through active processes whereas
selenite uptake seems to be through passive diffusion (Terry et al., 2000; White et al., 2004).
Despite these various mechanisms of coping with Se, plants can also suffer toxicity via the
following ways (Jacobs, 1989; Rergusson, 1990; Mayland, 1994; Wu, 1994):
1) Se competes with essential metabolites for sites in the plant biochemical structure;
12
2) Se may replace the essential ions, mainly the major cations (e.g. iron, manganese,
copper and zinc);
3) Selenate can occupy the sites for essential groups such as phosphate and nitrate;
4) Se can be incorporated into analogues of essential sulphur compounds in plant tissues.
Other effects have been reported in plants. As an example, a decrease in plant growth from
excessive Se has been reported (Wan et al., 1988; Mikkelsen et al., 1988a). In wheat plants
growth and metabolism is affected by soil concentrations greater than 2 µg g-1
(Yang et al,
1983). Hartikeinen et al (2000) also reported that aside the effects on plant metabolism, at
low concentrations Se acts as an antioxidant in plants inhibiting lipid peroxidation. At high
concentrations (> 10 µg g-1
), it acts as a pro-oxidant encouraging the accumulation of lipid
peroxidation products leading to high yield losses. In general, root crops contain higher Se
concentration than other plants and plant leaves often contain higher concentrations than the
tuber. Also, crop species grown in very low Se-soils show very little difference in uptake and
changing the type of plant has no significant impact on the Se content of crops (Jacobs,
1989).
Loss of dry matter yields have also been reported to be associated with an increase in the Se
content of plant tissues. This was attributed to the substitution of Se in place of S in essential
organic compounds leading to the disruption of normal biochemical reactions and enzyme
functions (Anderson and Scarf, 1983). Dry matter production in raya, maize and wheat was
reported to be adversely affected by high levels of Se in the soil (Rani et al., 2005). Another
toxicity symptom occasionally seen in wheat grown on Se toxic soils is snow-white chlorosis
with pink colouration on the lower side of the leaves (Rosenfeld and Beath, 1964; Dhillon
and Dhillon, 2000). Sharma et al. (2011) reported a decrease in the protein and lipid
concentrations in rape grains due to Se accumulation at high levels. This was attributed to the
incorporation of Se in nonprotien aminoacids such as Se-methylselenocysteine, i.e.,
replacement of S in cysteine and methionine (Nigam and McConnell, 1973), thereby making
these amino acids partly unavailable for protein synthesis. The decrease in lipid concentration
due to Se accumulation was thought to have resulted from a decrease in the activity of fatty
acid synthetase and acetyl CoA carboxylase, which are the enzymes having SH groups at the
active site and most possibly incorporate Se in place of S (Terry et al., 2000).

13
In Se deficient areas, biofortification of Se in crops, through Se fertilization, has been
practised in many countries of the world such as Finland since the mid-1980s (Eurola et al.,
1991). Breeding or genetic manipulation of crops with enhanced Se uptake has been proposed
as an effective way of increasing human Se intake through plants (Lyons et al., 2003;
Broadley et al., 2006). Wheat plants have been reported to accumulate Se to levels safe for
human and animal consumption at concentrations lower than 3 µg Se g-1
of soil though a
significant reduction in dry matter yield was observed for plants grown on soils with soil Se
concentrations greater than 4 µg g-1
(Rani et al., 2005). Plants like canola and tall fescue
grown on soils amended with seleniferous or organic materials accumulate Se below levels
toxic to humans (Ajawa et al., 2005).
2.3.6 Microbial activity
Volatilisation of Se in soils is due to microbial activity. Microbes play a major role in the
oxidation and reduction of Se. Ajawa et al. (2005) reported a reduction in selenate
bioavailability due to stimulated microbial assimilatory reduction of added selenate in soils
treated with alfalfa residue or cattle manure. Their results also suggested that a large fraction
of Se in seleniferous plant residues incorporated into soils would be volatilized, but only a
small fraction of Se in seleniferous cattle manure would be volatilized, and therefore, Se may
accumulate in soils. Facultative anaerobes like Enterobacter cloacae SLD1a-1 reported to be
capable of reducing selenate and selenite to elemental selenium (Losi and Frankenberger,
1997) was found to volatalise dimethylselenide in the presence of SeO3 at an optimum pH,
temperature and electrical conductivity of 6.5, 35oC and 11 dS m
-1, respectively. Microbial
activity therefore is of great importance when considering selenium bioavailability in soils.
2.3.7 Influence of soil amendments on Se uptake
Apart from organic amendments, inorganic soil amendments also play a role in determining
the Se concentrations of plants. Fertilisation techniques have been reported to play an
important role in determining the trace metal content of cereal grains (Pessi et al., 1974).
Wheat Se content grown on clay-loamy soils treated with organic manure was observed to be
higher than those treated with inorganic fertilizer (Gissel-Nielsen, 1974). Martens and Suarez
(1997a) investigated the assimilation of SeO42-
by alfalfa and mineralization of fresh alfalfa

14
residue in soil. They found that 25% of the total Se assimilated was present as free Se-amino
acids, Se-methylcysteine, selenomethionine, and selenocystine, but 30% of the assimilated Se
was mineralized to water-soluble, non-amino acid, selenide-Se, and the remaining organic
selenide- Se persisted in protein form. In another study, Martens and Suarez (1997b) found
different mineralization and volatilization rates for the selenoamino acids, selenomethionine,
and selenocystine in soils amended with animal manure. Their findings suggested that if
selenomethionine is the dominant aminoacid Se species in plant residue or animal manure,
then most of the Se will be volatilized. However, little volatilization is expected from
selenocysteine because it is very unstable in soil and will rapidly oxidize to Selenate, and
eventually to Se°.
Gypsum, an inorganic amendment to soils was also reported to increase Se uptake by plants
with low absorbing capacity (Bawa et al., 1992; Dhillon and Dhillon, 2000). An exception to
this was observed in wheat where the uptake of Se was reported to be reduced after a growth
period of 2 years at a gypsum application rate of 0.8 t ha-1
. Application of gypsum was thus
concluded to aid in effectively reducing the risk of Se over-exposure to animals and humans
that depend on the diet based source of Se from wheat and rice grown in the seleniferous
region of Punjab (Dhillon and Dhillon, 2000). In white clover, a significant increase in shoot
Se concentration when the soil is treated with lime was reported (Mora et al., 2008).
Selenium fertilisation of crops has been shown to significantly enhance Se concentrations in
crops grown on soils with low plant available Se concentrations. Finland had successfully
applied agronomic biofortification with Se since 1984, with the annual input of Se fertiliser
dose being 10 g Se ha−1
(Hartikainen, 2005). However, the fate of Se fertiliser in Finnish soils
was not accounted for, considering that less than 20 % of applied selenate was taken up by
the crops (Keskinen et al., 2009). It was assumed that selenate is reduced and immobilised in
the soil (Keskinen et al., 2009), which is supported by evidence of a limited residual effect.
As an example, the application of 10 g Se ha−1
selenate to cereals grown in a Canadian soil
was found to have a negligible residual effect after 1 year (Gupta, 1995). However, to
monitor the fate of Se fertiliser in soil directly, changes in the concentration and speciation of
Se in soil should be determined (Stroud et al., 2010).
15
2.4 Soil ageing
The transformation of a parent material to clay is due to weathering. This and the
decomposition of organic matter over time in soils define the soils age. In soils and
sediments, pollution retention is a common phenomenon which increases over time (ageing)
explained by the continuous sorption and hence, reduction in bioavailability. This is mainly
due to the activity of soil organic and mineral matter through the following mechanisms;
adsorption onto mineral surfaces, absorption into flexible (soft) natural organic matter,
adsorption on condensed (hard) natural organic matter, diffusion in micro-porous media and
encapsulation. These processes as well as physico-chemical driven processes control the
sorption and slow release of trace elements in soils, hence determining their bioavailability
(Loibner, 2006).
This is illustrated by Tack and Vandecastele, (2008) in a review paper on the cycling and
ecosystem impact of metals in contaminated calcareous dredged sediment-derived soils
(Flanders, Belgium), who reported that although soil physico-chemical properties favour a
low metal bioavailability, pore water concentrations can be elevated, compared to pore water
in uncontaminated soils. This probably caused by the dynamics in the soil over time.
2.5 Importance of Se for humans
The intake of Se in countries like the UK is below the reference nutrient intake, which is a
cause for concern (Broadley et al., 2006). Humans rely on plants for their Se supply. In
plants, the exact use of Se has not been defined while in humans Se serves as a major
component of enzymes and glutathion peroxidase (GHS-Px) which acts as an antioxidant
preventing oxidative cell degeneration. Through time, the deficiency of this element has been
associated with the main cause of diseases like white muscle disease, heart disorder (Keshan
disease), and bone and joint condition (Kashin-Beck disease) in various parts of China, and
malfunctioning of thyroid hormone metabolism. In animals, the “alkali disease” associated
with hair and hoof lose has been reported in areas of the world with seleniferous soils like
China (Fordyce, 2007). In humans Se poisoning also causes loss of hair, skin decolouration,
nail abnormality and anaesthesia (Yang, 1989).
The use of Se-bearing fertilizers has thus been used to remediate Se deficiency in a number of
countries. In certain regions of the world such as the north-eastern parts of Indian Punjab,

16
elevated levels of Se in agricultural soils have resulted in severe health problems in animals
and humans (Dhillon and Dhillon, 1991, 1997).
Due to the complementary role of Se and vitamin E, all Se deficiency diseases in animals are
linked with vitamin E deficiency with the exception of neutrophil microbicidal activity
reduction and the 5-deiodinase enzymes responsible for the production of triiodothronine
from thyroxine (Fordyce, 2005).
Shamberger and Frost (1969) reported an inverse relationship between Se in crops and human
blood versus cancer incidence in the United States and Canada depicting the anticarinogenic
effect of Se.
Low dietary intakes of Se by humans can thus cause health disorders, including oxidative
stress-related conditions, reduced fertility and immune function, and an increased risk of
cancer (Rayman, 2000, 2002; Whanger, 2004).

17
3. Materials and methods
3.1 Experimental Set up
Forty-five kg of homogenised air-dried sandy loam soil was divided into five parts. Of these,
one part was used as reference soil while the remaining four were each amended with fresh
compost, cow manure, pig manure and lime (CaCO3), respectively. The respective amounts
of soil were 11 kg and 8.5 kg for the reference soil and the remaining four amended soils,
respectively (Table 3.1).
Table 3.1. Soil amounts used in experiment.
Treatment Amount of soil/ kg
Reference 11
Compost 8.5
Cow manure 8.5
Pig manure 8.5
Lime 8.5
The compost, cow and pig manure amended soils represent the organic amended soils, while
the soil to which lime was added represents the inorganic amended soil. The fresh compost,
cow manure and pig manure were oven-dried at 60oC for 48 h to determine their dry weight
content (Table 3.2). An amount of fresh weight corresponding with 5% dry weight was added
to each soil for the organic amended soils. In the lime amended soil, lime was added at 5% of
soil dry weight. In order to ensure homogeneity, the soils with each amendment were mixed
in open top plastic containers. No amendments were added to the reference soil
Table 3.2. Dry weight of amendments.
Treatment Dry weight/ %
Compost 78.3
Cow manure 21.2
Pig manure 28.7
Each amendment was divided into three subgroups, each consisting of 1 kg sampling pots
and 500 g pots used for growing wheat.

18
The pots were filled with 1 kg, 0.5 kg and 0.5 kg of amended or reference soil, respectively,
and spiked with Se solution containing a particular selenium salt (10 mg Se L-1
) to obtain 1
mg Se kg-1
soil. The Se solution was applied to the surface after which the soils were mixed
in open top plastic containers to ensure homogeneity and the contents were retransferred to
their respective pots.
The subgroups each constituted of:
1) a blank treatment which constituted of sandy-loamy soil with and without amendment to
which no selenium salt was added.
2) a sodium selenite (Na2SeO3) treatment which constituted of sandy-loamy soil with and
without amendment, spiked with 1 mg Se kg-1 in the form of sodium selenite.
3) a sodium selenate (Na2SeO4) treatment; which constituted of sandy-loamy soil with and
without amendment, spiked with 1 mg Se kg-1 in the form of sodium selenate.
In the reference treatment subgroup, an extra treatment was added which constituted the bare
sandy loam soil spiked with 1 mg Se kg-1
in the form of barium selenate (BaSeO4).
The pots were then labelled indicating the main groups and subgroups. The main groups
included:
Group 1 (Treatment 1): the reference soil
Group 2 (Treatment 2): the compost amended soil
Group 3 (Treatment 3): the cow manure amended soil
Group 4 (Treatment 4): the pig manure amended soil
Group 5 (Treatment 5): the lime amended soil.
The subgroups were labelled based on the form of selenium spiked to the soil.
These subgroups were again divided into three groups, labelled as T-0, T-1 and T-2. These
labels represent the time periods during which they would be used for growing wheat: T-0
represents the pots which were used for growing wheat after 10 days of stabilisation, T-1 and
T-2 represent the pots which were used to grow wheat after one and two months of
incubation, respectively.
The moisture content in each pot was maintained at 20% by compensating for the deficit with
distilled water. A schematic representation of the experimental set up is given in Figure 3.1.
19
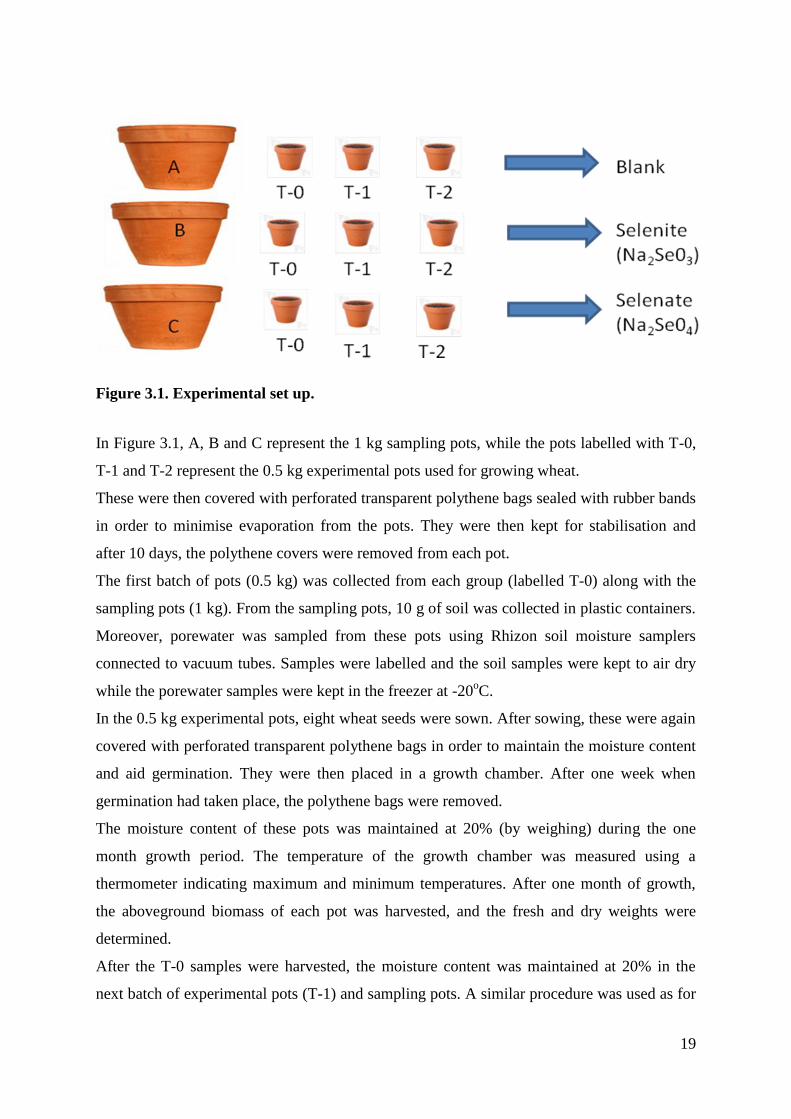
Figure 3.1. Experimental set up.
In Figure 3.1, A, B and C represent the 1 kg sampling pots, while the pots labelled with T-0,
T-1 and T-2 represent the 0.5 kg experimental pots used for growing wheat.
These were then covered with perforated transparent polythene bags sealed with rubber bands
in order to minimise evaporation from the pots. They were then kept for stabilisation and
after 10 days, the polythene covers were removed from each pot.
The first batch of pots (0.5 kg) was collected from each group (labelled T-0) along with the
sampling pots (1 kg). From the sampling pots, 10 g of soil was collected in plastic containers.
Moreover, porewater was sampled from these pots using Rhizon soil moisture samplers
connected to vacuum tubes. Samples were labelled and the soil samples were kept to air dry
while the porewater samples were kept in the freezer at -20oC.
In the 0.5 kg experimental pots, eight wheat seeds were sown. After sowing, these were again
covered with perforated transparent polythene bags in order to maintain the moisture content
and aid germination. They were then placed in a growth chamber. After one week when
germination had taken place, the polythene bags were removed.
The moisture content of these pots was maintained at 20% (by weighing) during the one
month growth period. The temperature of the growth chamber was measured using a
thermometer indicating maximum and minimum temperatures. After one month of growth,
the aboveground biomass of each pot was harvested, and the fresh and dry weights were
determined.
After the T-0 samples were harvested, the moisture content was maintained at 20% in the
next batch of experimental pots (T-1) and sampling pots. A similar procedure was used as for

20
the T-0 pots and the same samples were collected. The same procedure was again used for
the T-2 pots after the T-1 samples were harvested. The average maximum and minimum
temperature during the entire growth period was 27oC and 20
oC, respectively.
3.2 Soil characterisation
The following analyses were done on the air-dried 10 g soil samples:
Determination of soil pH, electrical conductivity, organic matter content and cation
exchange capacity
Analysis of selenium in soil extracts, including CaCl2, EDTA and aqua regia extracts.
3.2.1 pH determination
The pH-H2O or the actual acidity was measured in a soil-water suspension. Therefore, 50 mL
of distilled water was added to a glass beaker containing 10.00 grams of sediment. The
suspension was stirred using a glass rod and then left to equilibrate for 16 hours. After
equilibration the pH was measured using a pH electrode (model 520A pH meter, Orion
Research Inc., Boston, MA, USA).
3.2.2 Electrical conductivity (EC)
The EC of a solution is an indicator of the amount of soluble salts. This electro-chemical
property is based on the fact that the conductance (inverse of the electrical resistance, ohm,
Ω) of a solution increases as the concentrations in cations and anions (carriers of electric
charges) increase. The EC is expressed in mmho cm-1
or mS cm-1
(mmho = millimho, mho =
1/Ω = Siemens = S) at a temperature of 25oC. The EC is the conductance measured with a
conductimetric cell composed of two electrodes having a 1 cm2 surface area, separated from
each other by 1 cm. The relationship between the amount of dissolved salts and the EC is
directly proportional, notably: mS cm-1
x 10 = meq L-1
.
Therfore, 50 mL of distilled water was added to a 250 mL erlenmeyer flask containing 10.00
grams of sediment. This was put on a shaker for 1 h, after which it was filtered. The EC was
then measured from the filtrate. The EC abbreviated ECe, is used for the soil salinity

21
classification in relation to the levels of tolerance of different crops. The ECe varies in the
order of 0.01 to 10 mS cm-1
. Below 2 mS cm-1
, the effects of the salinity are generally
negligiable; above 16 mS cm-1
, only a few very tolerant crops are resistant. Details about the
procedure are given in the ‘‘Manual for the soil chemistry and fertility laboratory’’ (Van
Ranst et al., 1999).
3.2.3 Organic Matter
The organic matter content was determined by ashing. Labelled crucibles were dried in an
oven at 100oC for 1 h, after which they were put in an excicator to cool down. Thereafter, 3 g
of air-dried soil was weighed into the crucibles using an analytical balance and ashed for 2
hours at 550oC in a muffle furnace. After ashing, the crucibles were allowed to cool in an
excicator and re-weighed using an analytical balance. The difference in weight of the soil
before and after ashing represents the amount of organic matter in the sample.
3.3.4 Cation Exchange Capacity (CEC)
The determination of the CEC with ammonium acetate at pH 7 was carried out in three steps,
notably;
- saturation of the adsorption complex by the ammonium ion (NH4+) and extraction of
exchangeable bases;
- washing of the soil with alcohol in order to eliminate the excess ammonium solution
that filled up the pores;
- qualitative analysis of the ammonium after desorption with potassium ion (K+).
The exchange reactions can be accomplished by successive extraction, equilibration,
centrifugation and decantation (discontinuous method) or by percolation (continuous
method). Quantitative analysis of ammonium was done by steam distillation. Details on the
procedure are given in the ‘‘Manual for the soil chemistry and fertility laboratory’’ (Van
Ranst et al., 1999).
3.4 Multi-element soil extracts
Many extraction solutions have been developed that permit simultaneous extraction of a
fairly wide range of bioavailable and /or phytotoxic elements and nutrients. The quantities

22
extracted correspond either to the nutritive state, i.e., to the bioavailable fractions, or the level
of pollution in the soils. The bioavailable fractions are extracted using extracting agents,
which chemically simulate the root-soil interaction, by acting on solubilization, sorption and
complexing reactions which are fundamental to the dynamics of nutrient and bioavailable
element transfer. Three extracts were made on the soils; ammonium acetate and ethylene
diamine tetracertic acid (EDTA) pH 4.65, CaCl2 (0.01M) and aqua regia, which are amongst
those accepted by the major agronomic research organisations (e.g. FAO, USDA, CIRAD).
The ammonium acetate-EDTA and CaCl2 (0.01M) extracts were each made from 10 g of soil
using 50 mL of each solution. The extracts were stored by plastic containers. Two drops of
HNO3 were added to the CaCl2 extracts prior to storage in a refrigerator at 4oC. The aqua
regia extracts were made from 1 g of soil using 7.5 mL HCl and 2.5 mL HNO3. Details on the
extraction procedures can be found in the ‘‘Manual for the soil chemistry and fertility
laboratory’’ (Van Ranst et al., 1999).
3.5 Chemical Analysis
3.5.1 Plant Samples
Approximately 0.2 g of each grounded sample was weighed in 50 mL microwave tubes using
an analytical balance after which they were digested chemically using 2.5 mL HNO3 and 2.5
mL hydrogen peroxide (H2O2) taken with a manual pipette. They were not tightly closed and
left overnight in a fume cupboard.
These were then digested in a microwave oven at 1200W in three steps: firstly at 55oC for 10
minutes, then at 75oC for 10 minutes and finally at 100
oC for 45 minutes.
Thereafter the content of each tube was diluted to the 50 mL mark using distilled water. The
cap was tightly fitted and the tube was then shaken to ensure homogeneity.
Approximately 20 mL from each tube was filtered using a filter paper into 20 mL test tubes.
Thereafter, a 1/10 dilution with internal standard (Indium) was prepared from the filtered
samples and the Se concentration in each diluted extract was determined by inductively
coupled plasma mass spectrometry (ICP-MS, PerkinElmer Elan DRC-e, USA).
The remainder of the sample (filtered but not diluted) was then used to analyse for S by
inductively coupled plasma optical emission spectrometry (ICP-OES, Varian Vista MPX,
Palo Alto, USA).

23
3.5.2 Porewater samples
The frozen Rhizon samples were left to defrost in test tube racks after which their contents
were transferred into labelled test tubes. Thereafter, a 1/10 dilution with internal standard
(Indium) was prepared from the defrost samples and the Se concentration in each diluted
sample was determined by inductively coupled plasma mass spectrometry (ICP-MS,
PerkinElmer Elan DRC-e, USA).
3.5.3 Soil Extracts
From each of the soil extracts, approximately 20 mL was transferred into labelled test tubes.
A 1/10 dilution was made from each test tube with Indium as internal standard and analysed
for Se via inductively coupled plasma mass spectrometry (ICP-MS, PerkinElmer Elan DRC-
e, USA). Considering the high concentration of the soil extracts spiked with selenate, a 1/10
dilution was first prepared with distilled water after which a further 1/10 dilution was made
with Indium as internal standard before analysis. The remainder (for the aqua regia extracts)
was analysed for S by inductively coupled plasma optical emission spectrometry (ICP-OES,
Varian Vista MPX, Palo Alto, USA).
3.6 Quality Control of Data
Three plant reference materials were used. They included spruce needles (BCR 101), sea
lettuce (BCR 279) and leak (own reference sample). The reported S for spruce needles after
12 months of storage is 1690 ± 38 mg kg-1
, while the reported Se concentration in sea lettuce
is 0.59 ± 0.04 mg kg-1
.Their analysed Se and S concentrations are shown in Table 3.3.
Table 3.3. Selenium and sulphur concentrations in reference materials used for quality
control (average ± standard deviation, n = 3)
Reference Material S/ mg kg-1
Se/ mg kg-1
Spruce needles 1568 ± 12 0.058 ± 0.001
Sea lettuce 26383 ± 50 0.83 ± 0.09

24
As the experimental setup was not replicated, the analytical variability was assessed by
analysing some randomly chosen plant samples 3 times for Se and S. Results, i.e. standard
deviations on replicate analysis, are presented in Table 3.4.
Table 3.4. Results of replicate analysis of plant selenium and sulphur concentrations for
assessing the analytical variability (average ± standard deviation, n = 3)
Treatment Sample S/ mg kg-1
Se/ µg kg-1
Reference_blank_selenite T-0 3852 ± 133 16483 ± 967
Cow manure_selenite T-0 3139 ± 12 1605 ± 107
Cow manure_selenate T-0 4090 ± 28 20924 ± 3230
Compost_blank T-1 3240 ± 85 545 ± 192
Lime_selenate T-1 9761 ± 488 303775 ± 31559
Reference_blank T-2 3441 ± 43 445 ± 61
Pig maure_selenate T-2 4920 ± 51 33868 ± 1118
Lime_selenite T-2 4044 ± 282 14362 ± 125

25
4. Results
4.1 Soil Characterisation
4.1.1 Soil pH
Table 4.1. Effect of amendments on soil pH (T-0: after 2 weeks of stabilisation, T-1 and
T-2: after 1 and 2 months, respectively).
Treatment Spike T-0 T-1 T-2
Reference Blank 6.6 7.5 7.4
Sodium selenite 6.6 7.5 7.2
Sodium selenate 6.6 7.5 7.3
Barium selenate 6.8 7.5 7.4
Compost Blank 6.7 7.6 7.5
Sodium selenite 6.7 7.5 7.5
Sodium selenate 6.8 7.5 7.6
Pig manure Blank 6.6 6.9 7.1
Sodium selenite 6.6 6.9 7.0
Sodium selenate 6.8 6.7 7.1
Cow manure Blank 7.3 8.1 8.5
Sodium selenite 7.2 7.8 8.7
Sodium selenate 7.2 7.9 8.1
Lime Blank 7.0 7.6 7.9
Sodium selenite 7.0 7.8 7.9
Sodium selenate 7.0 7.8 7.8
In all soils, the initial soil pH was lower than the pH measured after one and two months.
Applying pig manure resulted in a decrease in pH compared to the non-amended and
compost-amended soil. Applying cow manure resulted in the highest increase of soil pH.
Initially, the pH was already higher in the soil amended with cow manure, compared to the
non-amended soil. Moreover, the pH still significantly increased between the first and the
second month. When lime is used, the pH is also higher compared to the non-amended soil
and also significantly increases with time, but it however already stabilises after 1 month. The
pig manure amended soil spiked with selenite and the blank reference soils at the first
sampling time had the lowest pH (6.6) while the soil amended with cow manure and spiked
with selenite sampled after two months had the highest pH (8.7).

26
4.1.2 Electrical conductivity (EC)
Table 4.2. Effect of amendments on soil electrical conductivity (T-0: after 2 weeks of
stabilisation, T-1 and T-2: after 1 and 2 months, respectively).
Treatment Spike T-0 T-1 T-2
Reference Blank 430 526 471
Sodium selenite 465 509 455
Sodium selenate 353 347 310
Barium selenate 408 791 423
Compost Blank 447 576 422
Sodium selenite 503 610 518
Sodium selenate 448 746 670
Pig manure Blank 1282 1969 1526
Sodium selenite 1355 2300 1806
Sodium selenate 1327 2240 1808
Cow manure Blank 1251 1143 1014
Sodium selenite 1206 1429 1070
Sodium selenate 1247 1419 1016
Lime Blank 401 494 438
Sodium selenite 305 506 389
Sodium selenate 389 500 360
The EC in the soils was highest after one month. The pig manure treatments resulted in the
highest EC, followed by the cow manure treatments, while the lime treatments resulted in the
lowest EC. The compost treatment did not significantly increase the EC compared to the non-
amended soil.
4.1.3 Organic Matter (OM)
Figure 4.1. Effect of amendments on soil organic content at T-0 (B = Barium,
C=Compost, PM= pig manure, CM= cow manure).
0
1
2
3
4
5
6
7
8
Org
an
ic c
on
ten
t/ %
Treatment

27
The organic matter content significantly increased when cow manure, pig manure and
compost were added, with cow manure resulting in the highest increase. Lime treatment did
not significantly increase the organic matter content compared to the non-amended soil.
4.1.4 Cation Exchange Capacity (CEC)
Figure 4.2. Effect on amendments on soil CEC at T-0 (B: Barium, C: Compost, PM: pig
manure, CM: cow manure).
The compost, pig and cow manure amendments resulted in an increase in CEC compared to
the non amended soils. The CEC was highest for the compost treatment and lowest for the
lime amended soils.
0
2
4
6
8
10
12
14
16
CE
C/
cm
ol+
kg
-1
Treatment

28
4.2 Soil Samples
4.2.1 Selenium
Table 4.3. Se concentrations in soil extracts (mg kg-1
).
Treatment Spike Aqua regia CaCl2 EDTA
T-0 T-1 T-2 T-0 T-1 T-2 T-0 T-1 T-2
Reference Blank 0.30 0.51 0.53 0.01 0.01 0.01 0.05 0.06 0.05
Sodium selenite 1.40 1.33 1.53 0.11 0.15 0.10 0.46 0.60 0.48
Sodium selenate 1.48 1.73 1.64 0.70 1.28 0.90 1.39 2.32 1.66
Barium selenate 1.58 2.58 1.60 0.66 2.03 0.68 1.32 3.84 1.24
Compost Blank 0.54 0.44 0.50 0.01 0.01 0.01 0.06 0.06 0.05
Sodium selenite 1.44 1.28 1.22 0.12 0.13 0.09 0.51 0.52 0.41
Sodium selenate 1.36 2.36 1.88 0.77 1.58 1.21 1.66 3.12 2.15
Pig manure Blank 0.60 0.64 0.69 0.02 0.02 0.01 0.08 0.07 0.06
Sodium selenite 1.46 1.43 1.79 0.15 0.21 0.14 0.45 0.41 0.35
Sodium selenate 1.58 1.32 1.89 0.79 1.91 1.20 1.68 3.21 2.03
Cow manure Blank 0.57 0.49 0.50 0.01 0.01 0.01 0.08 0.07 0.06
Sodium selenite 1.38 1.19 1.52 0.06 0.07 0.06 0.41 0.32 0.32
Sodium selenate 1.54 2.85 1.96 0.24 0.50 0.33 0.59 0.98 0.62
Lime Blank 0.44 0.43 0.49 0.01 0.01 0.01 0.07 0.06 0.06
Sodium selenite 1.49 1.41 1.54 0.10 0.16 0.10 0.52 0.59 0.45
Sodium selenate 1.37 1.72 1.48 0.81 1.48 0.72 1.78 2.38 1.37
Aqua regia extracts are used for extracting (pseudo-) total trace element contents, so logically they always extracted the highest Se amounts
(Table 4.3). As EDTA is a strong complexing agent, it also extracted more Se compared to CaCl2. The highest CaCl2- and EDTA-extractable
concentrations were usually observed after 1 month of incubation. Overall, Se was more CaCl2- and EDTA-extractable when selenate was used
compared to when selenite was used, indicating a higher mobility of selenate compared to selenite. Overall, the use of compost, pig manure and

29
Lime on soils spiked with selenate increased the CaCl2- and EDTA-extractability of Se
compared to the non-amended soil, whereas the use of cow manure decreased it. This was
also the case for selenite, for which compost also seemed to have a reducing effect. Liming
resulted in a slight increase of extractability in the selenate-spiked soils. Among the different
amendments, use of pig manure resulted in the highest CaCl2- and EDTA-extractability, and
thus the highest mobility of Se.
4.2.2. Porewater samples
Table 4.4. Se concentration in the porewater (µg L-1
).
Treatment spike T-0 T-1 T-2
Reference Blank 6.2 6.5 6.9
Sodium selenite 264 366 239
Sodium selenate 4043 2204 2966
Barium selenate 2312 2139 1177
Compost Blank 6.2 2.3 3.7
Sodium selenite 207 187 160
Sodium selenate 2684 2600 2793
Pig manure Blank 21.2 12.6 8.2
Sodium selenite 280 187 143
Sodium selenate 1787 1410 1193
Cow manure Blank 17.3 15.1 16.2
Sodium selenite 121.8 90.6 54.3
Sodium selenate 1230 751 401
Lime Blank 7.4 6.2 6.2
Sodium selenite 232 206 145
Sodium selenate 3769 2260 1237
The results generally indicate a decrease of Se concentrations in pore water with time. In
selenate spiked soils the Se concentration in pore water was much higher compared to the
selenite spiked soils. In the spiked soils, the use of amendments resulted in lower Se
concentrations in the porewater compared to the non-amended soil. Cow manure was the
most effective in reducing Se concentrations in the porewater, whereas liming was the least
effective. However, in the blank (non-spiked) soil, using pig and cow manure resulted in
increased Se concentrations in the porewater. Porewater concentrations usually decreased
with time in the spiked soils, except in the compost-amended soil spiked with selenate.

30
4.3. Se concentration in wheat
The plants grown on selenate spiked soils had the highest Se concentration followed by those
grown on selenite spiked soils. The plants grown on non-spiked soils had the lowest Se
concentration (Figure 4.3). The difference in Se concentration between the plants grown on
soils spiked with selenate and varied from a minimum of 12 orders of magnitude high in the
plants grown on cow and pig manure amended soils to over 40 in the compost treated soil
plants.
The plants grown on cow and pig manure amended soils had a lower Se concentration
compared to the plants grown on soils without amendments. However, the plants grown on
compost amended soil had a much higher Se concentration compared to the plants grown on
cow and pig manure amended soils. Though the Se concentrations in the plants grown on
compost amended soils spiked with selenate did not differ significantly from the Se
concentration in the plants grown on lime amended soils at the starting period, they were
higher than the Se concentration in the plants grown on non-amended soils spiked with
selenate. Over time, the Se concentration in plants at the starting period was higher than those
grown on soils of age 1 and 2 months. An exception was in the plants grown on pig manure-
and the non-amended soils which had the highest Se concentration when they were grown on
soils of 1 and 2 months, respectively. A similar trend was observed for the plants grown on
compost, lime and cow manure amended soils spiked with selenite which had the highest Se
concentration at the starting period. Overall, the plants grown on non-amended soils spiked
with selenite had the highest Se concentration compared to the plants grown on soils with
amendments with the lowest Se concentration in plants grown on cow and pig manure
amended soils.
The Se concentration in the plants grown on soils that were not spiked was highest in the
compost and pig manure amended soils.

31
(a) (b) (c)
(d) (e)
Figure 4.3. Wheat Se concentration grown on: (a) Compost amended soil, (b) pig manure amended soil, (c) Cow manure amended soil,
(d) Lime amended soil, (e) reference treatment soil. The plants grown on soils spiked with selenate are plotted on a separate axis to those
that were grown on non-spiked soils and soils spiked with selenite.
0
5
10
15
20
25
0
50
100
150
200
250
300
350
400
450
500
0 1 2
Bla
nk
and
so
diu
m s
elen
ite
Se/
mg
kg-1
Bar
ium
se
len
ate
an
d s
od
ium
sel
enate
Se/
mg
kg-1
Time/ months
Reference treatment soil
Selenate
Barium Selenate
Blank
Selenite
0
2
4
6
8
10
12
14
16
18
20
0
100
200
300
400
500
600
0 1 2
Bla
nk
an
d s
od
ium
sel
enit
eS
e/
mg
kg
-1
So
diu
m s
elen
ate
Se/
mg
kg
-1
Time/ months
Lime amended soil
Sodium selenate
Blank
Sodium selenite
0
0.2
0.4
0.6
0.8
1
1.2
1.4
1.6
1.8
0
2
4
6
8
10
12
14
16
18
20
0 1 2
Bla
nk
an
d s
od
ium
sele
nit
e S
e/
mg
kg
-1
So
diu
m s
ele
na
te S
e/
mg
kg
-1
Time/ months
Cow manure amended soil
Sodium selenate
Blank
Sodium selenite
0
0.5
1
1.5
2
2.5
3
30
31
32
33
34
35
36
37
38
0 1 2
Bla
nk
an
d s
od
ium
sele
nit
e S
e/
mg
kg
-1
So
diu
m s
ele
na
te S
e/
mg
kg-1
Time/ months
Pig manure amended soil
Sodium selenate
Blank
Sodium selenite
0
2
4
6
8
10
12
14
16
0
100
200
300
400
500
600
700
0 1 2
Bla
nk
an
d s
od
ium
sele
nit
eS
e/
mg
kg
-1
So
diu
m s
ele
na
te S
e/
mg
kg
-1
Time/ months
Compost amended soil
Sodium selenate
Blank
Sodium selenite

32
4.4 Sulphur
4.4.1 Wheat
Table 4.5. S concentration in wheat (mg kg-1
).
Treatment Spike T-0 T-1 T-2
Reference Blank 3656 3347 3471
Sodium selenite 3758 3970 3862
Sodium selenate 6707 5839 8476
Barium Selenate 8189 5312 7997
Compost Blank 3564 3301 3576
Sodium selenite 3644 3662 3950
Sodium selenate 11761 6784 8690
Pig manure Blank 3525 3036 3452
Sodium selenite 3719 3732 3451
Sodium selenate 4682 6096 4884
Cow manure Blank 3102 3249 3127
Sodium selenite 3131 3180 3032
Sodium selenate 4070 4060 3205
Lime Blank 3623 3302 3421
Sodium selenite 4178 3919 4243
Sodium selenate 10193 10106 9598
The plants grown on soils spiked with selenate had a higher S concentration than plants
grown on soils spiked with selenite. However, the S concentration in plants grown on soils
spiked with selenite did not differ significantly from those grown on soils that were not
spiked. On the other hand, the S concentration in the plants grown on soils amended with cow
and pig manure spiked with selenate was low, while it was highest in the plants grown on
soils amended with lime. A scatter plot of the plant Se against plant S concentration showing
the influence of soil age is shown in Figure 4.4.

33
Figure 4.4. S concentration and Se concentration in wheat (T-0: after 2 weeks of
stabilisation, T-1 and T-2: after 1 and 2 months, respectively).
The cloud of points around the S concentration of 4 µg kg-1
are plants that were grown on the
blank and selenite amended soils including those that were grown on the cow manure
amended soil spiked with selenate. The scattered points represent the plants grown on the
remaining selenate amended soils with the highest values seen always in the plants grown on
lime amended soils. The high plant S concentrations corresponded with high plant Se
concentrations in all the periods of soil ageing.
4.4.2 Soil
The soil S concentration determined from the aqua regia extract is shown in Table 4.6.
Table 4.6. S concentration from aqua regia extracts (mg kg-1
).
Treatment Spike T-0 T-1 T-2
Reference Blank 268 298 219
Sodium selenite 286 276 215
Sodium selenate 270 281 228
Barium selenate 255 290 227
Compost Blank 405 402 343
Sodium selenite 496 354 301
Sodium selenate 366 372 378
Pig manure Blank 567 779 620
Sodium selenite 542 588 762
Sodium selenate 611 569 506
Cow manure Blank 618 444 427
Sodium selenite 608 451 441
Sodium selenate 527 740 548
Lime Blank 256 230 237
Sodium selenite 277 215 234
Sodium selenate 280 210 228
0
100
200
300
400
500
600
700
0 2 4 6 8 10 12 14
Se/
mg
kg
-1
S/ µg kg-1
T-0
T-1
T-2

34
The non-amended and the lime amended soils had the lowest soil S concentration over the
entire period. However, the S concentration in the cow and pig manure amended soils was
higher than for the soil amended with compost.
The relation between the soil S concentration and the Se content of plants is shown in the
Figure 4.5.
Figure 4.5. Soil sulphur and plant selenium concentration (T-0: after 2 weeks of
stabilisation, T-1 and T-2: after 1 and 2 months, respectively).
The points along the horizontal axis represent plants grown on blank and selenite spiked soils
including those grown on the cow and pig manure selenate treatment grown plants. The other
points represent plants grown on selenate amended soils. A low soil S with the corresponding
highest value for the plant Se concentration was observed for the reference selenate and lime
selenate treatments.
4.5 Dry weight
The plant dry weight was on average highest for the plants grown on soil of age 1 month and
lowest for those grown on the soils at the starting period.
0
100
200
300
400
500
600
700
0 200 400 600 800 1000
Pla
nt
Se/
mg
kg
-1
Soil S/ mg kg-1
T-0
T-1
T-2
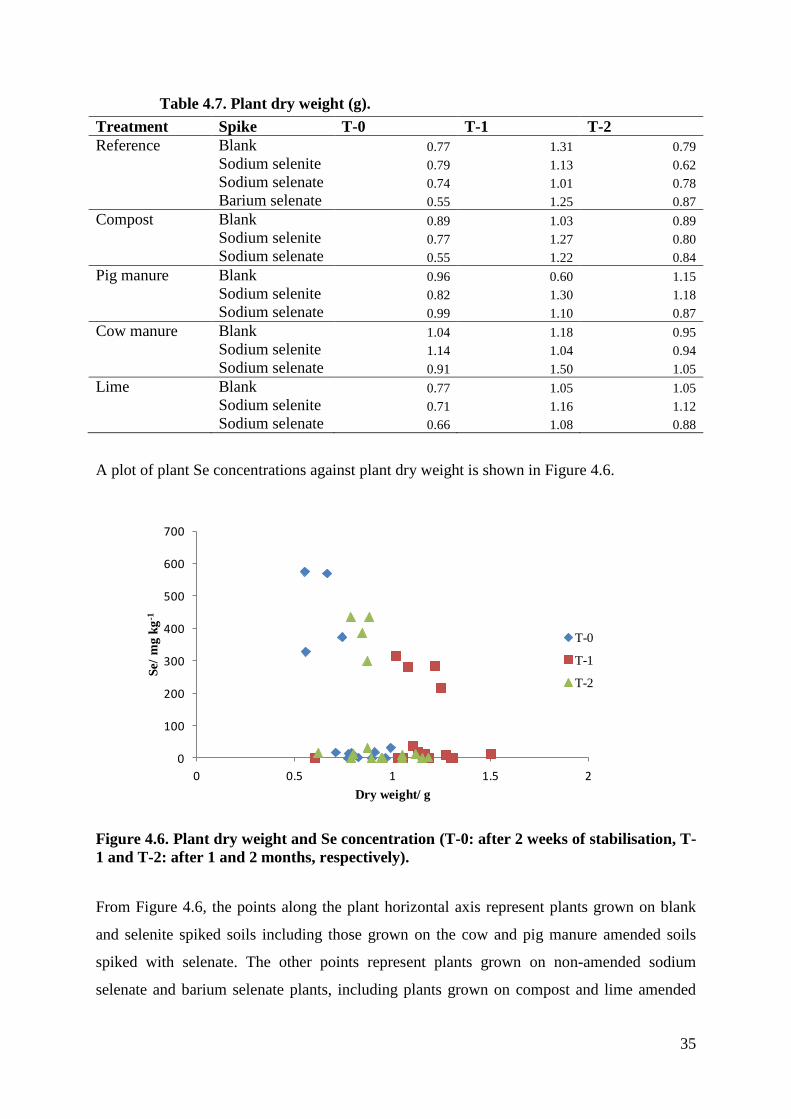
35
Table 4.7. Plant dry weight (g).
Treatment Spike T-0 T-1 T-2
Reference Blank 0.77 1.31 0.79
Sodium selenite 0.79 1.13 0.62
Sodium selenate 0.74 1.01 0.78
Barium selenate 0.55 1.25 0.87
Compost Blank 0.89 1.03 0.89
Sodium selenite 0.77 1.27 0.80
Sodium selenate 0.55 1.22 0.84
Pig manure Blank 0.96 0.60 1.15
Sodium selenite 0.82 1.30 1.18
Sodium selenate 0.99 1.10 0.87
Cow manure Blank 1.04 1.18 0.95
Sodium selenite 1.14 1.04 0.94
Sodium selenate 0.91 1.50 1.05
Lime Blank 0.77 1.05 1.05
Sodium selenite 0.71 1.16 1.12
Sodium selenate 0.66 1.08 0.88
A plot of plant Se concentrations against plant dry weight is shown in Figure 4.6.
Figure 4.6. Plant dry weight and Se concentration (T-0: after 2 weeks of stabilisation, T-
1 and T-2: after 1 and 2 months, respectively).
From Figure 4.6, the points along the plant horizontal axis represent plants grown on blank
and selenite spiked soils including those grown on the cow and pig manure amended soils
spiked with selenate. The other points represent plants grown on non-amended sodium
selenate and barium selenate plants, including plants grown on compost and lime amended
0
100
200
300
400
500
600
700
0 0.5 1 1.5 2
Se/
mg
kg
-1
Dry weight/ g
T-0
T-1
T-2

36
soils spiked with selenate. However, the Se concentration in the plant was higher at the
starting period with the lowest amount of dry weight and lowest in the plants grown on soil of
age one month though with the highest amount of dry matter.
A plot of the soil Se concentration from aqua regia, EDTA, and CaCl2 extracts with the total
Se content of wheat is shown in Figure 4.7.
Figure 4.7. Correlation of soil-extractable Se and total Se content of wheat.
The correlation coefficient was higher for the ammonium acetate-EDTA extract and the
CaCl2 extract and lowest for the aqua regia extract.
y = 0.1871x
R² = 0.5178
y = 0.1009x
R² = 0.5409
y = 0.0726x
R² = 0.1921
0
50
100
150
200
250
300
350
400
450
0 1000 2000 3000 4000 5000
Wh
ea
t S
e/
µg
Soil Se/ µg kg-1
Aquq regia
EDTA
CaCl2

37
5. Discussion
5.1 Soil Characterisation
5.1.1 pH
From Table 4.1, it can be observed that there is an impact of amendments and soil age on pH.
This will therefore have an effect on Se bioavailability and subsequent uptake by plants
(Fordyce, 2005). According to the USDA descriptive ranges for pH in soils (appendix 1),
almost all soils at the starting period had a neutral pH though with different values within the
range. On average, these became slightly alkaline after the first month except for the pig
manure amended soil which remained neutral. After two months, the pig manure and the non-
amended (reference) soils remained neutral. The compost and the lime amended soils
remained slightly alkaline while for the cow manure amended soil, the blank and selenate
spiked soils became moderately alkaline and the selenite spiked soil became strongly
alkaline. The increased pH due to liming was responsible for the high pH in the lime
amended soils compared to the non amended soils. Among the organic amended soils, the
cow manure amended soil had a high pH. This variability in pH can be attributed to changing
microbial activities in the soil after sampling and during stabilisation. The pig manure
resulted in soil acidification compared to the non amended soil while the cow manure made
the soil to become alkaline.
5.1.2 Electrical Conductivity (EC)
The chemical property which indicates the amount of soluble salts, EC, was highest for pig
and cow manure amended soils. This is mainly due to the additives such as salt, Cu and Zn
ions incorporated into livestock and poultry feeds to shorten the duration of breeding which
finally end up in the manure (Cang et al., 2004; Nicholson et al., 1999). This finding is
further backed by Hoa et al. (2008) who in a leaching experiment done on soils with and
without pig manure amendments, reported high leaching rates for pig manure amended sandy
loam soils indicated by a high value for the electrical conductivity due to the Cu and Zn ions
it contained. The decomposition of organic matter in the organic amended soils may also
introduce large amounts of low-molecular weight organic acids to soils (Baziramakenga and
Simard, 1998) which may also increase the EC.

38
5.1.3 Organic matter and CEC
Soil organic matter increases CEC. In the surface horizon of mineral soils, soil organic matter
is responsible for 25-90% of the total CEC (Van Dijk, 1971). The organic content of the
compost, cow and pig manure amended soils was therefore responsible for the high CEC (on
average higher than 12.3 cmol+ k g-1
) in these treatments compared to the reference and lime
amended soils. The highest value in for the CEC (12.88 meq 100 g-1
) was observed in the
compost selenate treatment. Though there are great differences in the biochemical
composition of the organic treatments, Oorts et al. (2003) reported that organic matter inputs
have a negligible effect on the CEC of soil organic matter in ferric lixisols.
5.2 Soil extracts
There is a great variability in the CaCl2- and EDTA-extractable Se concentration. Zhao et al.
(2005) reported that there is a great impact of soil physical and chemical factors on the Se
extracted from soils, which included CaCO3, pH, silt content, exchangeable quantity, clay
content, available iron and organic matter. Though these extractions are meant to indicate the
likely bioavailability in seleniferous soils, Davies (1980) reported that the bioavailable Se in
its different forms is difficult to separate and identify due to the extremely complex
physicohemical properties of soils.
Considering the fact that Se in an aqua-soluble form could indicate the bioavailable Se, CaCl2
being a weak aqueous extract can thus be considered to represent the likely bioavailability.
But, this is contradicted by Zhao et al., (2005) for the case of Se deficient soils due to the
weak buffer capability of the aqueous solution, easy change of pH and weak extraction
capability of water. Aqua regia on the other hand being a stronger extract indicated the
highest levels of Se while the CaCl2 extracts had the lowest Se concentration. This indicates
that CaCl2 is a weak extract. This is supported by Zhao et al (2005) who reported that the
content of extractable Se with water from high Se level soils was not so high. In their study,
the total Se content of the soil was 23.53 mg kg-1
, but the water extractable Se was 5.64 mg
kg-1
in the Se-toxic soils of Ziyang County, which occupied only 0.24% of the total soil Se.

39
5.3 Porewater samples
The pore water extractable Se was found to decrease with time. This shows that the pore
water soluble Se, indicating the likely bioavailability, would decrease with time from its
growth medium given that it will be taken up by plants. The high selenate concentration
compared to the selenite concentration is due to the fact that selenate is weakly adsorbed on
the soil while selenite on the other hand reacts strongly with the soil (Yläranta 1983a).
Selenate therefore will be leached more easily compared to selenite. The lowest values for the
cow manure at the starting period (selenite 121 µg L-1
and selenate 1230 µg L-1
) are in
conformity with the findings of Dhillon et al., (2010) who reported that incubating naturally
occurring selenium forms with organic amendments led to a substantial decrease (20%-26%)
of easily available (water-soluble and extractable) forms of Se and a corresponding increase
of (13%-62%) in the less available (organic matter and metal oxide bound) Se forms. The
same low values in the subsequent periods are in conformity with the binding of Se by cow
manure. The high value for the compost amended soil spiked with selenate of 2684 µg L-1
,
2600 µg L-1
and of 2793 µg L-1
in the starting, second and final periods of soil ageing,
respectively, indicate that the selenate spiked to compost was weakly bound. A much higher
selenate concentration was observed for the reference selenate treatment (4043 µg L-1
) and
the lime amended soil spiked with selenate (3769 µg L-1
) at the starting period indicate that
the selenate in these soils was also weakly bound.
The Se concentrations in the blank treatments indicated the background concentrations which
were lowest for the reference, compost and lime blank soils with values of 6.2 µg L-1
, 6.2 µg
L-1
and 7.4 µg L-1
, respectively, at the starting period. It was highest for the pig manure blank
treatment (21.2 µg L-1
) followed by the cow manure blank treatment (17.3 µg L-1
) in the
starting period. This is an indication that the cow and pig manure contained Se. Aside the
effect of the organic treatments, variation in pore water metal concentrations may also be
related to the moisture regime of the soil (Du Laing et al., 2007).
5.4 Influence of soil amendments on Se uptake by wheat plants
The highest Se concentration was observed in the plants grown on selenate spiked soils due
to the high bioavailability of selenate compared to selenite and hence easily taken up by
plants. The highest plant Se concentration at the starting period was seen in the plants grown
on the reference, lime and compost amended soils, spiked with selenate. The high value for

40
the compost amended soil confirms the fact that compost weakly binds selenate, resulting in a
high pore water Se concentration. This value, of same order of magnitude as the value in the
lime amended selenate spiked soil, was higher than that of the reference (non- amended) soils
spiked with selenate. A similar trend was also observed for the reference and lime amended
selenite spiked soils at the starting period. Liming therefore can be concluded to increase Se
bioavailability. This is in conformity with the study by Ylaränta (1983b, 1990) who reported
that lime applied to soils to ameliorate soil acidity can be assumed to reduce Se sorption by
soil and therefore increase its uptake by plants.
The Se concentration in the plants grown on non-amended soils spiked with selenate was
higher compared to those grown on soils that were spiked by barium selenate. This is due to
the low solubility of barium selenate compared to sodium selenate. Among the plants grown
on soils spiked with selenite, those grown on pig and cow manure amended soils had the
lowest Se concentration. The cow manure selenite spiked soil had the lowest plant Se
concentration at the starting period. This coincided with the corresponding porewater
concentration which indicates that cow manure results in the removal of Se from the soil
solution. This is due to the interaction of Se with organic compounds making them less
mobile as indicated by the increase in insoluble Se fractions (Pezzarossa et al., 2007) such as
fixation by organometallic complexes. This therefore reduces the amount which is available
for plant uptake and thus the amount accumulated in the plant especially in the seeds
(Johnson, 1991). A similar phenomenon of metal binding by organic matter (Dhillon et al.,
2010) may have resulted in the low plant Se concentration in the pig manure treatment. The
higher Se concentration in the plants grown on the compost and pig manure blank treatments
at the starting period compared to the non-amended soil is due to the back ground
concentrations generated by the amendments. Though the pig manure originally had a higher
background concentration, the higher value for the compost may be due to the release of low
molecular-weight Se compounds during the decomposition of the compost which could serve
as a source of Se for plant uptake (Zawislanski and Zavarin 1996).
The variability within the time periods can be attributed to the effects of organic carbon
amendments on Se (im) mobilisation in soils and also due to the wetting and drying of soil
which promoted rapid transformation of Se042-
into other forms, such as Se032-
and organic
Se that are adsorbed to soil surfaces (Neal and Sposito 1991).

41
Long-term field studies are therefore needed to monitor Se transformation in soils amended
with seleniferous crop residues and organic wastes (Ajawa et al., 2005).
5.5 Soil and plant Sulphur relation to Se uptake by wheat plants
In wheat, the main form of Se uptake is selenate through the sulphate pathway (Li et al.
2008). This relation can be seen on Figure 4.4, where high plant S concentrations in the
plants grown on soils spiked with selenate correspond with a high plant Se concentration.
This therefore confirms the synergistic relationship between Se and S (Mikkelsen et al.,
1988a, b) who observed that elevated concentrations of Se in the root zone might increase the
plant S accumulation when sulphate concentrations are low in the root zone. An exception
among the plants grown on soils spiked with selenate is seen for those grown on the cow and
pig manure amended soils. From Table 4.6, these are seen to have the highest values for S
along with compost treatment. But, on the contrary, the plant Se concentrations were the
lowest with exception in the plants grown on compost amended soil. It can thus be concluded
that the compost contained S which was in a form readily bioavailable for plant uptake,
whereas the cow and pig manure did not. The lime and reference treatments having the
lowest value for soil S concentration had higher S concentrations in the plants grown on
them. The S in these treatments can thus be concluded to be readily bioavailable. This is seen
by their high plant Se concentrations which can be attributed to the sulphate uptake route of
selenate (Terry et al., 2000).
From Table 4.5, it can be seen that S concentration of plants grown in the selenite spiked
soils and blank treatments were almost of same order of magnitude. Se concentration of
similar order of magnitude for the same treatments can be seen in Figure 4.4 which
corresponds to these low S concentrations. This suggests that the Se uptake mechanism in
these soils is different than for the selenate spiked soils. This confirms the fact that selenite in
soils has a low bioavailability and uptake by plants is via passive diffusion (Arvy, 1993).
5.6 Plant growth and Se uptake
Plants vary considerably in their physiological response to excess Se in the growth medium
(Terry et al., 2000). From Figure 4.6, it is evident that Se bioavailability was high at the
42
starting period in the selenate spiked soils, especially for the reference, compost and lime
amended soils spiked with selenate. This became lower after 1 month of ageing and increased
after 2 months of ageing depicted by the concentrations in wheat. This may probably be
linked with the alternate wetting and drying of the soil which promoted rapid transformation
of selenate into other forms, such as selenite and organic Se that were adsorbed onto soil
surfaces (Neal and Sposito 1991). These probably became oxidised again increasing the
bioavailability. The high uptake is seen to have an adverse effect on dry matter production.
Plants grown on selenate spiked soils at the starting period had the highest Se concentration
and the lowest amount of biomass, while those grown on soils after 1 month had the lowest
plant Se concentration and a high amount of biomass. This confirms the fact that in wheat dry
matter production is affected by high plant Se concentrations (Rani et al., 2005). In the plants
grown on the blank and selenite spiked soils, the effect on dry matter production was not
observed although a variability of Se uptake with soil age was observed
5.7 Environmental Relevance
Figure 4.7 shows that the EDTA- and CaCl2-extractable Se reflects the plant Se concentration
better than the aqua regia extract. Thus, from the total amount of Se applied to the soil, plants
can only take up part during their period of growth. This uptake was high for the plants
grown on non-amended, compost and lime amended soils spiked with selenate with an uptake
rate of over 40% of the applied Se. However, the plants grown on lime amended soil spiked
with selenate had the highest rate of uptake (48%) of the applied Se. In such soils, the risk of
Se accumulation will be lower. On the other hand, the plants grown on pig and cow manure
amended soils spiked with selenate had the lowest rate of Se uptake of 4 and 2%,
respectively. In the plants grown on soils spiked with selenite, the uptake was over 2% in the
non-amended, lime and compost amended soils and 1% in the cow manure amended soil. In
the pig manure amended soil and the non-spiked soils (blanks), the uptake was less than 1%.
In such soils with low uptake of the Se applied to soil, the Se will therefore accumulate in the
soil. Under saturated conditions, the Se concentration in pore water from theses soils where
Se has accumulated will be high due to leaching. This may move through the pores in the soil
and finally end up in groundwater. Overtime, the concentration in ground water may increase
and will be of great threat to communities which depend on ground water for their domestic
water supply.

43
6. Conclusion and recommendation
The results of this study show that selenate is the major form through which plants take up Se
from the soil. This varied among the plants grown on non-amended (reference), organic and
inorganic amended soils. Amongst the organic amended soils, the plants grown on compost
amended soil had the highest Se concentration, while the plants grown on cow manure
amended soil had the lowest concentration with selenium applied in the form of selenate. In
the non-amended soils (reference treatment), the high plant Se concentration in the sodium
selenate treatment compared to the barium selenate treatment shows that the former has a
higher bioavailability in soils and therefore higher uptake by plants. In wheat, liming results
in a higher uptake of Se applied to the soil in form of selenate. On the other hand, the plants
grown on soils spiked with selenite had a much lower Se concentration compared to those
grown on soils spiked with selenate. A high Se concentration was seen in plants grown on
non-amended (reference), compost and lime amended soils, while it was lowest in the plants
grown on cow and pig manure amended soils.
There is a risk of environmental contamination especially of ground water when Se is applied
to the soil in the form of selenite and on soils which are amended with cow and pig manure
irrespective of the form in which Se is applied to the soil. However, Se supply from organic
amendments also supplement the amount available for plant uptake especially when compost
and cow manure are used as soil amendment. Considering the fact that only the seeds from
wheat are used in production of food products, the concentration in the leaves cannot be used
to determine the risk to humans upon consumption, as the concentration which ends up in the
seeds is not known. However, it may be used to assess the amount available for plant uptake.
In order to fully monitor the Se transformation in soils amended with seleniferous crop
residues and organic wastes, long-term field studies are needed. Thus, considering the fact
that this was an exploratory study, in subsequent experiments, a longer time period (greater
than 3 months) should be used along with replicates to better understand the effects of
organic and inorganic amendments on Se mobility and bioavailability in soils.
The low Se uptake by the plants grown on cow and pig manure amended soils irrespective of
the form in which Se is applied to the soil warrants further research of their effects on Se
availability and mobility. Since these were characterised by high values of EC, there could

44
possibly be some dissolved constituents from these treatments which were responsible for the
low Se uptake by plants.
45
References
Adams, M.L., Lombi, E., Zhao, F.J., McGrath, S.P., 2002. Evidence of low selenium
concentrations in UK bread-making wheat grain. J Sci Food Agric. 82, 1160–1165.
Adriano, D.C., 1986. Trace elements in the terrestrial environment. Springer-Verlag, New
York.
Ajwa, H.A., Bafiuelos, G.S., Mayland, H. F., 1998. Selenium Uptake by Plants from Soils
Amended with Inorganic and Organic Materials. J. Environ. Qual., Vol 27
Anderson, J.W., Scarf, A.R., 1983. Selenium and plant metabolism. In Metals and
Micronutrient: Uptake and utilization by plants. Eds. D A Robb and W S Pierpoint pp. 241 -
275. Academic Press, New York.
Arthur, M.A., Rubin, G., Schneider, R.E., 1992. Uptake and accumulation of selenium by
terrestrial plants growing on a coal fly ash landfill. Part 2. Forge and root crops. Environ.
Toxic. Chem. 11, 1289-1299.
Arvy, M.P., 1993. Selenate and selenite uptake and translocation in bean plants (Phaseolus
vulgaris). Journal of Experimental Botany. 44, 1083–1087.
Banuelos, G.S., 2000. Factors influencing field phytoremediation of selenium-laden soils. In:
Terry, N., Banuelos, G.S. (Eds.), Phytoremediation of Contaminated Soil and Water. CRC
Press LLC, Boca Raton FL, pp. 41–59.
Banuelos, G.S., 2001. The green technology of selenium phytoremediation. BioFactors. 14,
255–260.
Bawa, S.S., Dhillon, K.S., Dhillon, S.K., 1992. Screening of different fodders for selenium
absorption capacity. Indian J. Dairy Sci. 45, 457– 460.

46
Barrow, N.J., Whelan, B.R., 1989. Testing a mechanistic model.VIII. The effects of time and
temperature of incubation on the sorption and subsequent desorption of selenite and selenate
by a soil. J Soil Sci 40:29–37.
Baziramakenga, R., Simard, R.R., 1998. Low molecular weight aliphatic acid contents of
composted manures. J. Environ. Qual. 27, 557–561.
Bisbjerg, B., Gissel-Nielsen, G., 1969. The uptake of applied selenium by agricultural plants.
I. The influence of soil type and plant species. Plant Soil. 31, 287-298.
Broadley, M.R., White, P.J., Bryson, R.J., Meacham, M.C., Bowen, H.C., Johnson, S.E.,
Hawkesford, M.J., McGrath, S.P., Zhao, F.J., Breward, N., Harriman, M., Tucker, M., 2006.
Biofortification of UK food crops with selenium. Proc Nutr Soc. 65, 169–181
Brown, T.A., Shrift, A., 1982. Selenium toxicity and tolerance in higher plants. Biol. Rev. 57,
59–84.
Cang, L., Wang, Y.J., Zhou, D.M., Dong, Y.H., 2004. Study of heavy metals pollution in
poultry and livestock feeds and manures under intensive farming in Jiangsu province. Journal
of Environmental Science. 16, 371–374.
Cartes, P., Shene, C., de la Luz Mora, M., 2006. Selenium distribution in ryegrass and its
antioxidant role as affected by sulfur fertilization. Plant Soil. 285, 187–195.
Combs, G.F., 2001. Selenium in global food systems. British Journal of Nutrition. 85, 517–
547.
Davies, B.E., 1980. Applied Soil Trace Element. John Wiley and Sons. Chichester. Academic
Press, New York 80–97 pp.
Dhillon, K.S., Dhillon, S.K., Dogra, R., 2010. Selenium accumulation by forage and grain
crops and volatilization from seleniferous soils amended with different organic materials.
Chemosphere.78, 548–556.

47
Dhillon, S.K., Dhillon, K.S., 2004. Pools of selenium in some Indian soils at field capacity
and submerged moisture regimes. Aust. J. Soil Res. 42, 247–257.
Dhillon, K.S., Dhillon, S.K., 2000. Selenium accumulation by sequentially grown wheat and
rice as influenced by gypsum application in a seleniferous soil. Plant Soil. 227, 243–248.
Dhillon, K.S., Dhillon, S.K., 1997. Distribution of seleniferous soils in north-west India and
associated toxicity problems in the soil–plant–animal–human continuum. Land Contam.
Reclam. 5, 313–322.
Dhillon, K.S., Bawa, S.S., Dhillon, S.K., 1992. Selenium toxicity in some plants and soils of
Punjab. J. Indian Soc. Soil Sci. 40, 132–136.
Dhillon, K.S., Dhillon, S.K., 1991. Selenium toxicity in soils, plants and animals in some
parts of Punjab, India. Int. J. Environ. Studies 37, 15–24.
Du Laing, G., Vanthuyne, D., Vandecasteele, B., Tack. F., Verloo, M., 2007. Influence of
hydrological regime on pore water metal concentrations in a contaminated sediment-derived
soil. Environ Pollut. 147, 615–25.
Elrashidi, M.A., Adriano, D.C., Workman, S.M., Lindsay, W.L., 1987. Chemical-equilibria
of selenium in soils - a theoretical development. Soil Sci. 144,141–152.
Eurola, M.H., Ekholm, P.I., Ylinen, M.E., Koivistoinen, P.E., Varo, P.T., 1991. Selenium in
Finnish foods after beginning the use of selenate supplemented fertilizers. Journal of the
Science of Food and Agriculture. 56, 57–70.
FAO, WHO, 2001. Human vitamin and mineral requirements. Report of a Joint FAO/WHO
Expert Consultation, Bangkok, Thailand, Food and Nutrition Division, FAO, Rome.
Ferri, T., Sangiorgio, P., 1999. Voltammetric study of the interaction between Se(IV) and
dissolved organic matter in environmental aqueous matrices. Anal. Chim. Acta 385, 337–343.
48
Fleming, G. A., 1980. Essential Micronutrients II: Iodine and Selenium. In Applied Soil
Trace Elements ( B. E. Davis, Ed.), John Wiley & Sons, New York, pp. 199-234.
Fordyce, F., 2007. Selenium geochemistry and health. Ambio. Vol.36, No.1, pp.94-97
Fordyce, F.M., Zhang, G., Green, K., Liu, X., 2000b. Soil, Grain and Water Chemistry and
Human Selenium Imbalances in Enshi District, Hubei Province, China, Appl. Geochem.,
15(I), 117-132.
Fordyce, F., 2005. Selenium deficiency and toxicity in the environment. In: Selinus, O.,
Alloway, B.J., (eds). Essentials of medical geology: Impacts of the natural environment on
public health. Academic Press, London, U.K. pp. 373-415.
Fox, T.E., Atherton, C., Dainty, J.R., Lewis, D.J., Langford, N.J., Baxter, M.J., Crews, H.M.,
Fairweather-Tait, S.J., 2005. Absorption of selenium from wheat, garlic, and cod intrinsically
labeled with Se-77 and Se-82 stable isotopes. International Journal for Vitamin and Nutrition
Research. 75, 179–186.
Geering, H. R., Cary, E. E., Jones, L.H.P., Allaway, W.H., 1968. Solubility and redox criteria
for the possible forms of selenium in soils. Soil Sci. Soc. Am. J. 32, 35–40.
Gissel-Nielsen, G., Gupta, U.C., Lamand, M., Westermarck, T., 1984. Selenium in soils and
plants and its importance in livestock and human nutrition. Adv. Agron. 37, 397–460.
Gissel-Nielsen, G., 1973. Uptake and distribution of added selenite and selenate by barley
and red clover as influenced by sulphur. J. Sci. Fd. Agric. 24, 649–655.
Gupta, U.C., 1995. Effects of selcote® ultra and sodium selenate (laboratory versus
commercial grade) on selenium concentrations in feed crops. J Plant Nutr. 18, 1629–1636.
Hao, X., ZHOU, D., SUN, L., LI, L., ZHANG, H., 2008. Dynamic chemical characteristics
of soil solution after pig manure application: A column study. Journal of Environmental
Science and Health Part B. 43, 429–436.
Hartikainen, H., 2005. Biogeochemistry of selenium and its impact on food chain quality and
human health. J. Trace Elem Med Biol. 18, 309 -318.

49
Hawkesford, M.J., Zhao, F.J., 2007. Strategies for increasing the selenium content of wheat.
J. Cereal Sci. 46, 282–292.
Hurd-Karrer, A.M., 1938. Relation of sulphate to selenium absorption by plants. Am. J. Bot.
25, 666–675.
Jackson, B.P., Miller, W.P., 1999. Soluble arsenic and selenium species in fly ash organic
waste-amended soils using ion chromatography inductively coupled plasma mass
spectrometry. Environ Sci Technol. 33, 270–275.
Jacobs, L. W. (Ed.) (1989). Selenium in Agriculture and the Environment, Soil Science
Society of America Special Publication 23, SSSA, Madison, WI.
Johnsson, L., 1991. Selenium uptake by plants as a function of soil type, organic matter
content and pH. Plant Soil. 133, 57–64.
Keskinen, R., Ekholm, P., Yli-Halla, M., Hartikainen, H., 2009. Efficiency of different
methods in extracting selenium from agricultural soils of Finland. Geoderma. 153, 87–93.
Konze, J. R., Schilling, N., Kende, H., 1978. Enhancement of ethylene formation by
selenoamino acids. Plant Physiol. 62, 397–401.
Läuchli, A., 1993. Selenium in plants: Uptake, functions and environment toxicity. Bot. Acta.
106, 455–468.
Levesque, M., 1974. Some aspects of selenium relationships in eastern Canadian soils and
plants. Can. J. Soil Sci. 54, 205-214.
Li, H.F., McGrath, S.P., Zhao, F.J., 2008. Selenium uptake, translocation and speciation in
wheat supplied with selenate or selenite. New Phytologist. 178, 92–102.
50
Lin, Z.Q., Schemenauer, R.S., Cervinka, V., Zayed, A., Lee, A., Terry, N., 2000. Selenium
volatilization from a soil-plant system for the remediation of contaminated water and soil in
the San Joaquin Valley. J Environ Qual. 29,1048–1056.
Loibner, A.P., Jensen, J., Ter Laak, T., Celis, R., Hartnik, T., 2006. Sorption and ageing of
soil contamination. In: Jensen, J., Mesman, M. (Eds.), Ecological risk assessment of
contaminated land. RIVM, Bilthoven. pp. 19-31.
Logan, T.J., Chang, A.C., Page, A.L., Ganje, T.J., 1987. Accumulation of selenium in crops
grown on sludge-treated soil. J. Environ. Qual. 16, 349-352.
Losi, M.E., Frankenberger Jr., W.T., 1997. Reduction of selenium oxyanions by Enterobacter
cloacae strain SLD1a-1: isolation and growth of the bacterium and its expulsion of selenium
particles. Applied and Environmental Microbiology. 63, 3079-3084.
Lyons, G.H., Stangoulis, J.C.R., Graham, R.D., 2005. Tolerance of wheat (Triticum aestivum
L.) to high soil and solution selenium levels. Plant Soil. 270, 179–188.
Lyons, G., Stangoulis, J., Graham, R., 2003. High-selenium wheat: biofortification for better
health. Nutrition Research Reviews. 16, 45–60.
Martens, D.A., Suarez, D.L., 1997a. Selenium in water management wetlands in the semi-
arid west. Hortic. Sci. (in press).
Martens, D.A., Suarez, D.L., 1997b. Mineralization of selenium containing amino acids in
two California soils. Soil Sci. Soc. Am. J. 61, 1685-1694.
Mayland, H.F., 1994. Selenium in Plant and Animal Nutrition. In Selenium in the
Environment (W. T. Frankenberger and S. Benson, Eds.), Marcel-Dekker, New York, pp. 29-
47.
Mayer, D. 1997. Dietary selenium repletion may reduce cancer incidence in people at high
risk who live in areas with low soil selenium. Nutr Rev. 55(7), 277-9.

51
Mayland, H.F., James, L.J., Panter, K.E., Sonderegger, J.L., 1989. Selenium in seleniferous
environments. p. 15-50. In L.W.G. Jacobs (ed.) Selenium in agriculture and the environment.
SSSA Spec. Publ. 23. SSSA, Madison, WI.
Mikkelsen, R. L., Page, A. L., Bingham, F.T., 1989. Factors affecting selenium accumulation
by agricultural crops. In Selenium in Agriculture and the Environment. Ed. L W Jacobs. pp.
65–94. SSSA Special Publication Number 23, Madison, WI, USA.
Mikkelsen, R. L., Page, A.L., Haghnia, G. H., 1988a. Effect of salinity and its composition on
the accumulation of selenium by alfalfa. Plant Soil. 107, 63–67.
Mikkelsen, R.L., Haghnia, G.H., Page, A. L., Bingham, F. T., 1988b. The influence of
selenium, salinity and boron on alfalfa tissue composition and yield. J. Environ. Qual. 17, 85–
88.
Minorsky, P.V., 2003. Selenium in plants. Plant Physiol. 133, 14–15.
Mora, M., Pinilla, L., Rosas, A., Cartes, P., 2008. Selenium uptake and its influence on the
antioxidativesystem of white clover as affected by lime and phosphorus fertilization. Plant
Soil. 303, 139–149
Moxon, A.L., 1937. Alkali Disease or Selenium Poisoning, Bulletin 311, South Dakotq
Agricultural Experimental Station, Vermillion.
Muth, O.H., Allaway, W.H., 1963. The Relationship of White Muscle Disease to the
Distribution of Naturally Occuring Selenium, F. Am. Vet. Med. Assoc., 142, 1380.
Neal, R.H., 1995. Selenium. In Heavy Metals in Soils (B.J. Alloway, Ed.), Blackie Academic
& Professional, London pp. 260-283.
Neal, R.H., Sposito, G., 1991. Selenium mobility in irrigated soil columns as affected by
organic carbon amendment. J. Environ. Qual. 20, 808-814.

52
Nicholson, F.A., Chambers, B.J., Williams, J.R., Unwin, R.J., 1999. Heavy metal contents of
livestock feeds and animal manures in England and Wales. Bioresource Technology. 70, 23–
31.
Nigam, S.N., McConnell, W.B., 1973. Biosynthesis of se-methylselenocystiene in Lima
beans. Photochemistry. 12, 359–362.
Nriagu, J.O., 1989. Occurrence and Distribution of Selenium, CRC Press, Boca Raton, FL.
Ohlendorf, H.M., 1989. Bioaccumulation and Effects of Selenium in Wildlife', in Selenium
in Agriculture and the Environment. Soil Science Society of America Special Publication No.
23, Madison, WI, pp. 133-177.
Oldfield, J.E., 1999. Selenium World Atlas, Selenium-Tellurium Development Association,
Grimbergen, Belgium.
Oldfield, J.E., Burau, G. Moller, G., Ohlendorf, H.M., Ullrey, D., 1994. Risks and benefits
of selenium in agriculture. Council Agric. Sci. Tech. Issue Paper Suppl. 3. Ames, IA.
Oorts, K., Vanlauwe, B,, Merckxa, R., 2003. Cation exchange capacities of soil organic
matter fractions in a ferric lixisol with different organic matter inputs. Agriculture Ecosystem
and Environment. 100, 161-171.
Pessi, Y., Syvalathi, J., Saari, E., & Ylanen, M., 1974. Mineral content of grain yield of
cereals and the effect of fertilization on it. J. Sci. Agric. Soc. Finland, 46, 264-70.
Rani, N., Dhillon, K.S., Dhillon, S.k., 2005. Critical levels of selenium in different crops
grown in an alkaline silty loam soil treated with selenite-Se. Plant and Soil. 277, 367–374.
Rayman, M.P., 2002. The argument for increasing selenium intake. Proceedings of the
Nutrition Society. 61, 203–215.
Rayman, M.P., 2000. The importance of selenium to human health. Lancet. 356, 233–241.

53
Rimmer, D.L., Shiel, R.S., Syers, J.K., Wilkinson, M., 1990. Effects of soil application of
selenium on pasture composition. J. Sci. Food Agr. 51, 407–410.
Robert, S., Dungan, W.T., Frankenberger, Jr., 2000. Factors affecting the volatilization of
dimethylselenide by Enterobacter cloacae SLD1a-1 Soil Biology & Biochemistry 32, 1353-
1358.
Rosenfeld, I., Beath, O.A., 1964. Selenium: geobotany, biochemistry, toxicity and nutrition.
Academic Press, NY, USA.
Rotruck, J.T., Pope, A.L., Ganther, H.E., Swanson, A.B., Hafeman, D.G., Hoekstra, W.G.,
1973. Selenium: Biochemical role as a component of glutathione peroxidase. Science. 179,
588–590.
Shamberger, R.J., Frost, D.V., 1969. Possible protective effect of selenium against human
cancer. Can. Med. Assoc. J. 100 (14), 682.
Sharma, S., Bansal1, A., Dogra, R., Dhillon, S.K., Dhillon, K.S., 2011. Effect of organic
amendments on uptake of selenium and biochemical grain composition of wheat and rape
grown on seleniferous soils in northwestern India. J. Plant Nutr. Soil Sci. 174, 269–275.
Sharma, S., Dhillon, K.S., Dhillon, S.K., Munshi, S.K., 2008. Changes in biochemical
components of wheat and rapeseed grown on selenium-contaminated soil. Arch. Agron. Soil
Sci. 54, 33–40.
Shrift, A., Ulrich, J.M., 1969. Transport of selenate and selenite into Astragalus roots. Plant
Physiology. 44, 893–896.
Shrift, A., 1954. Antimetabolite action of selenate and selenomethionine on the growth of
chlorella vulgaris. Am. J. Bot. 41, 223–320.
Singh, S.P., Tack, F.M.G., Verloo, M., 1998. Heavy metal fractionation and extractability in
dredged sediment derived surface soils. Water Air Soil Poll. 102, 313-28.

54
Smith, G.S., Watkinson, J.H., 1984. Selenium toxicity in perennial rye grass and white
clover. New Phytol. 97, 557–564.
Spadoni, M., Voltaggio, M., Carcea, M., Coni, E., Raggi, A., Cubadda, F.,2007.
Bioaccessible selenium in Italian agricultural soils: Comparison of the biogeochemical
approach with a regression model based on geochemical and pedoclimatic variables. Sci
Total Environ .376, 160–177.
Spencer, K., 1982. Effect of sulphur application on selenium content of subterranean clover
plants grown at different levels of selenium supply. Aust. J. Exp. Agric. Anim. Husb. 22,
420–427.
Stroud, J.L., Broadley M.R., Foot, I., Fairweather-Tait, S.J., Hart, D.J., Hurst., R., Knott, P.,
Mowat, H., Norman, K., Scott, P., Tucker, M., White, P.J., McGrath, S.P., Zhao, F.J., 2010.
Soil factors affecting selenium concentration in wheat grain and the fate and speciation of Se
fertilisers applied to soil. Plant Soil. 332, 19–30.
Tack, F.M., Vandecasteele, B., 2008. Cycling and ecosystem impact of metals in
contaminated calcareous dredged sediment-derived soils (Flanders, Belgium). Sci Tot
Environ. 400, 283-289.
Tan, J. (Ed.).,1989. The Atlas of Endemic Diseases and Their Environments in the People’s
Republic of China, Science Press, Beijing.
Terry, N., Zayed, A. M., de Souza, M. P., Tarun, A.S., 2000. Selenium in higher plants. Ann.
Rev. Plant Physiol. Plant Molec. Biol. 51, 401–432.
Thompson, J. E., Mayak, S., Shimitsky, M., Halevy, A.H., 1982. Acceleration of membrane
senescence in cut carnation flowers by treatment with ethylene. Plant Physiol. 69, 859–863.
Tokunaga, T.K., Pickering, I. J., Brown, J.E., 1996. Selenium transformations in ponded
sediments. Soil Sci. Soc. Am. J. 60, 781–789.
USDA soil quality-agronomy technical note N0. 8., 1999.U.S. Government Printing Office,
Washington, DC.

55
Van Dijk, H., 1971. Colloid chemical properties of humic matter. In: McLaren, A.D.,
Skujins, J. (Eds.), Soil Biochemistry, vol. 2. Marcel Dekker, New York, pp. 16–35.
Vandecasteele, B., De Vos, B., Tack, F.M.G., 2002b. Identification of dredged sediment-
derived soils in the alluvial plains of the Leie, the Upper and Sea Scheldt river (B) based on
physicochemical soil properties. J Environ Monitor. 4, 306-12.
Van Ranst, E., Verloo, M., Demeyer, A., Pauwels, J.M., 1999. Manual for the soil chemistry
and fertility laboratory. University of Gent. ISBN: 90-766603-01-4.
Wan, H.F., Mikkelsen, R.L., Page, A.L., 1988. Selenium uptake by some agricultural crops
from central California soils. J. Environ. Qual. 17, 269–272.
Whanger, P.D., 2004. Selenium and its relationship to cancer: an update. British Journal of
Nutrition. 91, 11–28.
White, P.J., Bowen, H. C., Parmaguru, P., Fritz, M., Spracklen,W. P., Spiby, R.E., Meacham,
M.C., Mead, A., Harriman, M., Trueman, L.J., Smith, B.M., Thomas, B., Broadley, M.R.,
2004. Interactions between selenium and sulphur nutrition in Arabidopsis thaliana. J. Exp.
Bot. 55, 1927–1937.
World Health Organisation, 1987. Environmental Health Criterion 58 – Selenium, World
Health Organization, Geneva.
Yang, G.Q., et al., 1981. Research on the etiology of an endemic disease characterized by
loss of nails and hair in Enshi County. J Chinese Acad. Med. 3, 1–6 (in Chinese).
Yläranta, T., 1990. Effects of liming and the addition of sulphate and phosphate on the
selenium content of Italian rye grass. Ann Agric Fenn. 29, 141–149.
Yläranta, T., 1983a. Sorption of selenite and selenate in the soil. Ann Agric Fenn 22, 29–39.

56
Yläranta, T., 1983b. Effect of liming and sulphate on the selenium content of Italian rye grass
(Lolium multiflorum). Ann Agric Fenn 22, 152–163.
Yu, X.Z., Gu, J.D., 2007. Metabolic responses of weeping willows to selenate and selenite.
Environ. Sci. Pollut. Res. Int. 14, 510–517.
Zawislanski, P.T., Zavarin, M., 1996. Nature and rates of selenium transformations: A
laboratory study of Kesterson Reservoir soils. Soil Sci. Soc. Am. J. 60, 791-800.
Zhang, L., Ackley, A.R., Pilon-Smits, E.A.H., 2007. Variation in selenium tolerance and
accumulation among 19 Arabidopsis thaliana accessions. J Plant Physiol. 164, 327–336.
Zhao, C., Ren, J., Xue, C., Lin, E., 2005. Study on the relationship between soil selenium and
plant selenium uptake. Plant and Soil. 277, 197–206
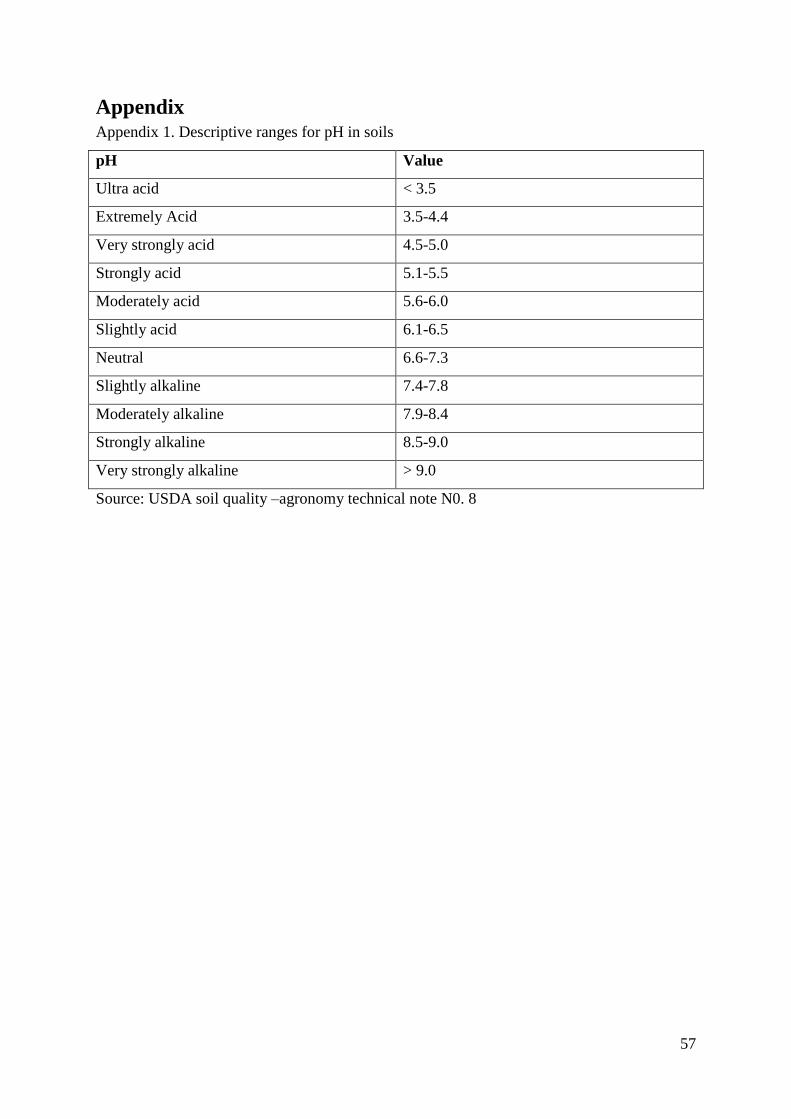
57
Appendix Appendix 1. Descriptive ranges for pH in soils
pH Value
Ultra acid < 3.5
Extremely Acid 3.5-4.4
Very strongly acid 4.5-5.0
Strongly acid 5.1-5.5
Moderately acid 5.6-6.0
Slightly acid 6.1-6.5
Neutral 6.6-7.3
Slightly alkaline 7.4-7.8
Moderately alkaline 7.9-8.4
Strongly alkaline 8.5-9.0
Very strongly alkaline > 9.0
Source: USDA soil quality –agronomy technical note N0. 8
Related Documents