EFFECT OF SHALLOW-WATER HABITAT QUANTITY ON YOUNG-OF-YEAR SHOVELNOSE STURGEON PREY USE AND CONDITION ALONG A LONGITUDINAL GRADIENT By ANTHONY P. CIVIELLO Bachelor of Science in Wildlife Conservation and Management Missouri State University Springfield, Missouri 2013 Submitted to the Faculty of the Graduate College of the Oklahoma State University in partial fulfillment of the requirements for the Degree of MASTER OF SCIENCE December, 2016

Welcome message from author
This document is posted to help you gain knowledge. Please leave a comment to let me know what you think about it! Share it to your friends and learn new things together.
Transcript

EFFECT OF SHALLOW-WATER HABITAT
QUANTITY ON YOUNG-OF-YEAR SHOVELNOSE
STURGEON PREY USE AND CONDITION ALONG A
LONGITUDINAL GRADIENT
By
ANTHONY P. CIVIELLO
Bachelor of Science in Wildlife Conservation and
Management
Missouri State University
Springfield, Missouri
2013
Submitted to the Faculty of the
Graduate College of the
Oklahoma State University
in partial fulfillment of
the requirements for
the Degree of
MASTER OF SCIENCE
December, 2016

ii
EFFECT OF SHALLOW-WATER HABITAT
QUANTITY ON YOUNG-OF-YEAR SHOVELNOSE
STURGEON PREY USE AND CONDITION ALONG A
LONGITUDINAL GRADIENT
Thesis Approved:
Dr. James M. Long
Thesis Adviser
Dr. Andrew R. Dzialowski
Dr. Jason B. Belden
.

iii Acknowledgements reflect the views of the author and are not endorsed by committee members or Oklahoma State University.
ACKNOWLEDGEMENTS
This project would not have been possible without the support and guidance I have
received from so many people. First, I would like to acknowledge the U.S. Army Corps of
Engineers for financial support of this project. I thank my advisor, Jim Long, who has been there
for me providing guidance from the early days of checking in to his office everyday like I was
stamping a time card to the final days working in Kansas City, I will never forget it. I would also
like to thank my other committee members, Andy Dzialowski for his input in developing this
project and Jason Belden for his guidance while allowing me to use his laboratory.
I would also like to acknowledge my coworkers at the U.S. Army Corps of Engineers,
Todd Gemeinhardt, Marcus Miller, Nathan Gosch, and Dane Morris that took a chance and gave
me a temporary job as a deckhand when I was 19 years old. I would not be where I am today
without their input and direction that they have given me in the past five years. I would also like
to acknowledge Marcus Miller with the U.S. Army Corps of Engineers for being a fearless crew
leader going out to catch sturgeon whether it was raining and flood stage or sunny and dry. In
addition, I thank Clayton Ridenhour and Wes Bouska with the U.S. Fish and Wildlife Service for
doing their best to catch sturgeon for this study. I acknowledge all the folks at the U.S.Geological
Survey Columbia Environmental Research Center, especially Aaron DeLonay and Kim
Chojnacki, for their hard work in getting me an integral piece of my study. I would like to
acknowledge William Mimbs and Shane Morrison for helping me understand the lipid extraction
process and educating me on lab etiquette. I would not have been able to gather and synthesize
all this data if it were not for the friends and technicians that have helped me along the way, so I
thank Austin Hibbs, Justin Bounds, Alin Gonzalez, and Parker Greider. I was lucky enough to
have a fine group of lab mates to help me along the way, Andrew Taylor, Colt Holley, Jeff
Johnson, John Dattilo, and Nicole Farless. A special thanks to Trevor Starks, who educated me
on macroinvertebrate identification and was always there to help. I also thank the men of Theta
Chi and the Oklahoma State Ultimate Frisbee Team for helping me keep my sanity while in the
wonderful state of Oklahoma.
Last but not least, I thank my loving family and girlfriend for being there for me. I
especially thank my father for instilling a passion for natural resources and giving me work ethic
as I strive to be like him every day.

iv
Name: ANTHONY P. CIVIELLO
Date of Degree: DECEMBER, 2016
Title of Study: EFFECT OF SHALLOW-WATER HABITAT QUANTITY ON
YOUNG-OF-YEAR SHOVELNOSE STURGEON PREY USE AND
CONDITION ALONG A LONGITUDINAL GRADIENT
Major Field: NATURAL RESOURCE ECOLOGY AND MANAGEMENT
Abstract: The lower Missouri River has been highly modified and it is hypothesized that the loss
of shallow-water habitat (SWH) has decreased prey availability, negatively affecting young-of-
year (YOY) sturgeon. Young-of-year sturgeon (Scaphirhynchus spp.) from five reaches of the
lower Missouri River that varied in amount of SWH (47 to 295 ha) were sampled bi-monthly
from May through October in 2014 and 2015. For each site, I analyzed prey use and condition in
relation to the amount of SWH along a longitudinal gradient of the river. I analyzed 506 YOY
shovelnose sturgeon in 2014 and 569 in 2015 (14 to 120 mm FL) and found diet items were
restricted to three macroinvertebrate orders: diptera, ephemeroptera, and trichoptera. In 2015,
YOY shovelnose sturgeon consumed nearly twice as many prey as in 2014 and had many fewer
instances of empty stomachs. Regarding the predominant prey type, number of diptera larvae
eaten peaked at middle reaches and moderate amounts of SWH in 2014 and high numbers were
consumed at sites further downstream and as SWH increased in 2015. The number of diptera
larvae consumed grew exponentially with length, however, in 2015, rate of diptera larvae
consumed was least in high amounts of SWH. Prey quantity did not appear to be limited and
factors beyond amounts of SWH appear to be affecting prey use and survivorship of YOY
shovelnose sturgeon. The highest percent lipid (i.e. body condition) for YOY shovelnose sturgeon
was at lengths ≤40mm, attributed to assimilation of the yolk sac. Condition was best explained by
location along the river continuum, increasing with increased distance upstream (r2 ≤ 0.27). An
interannual influence was observed with average percent lipid in lengths 41-120mm being lower
in 2014 than in 2015. Emaciated and healthy control YOY shovelnose sturgeon were acquired to
compare to the condition of wild-caught fish. In 2014, length categories >41mm were not
statistically different from emaciated specimens and, in 2015, only length category 101-120mm
differed from control specimens (P ≤ 0.05). These results provide the first description of YOY
sturgeon prey use and condition at a large spatial scale along the lower Missouri River.

v
TABLE OF CONTENTS
Chapter Page
I. INTRODUCTION ......................................................................................................1
References………………………………………………………………………. 6
II. EFFECT OF HABITAT QUANTITY ON YOUNG-OF-YEAR SHOVELNOSE
STURGEON PREY USE ALONG A LONGITUDINAL GRADIENT ...............12
Introduction ............................................................................................................12
Methods..................................................................................................................14
Results ....................................................................................................................17
Discussion ..............................................................................................................20
References ..............................................................................................................23
Tables .....................................................................................................................29
Figures....................................................................................................................35
III. EFFECT OF HABITAT QUANTITY ON YOUNG-OF-YEAR SHOVELNOSE
STURGEON CONDITION ALONG A LONGITUDINAL GRADIENT ...........48
Introduction ............................................................................................................48
Methods..................................................................................................................50
Results ....................................................................................................................53
Discussion ..............................................................................................................55
References ..............................................................................................................57
Tables .....................................................................................................................61
Figures....................................................................................................................65

vi
LIST OF TABLES
Table Chapter II Page
1. A description of each sample site including the length, cumulative amount
of shallow-water habitat, approximate location of USGS water gauge
location used to gather data, average water temperature by water year, and
annual discharge for 2014 and 2015. (* incomplete data available). .................29
2. Goal set for the number of individuals to be sampled within five reaches on
the lower Missouri River. ). ................................................................................30
3. Metrics for all prey types in the gut of 506 young-of-year shovelnose
sturgeon from sample year 2014 and 569 young-of-year shovelnose sturgeon
from sample year 2015 sampled in the lower Missouri River. ..........................31
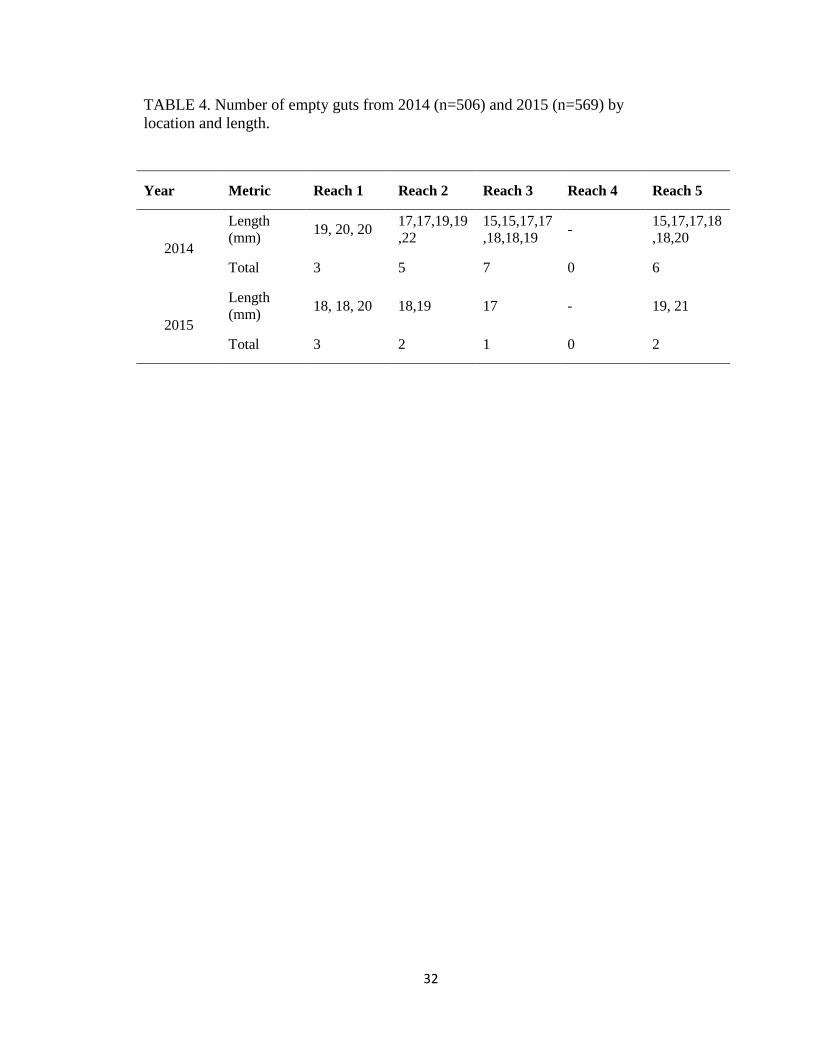
4. Number of empty guts from 2014 (n=506) and 2015 (n=569) by location and
length. . ...............................................................................................................32
5. Number of certain prey type by reach and the percent of the total diet for
2014. . . ...............................................................................................................33
6. Number of certain prey type by reach and the percent of the total diet for
2015. . . . .............................................................................................................34
Table Chapter III Page
1. Goal set for the number of individuals to be sampled within five reaches on
the lower Missouri River and for specimens received from USGS Columbia
Environmental Research Center (Emaciated (E) and Control (C)). ....................61
2. A description of each sample site including the length, cumulative amount
of shallow-water habitat, approximate location of USGS water gauge
location used to gather data, average water temperature by water year, and
annual discharge for 2014 and 2015. (* incomplete data available). .................62

vii
3. Values are means and standard errors for percent lipid of each length
category from each treatment group. Means in a row without a common
superscript letter differ (P < 0.05) as analyzed by two-way ANOVA and the
TUKEY test. ........................................................................................................63
4. Percent of each length category that falls above the minimum control
percent lipid and under the maximum emaciated percent lipid by year. . ..........64

viii
LIST OF FIGURES
Figure Chapter I Page
1. Map of the Mississippi River Basin and select major tributaries. ......................11
Figure Chapter II Page
1. Map of the lower Missouri River including sample reach and approximate
stream gauge location (red dot)...........................................................................35
2. 2014 percent fullness in relation to the distance from mouth (rkm), amount of
shallow-water habitat (ha), and residual percent fullness as it relates to amount
of shallow-water habitat (ha). Each row is a different length category decreasing
from top to bottom (0-20, 21-40, 41-60, 61-80, 81-100, 101-120mm). .............36
3. 2015 percent fullness in relation to the distance from mouth (rkm), amount of
shallow-water habitat (ha), and residual percent fullness as it relates to amount
of shallow-water habitat (ha). Each row is a different length category decreasing
from top to bottom (0-20, 21-40, 41-60, 61-80, 81-100, 101-120mm). .............37
4. 2014 number eaten of three main macroinvertebrate prey types in relation to the
amount of shallow-water habitat (ha). Letters A-F are length categories (0-20,
21-40, 41-60, 61-80, 81-100, 101-120mm) ........................................................38
5. 2015 number eaten of three main macroinvertebrate prey types in relation to the
amount of shallow-water habitat (ha). Letters A-F are length categories (0-20,
21-40, 41-60, 61-80, 81-100, 101-120mm) ........................................................39
6. 2014 number eaten of three main macroinvertebrate prey types in relation to the
distance from mouth (rkm). Letters A-F are length categories (0-20, 21-40, 41-
60, 61-80, 81-100, 101-120mm) ........................................................................40
7. 2015 number eaten of three main macroinvertebrate prey types in relation to the
distance from mouth (rkm). Letters A-F are length categories (0-20, 21-40, 41-
60, 61-80, 81-100, 101-120mm) ........................................................................41
8. 2014 residual number eaten of three main macroinvertebrate prey types in
ix
relation to the amount of shallow-water habitat (ha). Letters A-F are length
categories (0-20, 21-40, 41-60, 61-80, 81-100, 101-120mm) ............................42
9. 2015 residual number eaten of three main macroinvertebrate prey types in
relation to the amount of shallow-water habitat (ha). Letters A-F are length
categories (0-20, 21-40, 41-60, 61-80, 81-100, 101-120mm) ............................43
10. Exponential models of diptera larvae eaten by young-of-year shovelnose
sturgeon as a function of length and age in five locations of the lower Missouri
River in 2014. Numbers 1-5 are sample reach locations moving downstream to
the mouth. ..........................................................................................................44
11. Exponential models of diptera larvae eaten by young-of-year shovelnose
sturgeon as a function of length and age in five locations of the lower Missouri
River in 2015. Numbers 1-5 are sample reach locations moving downstream to
the mouth. ..........................................................................................................45
12. The slope values or rate of increase of diptera larvae eaten with ± 95%
confidence intervals for both length and daily age of young-of-year shovelnose
sturgeon from 2014 captured at 5 sample sites along the lower Missouri River 46
13. The slope values or rate of increase of diptera larvae eaten with ± 95%
confidence intervals for both length and daily age of young-of-year shovelnose
sturgeon from 2015 captured at 5 sample sites along the lower Missouri River 47
Figure Chapter III Page
1. Map of the lower Missouri River including sample reach and approximate
stream gauge location (red dot)........................................................................65
2. Influence of the amount of SWH (ha) on the percent lipid on six length
categories increasing in length from the top to bottom (0-20, 21-40, 41-60, 61-
80, 81-100, 101-120) in 2014 and 2015. Emaciated average lipid percentage
is depicted by the dashed line and the gradient in color increases in darkness
as you move from the maximum to the minimum percent lipid of emaciated
YOY shovelnose sturgeon. ..............................................................................66

x
3. Influence of distance from mouth (rkm) on the percent lipid on six length
categories increasing in length from the top to bottom (0-20, 21-40, 41-60, 61-
80, 81-100, 101-120) in 2014 and 2015. Emaciated average lipid percentage
is depicted by the dashed line and the gradient in color increases in darkness
as you move from the maximum to the minimum percent lipid of emaciated
YOY shovelnose sturgeon. ..............................................................................67
4. Influence of the amount of SWH (ha) on the residual percent lipid of six
length categories increasing in length from the top to bottom (0-20, 21-40, 41-
60, 61-80, 81-100, 101-120) in 2014 and 2015. . ............................................68
5. Box plots of percent lipid by length category. The letter or number above
each box designates the group Control (C), 2014 (14), 2015 (15), Emaciated
(E). . .................................................................................................................69

1
CHAPTER I
INTRODUCTION
Rivers and streams have long been manipulated by humans such as for transportation
routes when roads were few in the early settlement days of the United States and as a source of
power in the boom of the Industrial Revolution (NRC, 1992). Beginning in the 20th century, there
was an escalation of river engineering initiatives in the attempt to harness the power of rivers and
streams. With growing populations and urban development along rivers there was a demand for
flood control, water supply, hydropower and recreation. The growth of agricultural and mineral
production industries created a need for irrigation and navigable waterways for transportation of
goods. All these initiatives shaped the physical structure and function of rivers currently.
The Mississippi River is emblematic of these systems being the world’s second largest
drainage basin as well as being heavily altered. The basin has a total watershed of 4.8 million
square-km, encompassing more than 90 major river systems (Hesse et al., 1993), including the
Ohio, Platte and Missouri Rivers (Figure 1), all of which have been altered to varying degrees.
The prevailing influence of industrial activity in urban areas to the east, agricultural practices in
the rural areas to the west, and a demand for navigable channels across the nation has constrained
waterways and transformed the dynamic riverscape. Degradation of the Ohio River, for example,

2
occurred shortly after colonization, initially as a result of logging in the upper reaches of the river
buffered by hardwood forests. But, as population increased so did agriculture and mining leading
to wide-spread pollution in the river (Thomas et al., 2004). In 2013, the Ohio River ranked
number one for pollution discharge with over ten thousand four hundred metric tons of chemicals
dumped into the river (Environmental Protection Agency, 2015). Additionally, to sustain a
navigation channel, twenty high-lift dams have been constructed (Emery et al., 2003).
Fragmentations of rivers suppress biotic diversity, inhibit passage of organic matter, and affect
seasonal flows (Ward and Stanford, 1983). The Platte River system has had much of its water
diverted to create reservoirs for domestic needs in large cities and water supply for agriculture use
in the plains (Strange et al., 1999). These actions have increased the risk for population
extinctions of native fish fauna by altering thermally suitable habitat in this once cold-water high-
elevation stream (Rahel et al., 1996; Strange et al., 1999).
Recently, however, there are ongoing efforts in many of the large watersheds of the
Mississippi River Basin to restore certain characteristics that have been lost from anthropogenic
alterations. Restoration efforts in the upper Mississippi River Basin (above the confluence with
the Missouri River) are guided by a master plan developed by the Upper Mississippi River Basin
Commission (UMRBC, 1982); a multi-agency and stakeholder cooperation to address policy and
program priorities to create a healthier and more resilient ecosystem (USACE, 2015a).
Construction of setback levees allow the river to meander in a prescribed floodplain and dredged
diversions create backwater refugia for aquatic organisms (Gore and Shields, 1995). In addition,
Ten National Fish and Wildlife Refuges have been established along the upper Mississippi River
to contribute to the preservation of floodplain and riparian land (NRC, 1992).
Regulatory and management actions of the U.S. Fish and Wildlife Service (USFWS) in
particular have guided restoration activities to benefit threatened and endangered species in the
Mississippi River corridor. The 2000 Water Resource Development Act delegated funds for
projects within the Mississippi River basin to evaluate and better protect, restore and create

3
aquatic and related habitat. Actions in the Ohio and Platte River watersheds such as barrier
removal at low water crossings, riparian habitat plantings, timed releases from reservoirs to create
vegetation-free sand bars, acquiring habitat complexes to shield main-channel and interconnected
side channels are implemented to restore ecological functions to benefit threatened and
endangered species.
The Missouri River, however, is the largest of the Mississippi River basins and has one of
the longest histories of river engineering. As early as 1832, there had been interest in channel
modifications on the Missouri River for transportation of goods; mainly the removal of obstacles
to ease passage of steamboats, finally made possible by the 1912 Bank Stabilization and
Navigation Project. Further modified by the Rivers and Harbors Act of 1945, these acts
congressionally authorized the U.S. Army Corps of Engineers (USACE) to maintain a navigation
channel for commercial transport (USFWS, 2000). These anthropogenic influences have led to a
loss of habitat diversity on the Missouri River (USFWS, 2000; USFWS, 2003), shifting from a
meandering, shallow, turbid river into a channelized, deep, clear waterway.
Channelization of the Missouri River has altered an estimated 1.2 M ha of natural river
habitat, eliminated the reproduction of native cottonwood trees Populus deltoides, and reduced
aquatic insect abundance by seventy percent (USACE, 2009). Furthermore, many native fish
species have declined (NRC, 2011) and, in response, the USFWS issued a Biological Opinion
(BiOp) on the USACE operation of the Missouri River to prevent jeopardy of threatened and
endangered species. The Missouri River Recovery Program (MRRP) was created to implement
the reasonable and prudent alternatives of the BiOp to restore the Missouri River to a semblance
of its original dynamic riverscape and physical processes. Restoration activities are conducted in
an adaptive management framework and include improving floodplain connectivity, constructing
chutes or side channels, implementing a natural flow regime, and creating sandbar habitat
(USFWS, 2000; USFWS, 2003).
One critical restoration goal of the MRRP is the reestablishment of shallow-water habitat

4
(SWH). Shallow-water habitat is created by the modification of existing river control structures
and construction of off-channel chutes. In a regulatory context, SWH is defined as water less
than 1.5 m deep and a flow velocity less than 0.6 m/s (USACE, 2015b). Examples of SWH
include backwaters, depositional sandbars detached from the bank, and low-lying depositional
areas adjacent to shorelines (USFWS, 2003). The SWH construction goal is 8-12 ha per 1.61 km
(2,833 ha to 8,094 ha total) on the channelized lower Missouri River, below Gavins Point dam
near Yankton, South Dakota to Saint Louis, Missouri 2024 (USFWS, 2000; USFWS 2003).
Shallow-water habitat is critical for young and small-bodied fishes by providing low
velocity nursery zones for growth and development (Schiemer et al., 2001). Shallow-water may
encourage increased forage opportunities for fishes by retaining higher rates of organic matter,
phytoplankton, and zooplankton (Knowleton and Jones, 2000; Brown and Coon, 1994). Shallow-
water habitat also provides a refuge in the channelized areas of the river for drifting larval fishes
growth and development (Schiemer et al., 2001).
Two long-lived river sturgeon species occur in the lower Missouri River Basin, both with
similar life history traits (Wildhaber et al., 2007). The pallid sturgeon Scaphirhynchus albus is
rare and endangered in most of its range (Colombo et al., 2007) and is one of the species for
which the BiOp was written prompting habitat restoration along the lower Missouri River. The
shovelnose sturgeon S. platorynchus, the more common of the two, is listed as threatened when
sympatric with pallid sturgeon due to similarity of appearance. Because pallid sturgeon are rarely
captured, shovelnose sturgeon is often considered a surrogate for pallid sturgeon.
Early life stages of shovelnose sturgeon depend on nursery habitat availability that slows
larval drift, increases retention of food sources and provides habitat conditions for recruitment to
age-1 (i.e., SWH) (Braaten et al., 2008). The transition from the yolk sac to exogenous feeding is
important for survival of young-of-year (YOY) sturgeon, so an abundance of benthic
macroinvertebrates, their main prey source (Sechler et al., 2012), is critical. While the creation of
more SWH may provide areas favorable to fishes and macroinvertebrate production (Schiemer et

5
al., 2001; Sechler et al., 2012), it is currently unknown if SWH restoration is providing the
hypothesized benefits to support early life stages of YOY sturgeon. For example, YOY sturgeon
were more likely to have empty stomachs in SWH within constructed chutes compared to SWH
in mainstem habitats of the lower Missouri River (Gosch et al., 2016; T. Starks, Oklahoma State
University, unpublished data). The goal of this research is to identify whether SWH restoration
affects YOY sturgeon prey use and body condition in the lower Missouri River at a large spatial
scale.
6
REFERENCES
Belt CB. 1975. The 1973 flood and man’s construction of the Mississippi River. American
Association for the Advancement of Science 189 : 681 684.
Braaten PJ, Fuller DB, Holte LD, Lott RD, Viste W. Brandt TF, Legare RG. 2008. Drift
dynamics of larval pallid sturgeon and shovelnose sturgeon in a natural side channel of
the upper Missouri River, Montana. North American Journal of Fisheries Management
28 : 808-826. DOI: 10.1577/M06-285.1.
Braaten PJ, Fuller DB, McClenning ND. 2007. Diet composition of larval and young-of-year
shovelnose sturgeon in the upper Missouri River. Journal of Applied Ichthyology 23 :
516-520. DOI: 10.1111/j.1439-0426.2006.00822.x.
Brown DJ, Coon TG. 1994. Abundance and assemblage structure of fish larvae in the lower
Missouri River and its tributaries. Transactions of the American Fisheries Society 123 :
718-732. DOI: 10.1577/1548-8659(1994)123<0718:AAASOF>2.3.CO;2.
Colombo RE, Garvey JE, Jackson ND, Brooks R, Herzog DP, Hrabik RA, Spier TW. 2007.
Harvest of Mississippi River sturgeon drives abundance and reproductive success: a
harbinger of collapse?. Journal of Applied Ichthyology 23 : 444-451. DOI:
10.1111/j.1439-0426.2007.00899.x.
Dzialowski AR, Bonneau JL, Gemeinhardt TR. 2013. Comparisons of zooplankton and
phytoplankton in created shallow water habitats of the lower Missouri River: implications
for native fish. Aquatic Ecology 47 : 13-24. DOI: 10.1007/s10452-012-9421-0.
Emery EB, Simon TP, McCormick FH, Angermeier PL, Deshon JE, Yoder CO, Sanders RE,
Pearson WD, Hickman GD, Reash RJ, Thomas JA. 2003. Development of a multimetric
index for assessing the biological condition of the Ohio River. Transactions of the
American Fisheries Society 132 : 791-808. DOI: 10.1577/T01-076.

7
Environmental Protection Agency. 2015. National toxics release inventory national analysis
2013.
Galat DL, Lipkin R. 2000. Restoring ecological integrity of great rivers: historical hydrographs
aid in defining reference conditions for the Missouri River. Hydrobiologia 422/423 : 29-
48. DOI: 10.1007/978-94-011-4164-2_3.
Gemeinhardt TR, Gosch NJC, Morris DM, Miller ML, Welker TL, Bonneau JL. 2015. Is shallow
water a suitable surrogate for assessing efforts to address pallid sturgeon population
declines? River Research and Applications. DOI: 10.1002/rra.2889.
Gore JA, Shields FD. 1995. Can large rivers be restored?. American Institute of Biological
Sciences. 45 : 142-152. DOI: 10.2307/1312553.
Gosch NJC, Miller ML, Gemeinhardt TR, Starks TA, Civiello AP, Long JM, Bonneau JL. 2016.
Age-0 shovelnose sturgeon prey consumption in the lower Missouri River. River
Research and Applications. DOI: 10.1002/rra.
Gosch NJ, Morris DM, Gemeinhardt TR, Bonneau JL. 2013. Pre-and post-construction
assessment of nutrient concentrations at shallow water habitat restoration sites on the
lower Missouri River. Journal of Water Resource and Protection 5 : 249-258. DOI:
10.4236/jwarp.2013.53025.
Hesse LW, Stalnaker CB, Benson NG. 1993. Restoration planning for the rivers of the
Mississippi River ecosystem. National Ecology Research Center, Fort Collins.
Jacobson RB, Galat DL. 2006. Flow and form in rehabilitation of large-river ecosystems: an
example from the lower Missouri River. Geomorphology 77 : 249-269. DOI:
10.1016/j.geomorph.2006.01.014.
Knowlton MF, Jones JR. 2000. Seston, light, nutrients and chlorophyll in the Lower Missouri
River, 1994 - 1998. Journal of Freshwater Ecology 15 : 283-297. DOI:
10.1080/02705060.2000.9663747.

8
Loomis J, Kent P, Strange L, Fausch K, Covich A. 2000. Measuring the total economic value of
restoring ecosystem services in an impaired river Basin: results from a contingent
valuation survey. Ecological Economics 33 : 103-117.
Mitsch WJ, Day JW, Gilliam JW, Groffman PM, Hey DL, Randall GW, Wang N. 2001.
Reducing nitrogen loading to the Gulf of Mexico from the Mississippi River Basin:
strategies to counter a persistent ecological problem. Bioscience 51 : 373-388. DOI:
10.1641/0006-3568(2001)051[0373:RNLTTG]2.0.CO.
National Research Council. 1992. Restoration of aquatic ecosystems: science, technology, and
public policy. National Academy Press, Washington, DC.
National Research Council. 2011. Missouri River planning, recognizing and incorporating
sediment management. The National Academy Press: Washington D.C.; 152.
Nilsson C, Reidy CA, Dynesius M, Revenga C. 2005. Fragmentation and flow regulation of the
world's large river systems. Science 30 : 405. DOI: 10.1126/science.1107887.
Platte River Recovery Implementation Program (PRRIP). 2013. Fiscal year 2014 budget and
annual work plan. Governance Committee.
Rahel FJ, Keleher CJ, Anderson JL. 1996. Potential habitat loss and population fragmentation for
cold water fish in the North Platte River drainage of the Rocky Mountains: response to
climate warming. Limnology and Oceanography 41 : 1116-1123.
Sechler DR, Phelps QE, Tripp SJ, Garvey JE. 2012. Habitat for age-0 shovelnose sturgeon and
pallid sturgeon in a large river: interactions among abiotic factors, food, and energy
intake. North American Journal of Fisheries Management 32 : 24-31. DOI:
10.1080/02755947.2012.655848.
Schiemer F, Keckeis H, Reckendorfer W, Winkler G. 2001. The ‘inshore retention concept’ and
its significance for large rivers. Archiv für Hydrobiologie 135 : 509-516. DOI: 0945-
3784/01/0135-0509.

9
Sparks, Richard E. 1995. Need for ecosystem management of large rivers and their
floodplains.bioscience. Oxford University Press: 45 : 168-82. DOI: 10.2307/1312556
Strange EM, Fausch KD, Covich AP.1999. Sustaining ecosystem services in human-dominated
watersheds: biohydrology and ecosystem processes in the South Platte River
Basin. Environmental Management 24 : 39-54. DOI: 10.1007/s002679900213
Taylor RW. 1989. Changes in freshwater mussel populations of the Ohio River: 1,000 BP to
Recent Times. Ohio Journal of Science 89 : 188-191.
Thomas JA, Emery EB, McCormick FH. 2004. Detection of temporal trends in Ohio River fish
assemblages based on lockchamber surveys (1957 - 2001). American Fisheries Society
Symposium 45 : 431.
Upper Mississippi River Basin Commission. 1982. Comprehensive master plan for the
management of the upper Mississippi River system: review comments. Upper Mississippi
River Basin Commission.
U.S. Army Corps of Engineers. 2003. Final supplemental environmental impact statement for the
Missouri river fish and wildlife mitigation project. Kansas City and Omaha Districts.
U.S. Army Corps of Engineers. 2006. Missouri River bank stabilization and navigation fish and
wildlife mitigation program: Jameson Island unit project implementation report. Kansas
City District.
U.S. Army Corps of Engineers. 2009. Missouri River recovery program fact sheet. Missouri
River Recovery Program.
U.S. Army Corps of Engineers. 2015a. Enhancing restoration and advancing knowledge of the
upper Mississippi River: a strategic plan for the upper Mississippi River restoration
program 2015 - 2025. Upper Mississippi River Basin Commission.
U.S. Army Corps of Engineers. 2015b. Missouri River recovery program shallow water habitat
accounting summary report. Kansas City and Omaha District.

10
U.S. Army Corps of Engineers and U.S. Fish and Wildlife Service. 2012. Adaptive management
strategy for creation of shallow water habitat. Version 5.3.
U.S. Fish and Wildlife Service. 2000. Biological opinion of the operation of the Missouri River
main stem reservoir system, operation and maintenance of the Missouri River bank
stabilization and navigation project and operation of the Kansas River reservoir system.
USFWS: Washington D.C.
U.S. Fish and Wildlife Service. 2003. Amendment to the 2000 biological opinion of the operation
of the Missouri River main stem reservoir system, operation and maintenance of the
Missouri River bank stabilization and navigation project and operation of the Kansas
River reservoir system. USFWS: Washington D.C.
Ward JV, Stanford JA. 1983. The serial discontinuity concept of lotic ecosystems. Dynamics of
lotic ecosystems 10 : 29-42.
Wildhaber ML, DeLonay AJ, Papoulias DM, Galat DL, Jacobson RB, Simpkins DG, Braaten PJ,
Korschgen CE, Mac MJ. 2007. A conceptual life-history model for pallid and shovelnose
sturgeon. U.S. Geological Survey Circular 1315. Reston, Virginia.

11
FIGURE 1. Map of the Mississippi River Basin and select major tributaries.

12
CHAPTER II
EFFECT OF HABITAT QUANTITY ON YOUNG-OF-YEAR SHOVELNOSE STURGEON
PREY USE ALONG A LONGITUDINAL GRADIENT
Introduction
Anthropogenic influences have led to a loss of habitat diversity on the lower Missouri
River (USFWS, 2000; USFWS, 2003), engineered from a meandering, shallow, slow-moving
river into a channelized, deep, swift-moving waterway. An estimated 90 percent of historical
shallow, slow-moving aquatic habitat has been lost due to construction, operation, and
maintenance of structures to improve boat navigation (USFWS, 2000). Since 2000, restoration
actions have been directed at the reestablishment of shallow-water habitat (SWH) through
modification of existing river structures and construction of off-channel chutes. The regulatory
definition of SWH was defined as water less than 1.5 m deep and a flow velocity of less than 0.6
m/s and includes backwaters, depositional sandbars detached from the bank, and low-lying
depositional areas adjacent to shorelines (USFWS, 2000; USFWS, 2003; USFWS 2009). As of
2014, there were 45,367 ha of SWH created throughout the entire Missouri River (USACE,
2014). Shallow-water habitat is thought to benefit the early-life stages of small bodied fish,
especially, federally endangered pallid sturgeon Scaphirhynchus albus and its ecologically similar

13
relative - shovelnose sturgeon Scaphirhynchus platorynchus (Braaten et al,. 2007, 2012; Gosch et
al., 2015). Most sturgeon captured on the lower Missouri River in 2014 and 2015 were
genetically confirmed shovelnose sturgeon (E. Heist, Southern Illinois University, unpublished
data) which is the focus of this study.
Whether constructed SWH benefits river sturgeon and their early life stages has only
recently been investigated. The SWH restoration is under the umbrella of the Missouri River
Recover Program and is set in an adaptive management framework that uses the best available
science to make management decisions (USFWS, 2003; USACE, 2014). Current monitoring
attempts to assess system-wide responses for long-term recruitment of pallid sturgeon and the
short-term responses to SWH creation, such as increased retention of YOY sturgeon and
increased food availability (USACE, 2012). The early life stages of Scaphirhynchus species are
thought to depend on SWH as nursery areas (Colombo et al., 2007; Wildhaber et al., 2007) where
larvae fall out of the drift in areas of high food source retention improving survival (Braaten et
al., 2008).
A link between macroinvertebrate density in SWH and Scaphirhynchus recruitment is
hypothesized to be the bottleneck to sturgeon population viability in the lower Missouri River
(Wildhaber et al., 2007; Steffensen et al., 2014). In large rivers, slow water velocities and high
concentrations of silt and organic matter coincide with an increase in productivity and availability
of macroinvertebrate prey (Schiemer et al., 2001; Schiemer et al., 2002; Galat et al. 2005; Ning et
al., 2010; Benke and Cushing, 2011; O’Neil and Thorp, 2011; Sechler et al., 2012).
Longitudinal, as well as lateral connectivity to adjacent shallow water areas benefits river fishes
through input of nutrients and prey sources (Humphries et al., 1999; Wildhaber et al., 2007;
Schiemer et al., 2002). An abundance of benthic macroinvertebrates, the main prey source for
young-of-year (YOY) Scaphirhynchus, is a determinant of survival during the transition from the
yolk sac to exogenous feeding (Gisbert and Williot, 1997; Deng et al., 2003; Wildhaber et al.,
2007; Braaten et al. 2012).

14
Successful feeding at initiation of exogenous feeding and an increase in prey use as they
grow and develop is closely linked to survival at this critical period in YOY Scaphirhynchus life
history. Dietary studies of YOY shovelnose sturgeon in the lower Missouri River are sparse
(Gosch et al. 2015), but have been conducted more extensively in the middle Mississippi River
(Sechler 2012, 2013), lower Mississippi River (Harrison et al., 2014), and the upper Missouri
River (Braaten et al., 2007). In these studies, YOY shovelnose sturgeon rarely had incidences of
empty stomachs (Braaten et al., 2007; Sechler et al., 2012; Harrison et al., 2014), suggesting
abundant prey, with diets dominated by two macroinvertebrate orders: diptera and ephemeroptera
(Braaten et al., 2007; Sechler et al., 2012, 2013; Harrison et al., 2014; Gosch et al., 2016). In
addition, an exponential increase in prey consumption was observed concomitant with fish sizes
(Braatan et al., 2007, Sechler et al., 2012, 2013).
With the restoration goal of creating SWH, the hypothesis is that an increase in SWH will
increase production and retention of food sources increasing YOY river sturgeon prey use,
ultimately leading to greater YOY shovelnose sturgeon survival. The objective of this study is to
examine prey use and stomach fullness of YOY shovelnose sturgeon at a large spatial scale along
a linear gradient of the lower Missouri River.
Methods
Study site. - The geographic extent of the SWH restoration includes the main-stem lower
Missouri River and main-stem connected side channel chutes from Ponca, Nebraska to the
confluence with the Mississippi River in Saint Louis, Missouri (USACE, 2015; Figure 1). The
lower Missouri River is channelized from self-dredging powered by dikes and revetments
constricting the thalweg and directing flow toward the middle of the river (Jacobson and Galat,
2006). Five reaches of the lower Missouri River between Kansas City and Saint Louis that varied

15
in amount of cumulative SWH (47 to 295 ha) were sampled bi-monthly from May through
October in 2014 and 2015 when river conditions permitted (Table 1).
Sampling Design. - Sampling was conducted by the U.S. Army Corps of Engineers (reach
1 and 2) and the U.S. Fish and Wildlife Service (reach 3, 4, and 5; Figure 1) using a bow-
mounted or stern-mounted otter trawls (OTO4) in accordance with the Missouri River Standard
Operating Procedures for Fish Sampling and Data Collection (Welker and Drobish, 2012). The
OTO4 is a 4 mm mesh nylon net with a 4.88 m opening that is pulled with the river current along
the riverbed and spread open by two, 91.4 cm by 38.1cm boards (a.k.a. doors). The OTO4 was
used to catch YOY shovelnose sturgeon in benthic habitats between 1.5 and 5 m deep with a
trawling distance from 75 to 300 m and between 1 and 1.5 m deep with a trawling distance from
15 to 150 meters. When three or more YOY shovelnose sturgeon were captured in a single trawl,
an additional two trawls were conducted in the same location. If ten or more YOY shovelnose
sturgeon were captured in either additional trawl, one duplicate trawl was conducted for a
maximum of five trawls in the same location. Repeated sampling of habitats was necessary to
achieve the desired sample size in each length category.
Captured YOY sturgeon were measured for fork length (FL) or total length (TL),
depending on presence of the heterocercal tail filament. Fin clips were sent to Southern Illinois
University to verify species identity through genetic analysis. Young-of-year shovelnose
sturgeon were kept at -18ºC and preserved in ethanol to minimize oxidative decomposition and
slow deterioration. After each sampling season was complete, up to 20 YOY shovelnose
sturgeon were randomly selected from each of the six separate length categories (0-20, 21-40, 41-
60, 61-80, 81-100, 101-120 mm) for gut content analysis (Table 2).
Diet quantification. - The lower esophagus and stomach of YOY shovelnose sturgeon
were removed in the laboratory, blotted dry and weighed (0.0001g), gut contents removed, and
the stomach reweighed. By subtraction, this provided stomach content weight (plus
unidentifiable material and fluid) to give a proportion of prey items relative to gut size (percent

16
stomach fullness) (Terry, 1976; Hyslop, 1980; Hintz et al., 2015). Gut contents were then
enumerated under a Nikon SMZ800 microscope and identified to order (family for diptera) and
sub-sampled if prey items exceed 250. Sub-sampling was conducted by spreading the gut
contents out in gridded tray (mm2) counting items in three randomly selected grids to count,
which were averaged, and multiplied by the number of filled grids to estimate the total number of
prey items (Hayslip, 2007). A search for large and rare organisms was also conducted before
sub-sampling.
Statistical methods. - Trends of percent fullness by length category in relation to the
amount of SWH (ha) and distance from the mouth of the Missouri River (i.e. river kilometer
(rkm) along a longitudinal gradient) was examined with quadratic regression analysis in
SigmaPlot 12 statistical software. The number of each major prey type consumed by each length
category in relation to the amount of SWH and location along the river (RKM) was analyzed with
zero inflated negative binomial regression and zero inflated Poisson regression, depending on
convergence and model fit, in 2014 and 2015 using SAS 9.4 software. To separate the influence
of location from SWH quantity, the residuals of the number of prey eaten and percent fullness for
the RKM models were extracted and plotted against the amount of SWH (ha).
The rate of change in prey consumed with YOY shovelnose sturgeon length and age
(ontogenetic diet shift) for each study site, was examined with exponential regression using
SigmaPlot version 12 statistical software. Young-of-year shovelnose sturgeon age (days) was
estimated by quantifying post-hatch length-increases as a function of water temperature (Braaten
and Fuller, 2007) using data from the USGS National Water Information System in approximate
location to the five study reaches (Table 1). Slope estimates (±95% CI) of the regression models
were plotted against quantity of SWH and river location (rkm) for each year to investigate how
these two variables affected the rate of prey consumption as a function of YOY shovelnose
sturgeon length and age.

17
Results
A total of 506 YOY sturgeon in 2014 and 569 YOY sturgeon in 2015 were randomly
selected, but not all length categories were represented by the goal of 20 individuals (Table 2).
Genetic analysis confirmed that all YOY sturgeon used for this analysis were shovelnose
sturgeon. Diet items were restricted to mainly two macroinvertebrate orders: diptera (larvae and
pupae) and ephemeroptera (nymphs). Cyclopoid copepods and trichopterans were rarely
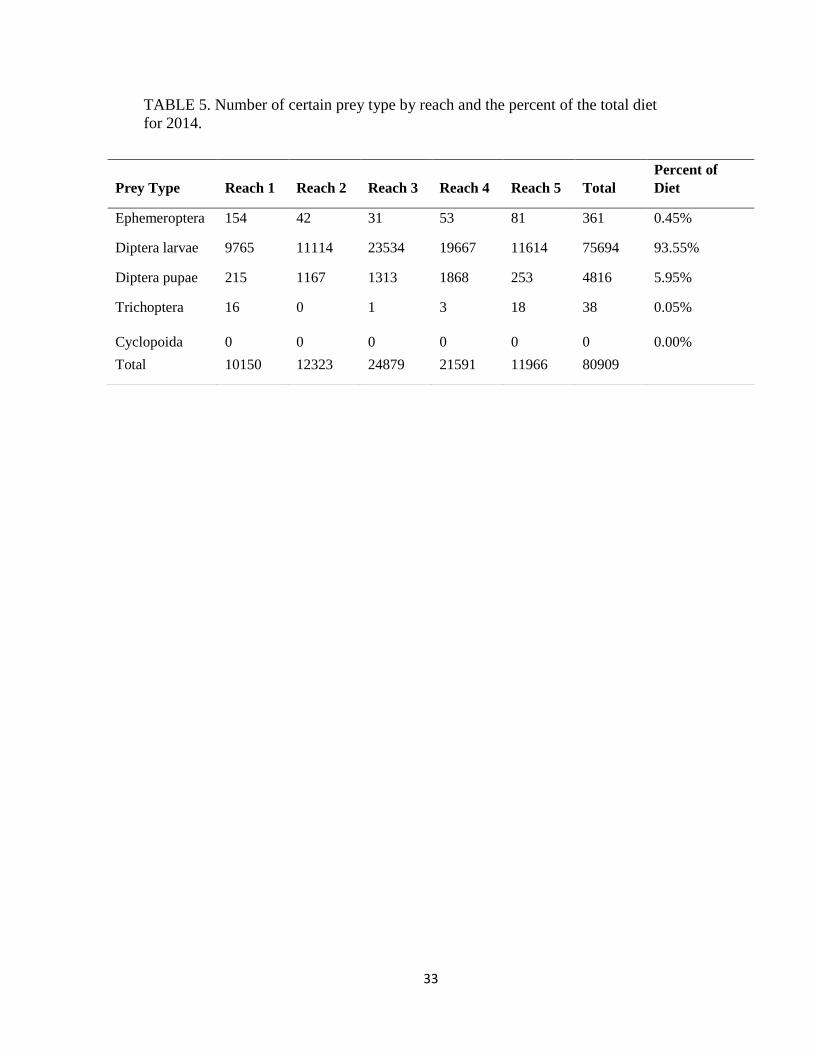
consumed and excluded from further analysis (Table 3). I identified 80909 diet items from 506
individual YOY shovelnose sturgeon in 2014 (Table 5); 21 fish had empty stomachs (Table 4).
In 2015, I identified 197344 diet items from 569 YOY shovelnose sturgeon (Table 6) and only 8
were empty (Table 4). The number of prey items consumed in 2015 was over twice as many as in
2014, paralleling to the number of empty stomachs (Table 4). Diptera larvae was the most
frequently encountered prey item (88% in 2014 and 93% in 2015), followed by diptera pupae
(46% and 49%) and ephemeroptera (29% and 19%; Table 3).
In 2014, percent fullness was significantly and non-linearly related to river location
(distance from mouth; rkm) for all length categories of YOY shovelnose sturgeon <80 mm (4
categories) (Figure 2; left column), whereas only 2 length categories (0-20 and 60-80 mm)
exhibited significant models as a function of SWH quantity (Figure 2; middle and right columns).
For the smallest YOY shovelnose sturgeon category, percent fullness peaked farthest away from
the river mouth and in areas with the least amount of SWH. For larger-sized YOY shovelnose
sturgeon, percent fullness peaked at moderate distances from the mouth and moderate amounts of
SHW. After accounting for the effect of river location, percent fullness, when significant, peaked
at low amounts of SWH. However, explanatory ability of these models was fairly low (r2 ≤0.21).
In 2015, percent fullness was significantly and non-linearly related to RKM and amount
of SWH (Figure 3), but different from 2014. Significant relationships between percent fullness

18
and distance from mouth, as well as amount of SWH, were found for larger-sized YOY
shovelnose sturgeon (60-80, 80-100, and 120-140 mm). Young-of-year shovelnose sturgeon from
60-80 mm had peak stomach fullness at both ends of the variables (far and near the mouth; low
and high SWH). In contrast, length categories 80-100 mm and 120-140 mm had peak stomach
fullness far from the mouth and in areas with lower amounts of SWH (Figure 3; left and middle
columns). Adjusting for river location, only YOY shovelnose sturgeon 41-60 mm exhibited a
significant relationship with amount of SWH, peaking at the lower quantities. Similar to 2014,
however, these models all exhibited low explanatory power (r2 ≤ 0.27).
In 2014, SWH was significantly related to the number of each prey type consumed;
however, it depended on YOY shovelnose sturgeon length. Not including the smallest length
category (0-20mm), there were peak numbers of diptera larvae and diptera pupae consumed at
sample sites with moderate amounts of SWH (Figure 4). The 0-20mm YOY shovelnose sturgeon
had more diptera larvae and pupae consumed at low amounts of SWH (Figure 4; diptera larvae P
= 0.01, r2 = 0.54 and diptera pupae P=0.01, r2=0.47). Ephemeroptera, for the statistically
significant models, were consumed more at high and low amounts of SWH (Figure 4; right
column).
The 2015 analysis for number eaten in relation to the amount of SWH was significantly
related but with varying results based on prey type. Diptera larvae did not show as strong of a
peak as in 2014, but more of a slight increase in consumption as the amount of SWH increased
(Figure 5; left column). For diptera pupae, YOY shovelnose sturgeon > 20 mm consumed more
of this prey type at sites in the moderate range of SWH (P = 0.01, r2 ≥ 79). All but one model
was statistically significant for the ephemeroptera prey type and the trend showed an increase in
number eaten for YOY shovelnose sturgeon 21-40 mm (P = 0.05, r2 = 47) and > 61 mm (P ≤
0.02, r2 ≥ 51) in the reach with the highest amount of SWH (Figure 5; right column).
The spatial relationship of distance from mouth (rkm) and number of prey type consumed
depended on the year sampled and the prey type. In 2014, there were strong relationships in the

19
number of diptera larvae and diptera pupae eaten (P ≤ 0.05, r2 ≥ 0.43; Figure 6 left and middle
column) with site location. In 2014, peak number of diptera larvae and diptera pupae consumed
occurred at areas mid-distance from the mouth. The number of ephemeroptera consumed peaked
at sites furthest upstream from the mouth (Figure 6; right column). The 2015 results tended to
explain more of the statistical variation between distance from mouth (rkm) and number of prey
type eaten (P ≤ 0.05, r2 ≥ 0.53) than in 2014. RKM had a significant influence on the number of
diptera larvae eaten with higher numbers consumed at sites closer to the mouth of the Missouri
River (Figure 7; left column). Similar to 2014, there were more diptera pupae present in the gut
in the middle sample reaches in 2015 forming a peak in the mid-reaches (Figure 7; middle
column). In 2014 and 2015, there were more ephemeroptera consumed in reach 1 (Table 5 and
6).
The residual number of prey eaten in relation to amount of SWH analysis models all
exhibited low explanatory power (r2 ≤ 0.17) and few instances of significance (Figure 8 and
Figure 9). For the statistically significant models in 2014, diptera larvae consumption peaked at
moderate amounts of SWH and a declining slope in relation to amount of SWH for diptera pupae.
No significant models were produced in 2015 (Figure 9).
Young-of-year shovelnose sturgeon exhibited exponential increases in number of prey
consumed (predominately diptera larvae) as a function of size and age at all study reaches.
Comparatively, across all reaches, there was a trend for exponential models to have greater
explanatory power in upstream reaches (1 and 2) in both years (Figure 10 and Figure 11). The
rates at which YOY shovelnose sturgeon consumed diptera larvae was not a function of distance
from mouth or amount of SWH in 2014 (Figure 12). However, in 2015, the lowest rate of
consumption was at the site with the most amounts of SWH, near the mouth of the Missouri River
(Figure 13). Additionally in 2015, there was an indication for the highest rate of prey
consumption to occur at the site with the least amount of SWH.

20
Discussion
It is evident that the influence of SWH on prey use (i.e. fullness, by prey type, and
ontogenetically) depends on year, fish length, and prey type. However, YOY shovelnose
sturgeon appeared to consume adequate amounts of prey throughout the sample reaches in
comparison to published studies in other areas. In the upper Missouri River, YOY shovelnose
sturgeon consumed an average of 4655 diet items per individual, with one percent incidence of
empty stomachs (Braaten et al., 2007). In the middle Mississippi River, there was a one percent
incidence of empty stomachs out of 404 YOY Scaphirhynchus captured (Sechler et al. 2013).
Although instances of empty stomachs was greater in the lower Missouri River, they coincided
with the smallest length categories, when these fish transition from endogenous yolk to
exogenous feeding on invertebrate prey (Snyder, 2002), suggesting chance captures during the
transition period rather than a failure to feed (Sechler et al., 2013). Whether my results from the
lower Missouri River are indicative of this section of river compared to the upper Missouri River
or Mississippi River is occluded by the differences between years. YOY sturgeon in 2015
consumed nearly twice as many prey as in 2014 and had many fewer instances of empty
stomachs, suggesting that environmental variability influenced feeding. Water levels and
temperatures were greater in 2015 than 2014, but it is unknown how these two variables might
have affected feeding by YOY sturgeon. Plausibly, higher water levels would influence
productivity, increasing prey availability for YOY sturgeon. Additionally, higher water
temperatures could have led to increased activity and consumption rates by YOY sturgeon
(Phelps et al., 2010). Either of these hypotheses would require additional studies to identify the
causative role that these variables would exert on YOY sturgeon prey use.
Shallow-water habitat was defined for regulatory purposes at a medium August flow
(USACE, 2014) and remained fixed at that cumulative amount for analyses. In reality, the

21
amount of SWH fluctuates over time; by annual releases from reservoirs through dams as well as
rainfall and snowmelt through tributaries that change temperature and discharge in the river
seasonally. The lower Missouri River historically had more SWH overall (USFWS, 2000;
USFWS, 2003); however, under current modified river conditions, SWH is believed to be
maximized during extremely low flows (Jacobson and Galat, 2006). Water level (i.e. discharge)
likely influenced the available prey and the amount of SWH available for feeding by YOY
sturgeon in my study. Although intermittent rises in river stage likely increases prey available by
washing prey into settling areas (Harrison, 2012) SWH would generally be scarce during seasons
of higher water levels (Jacobson and Galat, 2006). In 2015, when water levels were higher,
relationships between amount of SWH and prey use were more evident, suggesting that SWH
was more important when it was less abundant.
Factors beyond amounts of SWH appear to affect prey use by YOY shovelnose sturgeon.
Longitudinal factors, for instance, are likely major drivers of shovelnose sturgeon prey use.
Gavins Point Dam, the first dam on the Missouri River, acts as an ecological reset for conditions
downstream (Ward and Stanford, 1983). In this stretch below the dam, the channel is sinuous and
braided, promoting the production of collector and predatory insects that dominate the
macroinvertebrate assemblage (i.e. diptera and ephemeroptera) (Vannote et al., 1980) and this
was exemplified in the peak trend in number of prey eaten and greater incidences of
ephemeroptera at the upstream reach.
The use of the best available science to implement restoration actions (i.e. SWH creation)
on the lower Missouri River is imperative to the adaptive management framework that is being
used to manage the lower Missouri River (USFWS, 2000; USFWS, 2003). Only recently have
restoration projects involving the creation of SWH in the lower Missouri River been conducted to
determine their effect. In 2012 and 2013, richness of age-0 fishes differed between created chute
SWH and mainstem SWH (Starks et al., 2014) as well as lower probability of catching
exogenously feeding YOY shovelnose sturgeon in habitats that meet SWH criteria (Ridenhour et

22
al.,2011; Gemeinhardt et al., 2015; Gosch et al., 2015). Based on these findings, the role of
habitat on YOY sturgeon feeding and ultimate survivorship is in need of further study. The
results of this study provide the first description of YOY shovelnose sturgeon prey use at a large
spatial scale along the lower Missouri River and suggests that prey quantity is not limited; other
factors that affect sturgeon survivorship may exist and should be investigated (e.g., body
condition).
23
REFERENCES
Benke, AC, Cushing, CE. eds., 2011. Rivers of North America. Academic Press.
Braaten, PJ, Fuller DB. 2007. Growth rates of young-of-year shovelnose sturgeon in the upper
Missouri River. Journal of Applied Ichthyology 23 : 506-515. DOI: 10.1111/j.1439-
0426.2006.00821.x.
Braaten PJ, Fuller DB, McClenning ND. 2007. Diet composition of larval and young-of-year
shovelnose sturgeon in the upper Missouri River. Journal of Applied Ichthyology 23 :
517-521. DOI: 10.1111/j.1439-0426.2006.00822.x.
Braaten PJ, Fuller DB, Holte LD, Lott RD, Viste W. Brandt TF, Legare RG. 2008. Drift
dynamics of larval pallid sturgeon and shovelnose sturgeon in a natural side channel of
the upper Missouri River, Montana. North American Journal of Fisheries Management
28 : 808-826. DOI: 10.1577/M06-285.1.
Braaten PJ, Fuller DB, Lott RD, Haddix TM, Holte LD, Wilson RH, Bartron ML, Kalie JA,
DeHaan PW, Ardren WR, Holm RJ, Jaeger ME. 2012. Natural growth and diet of
known-age pallid sturgeon (Scaphirhynchus albus) early life stages in the upper Missouri
River basin, Montana and North Dakota. Journal of Applied Ichthyology 28 : 496-504.
DOI: 10.1111/j.1439-0426.2012.01964.x.
Carter SR, Bazata KR, Andersen DL. Macroinvertebrate communities of the channelized
Missouri River near two nuclear power stations 1982 :147-182.
Colombo RE, Garvey JE, Wills PS. 2007. A guide to the embryonic development of the
shovelnose sturgeon (Scaphirhynchus platorynchus), reared at a constant temperature.
Journal of Applied Ichthyology 23 : 402-410. DOI: 10.1111/j.1439-0426.2007.00898.x.
Deng DF, Koshio S, Yokoyama S, Bai SC, Shao Q, Cui Y, Hung SSO. 2003. Effects of feeding
rate on growth performance of white sturgeon (Acipenser transmontanus) larvae.
Aquaculture 217 : 589-598. DOI: 10.1016/S0044-8486(02)00461-1.

24
Galat DL, Berry CR, Gardner WM, Hendrickson JC, Mestl GE, Power GJ, Stone C, Winston
MR. 2005. Spatiotemporal patterns and changes in Missouri River fishes. 45 : 249-291.
Galat DL, Lipkin R. 2000. Restoring ecological integrity of great rivers: historical hydrographs
aid in defining reference conditions for the Missouri River. Hydrobiologia 422/423 : 29-
48. DOI: 10.1007/978-94-011-4164-2_3.
Gisbert E, Williot P. 1997. Larval behavior and effect of the timing on initial feeding on growth
and survival of Siberian sturgeon (Acipenser baeri) larvae under small scale hatchery
production. Aquaculture 156 : 63-76. DOI: 10.1016/S0044-8486(97)00086-0.
Gore JA, Shields FD. 1995. Can large rivers be restored?. American Institute of Biological
Sciences 45 : 142-152. DOI: 10.2307/1312553.
Gosch NJC, Miller ML, Gemeinhardt TR, Starks TA, Civiello AP, Long JM, Bonneau JL. 2016.
Age-0 shovelnose sturgeon prey consumption in the lower Missouri River. River
Research and Applications. DOI: 10.1002/rra.
Harrison AB. 2012. The diets of larval and juvenile pallid sturgeon and shovelnose sturgeon
(Scaphirhynchus spp.) in the Lower Mississippi River. Master’s Thesis, Clemson
University.
Harrison AB, Slack WT, Killgore JK. 2014. Feeding habitats of young-of-year river sturgeon
Scaphirhynchus spp. in the lower Mississippi River. The American Midland Naturalist. 1
: 54-67. DOI: 10.1674/0003-0031-171.1.54.
Hayslip G, editor. 2007. Methods for the collection and analysis of benthic macroinvertebrate
assemblages in wadeable streams of the Pacific Northwest. Pacific Northwest Aquatic
Monitoring Partnership, Cook, Washington.
Hesse LW, Stalnaker CB, Benson NG. 1993. Restoration planning for the rivers of the
Mississippi River ecosystem. National Ecology Research Center, Fort Collins.

25
Hintz WD, MacVey NK, Asher AM, Porreca AP, Garvey JE. 2015. Variation in prey selection
and foraging success associated with early-life ontogeny and habitat use of American
paddlefish (Polyodon spathula). Ecology of Freshwater Fish. DOI: 10.1111/eff.12266.
Humphries P, King AJ, Koehn, JD. 1999. Fish, flows and flood plains: links between freshwater
fishes and their environment in the Murray-Darling River system,
Australia. Environmental Biology of Fishes 56 : 129-151. DOI:
10.1023/A:1007536009916.
Hyslop EJ. 1980. Stomach contents analysis - a review of methods and their application. Journal
of Fisheries Biology. 17 : 411-429. DOI: 10.1111/j.1095-8649.1980.tb02775.x.
Jacobson RB, Galat DL. 2006. Flow and form in rehabilitation of large-river ecosystems: an
example from the lower Missouri River. Geomorphology 77 : 249-269. DOI:
10.1016/j.geomorph.2006.01.014.
Modde TC, James CS. 1973. Seasonal changes in the drift and benthic macroinvertebrates in the
unchannelized Missouri River in South Dakota.
National Research Council. 2011. Missouri River planning: recognizing and incorporating
sediment management. The National Academies Press, Washington DC.
Nilsson C, Reidy CA, Dynesius M, Revenga C. 2005. Fragmentation and flow regulation of the
world's large river systems. Science 30 : 405. DOI: 10.1126/science.1107887.
Ning NS, Nielsen DL, Paul WL, Hillman TJ, Suter PJ. 2010. Microinvertebrate dynamics in
riverine slackwater and mid‐channel habitats in relation to physico‐chemical parameters
and food availability. River Research and Applications 26 : 279-296.
O’Neill BJ, Thorp JH. 2011. Flow refugia for the zoobenthos of a sand-bed river: the role of
physical-habitat complexity. Journal of the North American Benthological Society 30 :
546-558. DOI: 10.1899/10-083.1.
Phelps QE, Tripp SJ, Hintz WD, Garvey JE, Herzog DP, Ostendorf DE, Ridings JW, Crites JW,
Hrabik RA. 2010. Water temperature and river stage influence mortality and abundance

26
of naturally occurring Mississippi River scaphirhynchus sturgeon. North American
Journal of Fisheries Management 30 : 767-775. DOI: 10.1577/M09-176.1.
Poulton BC, Wildhaber ML, Charbonneau CS, Fairchild JF, Mueller BG, Schmitt CJ. 2003. A
longitudinal assessment of the aquatic macroinvertebrate community in the channelized
lower Missouri River 85 : 23-53.
Schiemer F, Keckeis H, Reckendorfer W, Winkler G. 2001. The ‘inshore retention concept’ and
its significance for large rivers. Archiv für Hydrobiologie 135 : 509-516. DOI: 0945-
3784/01/0135-0509.
Schiemer F, Keckeis H, Kamler E. 2002. The early life history stages of riverine fish:
ecophysiological and environmental bottlenecks. Comparative Biochemistry and
Physiology Part A: Molecular & Integrative Physiology 133 : 439-449.
Sechler DR, Phelps QE, Tripp SJ, Garvey JE. 2012. Habitat for age-0 shovelnose sturgeon and
pallid sturgeon in a large river: interactions among abiotic factors, food, and energy
intake. North American Journal of Fisheries Management 32 : 24-31. DOI:
10.1080/02755947.2012.655848.
Sechler DR, Phelps QE, Tripp SJ, Garvey JE,Herzog DP, Ostendorf DE, Ridings JW, Crites JW,
and Hrabik RA. 2013. Effects of river stage height and water temperature on diet
composition of year-0 sturgeon (Scaphirhynchus spp.): a multi-year study. Journal of
Applied Ichthyology 29: 44-50. DOI: 10.1111/jai.12047.
Snyder, DE. 2002. Pallid and shovelnose sturgeon larvae-morphological description and
identification. Journal of Applied Ichthyology, 18 : 240-265.
Spindler BD, Chipps SR., Klumb RA, Graeb BD, Wimberly MC. 2012. Habitat and prey
availability attributes associated with juvenile and early adult pallid sturgeon occurrence
in the Missouri River, USA.Endangered Species Research 16 : 225-234. DOI:
10.3354/esr00408.

27
Starks, TA, Long JM, Dzialowski AR. 2015. Community structure of age-0 fishes in paired
mainstem and created shallow-water habitats in the lower Missouri River. River Research
and Applications. DOI:10.
Steffensen K, Huenemann T, Winders K, Ridenour C, Wilson R, Stukel S, Shuman D, Haddix T,
Welker T. 2014. Pallid sturgeon Scaphirhynchus albus: is there evidence of recruitment
in the Missouri River? Pallid Sturgeon Population Assessment Team Report, Lincoln,
Nebraska.
Terry C. 1976. Stomach analysis methodology: still lots of questions. Proceedings of the 1st
Pacific Northwest Technical Workshop p. 3-15.
U.S. Army Corps of Engineers. 2003a. Final supplemental environmental impact statement for
the Missouri river fish and wildlife mitigation project. Kansas City and Omaha Districts.
U.S. Army Corps of Engineers. 2003b. Supplemental biological assessment for the current water
control plan. Northwest Division, Portland, Oregon.
U.S. Army Corps of Engineers. 2006. Missouri River mainstem system master water control
manual. U. S. Army Corps of Engineers, Northwest Division, Omaha, Nebraska.
U.S. Army Corps of Engineers. 2009. Missouri River recovery program fact sheet. Missouri
River Recovery Program.
U.S. Army Corps of Engineers, U.S. Fish and Wildlife Service. 2012. Adaptive management
strategy for creation of shallow water habitat.
http://moriverrecovery.usace.army.mil/mrrp/MRRP_PUB_DEV.download_documentatio
n?p_file=8030
U.S. Army Corps of Engineers. 2014. Missouri River recovery program shallow water habitat
accounting summary report. Kansas City and Omaha District.
U.S. Fish and Wildlife Service. 2000. Biological opinion of the operation of the Missouri River
main stem reservoir system, operation and maintenance of the Missouri River bank
stabilization and navigation project and operation of the Kansas River reservoir system.

28
Vannote RL, Minshall GW, Cummins KW, Sedell JR, Cushing CE. 1980. The river continuum
concept. Canadian Journal of Fisheries and Aquatic Sciences 37 : 130-7.
Ward JV, Stanford JA. 1983. The serial discontinuity concept of lotic ecosystems. Dynamics of
lotic ecosystems 10 : 29-42.
Welker TL, Drobish MR, editors. 2010. Missouri River standard operating procedures for fish
sampling and data collection. U.S. Army Corps of Engineers, Omaha District 1.5.
Wildhaber ML, DeLonay AJ, Papoulias DM, Galat DL, Jacobson RB, Simpkins DG, Braaten PJ,
Korschgen CE, Mac MJ. 2007. A conceptual life-history model for pallid and shovelnose
sturgeon. U.S. Geological Survey Circular 1315: Reston, Virginia.

29
TABLE 1. A description of each sample site including the length, cumulative
amount of shallow-water habitat, approximate location of USGS water gauge
location used to gather data, average water temperature by water year, and annual
discharge for 2014 and 2015. (* incomplete data).
Reach 1 Reach 2 Reach 3 Reach 4 Reach 5
Distance from mouth
(river kilometer) 494 – 526
346 –
381 253 – 290 151 – 177 53 - 87
Amount of shallow-
water habitat
(hectares)
47 191 137 58 295
Approximate stream
gauge location
Kansas City,
MO
Glasgow,
MO
Jefferson
City, MO
Hermann,
MO
Saint Charles,
MO
2014 Annual water
temperature (Celsius) 15.62 14.24 13.94 15.95 22.91*
2015 Annual water
temperature (Celsius) 13.34 16.67 14.49 14.61 15.61
2014 Annual
discharge
(cubic meters/second)
1378 1561 1631 1770 1879
2015 Annual
discharge
(cubic meters/second)
1872 2275 2401 2877 3194

30
TABLE 2. Goal set for the number of individuals to be sampled within five
reaches on the lower Missouri River.
Length Category Number of Individuals Reaches
0 – 20 mm 20 All (1-5)
21 – 40 mm 20 All (1-5)
41 – 60 mm 20 All (1-5)
61 – 80 mm 20 All (1-5)
81 – 100 mm 20 All (1-5)
101 – 120 mm 20 All (1-5)
Total 120 600

31
TABLE 3. Metrics for all prey types in the gut of 506 young-of-year shovelnose
sturgeon from sample year 2014 and 569 young-of-year shovelnose sturgeon from
sample year 2015 sampled in the lower Missouri River.
Metric Diptera
Larvae
Diptera
Pupae Ehemeroptera Trichoptera Cyclopoida
Sample year 2014 2015 2014 2015 2014 2015 2014 2015 2014 2015
Frequency of occurrence
(%) 88 93 46 49 29 19 4 1 0 <1
Median number per gut 37 166 0 0 0 0 0 0 0 0
25% Quartile 3 7 0 0 0 0 0 0 0 0
75% Quartile 174 540 4 7 1 0 0 0 0 0
Minimum number per gut 0 0 0 0 0 0 0 0 0 1
Maximum number per
gut 1345 2363 475 756 16 21 11 3 0 1
32
TABLE 4. Number of empty guts from 2014 (n=506) and 2015 (n=569) by
location and length.
Year Metric Reach 1 Reach 2 Reach 3 Reach 4 Reach 5
2014
Length
(mm) 19, 20, 20
17,17,19,19
,22
15,15,17,17
,18,18,19 -
15,17,17,18
,18,20
Total 3 5 7 0 6
2015
Length
(mm) 18, 18, 20 18,19 17 - 19, 21
Total 3 2 1 0 2
33
TABLE 5. Number of certain prey type by reach and the percent of the total diet
for 2014.
Prey Type Reach 1 Reach 2 Reach 3 Reach 4 Reach 5 Total
Percent of
Diet
Ephemeroptera 154 42 31 53 81 361 0.45%
Diptera larvae 9765 11114 23534 19667 11614 75694 93.55%
Diptera pupae 215 1167 1313 1868 253 4816 5.95%
Trichoptera 16 0 1 3 18 38 0.05%
Cyclopoida 0 0 0 0 0 0 0.00%
Total 10150 12323 24879 21591 11966 80909

34
TABLE 6. Number of certain prey type by reach and the percent of the total diet
for 2015.
Prey Type Reach 1 Reach 2 Reach 3 Reach 4 Reach 5 Total Percent of
Diet
Ephemeroptera 118 29 46 15 23 231 0.12%
Diptera Larvae 51627 47803 50567 27207 10889 188093 95.31%
Diptera Pupae 566 2288 1016 4743 401 9014 4.57%
Trichoptera 0 3 2 1 0 6 < 0.01%
Cyclopoida 0 0 1 0 0 0 < 0.01%
Total 52311 50123 51631 31966 11313 197344

35
FIGURE 1. Map of the lower Missouri River including sample reach and
approximate stream gauge location (red dot).

36
FIGURE 2. 2014 percent fullness in relation to the distance from mouth (rkm),
amount of shallow-water habitat (ha), and residual percent fullness as it relates to
amount of shallow-water habitat (ha). Each row is a different length category
decreasing from top to bottom (0-20, 21-40, 41-60, 61-80, 81-100, 101-120mm).

37
FIGURE 3. 2015 percent fullness in relation to the distance from mouth (rkm),
amount of shallow-water habitat (ha), and residual percent fullness as it relates to
amount of shallow-water habitat (ha). Each row is a different length category
decreasing from top to bottom (0-20, 21-40, 41-60, 61-80, 81-100, 101-120mm).

38
FIGURE 4. 2014 number eaten of three main macroinvertebrate prey types in relation
to the amount of shallow-water habitat (ha). Letters A-F are length categories (0-20,
21-40, 41-60, 61-80, 81-100, 101-120mm)

39
FIGURE 5. 2015 number eaten of three main macroinvertebrate prey types in relation
to the amount of shallow-water habitat (ha). Letters A-F are length categories (0-20,
21-40, 41-60, 61-80, 81-100, 101-120mm)

40
FIGURE 6. 2014 number eaten of three main macroinvertebrate prey types in
relation to the distance from mouth (rkm). Letters A-F are length categories (0-20,
21-40, 41-60, 61-80, 81-100, 101-120mm)

41
FIGURE 7. 2015 number eaten of three main macroinvertebrate prey types in relation
to the distance from mouth (rkm). Letters A-F are length categories (0-20, 21-40, 41-
60, 61-80, 81-100, 101-120mm)

42
FIGURE 8. 2014 residual number eaten of three main macroinvertebrate prey types in
relation to the amount of shallow-water habitat (ha). Letters A-F are length categories
(0-20, 21-40, 41-60, 61-80, 81-100, 101-120mm)

43
FIGURE 9. 2015 residual number eaten of three main macroinvertebrate prey types
in relation to the amount of shallow-water habitat (ha). Letters A-F are length
categories (0-20, 21-40, 41-60, 61-80, 81-100, 101-120mm).

44
FIGURE 10. Exponential models of diptera larvae eaten by young-of-year
shovelnose sturgeon as a function of length and age in five locations of the lower
Missouri River in 2014. Numbers 1-5 are sample reach locations moving
downstream to the mouth.

45
FIGURE 11. Exponential models of diptera larvae eaten by young-of-year
shovelnose sturgeon as a function of length and age in five locations of the lower
Missouri River in 2015. Numbers 1-5 are sample reach locations moving
downstream to the mouth.

46
FIGURE 12. The slope values or rate of increase of diptera larvae eaten with ± 95%
confidence intervals for both length and daily age of young-of-year shovelnose
sturgeon from 2014 captured at 5 sample sites along the lower Missouri River

47
FIGURE 13. The slope values or rate of increase of diptera larvae eaten with ± 95%
confidence intervals for both length and daily age of young-of-year shovelnose
sturgeon from 2015 captured at 5 sample sites along the lower Missouri River

48
CHAPTER III
EFFECT OF HABITAT QUANTITY ON YOUNG-OF-YEAR SHOVELNOSE STURGEON
CONDITION ALONG A LONGITUDINAL GRADIENT
Introduction
As early as 1832, there had been interest in channel modifications on the Missouri River
for transportation of goods; mainly the removal of obstacles to ease passage of steamboats, finally
made possible by the 1912 Bank Stabilization and Navigation Project. Further modified by the
Rivers and Harbors Act of 1945, these acts congressionally authorized the U.S. Army Corps of
Engineers (USACE) to maintain a navigation channel for commercial transport (USFWS, 2000).
These anthropogenic influences have led to a loss of habitat diversity on the Missouri River
(USFWS, 2000; USFWS, 2003), shifting from a meandering, shallow, turbid river into a
channelized, deep, more clear waterway.
Channelization of the Missouri River has altered an estimated 1.2 M ha of natural river
habitat, eliminated the reproduction of native cottonwood trees Populus deltoids in some areas,
and reduced aquatic insect abundance by seventy percent (USACE, 2009). Furthermore, many
native fish species have declined (NRC, 2011) and, in response, the U.S. Fish and Wildlife

49
Service issued a Biological Opinion (BiOp) on the USACE operation of the Missouri River to
prevent jeopardy of threatened and endangered species. The Missouri River Recovery Program
(MRRP) was created to implement the reasonable and prudent alternatives of the BiOp to restore
the Missouri River to a semblance of its original dynamic riverscape and physical processes.
Restoration activities are conducted in an adaptive management framework and include
improving floodplain connectivity, constructing chutes or side channels, implementing a natural
flow regime, and creating sandbar habitat (USFWS, 2000; USFWS, 2003).
One critical restoration goal of the MRRP is the reestablishment of shallow-water habitat
(SWH). Shallow-water habitat is created by the modification of existing river control structures
and construction of off-channel chutes. In a regulatory context, SWH is defined as water less
than 1.5 m deep and a flow velocity less than 0.6 m/s (USACE, 2015b). Examples of SWH
include backwaters, depositional sandbars detached from the bank, and low-lying depositional
areas adjacent to shorelines (USFWS, 2003). Shallow-water habitat is critical for young and
small-bodied fishes by providing low velocity nursery zones for growth and development
(Schiemer et al., 2001). Shallow water may encourage increased forage opportunities for fishes
by retaining higher rates of organic matter, phytoplankton, and zooplankton (Knowleton and
Jones, 2000; Brown and Coon, 1994). Shallow water habitat also provides a refuge in the
channelized areas of the river for growth and development of drifting larval fishes (Schiemer et
al., 2001), particularly Scaphirhynchus sturgeon (pallid sturgeon S. albus and shovelnose
sturgeon S.platorynchus).
There is a hypothesized link between the creation of SWH and its influence on YOY
sturgeon survival during the transition from the yolk sac to exogenous feeding during the first
year of life (USFWS, 2000; USFWS 2003;Wildhaber et al., 2007). Fish survival or well-being is
quantified by indices of condition that attempt to perceive growth rates, energy storage,
reproductive potential, and overall fitness (Adams, 1999). On the lower Missouri River, prey
quantity did not appear to be limited and factors beyond amounts of SWH appear to affecting

50
prey use and ultimately survivorship by YOY shovelnose sturgeon (Chapter 2). Quantifying
condition can also provide insight into characterizing the aquatic habitat, including prey
availability, and whether the ecological and physiological processes are ideal for survival at the
population scale (Pope and Kruse, 2007; Adams, 1999).
Condition is often measured mathematically with weight-length relationships (Anderson
and Neumann,1996), but a more direct measure of physiological parameters, such as energy
stores, yields a more accurate representation(Copeland et al., 2008), especially for juvenile and
YOY fish species (Patrick, 1992). Energy density of fish can be measured directly using a
calorimeter (Sechler et al., 2012), but this method is expensive and tedious. Analysis of whole-
lipid content is an alternative to energy density and is relatively inexpensive. Lipids represent the
long-term storage of energy that fish need for basic metabolic needs as well as the vital energy
needed to sustain during periods of low food intake (Adams, 1999). The quantity of lipids
extracted allow for an indication of health to be quantified for many individuals, which can help
evaluate population dynamics (Henderson and Tocher, 1987; Adams 1999).
With the restoration goal of creating SWH, there is an inherent hypothesis that an
increase in SWH will increase production and retention of food sources leading to improved
condition and survival of YOY shovelnose sturgeon. The objective of this study is to examine
the influence SWH on the condition of YOY shovelnose sturgeon at a large spatial scale along a
linear gradient of the lower Missouri River.
Methods
Study site. - The geographic extent of the SWH restoration includes the main-stem lower
Missouri River and main-stem connected side channel chutes from Ponca, Nebraska to the
confluence with the Mississippi River in Saint Louis, Missouri (USACE, 2015; Figure 1). The
lower Missouri River is channelized by dikes and revetments constricting the thalweg and

51
directing flow toward the middle of the river (Jacobson and Galat, 2006). Five reaches of the
lower Missouri River between Kansas City and Saint Louis (Figure 1) that varied in amount of
cumulative SWH (47 to 295 ha) were sampled bi-monthly from May through October in 2014
and 2015 when river conditions permitted.
Sampling Design. - Sampling was conducted by the U.S. Army Corps of Engineers (reach
1 and 2) and the U.S. Fish and Wildlife Service (reach 3, 4, and 5; Figure 1) using a bow-
mounted or stern-mounted otter trawls (OTO4) in accordance with the Missouri River Standard
Operating Procedures for Fish Sampling and Data Collection (Welker and Drobish, 2012). The
OTO4 is a 4 mm mesh nylon net with a 4.88 m opening that is pulled with the river current along
the riverbed and spread open by two, 91.4 cm by 38.1cm boards (a.k.a. doors). The OTO4 was
used to catch YOY shovelnose sturgeon in benthic habitats between 1.5 and 5 m deep with a
trawling distance from 75 to 300 m and between 1 and 1.5 m deep with a trawling distance from
15 to 150 meters. When three or more YOY shovelnose sturgeon were captured in a single trawl,
an additional two trawls were conducted in the same location. If ten or more YOY shovelnose
sturgeon were captured in either additional trawl, one duplicate trawl was conducted for a
maximum of five trawls in the same location. Repeated sampling of habitats was necessary to
achieve the desired sample size in each length category.
Captured YOY sturgeon were measured for fork length (FL) or total length (TL),
depending on presence of the heterocercal tail filament. Young-of-year shovelnose sturgeon were
kept at -18ºC and preserved in ethanol to minimize oxidative decomposition and slow
deterioration. After each sampling season was complete, up to 20 YOY shovelnose sturgeon
were randomly selected from each of the six separate length categories (0-20, 21-40, 41-60, 61-
80, 81-100, 101-120 mm) for lipid content analysis (Table 1).
Condition quantification. - A broad measure of condition was obtained by performing a
modified Folch lipid extraction that measures energy reserves within the tissue (Folch et al.,
1957). The Folch et al.(1957) extraction utilizes a 2:1 ratio of organic solvents (chloroform and

52
methanol) to remove virtually all lipids from the specimen and is the preferred methodology for
fish tissue (Cabrini et al., 1992; Iverson et al., 2001). The modification included the substitution
of ethanol for methanol (J. Truschenski, University of Southern Illinois, personal
communication), which was verified using pure vegetable oil (i.e., 100 percent lipid) with an
average of 97.3 ± 1.7 percent recovery (n=16) of lipid material determined gravimetrically. After
weighing, the specimen’s body was kept in the original storage vial of ethanol to ensure all lipid
content was retained. Individual specimens within each length category (Table 1) were
homogenized separately and a 2:1 ratio of chloroform and ethanol was confirmed by adding
chloroform to the original ethanol and then vortexed. The sample was placed into the freezer (-
20ºC) for one hour and removed before adding 0.88g of 0.88% potassium chloride (KCl) aqueous
wash to aide in phase separation. The sample was placed back in the freezer for five minutes then
centrifuged at 1500 RPM for five minutes. The bottom layer of the partitioned mixture that
contained the purified lipid was transferred through a sodium sulfate filter (to remove
contaminating material) into an aluminum weigh pan and placed on a hot plate at medium heat
until evaporation of the solvent was complete. Lipid content as a percentage of body weight was
then determined gravimetrically (Folch et al., 1957).
To allow comparison to the YOY shovelnose sturgeon condition captured in the wild, I
worked with biologists at the U.S. Geological Survey, Columbia Environmental Research Center
(CERC) to raise two groups of YOY shovelnose sturgeon that were representative of healthy and
starved groups (Table 1). Two hundred and forty hatchery-reared individuals were raised to
similar size length categories as wild fish and fed ad libitum a diet of live Artemia sp. and
Lumbriculus sp., frozen foods including Artemia sp. and Chironomus sp., and prepared rations of
Otohime Fish Diet. One-half of the individuals were separated into a healthy ‘control’ group that
were not isolated from food prior to collection and preservation. The other half were isolated
from food until they became moribund or deceased, representing the ‘emaciated’ group.
Hatchery specimens were obtained out under an animal care and use protocol developed and

53
approved by CERC as part of other related sturgeon research. These two groups provided
opposing levels of condition to compare with the YOY shovelnose sturgeon captured in the wild.
Statistical methods. - Linear regression was used to identify differences in lipid
percentage from each length category in 2014 and 2015 in relation to the amount of SWH (ha)
and distance from mouth (RKM). To separate the influence of location from SWH quantity, the
residuals of the percent lipid for the RKM models were extracted and plotted against the amount
of SWH (ha). Box plots of percent lipids for each sturgeon length category were used to compare
years of wild-caught fish, control, and emaciated YOY. Two-way analysis of variance (ANOVA)
and the arcsine square root transformation of YOY shovelnose sturgeon lipid percentage was
used to determine statistical differences among length categories and group (sample year of wild-
caught fish and the opposing condition levels of hatchery-reared fish). A Tukey’s post-hoc test
was used to determine the factors influencing the significant results in each treatment group. All
statistical procedures were analyzed using SigmaPlot 12 statistical software.
Results
A total of 493 YOY sturgeon in 2014 and 537 YOY sturgeon in 2015 were used for lipid
analysis, but not all length categories were represented by the goal of 20 individuals in each reach
(Table 2). Genetic analysis confirmed that all YOY sturgeon used for this analysis were
shovelnose sturgeon (E. Heist, Southern Illinois University, unpublished data). Of the six length
categories, the ≤ 40mm YOY shovelnose sturgeon had the highest percent lipid (Figure 5). The
control group consistently had a higher median percent lipid regardless of length (Figure 5).
There was a statistically significant interaction between effects of length category and group
(sample year of wild-caught fish, and hatchery-reared control or emaciated) on the lipid
percentage of YOY shovelnose sturgeon (F = 4.6, P = 0.01). Tukey’s post-hoc analysis

54
indicated, for wild fish, YOY shovelnose sturgeon captured in 2014 had significantly lower
average percent lipid than 2015 for all length categories >41mm (P ≤ 0.04). In 2014, the length
categories >41mm were not statistically different from the emaciated specimens (P > 0.05). In
2015, only the 101-120mm length category significantly differed in lipid percentage from the
control specimens (P = 0.01).
Models of lipid percentage as a function of SWH had low explanatory power (r2 ≤ 0.07)
for each length category in 2014, but were comparatively higher in 2015 (r2 ≤ 29; Figure 2). In
2014, the smallest length category (0-21mm) showed a positive relationship with lipid percentage
and amount of SWH while the large length categories (61-100mm) had a negative relationship
with amount of SWH. In 2015, the one statistically significant model had a negative relationship
exhibiting a decrease in condition as the amount of SWH increased (P = 0.01, r2 = 29). The
percent of individuals below the maximum starvation condition (shaded gradient) from each
length category steadily increased in 2014 as the YOY shovelnose sturgeon length category
increased (Table 4). In 2015, the percent of individuals below the maximum starvation condition
stayed rather constant in the smaller three length categories and actually decreased as length
categories increased (right column). The percent of individuals above the maximum control
condition was higher in 2015 than in 2014 (left column).
The spatial variable of RKM had more statistically significant models in 2014 and 2015
than the SWH variable (Figure 3). In 2014, all but the smallest length category (0-21mm)
exhibited an increase in percent lipid with increasing distance upstream (r2 ≤ 0.27). In 2015, the
61-80mm and 81-100mm length categories decreased in condition with increasing distance
upstream, however, the relationships were comparatively weak (r2 = 0.08).
The residual percent lipid in relation to amount of SWH exhibited few instances of
significance (Figure 4). In 2014, the 41-60mm length category showed a significant and positive
relationship in the residual percent lipid with SWH. Similar to the percent lipid analysis related
to SWH, the smallest length category for both 2014 and 2015 had an increase in percent lipid as

55
SWH increased (P ≤ 0.03, r2 ≤ 0.08). In addition, the 2015 statistically significant models had a
negative relationship exhibiting a decrease in condition as the amount of SWH increased.
Discussion
The ability to quantify condition of YOY shovelnose sturgeon has provided the means to
extend the period to which we can infer the health of year classes and the population as a whole.
From this measurement of body condition, where lipids represent long-term energy storage, YOY
shovelnose sturgeon in 2014 were similar to those starved of food. This is the most surprising
result of the study due to the fact YOY shovelnose sturgeon that had consumed prey and were
captured in the wild were in similar condition to the emaciated specimens raised in the laboratory.
Based upon prey use alone, an adequate amount of prey was consumed in both sample years and
in all sample reaches (Chapter 2). However, prey use doubled in 2015 which translated to
condition levels above starvation levels, closer to well-fed control individuals. These results
provide reference to how much prey improves condition in the wild and suggest interannual
differences in hydrology (e.g., stage, discharge, water temperature) might affect condition.
Percent lipid decreased with increasing size, attributed to the transition from endogenous
yolk-sac feeding to exogenous feeding (Gershanovich, 1991; Schiemer et al., 2002), suggesting
that lipid percentage of larger-sized YOY shovelnose sturgeon are more indicative of habitat
suitability. Furthermore, differences of 1-3 percent lipid content in these larger YOY shovelnose
sturgeon, which appear minor, may be significant. The early life stages of large river fishes are
most sensitive to environmental stressors (Schiemer et al., 2001) that could preclude YOY
shovelnose sturgeon from finding, consuming and digesting prey. Habitats that promote foraging
success and provide shelter are all important for maximizing allocation of energy from prey
sources to lipid storage (i.e. better survival) (Adams, 1999). Shallow-water habitat was a poor
variable affecting lipid concentration and often showed a negative trend, suggesting it has little

56
influence on sturgeon body condition. Factors other than strict amounts of SWH appear to affect
the percent lipid of YOY shovelnose sturgeon on the lower Missouri River, but which of the
potentially other myriad of variables that may be important would require additional research.
Shallow-water habitat is measured for regulatory purposes at a medium August flow
(USACE, 2014) and was fixed at that cumulative amount for analyses. In reality, the amount of
SWH fluctuates over time; by annual releases from reservoirs through dams as well as rainfall
and snowmelt through tributaries that change temperature and discharge in the river seasonally.
The lower Missouri River historically had more SWH overall (USFWS, 2000; USFWS, 20003);
however, under currently modified river conditions, SWH is believed to be maximized during
extremely low flows (Jacobson and Galat, 2006). Abiotic influences on aquatic habitats such as
water velocity as well as temperature (Deslauries et al., 2016; Heironimus, 2014) can dictate
YOY shovelnose sturgeon condition. In 2015, the relationships between prey use and body
condition with SWH were more evident; suggesting that SWH was more important when it was
less abundant. Anthropogenic influences, such as channelization on the lower Missouri River,
have altered the temperature regime, benthic habitats, and water velocity in which sturgeon
species have had to adapt to survive (USFWS, 2003; Bergman et al.. 2008). However, SWH by
its current definition does not appear to affect body condition to a large degree, but variables
related to location along the river continuum appear to be important. Research from reaches
farther upstream in the lower Missouri River would help better understand the role that location
might play in the early life stages of river sturgeon.
57
References
Adams SM. 1999. Ecological role of lipids in the health and success of fish populations. Lipids in
Fresh Water Ecosystems.New York: Springer.
Anderson RO, Neumann RM. 1996. Length, weight, and associated structural indices. Fisheries
techniques 2nd edition. American Fisheries Society, Bethesda, Maryland 5 : 447-482.
Bergman HL, Boelter AM, Parady K, Fleming C, Keevin T, Latka DC, Korschgen C, Galat DL,
Hill T, Jordan G, Krentz S, Nelson-Statsny W, Olson M, Mestl GE, Rouse K, Berkley J.
2008. Research needs and management strategies for pallid sturgeon recovery.
Proceedings of a workshop held July 31 to August 2, 2007, Saint Louis, Missouri.
Braaten PJ, Fuller DB, McClenning ND. 2007. Diet composition of larval and young-of-year
shovelnose sturgeon in the upper Missouri River. Journal of Applied Ichthyology 23 :
517-521. DOI: 10.1111/j.1439-0426.2006.00822.x.
Braaten PJ, Fuller DB, Holte LD, Lott RD, Viste W. Brandt TF, Legare RG. 2008. Drift
dynamics of larval pallid sturgeon and shovelnose sturgeon in a natural side channel of
the upper Missouri River, Montana. North American Journal of Fisheries Management
28 : 808-826. DOI: 10.1577/M06-285.1.
Brown DJ, Coon TG. 1994. Abundance and assemblage structure of fish larvae in the lower
Missouri River and its tributaries. Transactions of the American Fisheries Society 123 :
718-732. DOI: 10.1577/1548-8659(1994)123<0718:AAASOF>2.3.CO;2.
Cabrini L, Landi L, Stefanelli C, Barzanti V, Maria SA. 1992. Extraction of lipids and lipophilic
antioxidants from fish tissues: A comparison among different methods. Comparative
Biochemistry and Physiology: Comparative Biochemistry 101 : 383-386.
Colombo RE, Garvey JE, Jackson ND, Brooks R, Herzog DP, Hrabik RA, Spier TW. 2007.
Harvest of Mississippi River sturgeon drives abundance and reproductive success: a
harbinger of collapse?. Journal of Applied Ichthyology 23 : 444-451. DOI:
10.1111/j.1439-0426.2007.00899.x.

58
Copeland T , Murphy BR, Ney JJ. 2008. A comparison of relative weight and nutritional status
among four fish species in two impoundments. Journal of Freshwater Ecology 23 : 373-
385. DOI: 10.1080/02705060.2008.9664214.
Deslauriers D, Heironimus LB, Chipps SR. 2016. Test of foraging-bioenergetics model to
evaluate growth dynamics of endangered pallid sturgeon (Scaphirhynchus albus).
Ecological Modeling 336 : 1-12.
Folch J, Lees M, Sloane-Stanley GH. 1957. A simple method for the isolation and purification of
total lipids from animal tissues. Journal of Biological Chemistry 226 : 497-509.
French BW, Graeb BD, Chipps SR, Bertrand KN, Selch TM, Klumb RA. 2010. Vulnerability of
age-0 pallid sturgeon Scaphirhynchus albus to fish predation. Journal of Applied
Ichthyology 26 : 6-10.
Gershanovich AD. 1991. Lipid mobilization during early development of sturgeons. Acipenser:
actes du premier colloque international sur lesturgeon, Bordeaux.
Heironimus LB. 2014. The development and application of a larval pallid sturgeon
Scaphirhynchus albus bioenergetics model. Doctoral dissertation, South Dakota State
University.
Henderson RJ, Tocher DR. 1987. The lipid composition and biochemistry of freshwater fish.
Progress in Lipid Research 26 : 281 - 347.
Iverson SJ, Lang SL, Cooper MH.2001. Comparison of the Bligh and Dyer and Folch methods
for total lipid determination in a broad range of marine tissue. Lipids 36 :1283-1287.
Kittel EC, Small BC. 2014. Effect of altering dietary protein: energy ratios on juvenile pallid
sturgeon growth performance. North American Journal of Aquaculture 76 :28-35.
Knowlton MF, Jones JR. 2000. Seston, light, nutrients and chlorophyll in the Lower Missouri
River, 1994 - 1998. Journal of Freshwater Ecology 15 : 283-297. DOI:
10.1080/02705060.2000.9663747.

59
National Research Council. 1992. Restoration of aquatic ecosystems: science, technology, and
public policy. National Academy Press, Washington, DC.
Pope KL, Kruse CG. 2007. Condition. Analysis and interpretation of freshwater fisheries data.
American Fisheries Society 423-471.
Schiemer F, Keckeis H, Reckendorfer W, Winkler G. 2001. The ‘inshore retention concept’ and
its significance for large rivers. Archiv für Hydrobiologie 135 : 509-516. DOI: 0945-
3784/01/0135-0509.
Schiemer F, Keckeis H, Kamier E. 2002. The early life history stages of riverine fish:
ecophysiological and environmental bottlenecks. Comparative Biochemistry and
Physiology 133 : 439-449.
U.S. Army Corps of Engineers. 2003a. Final supplemental environmental impact statement for
the Missouri River fish and wildlife mitigation project. Kansas City and Omaha Districts.
U.S. Army Corps of Engineers. 2003b. Supplemental biological assessment for the current water
control plan. Northwest Division, Portland, Oregon.
U.S. Army Corps of Engineers. 2006. Missouri River mainstem system master water control
manual. U. S. Army Corps of Engineers, Northwest Division, Omaha, Nebraska.
U.S. Army Corps of Engineers. 2009. Missouri River recovery program fact sheet. Missouri
River Recovery Program.
U.S. Army Corps of Engineers, U.S. Fish and Wildlife Service. 2012. Adaptive management
strategy for creation of shallow water habitat.
http://moriverrecovery.usace.army.mil/mrrp/MRRP_PUB_DEV.download_documentatio
n?p_file=8030
U.S. Army Corps of Engineers. 2014. Missouri River recovery program shallow water habitat
accounting summary report. Kansas City and Omaha District.

60
U.S. Fish and Wildlife Service. 2000. Biological opinion of the operation of the Missouri River
main stem reservoir system, operation and maintenance of the Missouri River bank
stabilization and navigation project and operation of the Kansas River reservoir system.
Wildhaber ML, DeLonay AJ, Papoulias DM, Galat DL, Jacobson RB, Simpkins DG, Braaten PJ,
Korschgen CE, Mac MJ. 2007. A conceptual life-history model for pallid and shovelnose
sturgeon. U.S. Geological Survey Circular 1315: Reston, Virginia.
Witten P, Hall B. 2015. Teleost skeletal plasticity: modulation, adaptation, and remodeling.
Copeia 103 : 727-739.

61
TABLE 1. Goal set for the number of individuals to be sampled within five
reaches on the lower Missouri River and for specimens received from USGS
Columbia Environmental Research Center (Emaciated (E) and Control (C)).
Length Category Number of Individuals Reaches Standard
Groups
0 – 20 mm 20 All (1-5) E + C
21 – 40 mm 20 All (1-5) E + C
41 – 60 mm 20 All (1-5) E + C
61 – 80 mm 20 All (1-5) E + C
81 – 100 mm 20 All (1-5) E + C
101 – 120 mm 20 All (1-5) E + C
Total 120 600 240

62
TABLE 2. A description of each sample site including the length, cumulative
amount of shallow-water habitat, approximate location of USGS water gauge
location used to gather data, average water temperature by water year, and
annual discharge for 2014 and 2015. (* incomplete data available).
Reach 1 Reach 2 Reach 3 Reach 4 Reach 5
Distance from mouth
(river kilometer) 494 – 526 346 – 381 253 – 290 151 – 177 53 - 87
Amount of shallow-water
habitat (hectares) 47 191 137 58 295
Approximate water gauge
location
Kansas City,
MO
Glasgow,
MO
Jefferson City,
MO
Hermann,
MO
Saint Charles,
MO
2014 Annual water
temperature (Celsius) 15.62 14.24 13.94 15.95 22.91*
2015 Annual water
temperature (Celsius) 13.34 16.67 14.49 14.61 15.61
2014 Annual discharge
(cubic meters/second) 1378 1561 1631 1770 1879
2015 Annual discharge
(cubic meters/second) 1872 2275 2401 2877 3194

63
TABLE 3. Values are means and standard errors for percent lipid of each length
category from each treatment group. Means in a row without a common
superscript letter differ (P < 0.05) as analyzed by two-way ANOVA and the
TUKEY post-hoc test.
Length Category Control 2014 2015 Emaciated
1 12.9 ± 0.8a 13.3 ± 0.3a 11.8 ± 0.3a 6.7 ± 0.8b
2 5.4 ± 0.8a 4.9 ± 0.3a 4.6 ± 0.4a 2.1 ± 0.9b
3 3.3 ± 0.8a 1.5 ± 0.4b 2.2 ± 0.4ac 1.6 ± 0.9bc
4 2.5 ± 0.8ab 1.6 ± 0.4a 2.3 ± 0.3b 1.4 ± 0.8ab
5 3.2 ± 0.8a 1.5 ± 0.4b 2.1 ± 0.4a 1.3 ± 0.8ab
6 3.8 ± 0.8a 1.1 ± 0.5b 2.3 ± 0.4c 1.2 ± 0.9bc

64
TABLE 4. Percent of each length category that falls above the minimum control percent
lipid and under the maximum emaciated percent lipid by year.
Length Category
1 2 3 4 5 6
Control
2014 76.3 57.0 6.5 27.5 18.8 2.1
2015 76.5 65.2 18.6 51.0 39.9 21.1
Emaciated
2014 42.3 43.4 69.9 60.0 53.6 80.9
2015 44.9 34.8 44.2 20.4 14.1 11.3

65
FIGURE 1. Map of the lower Missouri River including sample reach and
approximate stream gauge location (red dot).

66
FIGURE 2. Influence of the amount of SWH (ha) on the percent lipid on six
length categories increasing in length from the top to bottom (0-20, 21-40, 41-60,
61-80, 81-100, 101-120) in 2014 and 2015. Emaciated average lipid percentage is
depicted by the dashed line and the gradient in color increases in darkness as you
move from the maximum to the minimum percent lipid of emaciated YOY
shovelnose sturgeon.

67
FIGURE 3. Influence of distance from mouth (rkm) on the percent lipid on six
length categories increasing in length from the top to bottom (0-20, 21-40, 41-60,
61-80, 81-100, 101-120) in 2014 and 2015. Emaciated average lipid percentage is
depicted by the dashed line and the gradient in color increases in darkness as you
move from the maximum to the minimum percent lipid of emaciated YOY
shovelnose sturgeon.

68
FIGURE 4. Influence of the amount of SWH (ha) on the residual percent lipid of
six length categories increasing in length from the top to bottom (0-20, 21-40, 41-
60, 61-80, 81-100, 101-120) in 2014 and 2015.

69
Box plots of percent lipid by length category. The letter or number above each
box designates the group Control (C), 2014 (14), 2015 (15), Emaciated (E).

VITA
Anthony P. Civiello
Candidate for the Degree of
Master of Science
Thesis: EFFECT OF SHALLOW-WATER HABITAT QUANTITY ON YOUNG-OF-
YEAR SHOVELNOSE STURGEON PREY USE AND CONDITION ALONG
A LONGITUDINAL GRADIENT
Major Field: Natural Resource Ecology and Management
Biographical:
Education:
Completed the requirements for the Master of Science in Natural Resource
Ecology and Management at Oklahoma State University, Stillwater, Oklahoma
in December, 2016.
Completed the requirements for the Bachelor of Science in Wildlife
Conservation and Management at Missouri State University, Springfield,
Missouri, December 2013.
Experience:
Biological Sciences Intern, U.S. Army Corps of Engineers (2012-present)
Fish Hatchery Volunteer, Missouri Department of Conservation (2011-2012)
Trail Crew Member, Missouri Department of Natural Resources (2010-2011)
Professional Memberships:
American Fisheries Society
Related Documents