1 EFFECT OF REYNOLDS NUMBER ON SEPARATION BUBBLES ON CONTROLLED-DIFFUSION COMPRESSOR BLADES IN CASCADE Garth V. Hobson * Denis J. Hansen ** , David G. Schnorenberg ** and Darren V. Grove ** Department of Aeronautics and Astronautics Turbopropulsion Laboratory Naval Postgraduate School Monterey, California * Associate Professor ** Graduate Student ABSTRACT A detailed experimental investigation of second- generation, controlled-diffusion, compressor stator blades at an off-design inlet-flow angle was performed in a low-speed cascade wind tunnel primarily using laser- Doppler velocimetry (LDV). The object of the study was to characterize the off-design flowfield and to obtain LDV measurements of the suction surface boundary layer separation which occurred near mid chord. The effect of Reynolds number on the flow separation in the regime of 210,000 to 640,000 was investigated. Surface flow visualization showed that at the low Re. no. the mid- chord separation bubble started laminar and reattached turbulent within 20% chord on the suction side of the blade. The extent of the bubble compared very well with the measured blade surface pressure distribution which showed a classical plateau and then diffusion in the turbulent region. LDV measurements of the flow reversal in the bubble were performed. At the intermediate Re. no. the boundary layer was transitional before the bubble which had decreased significantly in size (down to 10% chord). At the highest Re. no. the flow was turbulent from close to the leading edge, and three-dimensional flow reversal as a result of endwall effects appeared at approximately 80% chord which did not reattach. NOMENCLATURE C chord length [mm] Cp coefficient of pressure, p–p ∞ / 1 2 ρW ref 2 d normal distance from the blade [mm] H shape factor p pressure S blade pitch, or spacing [mm] x axial direction (also the vertical direction in the cascade) [mm] u’ axial velocity turbulent fluctuation U axial velocity v’ tangential velocity turbulent fluctuation V tangential velocity W total velocity, U 2 +V 2 y tangential direction (also the horizontal direction) [mm] β flow angle (measured from the axial) [degrees] δ displacement thickness θ momentum thickness η normal to the chordwise direction [mm] ρ density ξ chordwise direction [mm]

Welcome message from author
This document is posted to help you gain knowledge. Please leave a comment to let me know what you think about it! Share it to your friends and learn new things together.
Transcript
1
EFFECT OF REYNOLDS NUMBER ON SEPARATION BUBBLES ONCONTROLLED-DIFFUSION COMPRESSOR BLADES IN CASCADE
Garth V. Hobson*
Denis J. Hansen **, David G. Schnorenberg** and Darren V. Grove**
Department of Aeronautics and AstronauticsTurbopropulsion LaboratoryNaval Postgraduate School
Monterey, California
* Associate Professor** Graduate Student
ABSTRACT
A detailed experimental investigation of second-generation, controlled-diffusion, compressor statorblades at an off-design inlet-flow angle was performed ina low-speed cascade wind tunnel primarily using laser-Doppler velocimetry (LDV). The object of the study wasto characterize the off-design flowfield and to obtain LDVmeasurements of the suction surface boundary layerseparation which occurred near mid chord. The effect ofReynolds number on the flow separation in the regime of210,000 to 640,000 was investigated. Surface flowvisualization showed that at the low Re. no. the mid-chord separation bubble started laminar and reattachedturbulent within 20% chord on the suction side of theblade. The extent of the bubble compared very well withthe measured blade surface pressure distribution whichshowed a classical plateau and then diffusion in theturbulent region. LDV measurements of the flow reversalin the bubble were performed. At the intermediate Re.no. the boundary layer was transitional before the bubblewhich had decreased significantly in size (down to 10%chord). At the highest Re. no. the flow was turbulentfrom close to the leading edge, and three-dimensionalflow reversal as a result of endwall effects appeared atapproximately 80% chord which did not reattach.
NOMENCLATURE
C chord length [mm]
Cp coefficient of pressure, p – p ∞ / 12
ρWref2
d normal distance from the blade [mm]H shape factorp pressureS blade pitch, or spacing [mm]x axial direction (also the vertical direction
in the cascade) [mm]u’ axial velocity turbulent fluctuationU axial velocityv’ tangential velocity turbulent fluctuationV tangential velocity
W total velocity, U2 +V 2
y tangential direction (also the horizontaldirection) [mm]
β flow angle (measured from the axial)[degrees]
δ displacement thicknessθ momentum thicknessη normal to the chordwise direction [mm]ρ densityξ chordwise direction [mm]

Report Documentation Page Form ApprovedOMB No. 0704-0188
Public reporting burden for the collection of information is estimated to average 1 hour per response, including the time for reviewing instructions, searching existing data sources, gathering andmaintaining the data needed, and completing and reviewing the collection of information. Send comments regarding this burden estimate or any other aspect of this collection of information,including suggestions for reducing this burden, to Washington Headquarters Services, Directorate for Information Operations and Reports, 1215 Jefferson Davis Highway, Suite 1204, ArlingtonVA 22202-4302. Respondents should be aware that notwithstanding any other provision of law, no person shall be subject to a penalty for failing to comply with a collection of information if itdoes not display a currently valid OMB control number.
1. REPORT DATE FEB 2001
2. REPORT TYPE N/A
3. DATES COVERED -
4. TITLE AND SUBTITLE Effect of Reynolds Number on Separation Bubbles onControlled-Diffusion Compressor Blades in Cascade
5a. CONTRACT NUMBER
5b. GRANT NUMBER
5c. PROGRAM ELEMENT NUMBER
6. AUTHOR(S) Garth V. /Hobson; Denis J. /Hansen; David G. /Schnorenberg; Darren V./Grove
5d. PROJECT NUMBER
5e. TASK NUMBER
5f. WORK UNIT NUMBER
7. PERFORMING ORGANIZATION NAME(S) AND ADDRESS(ES) Naval Post Graduate School 1 University Circle Monterey, CA 93943
8. PERFORMING ORGANIZATIONREPORT NUMBER
9. SPONSORING/MONITORING AGENCY NAME(S) AND ADDRESS(ES) 10. SPONSOR/MONITOR’S ACRONYM(S)
11. SPONSOR/MONITOR’S REPORT NUMBER(S)
12. DISTRIBUTION/AVAILABILITY STATEMENT Approved for public release, distribution unlimited
13. SUPPLEMENTARY NOTES
14. ABSTRACT
15. SUBJECT TERMS
16. SECURITY CLASSIFICATION OF: 17. LIMITATION OF ABSTRACT
UU
18. NUMBEROF PAGES
12
19a. NAME OFRESPONSIBLE PERSON
a. REPORT unclassified
b. ABSTRACT unclassified
c. THIS PAGE unclassified
Standard Form 298 (Rev. 8-98) Prescribed by ANSI Std Z39-18
2
ω mass-averaged total pressure losscoefficient
subscripts
ref upstream reference conditions0 stagnation conditions1 upstream, or lower, traverse slot2 downstream, or upper, traverse slot
INTRODUCTION
"At high flight altitudes and low flight speeds, theReynolds number of the flow through the inlet stages ofa compressor becomes so low that their performance isoften impaired." (Johnsen and Bullock, 1965) Thepresent study used a set of second-generationcontrolled-diffusion (CD) stator blades in cascade tostudy the effect of Reynolds number which would beexperienced with such flight condition changes. Theblades were designed as stator 67B and tested as stage67B by Gelder et. al. (1989). The design-point Reynoldsnumber, based on chord, for stator 67B was almost onemillion at sea level, and this was estimated to decrease to200,000 at 15,000 m. Three Reynolds numbers (namely640,000, 380,000 and 210,000) were tested with tenstator 67B blades in cascade in the Naval PostgraduateSchool, Low-Speed Cascade Wind Tunnel.Many earlier cascade wind tunnel tests have beenconducted to study the effect of Reynolds number onblade element performance, most notably those byRhoden (1956), Horlock et. al. (1964), Schlichting andDas (1970), Evans (1971) and Roberts (1975). The lastthree works were also concerned with the effects of free-stream turbulence, which is also important to bladeperformance. All these two-dimensional cascade testsindicated a deterioration in performance when theReynolds number was decreased below 100,000,however; most of the earlier tests were conducted atReynolds numbers well below 500,000 (Johnsen andBullock, 1965).
Thus the present study has three motivating points. Firstthe Reynolds number range which the cascade (andblade chord of 12.7 cm) could produce is morerepresentative of flight conditions. Second the bladeprofiles were the mid section of a modern design whichhad been rig tested (Gelder, et. al., 1989). Third thepresent study is seen as a challenging test case forturbulence and transition models used in numericalprediction of separated flows.
Sanger (1982) designed stator 67A with controlled-diffusion blade profiles to replace the original double-circular-arc profiles of Stage 67. The object of the studywas to implement a design optimization procedure inreplacing the original blades with the same blade count.
These blade profiles were extensively tested in the NPScascade wind tunnel (Elazar, 1988, Hobson andShreeve, 1993). The subsequent design and testing ofstator 67B by Gelder et. al. (1989) was to improve on theperformance of the stator 67A blade row by halving theblade count whilst still performing the same amount offlow turning. The blades of stator 67B were more highlyloaded than those of stator 67A and thus are morecambered, however the leading edge shapes of 67Bwere made elliptic (as opposed to the circular leadingedge of 67A) in an attempt to eliminate leading-edgeseparation which was prevalent on stator 67A.
EXPERIMENTAL APPARATUS ANDPROCEDURE
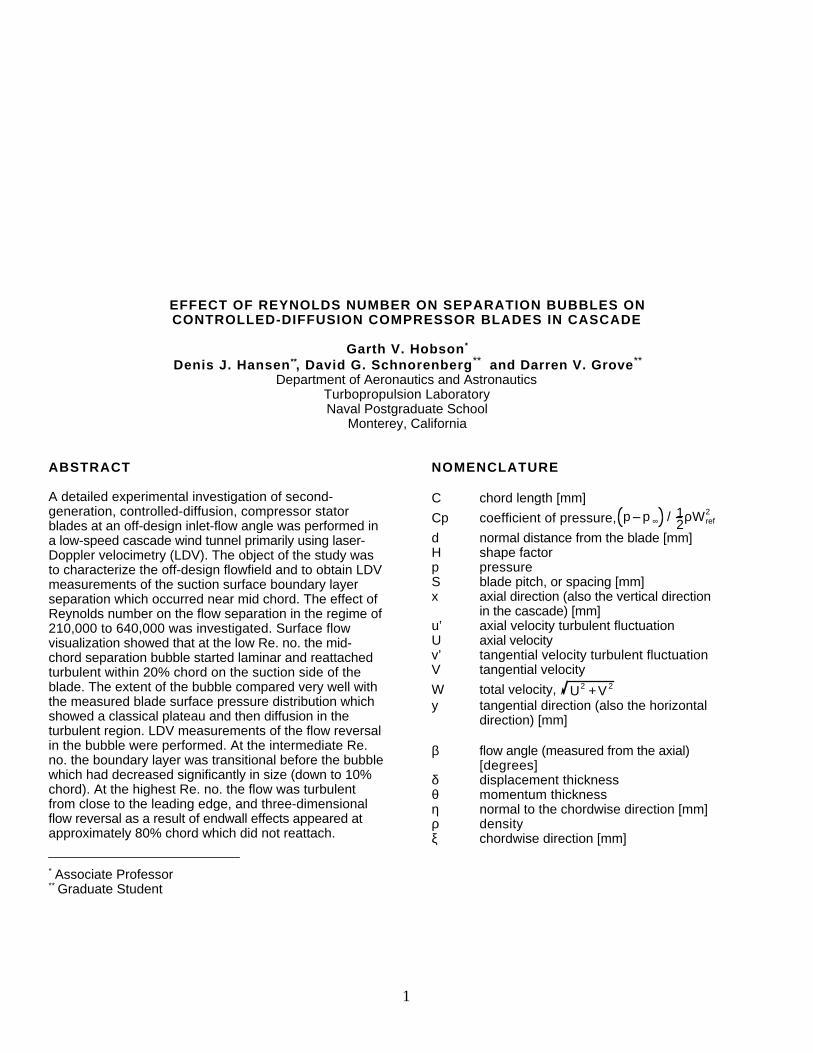
The Low-Speed Cascade Wind Tunnel of the NPSTurbopropulsion Laboratory was used throughout thisstudy. The inlet flow uniformity and periodicity had beenthoroughly documented by Elazar (1988), with 20 Stator67A blades in the cascade. A schematic of the cascade isshown in Fig. 1. Ten Stator 67B profiles were installed inthe test section.
273mm
311mm
LOWER TRAVERSE SLOT
UPPER TRAVERSE SLOT
413mm
165mm
1524mmNO. OF TEST BLADES = 10NO. OF INLET GUIDE VANES = 60
SEEDINGLOCATION
ENDWALLSTATICPORTS
ACRYLIC WINDOW
SIDEWALLS
β 2
1 2 3 4 5 6 7 8 9 1 0
β 1= 38
β 2w = 5.1 β 2w = 5.9
1w= 38β
TEST SECTION
INLET GUIDE VANES
Fig. 1 Low-speed cascade wind tunnel schematic.
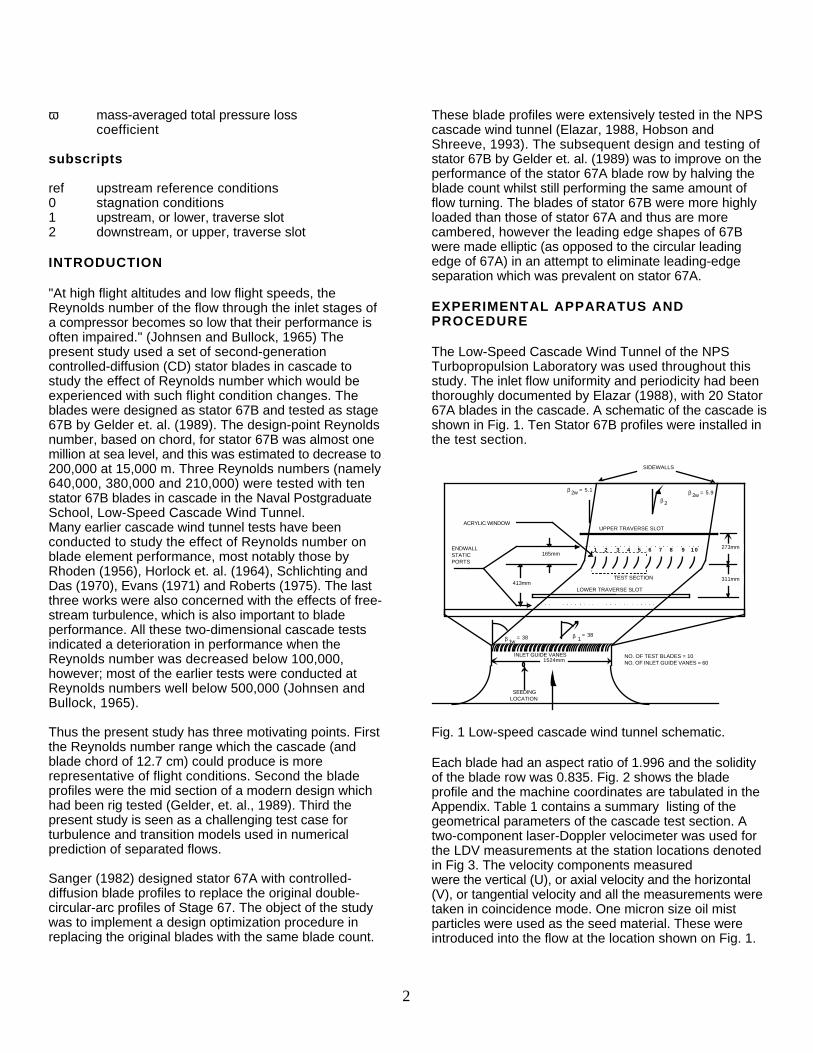
Each blade had an aspect ratio of 1.996 and the solidityof the blade row was 0.835. Fig. 2 shows the bladeprofile and the machine coordinates are tabulated in theAppendix. Table 1 contains a summary listing of thegeometrical parameters of the cascade test section. Atwo-component laser-Doppler velocimeter was used forthe LDV measurements at the station locations denotedin Fig 3. The velocity components measuredwere the vertical (U), or axial velocity and the horizontal(V), or tangential velocity and all the measurements weretaken in coincidence mode. One micron size oil mistparticles were used as the seed material. These wereintroduced into the flow at the location shown on Fig. 1.
3
0
20
40
60
0 20 40 60 80 100 120 140
ξ (mm)
η (
mm
)
Fig. 2 Blade profile.
Table 1. Test section specifications.Blade Type Stator 67B Controlled
DiffusionNumber of Blades 10
Blade Spacing 152.40 mmChord 127.14 mm
Setting Angle 16.3o +/- 0.1o
Span 254.0 mm
All measurements recorded were for 1000 data pointsand no editing was used to present the data. Suitabletilting and yawing of the LDV was performed to allowaccess as close to the blade surfaces as possible,particularly during the boundary layer surveys as shownon Fig 3. During the low Reynolds number (210,000)
55
-40
0
40
80
120
160
-80 -40 0 40 80 120 160 200 240 280
y (mm)
x (mm)
35
5bl
8
9
13
9bl 10
77bl
8bl
1
66bl
Fig. 3 Pitchwise and boundary layer (bl) survey locationswith station designations.
Loss measurements were performed with a traversingfive-hole probe at the upper traverse slot (Fig 1) for the“near design” inlet flow angle test case. Flowunsteadiness due to trailing edge separation precludedthese measurements at the increased incidence. Bladesurface pressure measurements were recorded from aninstrumented blade which had 48 pressure portsmachined into its surface. Surface flow visualization was
performed with a titanium dioxide and kerosene mixture.Both video of the developing surface flow patterns andstill photography of the end result once the mixture haddried on the blade surfaces were recorded.
Table 2 Estimated measurement uncertaintyITEM DESCRIPTION UNCERTAINTYX, Y Distance from blade
surface0.025mm
Pt Plenum pressure 25 Pap Pressure (Scanivalve) 12 PaPatm Atmospheric pressure 35 PaTt Plenum temperature 0.2oC
LDV clock counter 1 n-secκ Beam half angle 0.3o
L Focal length 7.6 mmλ Wavelength 0.1%df Fringe spacing 0.3%U, V Particle velocity 0.33% @ 10 m/s
0.65% @ 100 m/s
The estimated measurement uncertainties are given inTable 2. The uncertainties in parameters κ, L and λ weregiven by the manufacturer. The fringe spacing wascalculated as df = λ /sin κ. Since particles do not followthe flow exactly, the uncertainty in the velocity can belarger than the uncertainty in the particle velocity.
RESULTS AND DISCUSSION
Blade Surface Pressure Distributions
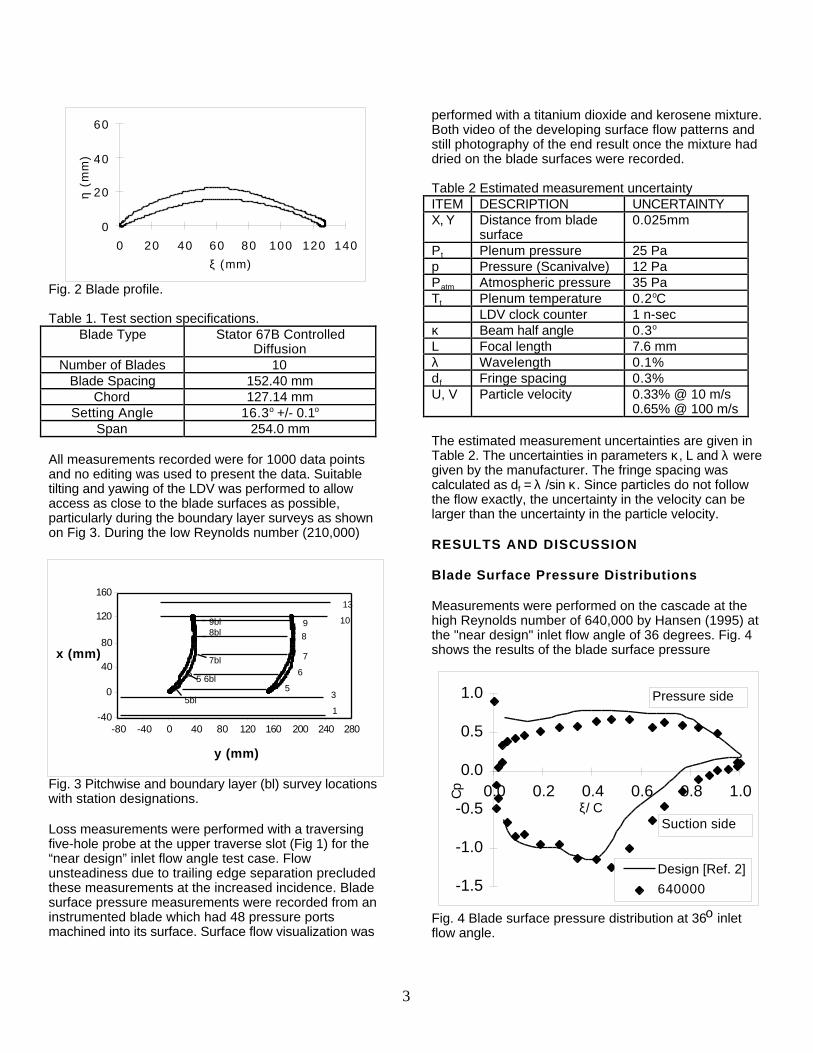
Measurements were performed on the cascade at thehigh Reynolds number of 640,000 by Hansen (1995) atthe "near design" inlet flow angle of 36 degrees. Fig. 4shows the results of the blade surface pressure
-1.5
-1.0
-0.5
0.0
0.5
1.0
0.0 0.2 0.4 0.6 0.8 1.0ξ/C
Cp
Design [Ref. 2]
640000
Suction side
Pressure side
Fig. 4 Blade surface pressure distribution at 36o inletflow angle.

4
distribution measurements in terms of the coefficient ofpressure, Cp, plotted along the blade chord at variouspositions given by the ratio ξ/C. Gelder's design intentfor stator 67B (Gelder et. al., 1989) is shown plotted withthe solid black line. Five-hole probe surveys upstreamand downstream of the blade row yielded an axial velocitydensity ratio ( AVDR= ρ 2U2 / ρ1U1 , where the overbarrepresents mass averaged quantities) of 1.03 and the
loss coefficient, ω = p02 – p 01 / p01 – p1 , was 0.030.The experimentally determined loss coefficient, of thestator blade element at 50% span, in stage 67B byGelder et. al. (1989) was reported to be 0.029.
The Cp distribution at the three Reynolds numbers areshown in Fig. 5. All these measurements wereperformed at an inlet flow angle (β) of 38 degrees(Schnorenberg, 1996). The distribution on the suctionside of the blade for the high Reynolds number rosecontinuously from the minimum pressure location at 40%chord, and thus showed no indication of flow separation.The distribution at the intermediate Reynolds number of380,000 implied a separation region between approx.50% and 65% chord. At the low Reynolds number(210,000) the distribution implied a separation regionbetween 45% and 70% chord because of the plateau inthe mid chord region of the suction surface. Theseparation region had moved forward with
-1.5
-1
-0.5
0
0.5
1
0 0.2 0.4 0.6 0.8 1
Cp
640,000380,000210,000
Fig. 5 Blade surface pressure distribution at 38o inletflow angle.
decreasing Reynolds number and the separation bubblehad also affected the minimum suction peak by reducingits magnitude. Both these observations were consistentwith earlier separation bubble studies as reported byRhoden (1965), Horlock et. al. (1964) and Roberts(1975).
Flow Visualization
Surface flow visualization was performed on blades 3 and4 in the cascade at the three Reynolds numbers. Theflow pattern at the high Reynolds number, shown in Fig.6, revealed that the flow was three dimensional in thetrailing edge region due to the formation of cornervortices in the vicinity of the cascade endwalls.
Fig. 6 Surface flow visualization at 640,000 Reynoldsnumber and 38o inlet flow angle.
In addition the flow was not symmetric about the midspandue to the different boundary layer thicknessesbetween the two end walls which resulted in differentvortex locations on the blade surface.The flow visualization at the intermediate Reynoldsnumber, shown in Fig. 7, indicated two-dimensional flowalong most of the midspan section as well as goodperiodicity between the blades. A region of transitional(or spanwise intermittent) separation was noted andmeasured at a position corresponding to 46% chord witha re-attachment point at 57% chord. By transitionalseparation is meant that where the boundary layer hadundergone transition to turbulent flow, either naturally ordue to local surface roughness, separation had not yetoccurred. This gave rise to the regions where no TiO2was present, i.e. the vertical black streaks on the blade atmidspan. In the regions along the span of the blade weretransition of the boundary layer was suppressed thenlaminar separation did occur as was noted by thespanwise intermittent separation bubbles. The actualseparation point (without the surface fluid) was closer tothe trailing edge as gravitational effects had moved thefluid in the separation bubble downward toward theleading edges. The measured separation regioncorrelated well with the Cp distribution which indicated aseparation region between approximately 50% and 65%chord.

5
Fig. 7 Surface flow visualization at 380,000 Reynoldsnumber and 38o inlet flow angle.
The flow visualization at the low Reynolds number,shown in Fig. 8, indicated two-dimensional flow alongmost of the midspan section. A region of laminarseparation was noted and measured at a positioncorresponding to 39% chord with a re-attachment pointat approximately 63% chord. A small amount of TiO2/kerosene fluid was suspended in this region. Againtaking into account the gravitational effects on thesuspended fluid, the measured separation regioncorrelated well with the Cp distribution, which indicated aseparation region between approximately 45% and 70%chord.
Fig. 8 Surface flow visualization at 210,000 Reynoldsnumber and 38o inlet flow angle.
Inlet and Wake Profiles
Inlet flow field surveys were conducted at station 1, 30%of an axial chord ahead of the blade leading edges, overtwo blade pitches. The summarized inlet flow conditionsare presented in Table 3. The total velocity was uniform
to within one percent for all the tests, and since thesurvey points were equi-spaced then the average valuestabulated can also be considered as mass-averagedvalues.
Table 3. Inlet flow conditionsRe.No.
Ave.InletFlow
Angle(deg.)
InletFlow
AngleStand.Dev.
Ave.InletTurb.(%)
InletTurb.
Stand.Dev.
640,000 37.7 1.21 1.6 0.15380,000 38.2 1.37 1.6 0.14210,000 38.3 1.48 1.9 0.27
The average inlet flow angle increased by 0.6 degreeswhen reducing the Reynolds number from the high tothe low value, as did the potential effect of the blades onthe incoming flow due to the increased pitchwise flowangle variation (or standard deviation). At the highReynolds number the inlet turbulence was almost 1.6%which was consistent with earlier measurements on thefirst set of CD blades (Elazar, 1988, and Hobson andShreeve, 1993). However for the low Reynolds numberflow case the turbulence had increased by almost 20% toabout 1.9%. The definition of turbulence being;
Turbulence= 1
2u'
2+ v'
2
Wref [1]
The wake total velocity profiles are shown in Fig. 9 foronly the highest and lowest Reynolds number flows.These were measured at station 13 which was 20% of anaxial chord downstream of the trailing edges.
0.0
0.2
0.4
0.6
0.8
1.0
-0.2 0.0 0.2 0.4 0.6 0.8 1.0 1.2 1.4 1.6y/S
W/W
ref
640000210000
Fig. 9 Wake profiles at 38o inlet flow angle for the highestand lowest Reynolds number flows.

6
First, periodicity is evident in both profiles; and secondthe significantly larger wake width and deficit for the highReynolds number case is evident. At this station theminimum velocity was only 10% of the core flow. Atpreceding stations, reverse flow was measured, whichindicated that the trailing edge had separated. Theindividual velocity components for the wake distributionsfor all three Reynolds numbers were presented inSchnorenberg (1996).
The exit flow angle distributions for the high and lowReynolds number cases were also significantly differentas shown in Fig. 10. At the high Reynolds number themass-averaged exit flow angle was 9.25o, and this valuedecreased with decreasing Reynolds number to 4.56o
0
10
20
30
40
50
60
70
80
-0.2 0.0 0.2 0.4 0.6 0.8 1.0 1.2 1.4 1.6y/S
Exit
Flo
w A
ngle
[deg
.]
640000
210000
Fig. 10 Exit flow angles distributions for the highest andlowest Reynolds number flows.
and 3.74o respectively for Reynolds numbers of 380,000and 210,000. At the 640,000 Reynolds number thepeak flow angle in the wake was in excess of 50o, and theflow angle distribution between the blades was relativelyuniform, whereas for 210,000 Reynolds number the flowangle in the core flow showed a maximum half waybetween the blades. This profile was similar to the designexit flow angle distribution measured at the highReynolds number by Hansen (1995).
The exit turbulence distributions are shown in Fig. 11,where the profile for the separated boundary layershowed the double peaked distribution. Each peakcorresponded to the maximum velocity gradient shownin Fig. 9. The resolution of the measurements for the lowReynolds number test case were not sufficient to resolvethe aforementioned double peak distribution.
0
2
4
6
8
10
12
14
16
-0.2 0.0 0.2 0.4 0.6 0.8 1.0 1.2 1.4 1.6y/S
Tur
bul
ence
(%
)
640000210000
Fig. 11 Exit turbulence distributions for the highest andlowest Reynolds number flows.
Good periodicity was evident in the turbulence profileswhen compared to the exit flow angle distributions in Fig.10. The freestream turbulence was measured to beapproximately 1.4% for all three Reynolds numbers,although the inlet turbulence was inversely proportionalto Reynolds number as shown in Table 3.
Suction Surface Boundary Layers
Total velocity and turbulence distributions are presentedin Figs. 12 and 13 at stations 5, 6, 7, 8 and 9 for the highand intermediate Reynolds numbers. At the highReynolds number reverse flow was measured at stations8 and 9 with corresponding increased turbulence levels.As noted by the flow visualization Fig. 6, the flow overthe suction surface was three dimensional and so thesetwo-component measurements need to be interpretedaccordingly.
No reverse flow was measured at the intermediateReynolds number (Fig. 13). This could be due to thespanwise variation of axial transition location on thesuction surface. When transition had occurred boundarylayer separation was suppressed as shown in Fig. 7. TheLDV measurements were taken over a region wheretransition had occurred as is evident by the increase ofturbulence in the boundary layer at stations 5, 6 and 7.The blade surface pressure measurements, whichshowed a separation bubble plateau for the intermediateReynolds number, were taken on blade no. 6 (Fig. 1) andall the LDV measurements were performed betweenblades 3 and 4. Another explanation for the reason fordiffering LDV and pressure measurements, could bedue to the spanwise variation of the separation bubble atthe transitional Reynolds number of 380,000.

7
5
67
8
9
0
0.1
0.2
0 10 20
Turbulence (%)
d/C
-0.2 0.0 0.2 0.4 0.6 0.8 1.0 1.2 1.4
W/Wref
0.0
0.1
0.2
d/C
Fig. 12 Suction-surface boundary-layer profiles at 640,000 Reynolds no.

8
0.00
0.05
0.10d/
C
5
67
8
9
0.00
0.05
0.10
0 10 20
Turbulence (%)
d/C
0.0 0.2 0.4 0.6 0.8 1.0 1.2 1.4
W/Wref
Fig. 13 Suction-surface boundary-layer profiles at 380,000 Reynolds no.

9
0.00
0.05
0.10
d/C
0.00
0.05
0.10
0 10 20
Turbulence (%)
d/C
5
67 7 .257 .57 .758
9
0.0 0.2 0.4 0.6 0.8 1.0 1.2 1.4
W/Wref
Fig 14. Suction-surface boundary-layer profiles at 210,000 Reynolds number.
10
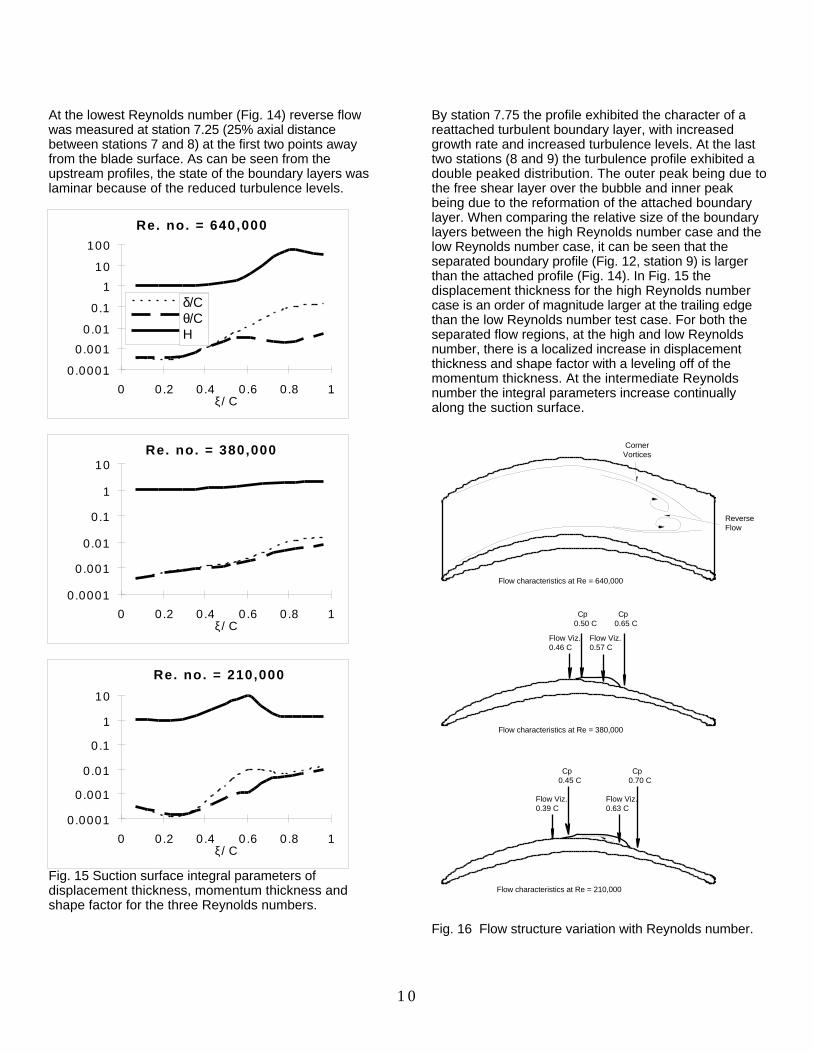
At the lowest Reynolds number (Fig. 14) reverse flowwas measured at station 7.25 (25% axial distancebetween stations 7 and 8) at the first two points awayfrom the blade surface. As can be seen from theupstream profiles, the state of the boundary layers waslaminar because of the reduced turbulence levels.
Re. no. = 640,000
0.0001
0.001
0.01
0.1
1
10
100
0 0.2 0.4 0.6 0.8 1ξ/C
d/cq/cH
δ/Cθ/CH
Re. no. = 380,000
0.0001
0.001
0.01
0.1
1
10
0 0.2 0.4 0.6 0.8 1ξ/C
Re. no. = 210,000
0.0001
0.001
0.01
0.1
1
10
0 0.2 0.4 0.6 0.8 1ξ/C
Fig. 15 Suction surface integral parameters ofdisplacement thickness, momentum thickness andshape factor for the three Reynolds numbers.
By station 7.75 the profile exhibited the character of areattached turbulent boundary layer, with increasedgrowth rate and increased turbulence levels. At the lasttwo stations (8 and 9) the turbulence profile exhibited adouble peaked distribution. The outer peak being due tothe free shear layer over the bubble and inner peakbeing due to the reformation of the attached boundarylayer. When comparing the relative size of the boundarylayers between the high Reynolds number case and thelow Reynolds number case, it can be seen that theseparated boundary profile (Fig. 12, station 9) is largerthan the attached profile (Fig. 14). In Fig. 15 thedisplacement thickness for the high Reynolds numbercase is an order of magnitude larger at the trailing edgethan the low Reynolds number test case. For both theseparated flow regions, at the high and low Reynoldsnumber, there is a localized increase in displacementthickness and shape factor with a leveling off of themomentum thickness. At the intermediate Reynoldsnumber the integral parameters increase continuallyalong the suction surface.
Flow Viz.0.39 C
Flow Viz.0.63 C
Cp0.45 C
Cp0.70 C
Flow characteristics at Re = 210,000
Flow Viz.0.46 C
Cp0.50 C
Cp0.65 C
Flow Viz.0.57 C
Flow characteristics at Re = 380,000
Flow characteristics at Re = 640,000
CornerVortices
ReverseFlow
Fig. 16 Flow structure variation with Reynolds number.

11
Summary
In summary, Fig. 16 shows the approximate flowstructure for the three Reynolds numbers. Theexperimentally determined separation and reattachmentlocations for the low and intermediate Reynolds numbercases are indicated. The region of flow reversaldetermined from flow visualization and LDV measuredseparation for the high Reynolds number case are alsoshown with the vortex structure on the blade surface.The three measurement techniques (flow visualization,surface pressure measurements and LDV) all agreereasonably well, giving confidence in the proposed flowstructure. Although the coarseness of the location of theLDV surveys precludes determining the separation pointexactly, reverse flow measurements were obtained at thelocation between separation and reattachment for thelow Reynolds number test case.
CONCLUSIONS
Detailed laser-Doppler anemometry measurements ofthe flow over the suction surface of a set of second-generation controlled-diffusion compressor stator bladesshowed that as the Reynolds number was decreasedfrom the design value of approximately 640,000 to210,000 a laminar separation bubble, which reattachedturbulent, formed at mid chord. The flow also becamemore two dimensional as the effect of the corner vorticeswere diminished as the Reynolds number wasdecreased. At the high Reynolds number the trailingedge experienced turbulent flow reversal as a result ofthe interaction of the corner vortices. At the intermediateReynolds number of 380,000 separation occurred onthe suction surface when the approaching boundarylayer remained laminar, however; when the boundaryhad undergone transition to turbulent flow thenseparation was suppressed which gave rise to aspanwise variation of the separation bubble.
Additional pressure measurements and surface flowvisualization confirmed the results obtainedquantitatively with the LDV. These data should form achallenging test case for viscous flow calculations,particularly for the calibration of turbulence models andtheir ability to predict the effect of Reynolds number onthe state of a boundary layer.
ACKNOWLEDGEMENTS
This work was sponsored by the Naval Air Warfare Center(Patuxent River), as part of a Fan and Compressor StallProject. Mr. Stoney McAdams was technical monitor forthe project, and his support is greatly appreciated.
REFERENCES
Elazar, Y.,1988, "A Mapping of the Viscous FlowBehavior in a Controlled-Diffusion Compressor CascadeUsing Laser Doppler Velocimetry and PreliminaryEvaluation of Codes for the Prediction of Stall,” Ph. D.Dissertation, Naval Postgraduate School.
Evans, B. J., 1971, "Effects of Free-StreamTurbulence on Blade Performance in a CompressorCascade," Cambridge Univ., Engineering Dept.,Turbo/TR 26.
Gelder, T. F., Schmidt, J. F., Suder, K. L. andHathaway M. D., 1989, "Design and Performance ofControlled-Diffusion Stator Compared with OriginalDouble-Circular-Arc Stator," NASA TP 2852.
Grove, D. V., 1971, “Experimental and NumericalInvestigation of Second-Generation, Controlled-Diffusion, Compressor Blades in Cascade,” Master ofScience in Aeronautical Engineering, NavalPostgraduate School.
Hansen, D. J., 1995, “Investigation of Second-Generation Controlled-Diffusion Compressor Blades inCascade,” Master of Science in AeronauticalEngineering, Naval Postgraduate School.
Hobson, G. V., and Shreeve, R. P., 1993, "InletTurbulence Distortion and Viscous Flow Development ina Controlled-Diffusion Compressor Cascade at Very HighIncidence," AIAA Journal of Propulsion and Power , Vol.9, No. 3, pp 397-404.
Horlock, J. H., Shaw, R., Pollard, D., andLewkowicz, A., 1964, "Reynolds Number Effects inCascades and Axial Flow Compressors," ASME Trans.,Series A, Journal of Engineering for Power.
Johnsen, I. A., and Bullock, R. O., 1965,(Editors) "Aerodynamic Design of Axial-FlowCompressors," NASA SP-36.
Roberts, W. B., 1975, "The Effect of ReynoldsNumber and Laminar Separation on Axial CascadePerformance," Journal of Engineering for Power, Vol 97,Series A, No. 2, pp 261-274.
Rhoden, H. G., 1956, "Effect of ReynoldsNumber on the Flow of Air through a Cascade ofCompressor Blades," ARC, R & M 2919.
Sanger, N. L., 1982, "The Use of OptimizationTechniques to Design Controlled-Diffusion CompressorBlading," NASA T. M. 82763, also ASME 82-GT-149.
Schlichting, H., and Das, A., 1970, "On theInfluence of Turbulence Level on the AerodynamicLosses of Axial Turbomachines," from Flow Research onBlading, ed. L. S. Dzung, Elsevier Publ. Co.
Schnorenberg, D. G., 1996, “Investigation of theEffect of Reynolds Number on Laminar SeparationBubbles on Controlled-Diffusion Compressor Blades inCascade,” Master of Science in AeronauticalEngineering, Naval Postgraduate School.

12
Appendix :- Blade coordinates in mm (Fig. 2)
ξ η ξ η ξ η ξ η ξ η ξ η-0.02 0.74 42.22 20.63 114.06 8.20 126.77 0.60 98.46 10.69 27.66 9.83-0.01 0.82 43.53 20.90 114.88 7.89 126.69 0.53 97.21 11.03 26.44 9.46-0.01 0.90 44.84 21.16 115.69 7.58 126.60 0.45 95.97 11.37 25.21 9.090.01 0.97 46.14 21.40 116.51 7.27 126.48 0.38 94.72 11.69 24.01 8.710.03 1.05 47.48 21.62 117.32 6.97 126.38 0.32 93.48 12.00 22.80 8.340.06 1.13 48.81 21.82 118.14 6.66 126.30 0.28 92.23 12.30 21.59 7.950.09 1.20 50.14 22.00 118.95 6.36 126.22 0.25 90.97 12.58 20.38 7.560.13 1.28 51.48 22.16 119.57 6.13 126.15 0.22 89.72 12.86 19.18 7.160.17 1.35 52.81 22.29 120.18 5.90 125.99 0.17 88.46 13.11 17.97 6.760.22 1.43 54.14 22.40 120.80 5.68 125.77 0.12 87.20 13.36 16.97 6.420.28 1.51 55.49 22.49 121.41 5.45 125.31 0.08 85.95 13.60 15.98 6.080.35 1.58 56.84 22.55 122.03 5.22 125.08 0.09 84.69 13.83 14.98 5.730.42 1.66 58.18 22.59 122.64 4.98 124.93 0.11 83.44 14.05 13.98 5.370.75 1.98 59.53 22.60 123.04 4.82 124.70 0.14 82.18 14.26 12.99 5.021.07 2.29 60.88 22.59 123.45 4.65 124.55 0.18 80.92 14.46 11.99 4.651.40 2.60 62.22 22.56 123.85 4.49 124.39 0.22 79.66 14.65 11.21 4.361.72 2.89 63.57 22.50 124.25 4.32 124.24 0.27 78.41 14.83 10.42 4.072.04 3.19 64.91 22.42 124.65 4.14 124.09 0.32 77.15 15.00 9.64 3.772.37 3.47 66.25 22.31 125.05 3.96 124.01 0.35 75.90 15.15 8.86 3.472.90 3.91 67.59 22.18 125.23 3.88 123.94 0.38 74.64 15.28 8.07 3.163.42 4.34 68.93 22.03 125.38 3.80 123.86 0.41 73.39 15.41 7.29 2.833.95 4.76 70.27 21.85 125.52 3.73 123.78 0.45 72.14 15.51 6.71 2.594.47 5.16 71.58 21.65 125.65 3.65 123.71 0.48 70.88 15.60 6.12 2.335.00 5.55 72.88 21.42 125.77 3.58 123.63 0.52 69.63 15.67 5.54 2.075.53 5.93 74.19 21.17 125.88 3.50 123.56 0.56 68.38 15.73 4.96 1.816.28 6.46 75.50 20.90 125.98 3.42 123.48 0.60 67.13 15.77 4.37 1.547.03 6.97 76.81 20.61 126.08 3.35 123.39 0.66 65.88 15.80 3.79 1.277.78 7.46 78.12 20.29 126.17 3.27 123.03 0.90 64.64 15.81 3.41 1.098.53 7.93 79.39 19.97 126.26 3.20 122.66 1.13 63.39 15.81 3.02 0.919.28 8.39 80.67 19.64 126.34 3.12 122.30 1.35 62.14 15.79 2.64 0.72
10.03 8.83 81.94 19.29 126.41 3.04 121.94 1.57 60.90 15.77 2.26 0.5411.01 9.39 83.21 18.93 126.48 2.97 121.58 1.78 59.66 15.73 1.87 0.3511.99 9.92 84.49 18.56 126.55 2.89 121.21 1.99 58.42 15.69 1.49 0.1712.97 10.42 85.76 18.18 126.61 2.81 120.64 2.30 57.18 15.63 1.42 0.1313.95 10.91 87.01 17.80 126.67 2.74 120.07 2.59 55.94 15.55 1.34 0.1014.93 11.39 88.26 17.41 126.72 2.66 119.51 2.88 54.70 15.46 1.27 0.0715.91 11.84 89.50 17.01 126.77 2.59 118.94 3.16 53.47 15.35 1.19 0.0517.12 12.40 90.75 16.61 126.82 2.51 118.37 3.43 52.24 15.23 1.12 0.0318.34 12.93 92.00 16.19 126.86 2.43 117.80 3.70 51.00 15.09 1.04 0.0119.55 13.45 93.25 15.77 126.90 2.36 117.02 4.07 49.77 14.93 0.96 0.0020.77 13.96 94.48 15.34 126.94 2.28 116.24 4.43 48.53 14.75 0.89 0.0021.98 14.44 95.70 14.90 126.97 2.20 115.45 4.78 47.30 14.56 0.81 -0.0123.20 14.92 96.93 14.46 127.00 2.13 114.67 5.12 46.07 14.35 0.73 0.0024.44 15.38 98.16 14.01 127.03 2.05 113.89 5.46 44.83 14.12 0.66 0.0025.68 15.83 99.38 13.56 127.05 1.98 113.11 5.79 43.60 13.88 0.58 0.0226.93 16.27 100.61 13.11 127.07 1.90 112.11 6.20 42.37 13.62 0.51 0.0428.17 16.70 101.84 12.67 127.09 1.82 111.11 6.60 41.14 13.36 0.43 0.0729.41 17.11 103.06 12.23 127.11 1.67 110.10 6.99 39.90 13.08 0.35 0.1030.66 17.51 104.28 11.79 127.12 1.48 109.10 7.36 38.68 12.79 0.29 0.1331.93 17.91 105.51 11.35 127.11 1.29 108.10 7.72 37.45 12.50 0.20 0.2133.21 18.29 106.73 10.91 127.08 1.14 107.09 8.06 36.23 12.19 0.13 0.2934.48 18.67 107.96 10.47 127.05 1.06 105.86 8.48 35.00 11.88 0.08 0.3635.76 19.03 108.97 10.10 127.00 0.99 104.63 8.87 33.78 11.56 0.04 0.4437.03 19.37 109.99 9.72 126.99 0.91 103.40 9.25 32.55 11.23 0.01 0.5238.31 19.70 111.01 9.35 126.95 0.83 102.17 9.62 31.33 10.89 -0.01 0.5939.61 20.03 112.03 8.97 126.90 0.76 100.94 9.99 30.11 10.54 -0.01 0.6740.92 20.34 113.04 8.59 126.84 0.68 99.70 10.34 28.88 10.19 -0.02 0.74
Related Documents