Original article Effect of resistance exercise on bone mineral density in premenopausal women Jasvinder A. Singh a, * , Katherine H. Schmitz b , Moira A. Petit c a Minneapolis VA Medical Center, Rheumatology (111 R), One Veterans Drive, Minneapolis, 55417 MN, USA b Division of Epidemiology, University of Pennsylvania School of Medicine, USA c School of Kinesiology, University of Minnesota, Minneapolis, MN, USA Accepted 17 July 2008 Available online 13 February 2009 Abstract Objective: To assess the effect of 9 months of strength training on total body and regional bone mineral density (BMD, g/cm 2 ) in 58 premenopausal women aged 30e50 years. Methods: Participants were randomized to either twice weekly supervised strength training for 15 weeks followed by 24 weeks of unsupervised training (treatment group) or control group. Height, weight, maximal muscular strength, nutrient intake and physical activity were assessed. Total body dual energy X-ray absorptiometry (DXA, Lunar Prodigy) scans were taken and analyzed for body composition (lean and fat mass), and BMD for total body and its sub-regions (spine, hip, arms and legs). All measurements were performed at baseline, 15 and 39 weeks. Analysis of covariance was used to assess group differences in BMD change adjusted for baseline BMD, weight, energy and calcium intake. Results: At baseline, the two groups had similar BMD and body size characteristics ( P < 0.05 for all), except that the treatment group had lower body weight (7.1 kg), and higher energy (þ259 kJ/d) and calcium (þ232 mg/d) intake at baseline. Adjusted % change in BMD over 15 weeks (0.5% vs. 0.4%) or 39 weeks (0.9% vs. 1.2%) did not differ significantly between the exercise and control groups, respectively. The exercise group increased BMD at the spine and legs (1e2.2%), while there was no change in the controls, but differences between groups were not significant. Conclusion: Strength training over 9 months did not lead to significantly greater change in total body or regional BMD in premenopausal women. Ó 2008 Published by Elsevier Masson SAS on behalf of the Socie ´te ´ Franc ¸aise de Rhumatologie. Keywords: Premenopausal women; Bone mineral density; Strength training; Randomized controlled trial 1. Introduction Peak bone mass in women is attained between late adolescence and the third decade [1e4], and thought to be a predictor of osteoporosis risk in postmenopausal years [5]. Besides genetic and hormonal factors, modifiable factors including calcium intake and physical activity make a signifi- cant contribution to peak bone mass and are determinants of risk for osteoporosis [6e10]. Cross-sectional studies in premenopausal women consistently showed higher bone mineral density (BMD, g/cm 2 ) in women who perform weight- bearing or strength-training exercise compared to normally active controls [11e13]. Results of randomized controlled trials of strength training in premenopausal women (Table 1) are conflicting [14e25]. Studies show increased BMD or reduced bone loss [17,20,21,24], no effect [14e16,18,19,23,25] or, in one case, increased bone loss [22] with strength training. Despite these conflicting results, strength training is often promoted for increasing BMD in premenopausal women [6]. We performed a randomized * Corresponding author. Tel.: þ1 612 467 4195; fax: þ1 612 725 2267. E-mail address: [email protected] (J.A. Singh). 1297-319X/$ - see front matter Ó 2008 Published by Elsevier Masson SAS on behalf of the Socie ´te ´ Franc ¸aise de Rhumatologie. doi:10.1016/j.jbspin.2008.07.016 Available online at www.sciencedirect.com Joint Bone Spine 76 (2009) 273e280

Welcome message from author
This document is posted to help you gain knowledge. Please leave a comment to let me know what you think about it! Share it to your friends and learn new things together.
Transcript
Available online at
www.sciencedirect.com
Joint Bone Spine 76 (2009) 273e280
Original article
Effect of resistance exercise on bone mineral density inpremenopausal women
Jasvinder A. Singh a,*, Katherine H. Schmitz b, Moira A. Petit c
a Minneapolis VA Medical Center, Rheumatology (111 R), One Veterans Drive, Minneapolis, 55417 MN, USAb Division of Epidemiology, University of Pennsylvania School of Medicine, USA
c School of Kinesiology, University of Minnesota, Minneapolis, MN, USA
Accepted 17 July 2008
Available online 13 February 2009
Abstract
Objective: To assess the effect of 9 months of strength training on total body and regional bone mineral density (BMD, g/cm2) in 58premenopausal women aged 30e50 years.Methods: Participants were randomized to either twice weekly supervised strength training for 15 weeks followed by 24 weeks of unsupervisedtraining (treatment group) or control group. Height, weight, maximal muscular strength, nutrient intake and physical activity were assessed.Total body dual energy X-ray absorptiometry (DXA, Lunar Prodigy) scans were taken and analyzed for body composition (lean and fat mass),and BMD for total body and its sub-regions (spine, hip, arms and legs). All measurements were performed at baseline, 15 and 39 weeks.Analysis of covariance was used to assess group differences in BMD change adjusted for baseline BMD, weight, energy and calcium intake.Results: At baseline, the two groups had similar BMD and body size characteristics ( P< 0.05 for all), except that the treatment group had lowerbody weight (�7.1 kg), and higher energy (þ259 kJ/d) and calcium (þ232 mg/d) intake at baseline. Adjusted % change in BMD over 15 weeks(0.5% vs. 0.4%) or 39 weeks (0.9% vs. 1.2%) did not differ significantly between the exercise and control groups, respectively. The exercisegroup increased BMD at the spine and legs (1e2.2%), while there was no change in the controls, but differences between groups were notsignificant.Conclusion: Strength training over 9 months did not lead to significantly greater change in total body or regional BMD in premenopausalwomen.� 2008 Published by Elsevier Masson SAS on behalf of the Societe Francaise de Rhumatologie.
Keywords: Premenopausal women; Bone mineral density; Strength training; Randomized controlled trial
1. Introduction
Peak bone mass in women is attained between lateadolescence and the third decade [1e4], and thought to bea predictor of osteoporosis risk in postmenopausal years [5].Besides genetic and hormonal factors, modifiable factorsincluding calcium intake and physical activity make a signifi-cant contribution to peak bone mass and are determinants of
* Corresponding author. Tel.: þ1 612 467 4195; fax: þ1 612 725 2267.
E-mail address: [email protected] (J.A. Singh).
1297-319X/$ - see front matter � 2008 Published by Elsevier Masson SAS on beh
doi:10.1016/j.jbspin.2008.07.016
risk for osteoporosis [6e10]. Cross-sectional studies inpremenopausal women consistently showed higher bonemineral density (BMD, g/cm2) in women who perform weight-bearing or strength-training exercise compared to normallyactive controls [11e13]. Results of randomized controlledtrials of strength training in premenopausal women (Table 1)are conflicting [14e25]. Studies show increased BMD orreduced bone loss [17,20,21,24], no effect[14e16,18,19,23,25] or, in one case, increased bone loss [22]with strength training. Despite these conflicting results,strength training is often promoted for increasing BMD inpremenopausal women [6]. We performed a randomized
alf of the Societe Francaise de Rhumatologie.
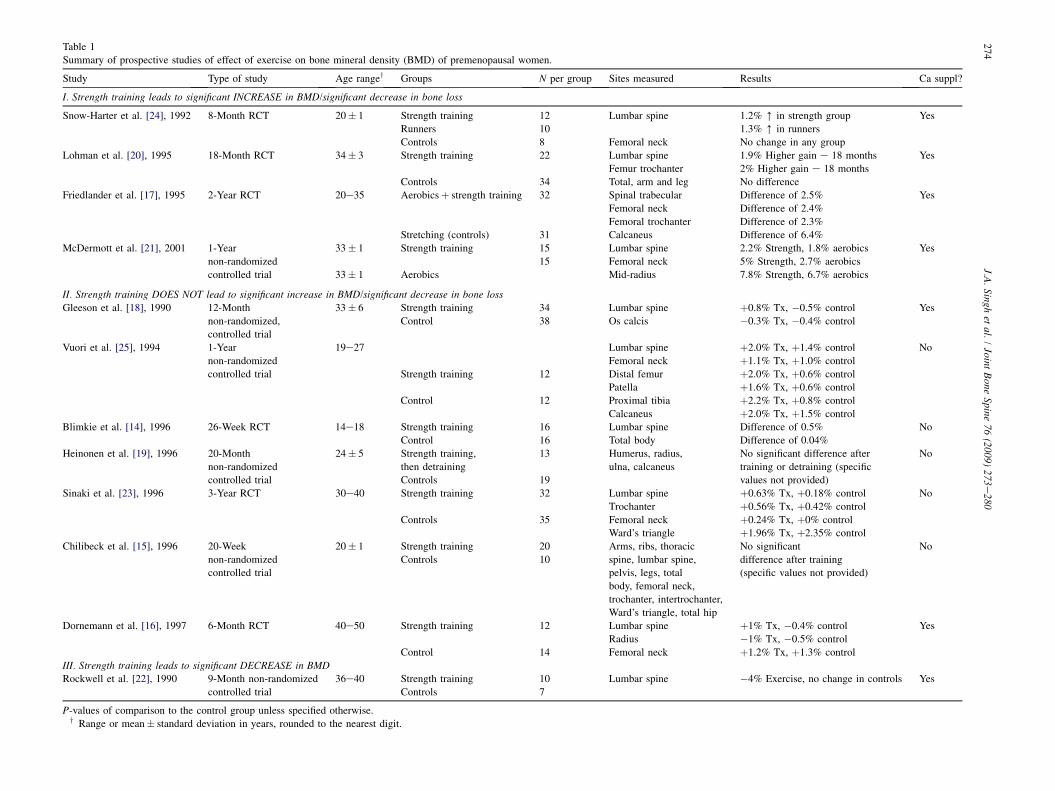
Table 1
Summary of prospective studies of effect of exercise on bone mineral density (BMD) of premenopausal women.
Study Type of study Age rangey Groups N per group Sites measured Results Ca suppl?
I. Strength training leads to significant INCREASE in BMD/significant decrease in bone loss
Snow-Harter et al. [24], 1992 8-Month RCT 20� 1 Strength training 12 Lumbar spine 1.2% [ in strength group Yes
Runners 10 1.3% [ in runners
Controls 8 Femoral neck No change in any group
Lohman et al. [20], 1995 18-Month RCT 34� 3 Strength training 22 Lumbar spine 1.9% Higher gain e 18 months Yes
Femur trochanter 2% Higher gain e 18 months
Controls 34 Total, arm and leg No difference
Friedlander et al. [17], 1995 2-Year RCT 20e35 Aerobicsþ strength training 32 Spinal trabecular Difference of 2.5% Yes
Femoral neck Difference of 2.4%
Femoral trochanter Difference of 2.3%
Stretching (controls) 31 Calcaneus Difference of 6.4%
McDermott et al. [21], 2001 1-Year
non-randomized
controlled trial
33� 1 Strength training 15 Lumbar spine 2.2% Strength, 1.8% aerobics Yes
15 Femoral neck 5% Strength, 2.7% aerobics
33� 1 Aerobics Mid-radius 7.8% Strength, 6.7% aerobics
II. Strength training DOES NOT lead to significant increase in BMD/significant decrease in bone loss
Gleeson et al. [18], 1990 12-Month
non-randomized,
controlled trial
33� 6 Strength training 34 Lumbar spine þ0.8% Tx, �0.5% control Yes
Control 38 Os calcis �0.3% Tx, �0.4% control
Vuori et al. [25], 1994 1-Year
non-randomized
controlled trial
19e27 Lumbar spine þ2.0% Tx, þ1.4% control No
Femoral neck þ1.1% Tx, þ1.0% control
Strength training 12 Distal femur þ2.0% Tx, þ0.6% control
Patella þ1.6% Tx, þ0.6% control
Control 12 Proximal tibia þ2.2% Tx, þ0.8% control
Calcaneus þ2.0% Tx, þ1.5% control
Blimkie et al. [14], 1996 26-Week RCT 14e18 Strength training 16 Lumbar spine Difference of 0.5% No
Control 16 Total body Difference of 0.04%
Heinonen et al. [19], 1996 20-Month
non-randomized
controlled trial
24� 5 Strength training,
then detraining
13 Humerus, radius,
ulna, calcaneus
No significant difference after
training or detraining (specific
values not provided)
No
Controls 19
Sinaki et al. [23], 1996 3-Year RCT 30e40 Strength training 32 Lumbar spine þ0.63% Tx, þ0.18% control No
Trochanter þ0.56% Tx, þ0.42% control
Controls 35 Femoral neck þ0.24% Tx, þ0% control
Ward’s triangle þ1.96% Tx, þ2.35% control
Chilibeck et al. [15], 1996 20-Week
non-randomized
controlled trial
20� 1 Strength training 20 Arms, ribs, thoracic
spine, lumbar spine,
pelvis, legs, total
body, femoral neck,
trochanter, intertrochanter,
Ward’s triangle, total hip
No significant
difference after training
(specific values not provided)
No
Controls 10
Dornemann et al. [16], 1997 6-Month RCT 40e50 Strength training 12 Lumbar spine þ1% Tx, �0.4% control Yes
Radius �1% Tx, �0.5% control
Control 14 Femoral neck þ1.2% Tx, þ1.3% control
III. Strength training leads to significant DECREASE in BMDRockwell et al. [22], 1990 9-Month non-randomized
controlled trial
36e40 Strength training 10 Lumbar spine �4% Exercise, no change in controls Yes
Controls 7
P-values of comparison to the control group unless specified otherwise.y Range or mean� standard deviation in years, rounded to the nearest digit.
27
4J.A
.Singh
etal.
/Joint
Bone
Spine76
(2009)273
e280
275J.A. Singh et al. / Joint Bone Spine 76 (2009) 273e280
controlled trial of strength training in premenopausal womento explore change in body composition (lean and fat mass)over 9 months [26]. Total body DXA scans were used to assesschange in lean and fat mass as previously published [26]. Asthe effects of strength training on BMD in women are con-flicting, we used bone data from the study to examine changesin total body and regional BMD in premenopausal women.Total body BMD is correlated with regional BMD in studies oftotal body DXA scans [27,28]. Thus, we performeda secondary analysis of these data to examine the effect of 9months of strength training on BMD in premenopausalwomen.
2. Methods
2.1. Subjects
During December 1999 and January 2000, 58 premeno-pausal women aged 30e50 years were recruited from femalefaculty, staff, or students at the University of Minnesota.Women were recruited for an obesity prevention interventionstudy, which has been previously described in detail [26] andthe current study assessed the effect of exercise on bonemineral density as secondary data analysis. Women werescreened for the following inclusion criteria: (1) self-reportedBMI between 20 and 35 kg/m2; (2) sedentary to moderatelyphysically active (up to three times a week of exercise and upto five METs intensity; ‘‘MET’’ is a multiple of the restingenergy requirement; for example, two METs require twice theresting energy cost); (3) no recent or ongoing changes inhormonal status that might affect the outcome of the study(e.g. pregnancy, lactation); and (4) no plans to leave the areafor a month or more during the intervention.
Exclusion criteria included (1) body weight changes� 10%over the past year; (2) uncontrolled hypertension(systolic> 140, diastolic> 90 mmHg); (3) current smoking;(4) presence of heart disease or other significant medicalconditions, including diabetes mellitus and cancer within thepast 5 years; (5) presence of a health condition that affectsmetabolic rate (such as thyroid disease); (6) intake ofprescription medications expected to alter the results of thestudy (including cholesterol lowering medications, psychiatricmedications taken at dosages expected to affect weight,appetite suppressants, or thyroid medications); (7) presence ofconditions that might inhibit the ability to participate instrength training (including muscle injuries, orthopedic prob-lems, motion limiting osteoarthritis, or fibromyalgia); (8)positive responses on the Physical Activity Readiness Ques-tionnaire, which identifies patients in whom physical activityis contraindicated [29]; (9) any strength training during thepast year; and (10) past strength training for two or more timesa week for 6 months or longer ever in their lives.
Blocked randomization was stratified by decade of age(30e39 vs. 40e50), due to concern regarding menopausaleffects on the outcomes of interest. Of the 58 premenopausalwomen initially randomized, three women dropped out of thestudy: two women in the control group and one woman in the
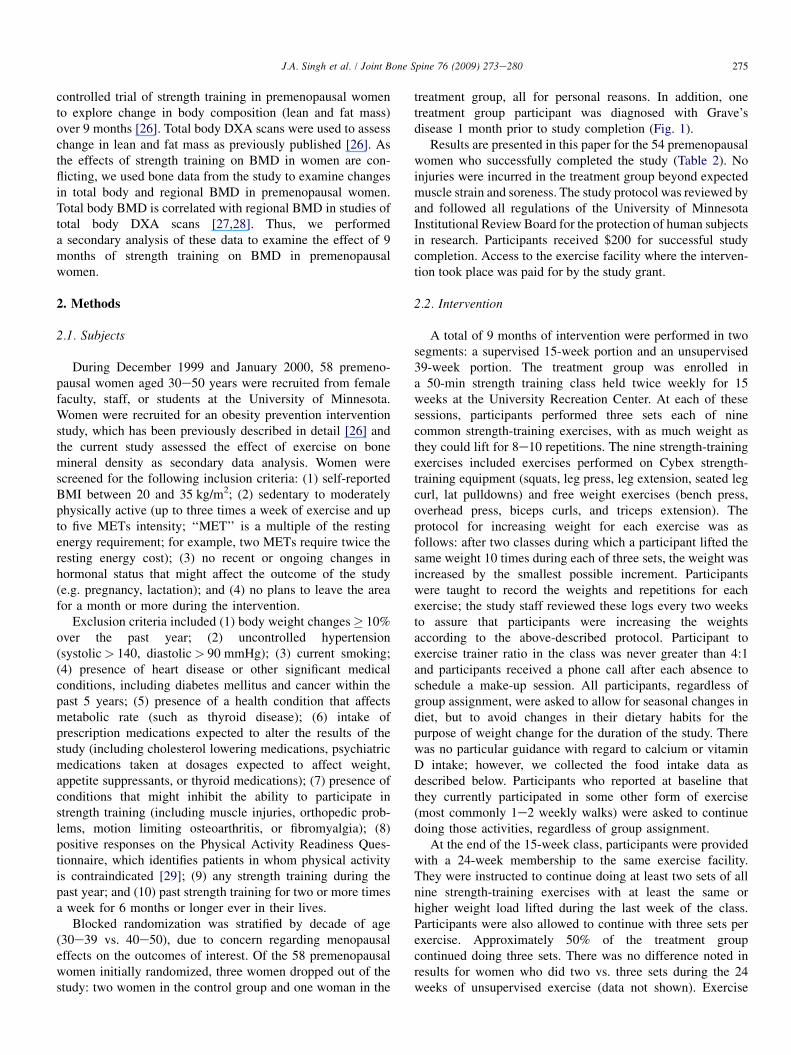
treatment group, all for personal reasons. In addition, onetreatment group participant was diagnosed with Grave’sdisease 1 month prior to study completion (Fig. 1).
Results are presented in this paper for the 54 premenopausalwomen who successfully completed the study (Table 2). Noinjuries were incurred in the treatment group beyond expectedmuscle strain and soreness. The study protocol was reviewed byand followed all regulations of the University of MinnesotaInstitutional Review Board for the protection of human subjectsin research. Participants received $200 for successful studycompletion. Access to the exercise facility where the interven-tion took place was paid for by the study grant.
2.2. Intervention
A total of 9 months of intervention were performed in twosegments: a supervised 15-week portion and an unsupervised39-week portion. The treatment group was enrolled ina 50-min strength training class held twice weekly for 15weeks at the University Recreation Center. At each of thesesessions, participants performed three sets each of ninecommon strength-training exercises, with as much weight asthey could lift for 8e10 repetitions. The nine strength-trainingexercises included exercises performed on Cybex strength-training equipment (squats, leg press, leg extension, seated legcurl, lat pulldowns) and free weight exercises (bench press,overhead press, biceps curls, and triceps extension). Theprotocol for increasing weight for each exercise was asfollows: after two classes during which a participant lifted thesame weight 10 times during each of three sets, the weight wasincreased by the smallest possible increment. Participantswere taught to record the weights and repetitions for eachexercise; the study staff reviewed these logs every two weeksto assure that participants were increasing the weightsaccording to the above-described protocol. Participant toexercise trainer ratio in the class was never greater than 4:1and participants received a phone call after each absence toschedule a make-up session. All participants, regardless ofgroup assignment, were asked to allow for seasonal changes indiet, but to avoid changes in their dietary habits for thepurpose of weight change for the duration of the study. Therewas no particular guidance with regard to calcium or vitaminD intake; however, we collected the food intake data asdescribed below. Participants who reported at baseline thatthey currently participated in some other form of exercise(most commonly 1e2 weekly walks) were asked to continuedoing those activities, regardless of group assignment.
At the end of the 15-week class, participants were providedwith a 24-week membership to the same exercise facility.They were instructed to continue doing at least two sets of allnine strength-training exercises with at least the same orhigher weight load lifted during the last week of the class.Participants were also allowed to continue with three sets perexercise. Approximately 50% of the treatment groupcontinued doing three sets. There was no difference noted inresults for women who did two vs. three sets during the 24weeks of unsupervised exercise (data not shown). Exercise
58 premenopausal women aged 30-50 years
2 dropped due topersonal reasons
Control group (n=30)Treatment group (n=28)
26 finished the study 28 finished the study 1 with Grave’s diseaseexcluded; 1 droppeddue to personal reasons
RANDOMIZATION
Fig. 1. Flow chart of study participants.
276 J.A. Singh et al. / Joint Bone Spine 76 (2009) 273e280
session logs were maintained by participants and reviewedtwice weekly by study staff. If a participant did not record thefirst workout of the week by Wednesday afternoon or a secondworkout for the week by Friday afternoon, she receiveda supportive reminder call from research staff. During the15-week supervised intervention, 92% of prescribed exercisesessions were completed. During the following 24 weeks ofunsupervised exercise (39 weeks), 89% of the prescribedexercise sessions were completed. The control group partici-pated in measurements only.
2.3. Measurements
Measurements occurred at baseline, as well as 15 and 39weeks later. All measurement staff personnel were blinded tothe treatment status of subjects. Body weight and heightmeasurements, and dual energy X-ray absorptiometry (DXA,for body composition and BMD) were performed on partici-pants between 6:30 and 9:30 a.m., after a 12-h fast, andbetween 5 and 11 days after the start of menstrual flow.Participants were asked to empty their bladder and change intoa hospital gown prior to all measurements. Body mass wasmeasured on a calibrated digital scale. Stature was assessedusing a calibrated stadiometer. Two measurements were taken
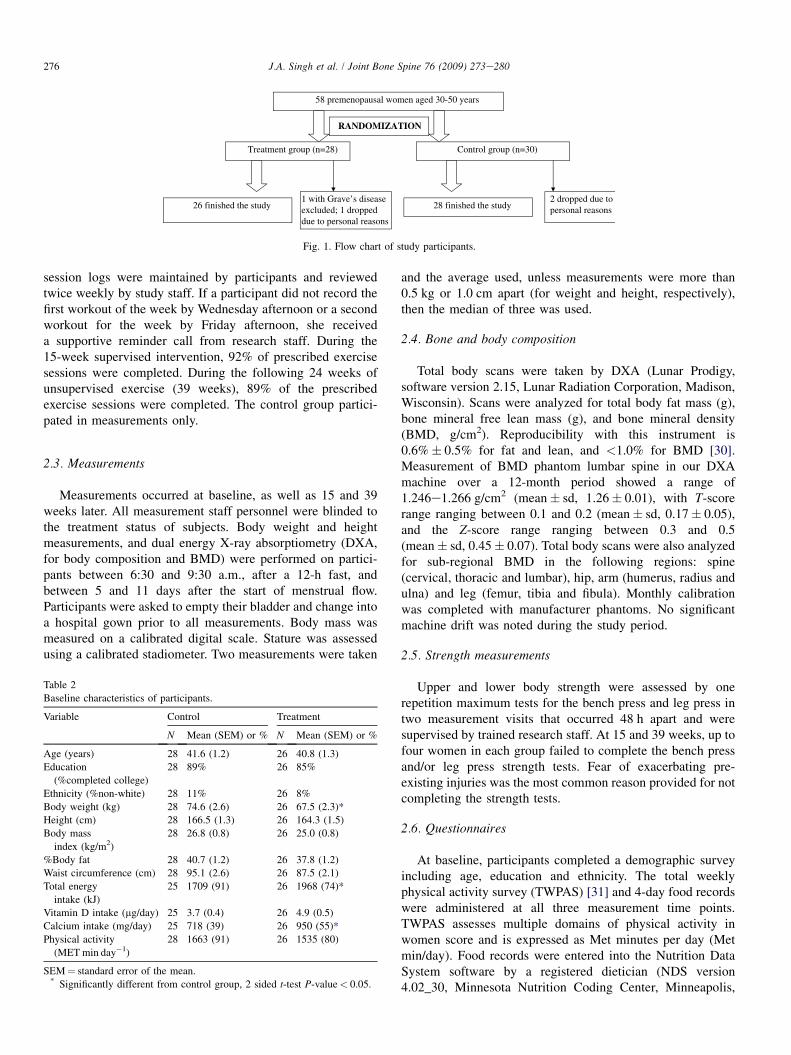
Table 2
Baseline characteristics of participants.
Variable Control Treatment
N Mean (SEM) or % N Mean (SEM) or %
Age (years) 28 41.6 (1.2) 26 40.8 (1.3)
Education
(%completed college)
28 89% 26 85%
Ethnicity (%non-white) 28 11% 26 8%
Body weight (kg) 28 74.6 (2.6) 26 67.5 (2.3)*
Height (cm) 28 166.5 (1.3) 26 164.3 (1.5)
Body mass
index (kg/m2)
28 26.8 (0.8) 26 25.0 (0.8)
%Body fat 28 40.7 (1.2) 26 37.8 (1.2)
Waist circumference (cm) 28 95.1 (2.6) 26 87.5 (2.1)
Total energy
intake (kJ)
25 1709 (91) 26 1968 (74)*
Vitamin D intake (mg/day) 25 3.7 (0.4) 26 4.9 (0.5)
Calcium intake (mg/day) 25 718 (39) 26 950 (55)*
Physical activity
(MET min day�1)
28 1663 (91) 26 1535 (80)
SEM¼ standard error of the mean.* Significantly different from control group, 2 sided t-test P-value< 0.05.
and the average used, unless measurements were more than0.5 kg or 1.0 cm apart (for weight and height, respectively),then the median of three was used.
2.4. Bone and body composition
Total body scans were taken by DXA (Lunar Prodigy,software version 2.15, Lunar Radiation Corporation, Madison,Wisconsin). Scans were analyzed for total body fat mass (g),bone mineral free lean mass (g), and bone mineral density(BMD, g/cm2). Reproducibility with this instrument is0.6%� 0.5% for fat and lean, and <1.0% for BMD [30].Measurement of BMD phantom lumbar spine in our DXAmachine over a 12-month period showed a range of1.246e1.266 g/cm2 (mean� sd, 1.26� 0.01), with T-scorerange ranging between 0.1 and 0.2 (mean� sd, 0.17� 0.05),and the Z-score range ranging between 0.3 and 0.5(mean� sd, 0.45� 0.07). Total body scans were also analyzedfor sub-regional BMD in the following regions: spine(cervical, thoracic and lumbar), hip, arm (humerus, radius andulna) and leg (femur, tibia and fibula). Monthly calibrationwas completed with manufacturer phantoms. No significantmachine drift was noted during the study period.
2.5. Strength measurements
Upper and lower body strength were assessed by onerepetition maximum tests for the bench press and leg press intwo measurement visits that occurred 48 h apart and weresupervised by trained research staff. At 15 and 39 weeks, up tofour women in each group failed to complete the bench pressand/or leg press strength tests. Fear of exacerbating pre-existing injuries was the most common reason provided for notcompleting the strength tests.
2.6. Questionnaires
At baseline, participants completed a demographic surveyincluding age, education and ethnicity. The total weeklyphysical activity survey (TWPAS) [31] and 4-day food recordswere administered at all three measurement time points.TWPAS assesses multiple domains of physical activity inwomen score and is expressed as Met minutes per day (Metmin/day). Food records were entered into the Nutrition DataSystem software by a registered dietician (NDS version4.02_30, Minnesota Nutrition Coding Center, Minneapolis,
277J.A. Singh et al. / Joint Bone Spine 76 (2009) 273e280
MN, USA). Average values over 4 days were used for totalenergy intake, as well as vitamin D and calcium intake.
2.7. Statistical analysis
Statistical analyses were conducted with SAS version 8.0.Baseline characteristics were compared between groups bytwo-sided student’s t-tests for continuous variables and chi-square tests for categorical variables. Mean and standard error(or percentage) is noted for all variables in the paper. Weperformed analysis of covariance (ANCOVA) using PROCGLM for comparing the between group changes in body size,strength, and bone mineral density (BMD) from baseline to 15weeks and baseline to 39 weeks. Body size and strengthchange models were adjusted for the baseline dependentvariable. BMD change was adjusted for baseline BMD, as wellas weight, baseline calcium and total energy intake. Bodyweight and the dietary variables were included because theywere significant between group differences for these variablesat baseline. Results did not change if other factors were usedas covariates. Data were also similar using BMC as anoutcome, to be consistent with previously published work(Table 1), we report only BMD data here.
3. Results
Descriptive characteristics for the 54 women who completedthe study are reported (Table 2). The mean age was 41 years andmost of the women had completed college. Average BMI was 25or greater (kg/m2) in both groups. Of the 54 participants, twowere African-American (one in each group), three were Asian(two intervention and one control), and 49 were Caucasian (10%minority participation). The treatment group weighed less thanthe control group at baseline ( P¼ 0.04), but the groups werewell matched for baseline age, height, BMI, and body compo-sition. The exercise group reported higher total energy intakeand calcium intake ( P¼ 0.03 and P¼ 0.001, respectively). Thetreatment group consumed the required daily allowance ofapproximately 800 mg of calcium/day and nearly the requireddaily allowance of 5 mg/day of vitamin D intake at baseline, 15and 39 weeks (calcium intake were 935, 794, and 832 mg/day;vitamin D intake were 4.9, 4.2, and 4.1 mg/day, for baseline, 15and 39 weeks, respectively). However, the control group hadslightly lower than recommended daily allowance intake of bothcalcium and vitamin D at baseline, 15 and 39 weeks (calciumintake were 718, 723, and 716 mg/day; vitamin D intake were3.7, 3.2, and 3.8 mg/day, for baseline, 15 and 39 weeks,respectively). Between group differences were significant onlyfor baseline calcium ( P¼ 0.001). Eleven of the participantswere taking hormonal medications (including oral contracep-tives) during the study; five in the treatment group, six in thecontrol group.
3.1. Change in bone mineral density at 15 and 39 weeks
BMD increased at all sites in the exercise group excepta slight decrease at hip at 39 weeks (Table 3). In particular,
spine BMD increased significantly by 2.2% in the interventiongroup ( P< 0.05) and did not change in the control group.However, the between group differences for change in BMDwere not significant at any site. We also assessed whetherwomen who started the study above vs. below a BMI of 25might have experienced differential BMD outcomes by addinga main effect term for ‘overweight’ as well as a cross-productsterm for ‘overweight’ and treatment group. A baselineBMI� 25 was defined as ‘‘overweight’’. No differentialpattern of BMD changes was noted according to overweightstatus at baseline (results not shown).
We previously reported no difference between groups forchange in energy intake or physical activity [26]. There was notendency for the treatment group to change energy intake inresponse to the intervention [26].
4. Discussion
Previous studies have shown inconsistent effects of resis-tance training on bone mineral density (BMD, g/cm2) inpremenopausal women [14e25]. Our study added to previouswork by exploring the effects of a strength-training onlyprogram on BMD in premenopausal women with a broadrange of BMI (19e36 kg/m2) and body fat percentage(23e54%) in a randomized controlled trial. Our resultsshowed no significant treatment effect of strength training ontotal body or regional BMD. Although group differences inchange were not significant, the intervention group did havea significant increase in spine BMD (þ2.2%, P< 0.05), whilethe control group had no change. We also noted no differencein the treatment effects (or lack thereof) between women whostarted the study above vs. below a BMI of 25. Similar to ourstudy, seven previous strength-training intervention studieshave found higher but insignificant increases in regional BMD[14e16,18,19,23,25]. In contrast, other prospective studiesshowed either a significant increase [17,20,21,24] or a signifi-cant decrease in BMD [22] at various skeletal sites in thestrength-training group. In a 12-month study, exercise group(n¼ 39) had significant gain in femoral neck compared tocontrols (n¼ 41): femoral neck (1.1% vs. �0.4%) and noeffects on total lumbar BMD (0.098% vs. �0.19%).
Our study is limited in that we used total body scans toassess regional BMD. However, regional and total body BMDare correlated [27,28]. As mentioned above, 9 months mayhave been too short to identify a significant change in BMD.Although relatively small sample in our study and the fact thatthis was secondary data analysis may have led to a type-IIerror, sample size is similar to previous studies. Only fourother published studies had larger within group sample sizes(n¼ 56e72) and two of these are null studies (n¼ 67 and 72);8/12 studies reviewed in Table 1 had sample sizes� 32,approximately 60% of the size of our study sample. Since thesample size variation among the positive studies (30e63patients) seems similar to that seen in the negative studies(24e72), sample size alone does not explain the probability ofthe study results. However, with differences in exercise regi-mens, study duration, BMD measurement errors, calcium and
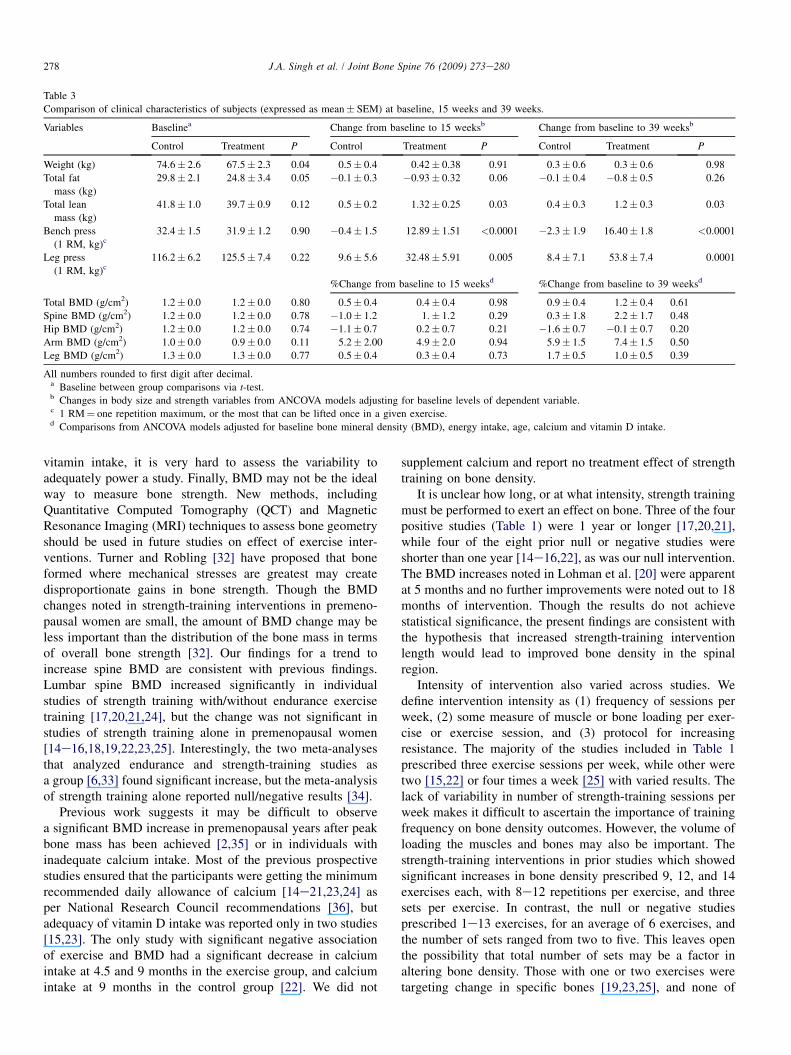
Table 3
Comparison of clinical characteristics of subjects (expressed as mean� SEM) at baseline, 15 weeks and 39 weeks.
Variables Baselinea Change from baseline to 15 weeksb Change from baseline to 39 weeksb
Control Treatment P Control Treatment P Control Treatment P
Weight (kg) 74.6� 2.6 67.5� 2.3 0.04 0.5� 0.4 0.42� 0.38 0.91 0.3� 0.6 0.3� 0.6 0.98
Total fat
mass (kg)
29.8� 2.1 24.8� 3.4 0.05 �0.1� 0.3 �0.93� 0.32 0.06 �0.1� 0.4 �0.8� 0.5 0.26
Total lean
mass (kg)
41.8� 1.0 39.7� 0.9 0.12 0.5� 0.2 1.32� 0.25 0.03 0.4� 0.3 1.2� 0.3 0.03
Bench press
(1 RM, kg)c32.4� 1.5 31.9� 1.2 0.90 �0.4� 1.5 12.89� 1.51 <0.0001 �2.3� 1.9 16.40� 1.8 <0.0001
Leg press
(1 RM, kg)c116.2� 6.2 125.5� 7.4 0.22 9.6� 5.6 32.48� 5.91 0.005 8.4� 7.1 53.8� 7.4 0.0001
%Change from baseline to 15 weeksd %Change from baseline to 39 weeksd
Total BMD (g/cm2) 1.2� 0.0 1.2� 0.0 0.80 0.5� 0.4 0.4� 0.4 0.98 0.9� 0.4 1.2� 0.4 0.61
Spine BMD (g/cm2) 1.2� 0.0 1.2� 0.0 0.78 �1.0� 1.2 1.� 1.2 0.29 0.3� 1.8 2.2� 1.7 0.48
Hip BMD (g/cm2) 1.2� 0.0 1.2� 0.0 0.74 �1.1� 0.7 0.2� 0.7 0.21 �1.6� 0.7 �0.1� 0.7 0.20
Arm BMD (g/cm2) 1.0� 0.0 0.9� 0.0 0.11 5.2� 2.00 4.9� 2.0 0.94 5.9� 1.5 7.4� 1.5 0.50
Leg BMD (g/cm2) 1.3� 0.0 1.3� 0.0 0.77 0.5� 0.4 0.3� 0.4 0.73 1.7� 0.5 1.0� 0.5 0.39
All numbers rounded to first digit after decimal.a Baseline between group comparisons via t-test.b Changes in body size and strength variables from ANCOVA models adjusting for baseline levels of dependent variable.c 1 RM¼ one repetition maximum, or the most that can be lifted once in a given exercise.d Comparisons from ANCOVA models adjusted for baseline bone mineral density (BMD), energy intake, age, calcium and vitamin D intake.
278 J.A. Singh et al. / Joint Bone Spine 76 (2009) 273e280
vitamin intake, it is very hard to assess the variability toadequately power a study. Finally, BMD may not be the idealway to measure bone strength. New methods, includingQuantitative Computed Tomography (QCT) and MagneticResonance Imaging (MRI) techniques to assess bone geometryshould be used in future studies on effect of exercise inter-ventions. Turner and Robling [32] have proposed that boneformed where mechanical stresses are greatest may createdisproportionate gains in bone strength. Though the BMDchanges noted in strength-training interventions in premeno-pausal women are small, the amount of BMD change may beless important than the distribution of the bone mass in termsof overall bone strength [32]. Our findings for a trend toincrease spine BMD are consistent with previous findings.Lumbar spine BMD increased significantly in individualstudies of strength training with/without endurance exercisetraining [17,20,21,24], but the change was not significant instudies of strength training alone in premenopausal women[14e16,18,19,22,23,25]. Interestingly, the two meta-analysesthat analyzed endurance and strength-training studies asa group [6,33] found significant increase, but the meta-analysisof strength training alone reported null/negative results [34].
Previous work suggests it may be difficult to observea significant BMD increase in premenopausal years after peakbone mass has been achieved [2,35] or in individuals withinadequate calcium intake. Most of the previous prospectivestudies ensured that the participants were getting the minimumrecommended daily allowance of calcium [14e21,23,24] asper National Research Council recommendations [36], butadequacy of vitamin D intake was reported only in two studies[15,23]. The only study with significant negative associationof exercise and BMD had a significant decrease in calciumintake at 4.5 and 9 months in the exercise group, and calciumintake at 9 months in the control group [22]. We did not
supplement calcium and report no treatment effect of strengthtraining on bone density.
It is unclear how long, or at what intensity, strength trainingmust be performed to exert an effect on bone. Three of the fourpositive studies (Table 1) were 1 year or longer [17,20,21],while four of the eight prior null or negative studies wereshorter than one year [14e16,22], as was our null intervention.The BMD increases noted in Lohman et al. [20] were apparentat 5 months and no further improvements were noted out to 18months of intervention. Though the results do not achievestatistical significance, the present findings are consistent withthe hypothesis that increased strength-training interventionlength would lead to improved bone density in the spinalregion.
Intensity of intervention also varied across studies. Wedefine intervention intensity as (1) frequency of sessions perweek, (2) some measure of muscle or bone loading per exer-cise or exercise session, and (3) protocol for increasingresistance. The majority of the studies included in Table 1prescribed three exercise sessions per week, while other weretwo [15,22] or four times a week [25] with varied results. Thelack of variability in number of strength-training sessions perweek makes it difficult to ascertain the importance of trainingfrequency on bone density outcomes. However, the volume ofloading the muscles and bones may also be important. Thestrength-training interventions in prior studies which showedsignificant increases in bone density prescribed 9, 12, and 14exercises each, with 8e12 repetitions per exercise, and threesets per exercise. In contrast, the null or negative studiesprescribed 1e13 exercises, for an average of 6 exercises, andthe number of sets ranged from two to five. This leaves openthe possibility that total number of sets may be a factor inaltering bone density. Those with one or two exercises weretargeting change in specific bones [19,23,25], and none of
279J.A. Singh et al. / Joint Bone Spine 76 (2009) 273e280
these produced significant bone improvements. There was toolittle variability to assess the impact of number of repetitionsper exercise on bone outcomes. The progression for increasingresistance was difficult to ascertain and compare acrossstudies. Future studies need to clarify the dose of strengthtraining needed to elicit a positive impact on bone density inpremenopausal women.
A prospective, randomized design and high exerciseadherence with no recorded changes in self-reported activity incontrols are the main strengths of this study. The randomizeddesign is particularly important, given that three of the fourcompleted strength-training studies that show a significanteffect on bone were randomized controlled trials, compared tofour of the eight prior null or negative studies.
In summary, further research is needed to identify the doseand mode of strength training needed to produce a beneficialeffect on BMD in premenopausal women. The roles of age andperi-menopausal hormonal changes in this process also need tobe clarified by stratifying patients on these characteristics infuture studies. If the bone geometric changes assessed withnewer technology show that these small, non-significant,increases in BMD translate to large increases in bone strength(as predicted from animal models), strength training couldbecome a cost-effective intervention for increasing BMD andpreventing osteoporosis. New studies are needed to discernthose effects.
Declaration: the study was conducted in accordance withlaws of the USA., protected patients’ rights and privacy andwas conducted with the permission of the Institutional ReviewBoard of the University of Minnesota.
Conflict of interest: None of the authors has any conflictsof interest to declare.
Acknowledgement
We thank the subjects for their time and participation in thestudy.
References
[1] Zanchetta JR, Plotkin H, Alvarez Filgueira ML. Bone mass in children:
normative values for the 2e20-year-old population. Bone 1995;16:
393Se9S.
[2] Matkovic V, Jelic T, Wardlaw GM, et al. Timing of peak bone mass in
Caucasian females and its implication for the prevention of osteopo-
rosis. Inference from a cross-sectional model. J Clin Invest 1994;93:
799e808.
[3] Riggs BL, Wahner HW, Seeman E, et al. Changes in bone mineral
density of the proximal femur and spine with aging. Differences between
the postmenopausal and senile osteoporosis syndromes. J Clin Invest
1982;70:716e23.
[4] Kashner TM, Muller A, Richter E, et al. Private health insurance and
veterans use of Veterans Affairs care. RATE Project Committee. Rate
Alternative Technical Evaluation. Med Care 1998;36:1085e97.
[5] Riggs BL, Melton 3rd LJ. The prevention and treatment of osteoporosis.
N Engl J Med 1992;327:620e7.
[6] Wallace BA, Cumming RG. Systematic review of randomized trials of
the effect of exercise on bone mass in pre- and postmenopausal women.
Calcif Tissue Int 2000;67:10e8.
[7] Heaney RP. Calcium, dairy products and osteoporosis. J Am Coll Nutr
2000;19:83Se99S.
[8] Welten DC, Kemper HC, Post GB, et al. A meta-analysis of the effect of
calcium intake on bone mass in young and middle aged females and
males. J Nutr 1995;125:2802e13.
[9] Bailey DA, Faulkner RA, McKay HA. Growth, physical activity, and
bone mineral acquisition. Exerc Sport Sci Rev 1996;24:233e66.
[10] Whiting SJ, Vatanparast H, Baxter-Jones A, et al. Factors that affect bone
mineral accrual in the adolescent growth spurt. J Nutr 2004;134:
696Se700S.
[11] Aloia JF, Cohn SH, Ostuni JA, et al. Prevention of involutional bone loss
by exercise. Ann Intern Med 1978;89:356e8.
[12] Davee AM, Rosen CJ, Adler RA. Exercise patterns and trabecular bone
density in college women. J Bone Miner Res 1990;5:245e50.
[13] Kanders B, Dempster DW, Lindsay R. Interaction of calcium nutrition
and physical activity on bone mass in young women. J Bone Miner Res
1988;3:145e9.
[14] Blimkie CJ, Rice S, Webber CE, et al. Effects of resistance training on
bone mineral content and density in adolescent females. Can J Physiol
Pharmacol 1996;74:1025e33.
[15] Chilibeck PD, Calder A, Sale DG, et al. Twenty weeks of weight training
increases lean tissue mass but not bone mineral mass or density in
healthy, active young women. Can J Physiol Pharmacol 1996;74:
1180e5.
[16] Dornemann TM, McMurray RG, Renner JB, et al. Effects of high-
intensity resistance exercise on bone mineral density and muscle strength
of 40e50-year-old women. J Sports Med Phys Fitness 1997;37:246e51.
[17] Friedlander AL, Genant HK, Sadowsky S, et al. A two-year program of
aerobics and weight training enhances bone mineral density of young
women. J Bone Miner Res 1995;10:574e85.
[18] Gleeson PB, Protas EJ, LeBlanc AD, et al. Effects of weight lifting on
bone mineral density in premenopausal women. J Bone Miner Res 1990;
5:153e8.
[19] Heinonen A, Sievanen H, Kannus P, et al. Effects of unilateral strength
training and detraining on bone mineral mass and estimated mechanical
characteristics of the upper limb bones in young women. J Bone Miner
Res 1996;11:490e501.
[20] Lohman T, Going S, Pamenter R, et al. Effects of resistance training on
regional and total bone mineral density in premenopausal women:
a randomized prospective study. J Bone Miner Res 1995;10:1015e24.
[21] McDermott MT, Christensen RS, Lattimer J. The effects of region-
specific resistance and aerobic exercises on bone mineral density in
premenopausal women. Mil Med 2001;166:318e21.
[22] Rockwell JC, Sorensen AM, Baker S, et al. Weight training decreases
vertebral bone density in premenopausal women: a prospective study. J
Clin Endocrinol Metab 1990;71:988e93.
[23] Sinaki M, Wahner HW, Bergstralh EJ, et al. Three-year controlled,
randomized trial of the effect of dose-specified loading and strengthening
exercises on bone mineral density of spine and femur in nonathletic,
physically active women. Bone 1996;19:233e44.
[24] Snow-Harter C, Bouxsein ML, Lewis BT, et al. Effects of resistance and
endurance exercise on bone mineral status of young women: a random-
ized exercise intervention trial. J Bone Miner Res 1992;7:761e9.
[25] Vuori I, Heinonen A, Sievanen H, et al. Effects of unilateral strength
training and detraining on bone mineral density and content in young
women: a study of mechanical loading and deloading on human bones.
Calcif Tissue Int 1994;55:59e67.
[26] Schmitz KH, Jensen MD, Kugler KC, et al. Strength training for obesity
prevention in midlife women. Int J Obes Relat Metab Disord 2003;27:
326e33.
[27] Compston JE, Bhambhani M, Laskey MA, et al. Body composition and
bone mass in post-menopausal women. Clin Endocrinol (Oxford) 1992;
37:426e31.
[28] Franck H, Munz M. Total body and regional bone mineral densitometry
(BMD) and soft tissue measurements: correlations of BMD parameter to
lumbar spine and hip. Calcif Tissue Int 2000;67:111e5.
[29] PAR-Q validation report. British Columbia Ministry of Health; May
1978.

280 J.A. Singh et al. / Joint Bone Spine 76 (2009) 273e280
[30] Jensen MD, Kanaley JA, Roust LR, et al. Assessment of body
composition with use of dual-energy X-ray absorptiometry: evaluation
and comparison with other methods. Mayo Clin Proc 1993;68:
867e73.
[31] Ainsworth B, LaMonte M, Whitt M, et al. Development and validation
of a physical activity questionnaire to assess moderate intensity activity
in minority women, ages 40 and older. In: Proceedings of the NIH
women’s health community research conference, NIH Women’s Health
Community Research Conference, Bethesda, MD; October 2000.
[32] Yano EM, Washington DL, Goldzweig C, et al. The organization and
delivery of women’s health care in Department of Veterans Affairs
Medical Center. Womens Health Issues 2003;13:55e61.
[33] Wolff I, van Croonenborg JJ, Kemper HC, et al. The effect of exercise
training programs on bone mass: a meta-analysis of published
controlled trials in pre- and postmenopausal women. Osteoporos Int
1999;9:1e12.
[34] Kelley GA, Kelley KS. Efficacy of resistance exercise on lumbar spine
and femoral neck bone mineral density in premenopausal women:
a meta-analysis of individual patient data. J Womens Health (Larchmt)
2004;13:293e300.
[35] Bonjour JP, Theintz G, Law F, et al. Peak bone mass. Osteoporos Int
1994;4(Suppl. 1):7e13.
[36] Recommended dietary allowances. Washington, DC: National Academy
Press, National Research Council; 1989.
Related Documents