Effect of Replacing Sugar with Non-Caloric Sweeteners in Beverages on the Reward Value after Repeated Exposure Sanne Griffioen-Roose 1* , Paul A. M. Smeets 1,2 , Pascalle L. G. Weijzen 3 , Inge van Rijn 1 , Iris van den Bosch 1 , Cees de Graaf 1 1 Division of Human Nutrition, Wageningen University, Wageningen, The Netherlands, 2 Image Sciences Institute, University Medical Center Utrecht, Utrecht, The Netherlands, 3 Research Department Sensory & Consumer Science, FrieslandCampina, Amersfoort, The Netherlands Abstract Background: The reward value of food is partly dependent on learned associations. It is not yet known whether replacing sugar with non-caloric sweeteners in food is affecting long-term acceptance. Objective: To determine the effect of replacing sugar with non-caloric sweeteners in a nutrient-empty drink (soft drink) versus nutrient-rich drink (yoghurt drink) on reward value after repeated exposure. Design: We used a randomized crossover design whereby forty subjects (15 men, 25 women) with a mean±SD age of 21±2 y and BMI of 21.5±1.7 kg/m 2 consumed a fixed portion of a non-caloric sweetened (NS) and sugar sweetened (SS) versions of either a soft drink or a yoghurt drink (counterbalanced) for breakfast which were distinguishable by means of colored labels. Each version of a drink was offered 10 times in semi-random order. Before and after conditioning the reward value of the drinks was assessed using behavioral tasks on wanting, liking, and expected satiety. In a subgroup (n=18) fMRI was performed to assess brain reward responses to the drinks. Results: Outcomes of both the behavioral tasks and fMRI showed that conditioning did not affect the reward value of the NS and SS versions of the drinks significantly. Overall, subjects preferred the yoghurt drinks to the soft drinks and the ss drinks to the NS drinks. In addition, they expected the yoghurt drinks to be more satiating, they reduced hunger more, and delayed the first eating episode more. Conditioning did not influence these effects. Conclusion: Our study showed that repeated consumption of a non-caloric sweetened beverage, instead of a sugar sweetened version, appears not to result in changes in the reward value. It cannot be ruled out that learned associations between sensory attributes and food satiating capacity which developed preceding the conditioning period, during lifetime, affected the reward value of the drinks. Citation: Griffioen-Roose S, Smeets PAM, Weijzen PLG, van Rijn I, van den Bosch I, et al. (2013) Effect of Replacing Sugar with Non-Caloric Sweeteners in Beverages on the Reward Value after Repeated Exposure. PLoS ONE 8(11): e81924. doi:10.1371/journal.pone.0081924 Editor: Elsa Addessi, CNR, Italy Received May 2, 2013; Accepted October 28, 2013; Published November 28, 2013 Copyright: © 2013 Griffioen-Roose et al. This is an open-access article distributed under the terms of the Creative Commons Attribution License, which permits unrestricted use, distribution, and reproduction in any medium, provided the original author and source are credited. Funding: This work was supported by a governmental research grant of AgentschapNL and the Dutch provinces Overijssel and Gelderland (Grant PID102058). The funders had no role in study design, data collection and analysis, decision to publish, or preparation of the manuscript. Competing interests: The authors have the following interests. The third author, Dr. Pascalle Weijzen, is affiliated with FrieslandCampina, the Netherlands. This does not alter the authors' adherence to all the PLOS ONE policies on sharing data and materials. * E-mail: [email protected] Introduction The prevalence of obesity has risen dramatically in the last decades resulting in increasing numbers of public health problems [1]. Obesity is the result of a positive energy balance i.e. energy intake exceeding the energy expenditure [2]. In recent years, governmental and public health organizations have therefore actively promoted dietary recommendations, such as increased consumption of fruit and vegetables and reduced intake of sugar [3,4]. This has led to an increase of products on the market where sugar is replaced by non-caloric substitutes, so-called ‘light’ products [5,6]. The reward value of a food product is partly dependent on a learned association; through repeated consumption of foods during our lifetime we learn to associate the sensory attributes of food (e.g. taste), with their physiological effect (e.g. amount of energy) and thereby learn to estimate their metabolic effects [7,8]. This gives rise to the possibility that repeatedly consuming products where the rewarding component, i.e. sugar, is withdrawn, might lead to a decreased preference for these foods compared to their higher-energy counterparts. In recent studies, it has been shown that caloric and non-caloric versions of a soft drink differentially affect taste activation in brain areas during tasting which are implicated in food intake regulation, like the amygdala and striatum [9-11]. The human PLOS ONE | www.plosone.org 1 November 2013 | Volume 8 | Issue 11 | e81924

Welcome message from author
This document is posted to help you gain knowledge. Please leave a comment to let me know what you think about it! Share it to your friends and learn new things together.
Transcript
Effect of Replacing Sugar with Non-Caloric Sweeteners inBeverages on the Reward Value after Repeated ExposureSanne Griffioen-Roose1*, Paul A. M. Smeets1,2, Pascalle L. G. Weijzen3, Inge van Rijn1, Iris van denBosch1, Cees de Graaf1
1 Division of Human Nutrition, Wageningen University, Wageningen, The Netherlands, 2 Image Sciences Institute, University Medical Center Utrecht, Utrecht,The Netherlands, 3 Research Department Sensory & Consumer Science, FrieslandCampina, Amersfoort, The Netherlands
Abstract
Background: The reward value of food is partly dependent on learned associations. It is not yet known whetherreplacing sugar with non-caloric sweeteners in food is affecting long-term acceptance.Objective: To determine the effect of replacing sugar with non-caloric sweeteners in a nutrient-empty drink (softdrink) versus nutrient-rich drink (yoghurt drink) on reward value after repeated exposure.Design: We used a randomized crossover design whereby forty subjects (15 men, 25 women) with a mean±SD ageof 21±2 y and BMI of 21.5±1.7 kg/m2 consumed a fixed portion of a non-caloric sweetened (NS) and sugarsweetened (SS) versions of either a soft drink or a yoghurt drink (counterbalanced) for breakfast which weredistinguishable by means of colored labels. Each version of a drink was offered 10 times in semi-random order.Before and after conditioning the reward value of the drinks was assessed using behavioral tasks on wanting, liking,and expected satiety. In a subgroup (n=18) fMRI was performed to assess brain reward responses to the drinks.Results: Outcomes of both the behavioral tasks and fMRI showed that conditioning did not affect the reward value ofthe NS and SS versions of the drinks significantly. Overall, subjects preferred the yoghurt drinks to the soft drinks andthe ss drinks to the NS drinks. In addition, they expected the yoghurt drinks to be more satiating, they reducedhunger more, and delayed the first eating episode more. Conditioning did not influence these effects.Conclusion: Our study showed that repeated consumption of a non-caloric sweetened beverage, instead of a sugarsweetened version, appears not to result in changes in the reward value. It cannot be ruled out that learnedassociations between sensory attributes and food satiating capacity which developed preceding the conditioningperiod, during lifetime, affected the reward value of the drinks.
Citation: Griffioen-Roose S, Smeets PAM, Weijzen PLG, van Rijn I, van den Bosch I, et al. (2013) Effect of Replacing Sugar with Non-Caloric Sweetenersin Beverages on the Reward Value after Repeated Exposure. PLoS ONE 8(11): e81924. doi:10.1371/journal.pone.0081924
Editor: Elsa Addessi, CNR, Italy
Received May 2, 2013; Accepted October 28, 2013; Published November 28, 2013
Copyright: © 2013 Griffioen-Roose et al. This is an open-access article distributed under the terms of the Creative Commons Attribution License, whichpermits unrestricted use, distribution, and reproduction in any medium, provided the original author and source are credited.
Funding: This work was supported by a governmental research grant of AgentschapNL and the Dutch provinces Overijssel and Gelderland (GrantPID102058). The funders had no role in study design, data collection and analysis, decision to publish, or preparation of the manuscript.
Competing interests: The authors have the following interests. The third author, Dr. Pascalle Weijzen, is affiliated with FrieslandCampina, theNetherlands. This does not alter the authors' adherence to all the PLOS ONE policies on sharing data and materials.
* E-mail: [email protected]
Introduction
The prevalence of obesity has risen dramatically in the lastdecades resulting in increasing numbers of public healthproblems [1]. Obesity is the result of a positive energy balancei.e. energy intake exceeding the energy expenditure [2]. Inrecent years, governmental and public health organizationshave therefore actively promoted dietary recommendations,such as increased consumption of fruit and vegetables andreduced intake of sugar [3,4]. This has led to an increase ofproducts on the market where sugar is replaced by non-caloricsubstitutes, so-called ‘light’ products [5,6].
The reward value of a food product is partly dependent on alearned association; through repeated consumption of foodsduring our lifetime we learn to associate the sensory attributesof food (e.g. taste), with their physiological effect (e.g. amountof energy) and thereby learn to estimate their metabolic effects[7,8]. This gives rise to the possibility that repeatedlyconsuming products where the rewarding component, i.e.sugar, is withdrawn, might lead to a decreased preference forthese foods compared to their higher-energy counterparts. Inrecent studies, it has been shown that caloric and non-caloricversions of a soft drink differentially affect taste activation inbrain areas during tasting which are implicated in food intakeregulation, like the amygdala and striatum [9-11]. The human
PLOS ONE | www.plosone.org 1 November 2013 | Volume 8 | Issue 11 | e81924

brain appears to be able to differentiate between carbohydrates(sugar) and sweetness [12,13]. It is not yet known whetherreducing sugar in food is affecting long-term acceptance andwhether this is related to other aspects of the food, i.e. whetherthe product contains other nutrients.
The primary objective of this study was to determine theeffect of replacing sugar with non-caloric sweeteners in anutrient-empty drink (soft drink) versus a nutrient-rich drink(yoghurt drink) on reward value after repeated exposure.Reward value was assessed with behavioral tasks andfunctional Magnetic Resonance Imaging (fMRI) measurements.It was hypothesized that the reward value of foods that arenutrient-rich would be less affected by replacing the sugarcontent than the reward value of foods that are nutrient-empty.Therefore, we expected that the reward value of a yoghurtdrink sweetened with a non-caloric sweetener would notchange after repeated exposure and would remain similar tothat of the sugar sweetened version. Conversely, wehypothesized that a soft drink sweetened with a non-caloricsweetener would decrease in reward value after repeatedexposure compared to its sugar-sweetened counterpart.
Methods
Ethics statementThis study was conducted according to the guidelines laid
down in the Declaration of Helsinki and all procedures involvinghuman subjects were approved by the Medical EthicalCommittee of Wageningen University. All subjects signed aninformed-consent form before participation. This study hasbeen registered with the Dutch Trial register (NTR: 3289) at:http://www.trialregister.nl/trialreg/admin/rctsearch.asp?Term=3289.
SubjectsForty subjects (15 men, 25 women) with a mean±SD age of
21±2 y and BMI of 21.5±1.7 kg/m2 completed the study, whichran from March till June 2012. All subjects participated in thebehavioral part of the study, and 18 subjects (15 men, threewomen) participated in the fMRI part of the study. Of the 41subjects enrolled in the study, one subject dropped out duringthe first conditioning week. A supplemental flow diagram of theprogress through the phases of the study is available online(Figure S1). We recruited healthy, normal-weight subjects,aged 18-35 y. Exclusion criteria were as follows: restrainedeating (Dutch Eating Behavior Questionnaire (DEBQ), men:score >2.25, women: score >2.80 [14], lack of appetite, anenergy restricted diet during the past two months, change inbody weight > five kg during the past two months, stomach orbowel diseases, diabetes, thyroid disease or any otherendocrine disorder, use of daily medication other than oralcontraceptives, having difficulties with swallowing/eating,having taste or smell disorders, being allergic/intolerant forproducts under study, smoking, and for women, being pregnantor lactating. In addition, exclusive consumers or avoiders of‘light versions’ of soft drinks and/or yoghurt drinks wereexcluded (assessed with questionnaire) as they might be moresensitive to the taste of specific sweeteners. In addition, for the
subjects that also participated in the fMRI part of the study,exclusion criteria were contra-indications for MRI scanning.
Potential subjects filled out an inclusion questionnaireincluding a medical history questionnaire. They attended ascreening and practice session which included measurement ofweight and height and explanation/practice of the differentprocedures. Subjects were unaware of the exact aim of thestudy; they were not informed that the drinks contained eithersugar or artificial sweeteners. They were informed we wereinvestigating the effect of repeated consumption of differentbeverages on satiety and were naïve to the fact that wespecifically investigated reward.
DesignWe used a randomized crossover design consisting of two
periods and each period consisted of three parts: a pre-measurement, a conditioning period, and a post-measurement(Figure 1). In the conditioning period, subjects were offered anon-caloric sweetened (NS) and sugar sweetened (SS)versions of either a soft drink or a yoghurt drink for breakfast.To enable subjects to differentiate between the drinks theywere marked with a colored label (see ‘Stimuli’). In period 1,subjects received either the NS and the SS versions of the softdrinks or the NS and SS versions of the yoghurt drinks. Inperiod 2 these conditions were counterbalanced. Subjects wererandomly assigned to one of the two groups by the principalinvestigator, taking gender into account. The pre- and post-measurements assessed reward value (our primary outcomemeasure) of the drinks using behavioral tasks and fMRI. Weassessed wanting with a choice task, (implicit) intake, andexplicit question, liking was assessed with an explicit questionand the implicit association task (IAT), and (expected) satietywas assessed with questionnaires. The brain rewardresponses to the NS and SS drinks were investigated withfMRI.
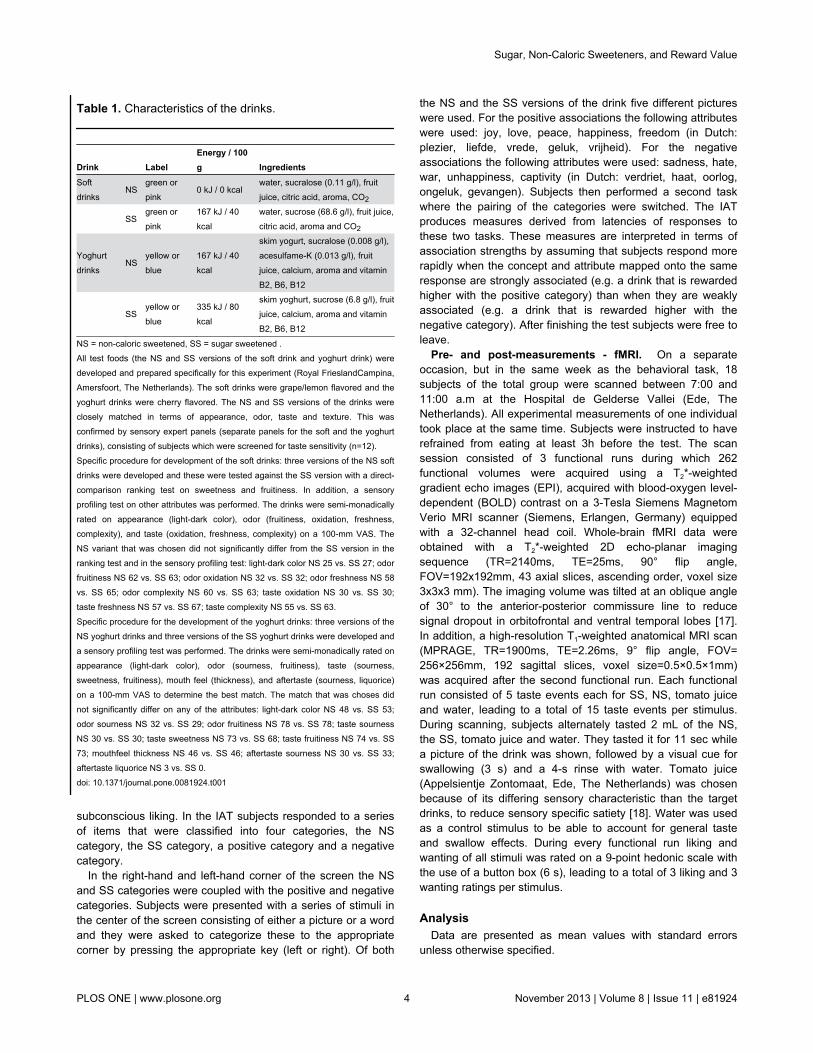
StimuliAll test foods (the NS and SS versions of the soft drink and
yoghurt drink) were developed and prepared specifically for thisexperiment (Royal FrieslandCampina, Amersfoort, TheNetherlands). The soft drinks were grape/lemon flavored andthe yoghurt drinks were cherry flavored. The NS and SSversions of the drinks were closely matched in terms ofappearance, odor, taste and texture. This was confirmed bysensory expert panels (separate panels for the soft and theyoghurt drinks), consisting of subjects which were screened fortaste sensitivity (n=12). Characteristics of the drinks are shownin Table 1. The energy densities and sensory characteristics ofthe used products were all similar to products that are availablein the supermarket.
To enable subjects to differentiate between the drinks theywere paired with a colored label. For the soft drinks, half of thesubjects received the NS version with a green label the otherhalf with a pink label (and vice versa for the SS version). Foryoghurt drinks: half of the subjects received the NS versionwith a yellow label and the other half with a blue label (and viceversa for the SS version). This procedure of pairing drinks witha colored label has been shown to enable ‘energy learning’
Sugar, Non-Caloric Sweeteners, and Reward Value
PLOS ONE | www.plosone.org 2 November 2013 | Volume 8 | Issue 11 | e81924

[15]. During the measurements and the conditioning periodsubjects were offered a fixed portion of the test foods: themales received 400 mL (NS soft drink: 0 kJ / 0 kcal, SS softdrink: 669 kJ / 160 kcal, NS yoghurt drink: 669 kJ / 160 kcal,SS yoghurt drink: 1339 kJ / 320 kcal) and the females 300 mL(NS soft drink: 0 kJ / 0 kcal, SS soft drink: 502 kJ / 120 kcal,NS yoghurt drink: 502 kJ / 120 kcal, SS yoghurt drink: 1004 kJ /240 kcal).
ProcedureConditioning period. The conditioning period lasted 4
weeks (=20 exposures). Subjects were offered a NS or a SSversion of either the soft drink or the yoghurt drink. Eachversion of a drink was offered 10 times in semi-random order,i.e. each product was offered not more than two days in a row.During the conditioning period subjects came to the researchcenter at the Wageningen University (Wageningen, TheNetherlands) on weekdays between 7:30 and 9:00 a.m. in afasted state (no eating or drinking anything except water afterovernight fast). Upon arrival subjects filled out an appetitequestionnaire, consisting of 5 dimensions: hunger, fullness,prospective consumption, desire to eat, and thirst. The 9-pointscale was anchored with ‘not at all’ to ‘extremely’. Next,subjects consumed their drink with a straw. After finishing theyrated their appetite and were then free to leave. During the daysubjects reported at what time they had their first eatingepisode and what they consumed. Subjects were instructed notto eat for at least 1 hr after consumption of the drinks.
Pre- and post-measurements - Behavioral tasks. Allsubjects were tested between 7:00 and 8:30 in fasted state inan isolated sensory booth. When subjects arrived at theresearch center at the Wageningen University (Wageningen,The Netherlands) they were given specific instructions shownon a computer screen. All test sessions started with subjectsfilling out an appetite questionnaire, consisting of a hunger and
thirst question. The 100-unit visual analogue scale (VAS) wasanchored with ‘not at all’ to ‘extremely’.
Next, subjects were offered the two drinks (similar cups andamounts as in the condition period): either the NS and the SSversions of the soft drinks or the NS and the SS versions of theyoghurt drinks (depending on the ‘period’). Subjects wereinstructed to taste the drinks and rate their ‘explicit liking’ (“Howpleasant do you find the taste of this drink right now?”), their‘explicit wanting’ (“How much do you want to consume thisdrink right now?”), and their ‘expected satiety’ (“How filling doyou think this drink is?”). These three questions per drink wereaccompanied with a clear identifiable picture of the drink andwere asked in randomized order. This was followed by acomputerized ‘choice task’. Subjects were shown a pairedpresentation of two drinks where they had to select their mostwanted drink (“select the drink which you would most want todrink right now”). The first four presentation pairs consisted ofpictures of red bull energy drink, diet coke, milkshake andorange juice, presented in random order (e.g. subjects had tochoose between red bull energy drink vs. diet coke, or betweendiet coke vs. orange juice). During the fifth presentation,pictures of the NS and SS versions of the drinks, with thecolored labels clearly visible, were shown and subjects had tochoose the drink which they would most want to drink rightnow. During the choice task the chosen drink and the reactiontime with which this drink was chosen (implicit wanting) weremeasured. During the whole procedure subjects were allowedto consume as little or as much of the drinks as they wanted.After the choice task procedure the two drinks were collectedand intake (g) was measured. Subjects were not aware of thefact that intake was measured (implicit intake).
After the drinks were collected subjects proceeded with animplicit association task (IAT) [16]. The IAT is a refined tool tomeasure implicit associations between concepts that arerelated to attitudes and behavior; i.e. it provides insights into
Figure 1. Schematic overview of study design. The study consisted of two periods, and each period had three parts: a pre-measurement, a conditioning period, and a post-measurement. In the conditioning period, subjects were offered a non-caloricsweetened (NS) and sugar sweetened (SS) versions of either a soft drink or a yoghurt drink. In period 1, subjects received either theNS and the SS versions of the soft drinks or the NS and SS versions of the yoghurt drinks. In period 2 these conditions werecounterbalanced. The pre- and post-measurements assessed reward value of the drinks using behavioral tasks and fMRI. Arandomized crossover design was used. The NS and SS versions of a drink were offered in semi-random order, i.e. each productwas offered not more than two days in a row.doi: 10.1371/journal.pone.0081924.g001
Sugar, Non-Caloric Sweeteners, and Reward Value
PLOS ONE | www.plosone.org 3 November 2013 | Volume 8 | Issue 11 | e81924
subconscious liking. In the IAT subjects responded to a seriesof items that were classified into four categories, the NScategory, the SS category, a positive category and a negativecategory.
In the right-hand and left-hand corner of the screen the NSand SS categories were coupled with the positive and negativecategories. Subjects were presented with a series of stimuli inthe center of the screen consisting of either a picture or a wordand they were asked to categorize these to the appropriatecorner by pressing the appropriate key (left or right). Of both
Table 1. Characteristics of the drinks.
Drink LabelEnergy / 100g Ingredients
Softdrinks
NSgreen orpink
0 kJ / 0 kcalwater, sucralose (0.11 g/l), fruitjuice, citric acid, aroma, CO2
SSgreen orpink
167 kJ / 40kcal
water, sucrose (68.6 g/l), fruit juice,citric acid, aroma and CO2
Yoghurtdrinks
NSyellow orblue
167 kJ / 40kcal
skim yogurt, sucralose (0.008 g/l),acesulfame-K (0.013 g/l), fruitjuice, calcium, aroma and vitaminB2, B6, B12
SSyellow orblue
335 kJ / 80kcal
skim yoghurt, sucrose (6.8 g/l), fruitjuice, calcium, aroma and vitaminB2, B6, B12
NS = non-caloric sweetened, SS = sugar sweetened .All test foods (the NS and SS versions of the soft drink and yoghurt drink) weredeveloped and prepared specifically for this experiment (Royal FrieslandCampina,Amersfoort, The Netherlands). The soft drinks were grape/lemon flavored and theyoghurt drinks were cherry flavored. The NS and SS versions of the drinks wereclosely matched in terms of appearance, odor, taste and texture. This wasconfirmed by sensory expert panels (separate panels for the soft and the yoghurtdrinks), consisting of subjects which were screened for taste sensitivity (n=12).Specific procedure for development of the soft drinks: three versions of the NS softdrinks were developed and these were tested against the SS version with a direct-comparison ranking test on sweetness and fruitiness. In addition, a sensoryprofiling test on other attributes was performed. The drinks were semi-monadicallyrated on appearance (light-dark color), odor (fruitiness, oxidation, freshness,complexity), and taste (oxidation, freshness, complexity) on a 100-mm VAS. TheNS variant that was chosen did not significantly differ from the SS version in theranking test and in the sensory profiling test: light-dark color NS 25 vs. SS 27; odorfruitiness NS 62 vs. SS 63; odor oxidation NS 32 vs. SS 32; odor freshness NS 58vs. SS 65; odor complexity NS 60 vs. SS 63; taste oxidation NS 30 vs. SS 30;taste freshness NS 57 vs. SS 67; taste complexity NS 55 vs. SS 63.Specific procedure for the development of the yoghurt drinks: three versions of theNS yoghurt drinks and three versions of the SS yoghurt drinks were developed anda sensory profiling test was performed. The drinks were semi-monadically rated onappearance (light-dark color), odor (sourness, fruitiness), taste (sourness,sweetness, fruitiness), mouth feel (thickness), and aftertaste (sourness, liquorice)on a 100-mm VAS to determine the best match. The match that was choses didnot significantly differ on any of the attributes: light-dark color NS 48 vs. SS 53;odor sourness NS 32 vs. SS 29; odor fruitiness NS 78 vs. SS 78; taste sournessNS 30 vs. SS 30; taste sweetness NS 73 vs. SS 68; taste fruitiness NS 74 vs. SS73; mouthfeel thickness NS 46 vs. SS 46; aftertaste sourness NS 30 vs. SS 33;aftertaste liquorice NS 3 vs. SS 0.doi: 10.1371/journal.pone.0081924.t001
the NS and the SS versions of the drink five different pictureswere used. For the positive associations the following attributeswere used: joy, love, peace, happiness, freedom (in Dutch:plezier, liefde, vrede, geluk, vrijheid). For the negativeassociations the following attributes were used: sadness, hate,war, unhappiness, captivity (in Dutch: verdriet, haat, oorlog,ongeluk, gevangen). Subjects then performed a second taskwhere the pairing of the categories were switched. The IATproduces measures derived from latencies of responses tothese two tasks. These measures are interpreted in terms ofassociation strengths by assuming that subjects respond morerapidly when the concept and attribute mapped onto the sameresponse are strongly associated (e.g. a drink that is rewardedhigher with the positive category) than when they are weaklyassociated (e.g. a drink that is rewarded higher with thenegative category). After finishing the test subjects were free toleave.
Pre- and post-measurements - fMRI. On a separateoccasion, but in the same week as the behavioral task, 18subjects of the total group were scanned between 7:00 and11:00 a.m at the Hospital de Gelderse Vallei (Ede, TheNetherlands). All experimental measurements of one individualtook place at the same time. Subjects were instructed to haverefrained from eating at least 3h before the test. The scansession consisted of 3 functional runs during which 262functional volumes were acquired using a T2*-weightedgradient echo images (EPI), acquired with blood-oxygen level-dependent (BOLD) contrast on a 3-Tesla Siemens MagnetomVerio MRI scanner (Siemens, Erlangen, Germany) equippedwith a 32-channel head coil. Whole-brain fMRI data wereobtained with a T2*-weighted 2D echo-planar imagingsequence (TR=2140ms, TE=25ms, 90° flip angle,FOV=192x192mm, 43 axial slices, ascending order, voxel size3x3x3 mm). The imaging volume was tilted at an oblique angleof 30° to the anterior-posterior commissure line to reducesignal dropout in orbitofrontal and ventral temporal lobes [17].In addition, a high-resolution T1-weighted anatomical MRI scan(MPRAGE, TR=1900ms, TE=2.26ms, 9° flip angle, FOV=256×256mm, 192 sagittal slices, voxel size=0.5×0.5×1mm)was acquired after the second functional run. Each functionalrun consisted of 5 taste events each for SS, NS, tomato juiceand water, leading to a total of 15 taste events per stimulus.During scanning, subjects alternately tasted 2 mL of the NS,the SS, tomato juice and water. They tasted it for 11 sec whilea picture of the drink was shown, followed by a visual cue forswallowing (3 s) and a 4-s rinse with water. Tomato juice(Appelsientje Zontomaat, Ede, The Netherlands) was chosenbecause of its differing sensory characteristic than the targetdrinks, to reduce sensory specific satiety [18]. Water was usedas a control stimulus to be able to account for general tasteand swallow effects. During every functional run liking andwanting of all stimuli was rated on a 9-point hedonic scale withthe use of a button box (6 s), leading to a total of 3 liking and 3wanting ratings per stimulus.
AnalysisData are presented as mean values with standard errors
unless otherwise specified.
Sugar, Non-Caloric Sweeteners, and Reward Value
PLOS ONE | www.plosone.org 4 November 2013 | Volume 8 | Issue 11 | e81924
Behavioral tasks. For the choice task chi-squared analyseswere performed (NS vs. SS). All the other behavioral measures(implicit wanting, implicit intake, explicit wanting, explicit liking,results of the IAT, and expected satiety) were analyzed bymeans of ANOVA (mixed model procedure) with drink type(soft and yoghurt), sweetener type (NS and SS) and time(before and after conditioning) as independent variables. Forboth the implicit wanting and the results of the IAT, theanalyses included all trials with latency longer than 300 ms andshorter than 4,000 ms. We log-transformed response latenciesprior to aggregating data (untransformed latency means arereported in text). The results obtained during the conditioningperiod (hunger ratings and time to first consumption) wereanalyzed by means of ANOVA (mixed model procedure) withdrink type (soft and yoghurt) and sweetener type (NS and SS)as independent variables. In all analyses, both main effectsand interactions between the independent variables wereanalyzed. In addition, subjects were included in all models asrandom factor. Tukey’s test was used for post-hoccomparisons. Analyses were conducted with the use of SAS,9.1 (SAS Institue, Inc., Cary, NC, USA).
fMRI. fMRI data were preprocessed and analyzed with theSPM8 software package (Wellcome Department of ImagingNeuroscience, London, UK) in conjunction with the MarsBartoolbox (http://marsbar.sourceforge.net/) run with MATLAB7.12 (The Mathworks Inc, Natick, MA). The functional volumesof every subject were realigned, globally normalized toMontreal Neurological Institute space (MNI space), andspatially smoothed with an isotropic Gaussian kernel of 8 mmfull width at half maximum. Seven conditions were modeled:delivery of NS, SS, tomato juice, water, swallowing, rinsing andrating. The responses to swallowing, rinsing and rating wereneglected in further analyses. To regress out motion-relatedvariance, the motion-correction parameters from therealignment procedure were added to the model as regressors.
For every subject, parameters were estimated for fourcomparisons per drink type (referred to as contrasts), contrastimages were calculated for tasting NS or SS versus the controlcondition (water), before and after conditioning. Due tomeasurement errors the soft drink data of two subjects weredisregarded because of insufficient data quality.
To test our hypothesis a whole-brain statistical F-map wascreated by performing an ANOVA with sweetener type (NS andSS) and time (before and after conditioning) as independentvariables per drink type (Table S1 and Table S2). We used aregion of interest (ROI) approach that combined a priorianatomical areas of interest with a functional criterion based ona minimum level of responsiveness to food cues and learning[19,20]. On the basis of previous research [9,10] anatomicareas of interest included the orbitofrontal cortex (OFC),amygdala, thalamus, striatum (pallidum, putamen, caudate),cingulate gyrus, hippocampus, precentral gyrys and taste areasidentified in a meta-analysis (we used the complete activationmap available at http://flavor.monell.org/~jlundstrom/index_ALE.html) [21]. Mask images were obtained from theWFU Pickatlas 9 [22]. With the exception of the cingulate andprecentral gyrus, all masks images were dilated one voxel toaccount for anatomical variation and smoothing effects. To
identify functional ROIs (fROIs) both created maps werethresholded at a significance level of p<0.05 and a cluster sizek>8 contiguous voxels. The identified fROIs for tasting softdrinks were: OFC, thalamus, caudate, middle cingulum, rightprecuneus, hippocampus, precentral gyrus, insula, and rolandicoperculum. The identified fROIs for tasting yoghurt drinks were:OFC, amygdala, thalamus, caudate, putamen, middlecingulum, hippocampus, precentral gyrus, and rolandicoperculum. The mean beta value in each fROI was calculatedwith the use of MarsBar, and submitted to an ANOVA (mixedmodel procedure) in SAS. This allowed us to test the effects ofsweetener type (NS and SS) and time (before and afterconditioning) within each fROI for each drink type. Thistechnique represents an unbiased approach to test a priorihypotheses and avoids problems of circularity [19,20].
Results
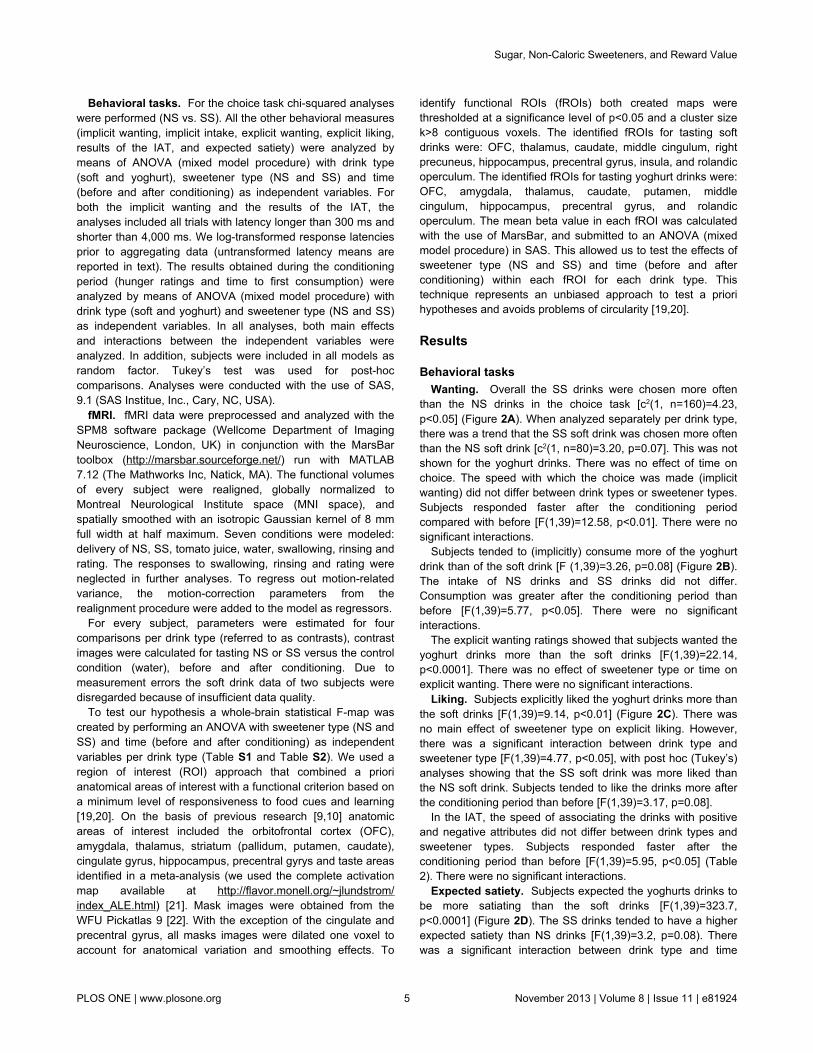
Behavioral tasksWanting. Overall the SS drinks were chosen more often
than the NS drinks in the choice task [c2(1, n=160)=4.23,p<0.05] (Figure 2A). When analyzed separately per drink type,there was a trend that the SS soft drink was chosen more oftenthan the NS soft drink [c2(1, n=80)=3.20, p=0.07]. This was notshown for the yoghurt drinks. There was no effect of time onchoice. The speed with which the choice was made (implicitwanting) did not differ between drink types or sweetener types.Subjects responded faster after the conditioning periodcompared with before [F(1,39)=12.58, p<0.01]. There were nosignificant interactions.
Subjects tended to (implicitly) consume more of the yoghurtdrink than of the soft drink [F (1,39)=3.26, p=0.08] (Figure 2B).The intake of NS drinks and SS drinks did not differ.Consumption was greater after the conditioning period thanbefore [F(1,39)=5.77, p<0.05]. There were no significantinteractions.
The explicit wanting ratings showed that subjects wanted theyoghurt drinks more than the soft drinks [F(1,39)=22.14,p<0.0001]. There was no effect of sweetener type or time onexplicit wanting. There were no significant interactions.
Liking. Subjects explicitly liked the yoghurt drinks more thanthe soft drinks [F(1,39)=9.14, p<0.01] (Figure 2C). There wasno main effect of sweetener type on explicit liking. However,there was a significant interaction between drink type andsweetener type [F(1,39)=4.77, p<0.05], with post hoc (Tukey’s)analyses showing that the SS soft drink was more liked thanthe NS soft drink. Subjects tended to like the drinks more afterthe conditioning period than before [F(1,39)=3.17, p=0.08].
In the IAT, the speed of associating the drinks with positiveand negative attributes did not differ between drink types andsweetener types. Subjects responded faster after theconditioning period than before [F(1,39)=5.95, p<0.05] (Table2). There were no significant interactions.
Expected satiety. Subjects expected the yoghurts drinks tobe more satiating than the soft drinks [F(1,39)=323.7,p<0.0001] (Figure 2D). The SS drinks tended to have a higherexpected satiety than NS drinks [F(1,39)=3.2, p=0.08). Therewas a significant interaction between drink type and time
Sugar, Non-Caloric Sweeteners, and Reward Value
PLOS ONE | www.plosone.org 5 November 2013 | Volume 8 | Issue 11 | e81924
[F(1,39)=8.0, p<0.01), with post hoc (Tukey’s) analysesshowing that after the conditioning period, the soft drinks wererated as more satiating than before.
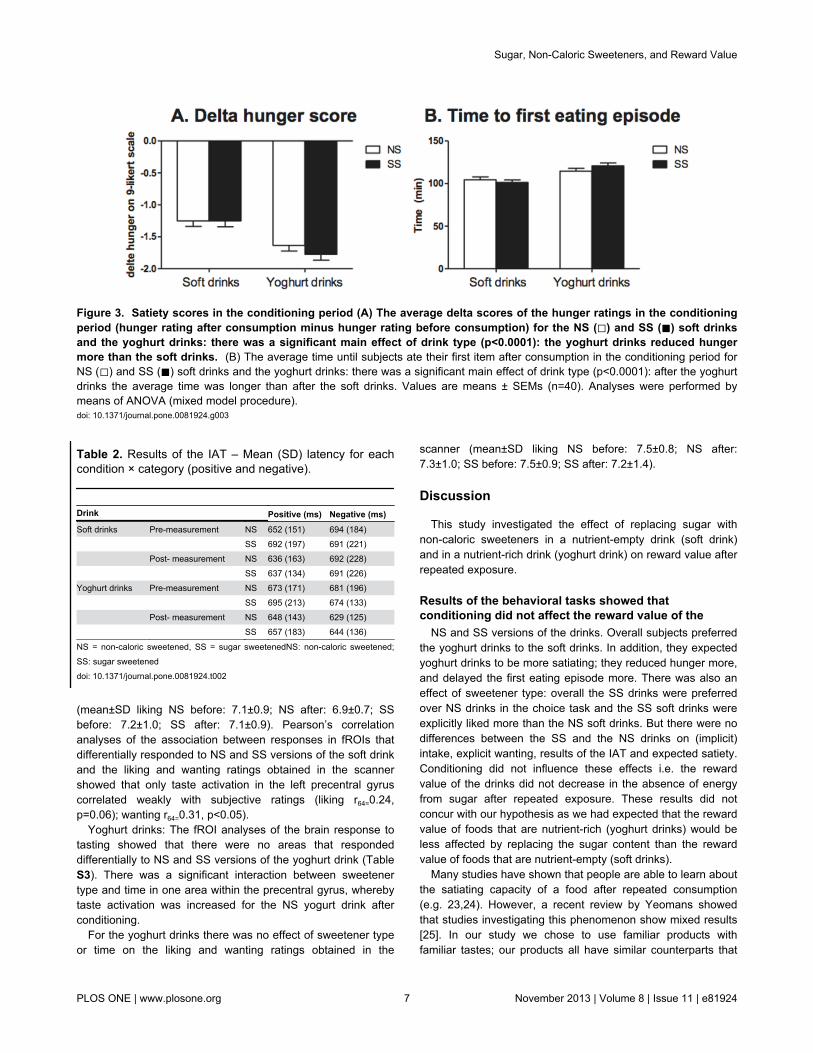
Satiety scores in the conditioning period. Analyses onthe average delta scores of the hunger ratings in theconditioning period (hunger rating after consumption minushunger rating before consumption) showed that the yoghurtdrinks reduced hunger more than the soft drinks[F(1,39)=52.45, p<0.0001]. There was no effect of sweetenertype, and there were no significant interactions (Figure 3A).
The average time until subjects ate their first item afterconsumption of the drinks in the conditioning period was longerafter the yoghurt drinks than after the soft drinks[F(1,32)=23.22, p<0.0001]. Again, there was no effect ofsweetener type or interactions (Figure 3B).
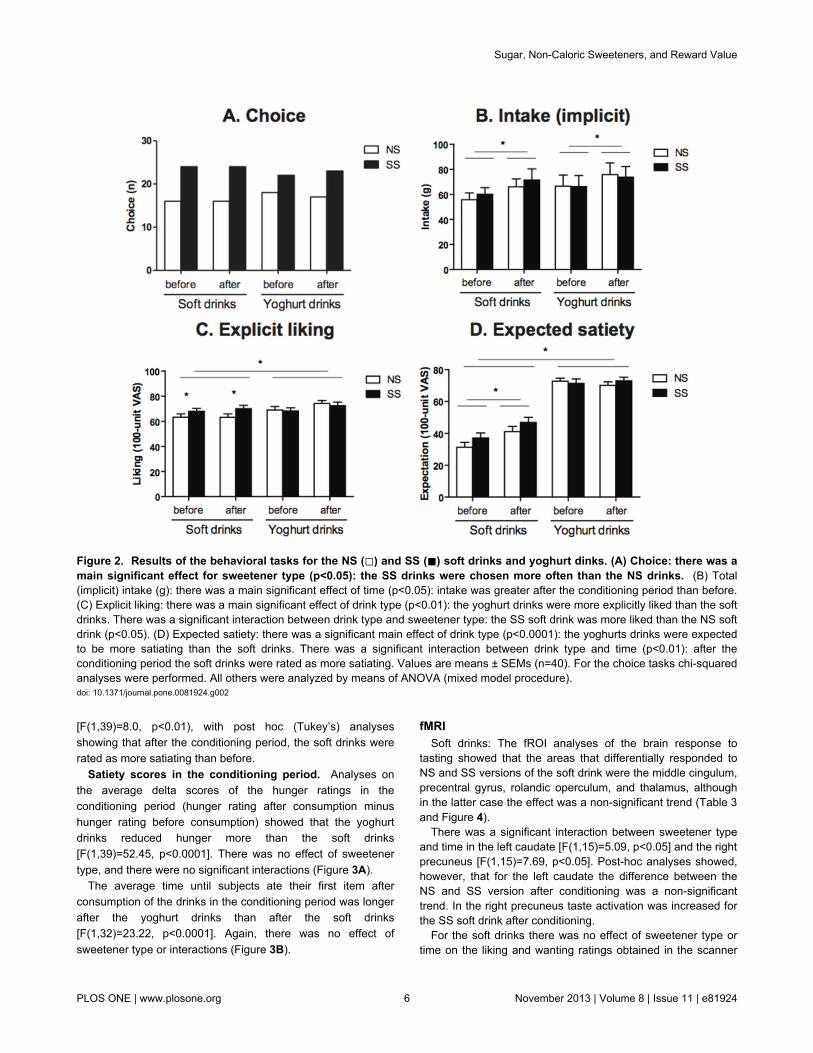
fMRISoft drinks: The fROI analyses of the brain response to
tasting showed that the areas that differentially responded toNS and SS versions of the soft drink were the middle cingulum,precentral gyrus, rolandic operculum, and thalamus, althoughin the latter case the effect was a non-significant trend (Table 3and Figure 4).
There was a significant interaction between sweetener typeand time in the left caudate [F(1,15)=5.09, p<0.05] and the rightprecuneus [F(1,15)=7.69, p<0.05]. Post-hoc analyses showed,however, that for the left caudate the difference between theNS and SS version after conditioning was a non-significanttrend. In the right precuneus taste activation was increased forthe SS soft drink after conditioning.
For the soft drinks there was no effect of sweetener type ortime on the liking and wanting ratings obtained in the scanner
Figure 2. Results of the behavioral tasks for the NS (◻) and SS (◼) soft drinks and yoghurt dinks. (A) Choice: there was amain significant effect for sweetener type (p<0.05): the SS drinks were chosen more often than the NS drinks. (B) Total(implicit) intake (g): there was a main significant effect of time (p<0.05): intake was greater after the conditioning period than before.(C) Explicit liking: there was a main significant effect of drink type (p<0.01): the yoghurt drinks were more explicitly liked than the softdrinks. There was a significant interaction between drink type and sweetener type: the SS soft drink was more liked than the NS softdrink (p<0.05). (D) Expected satiety: there was a significant main effect of drink type (p<0.0001): the yoghurts drinks were expectedto be more satiating than the soft drinks. There was a significant interaction between drink type and time (p<0.01): after theconditioning period the soft drinks were rated as more satiating. Values are means ± SEMs (n=40). For the choice tasks chi-squaredanalyses were performed. All others were analyzed by means of ANOVA (mixed model procedure).doi: 10.1371/journal.pone.0081924.g002
Sugar, Non-Caloric Sweeteners, and Reward Value
PLOS ONE | www.plosone.org 6 November 2013 | Volume 8 | Issue 11 | e81924
(mean±SD liking NS before: 7.1±0.9; NS after: 6.9±0.7; SSbefore: 7.2±1.0; SS after: 7.1±0.9). Pearson’s correlationanalyses of the association between responses in fROIs thatdifferentially responded to NS and SS versions of the soft drinkand the liking and wanting ratings obtained in the scannershowed that only taste activation in the left precentral gyruscorrelated weakly with subjective ratings (liking r64=0.24,p=0.06); wanting r64=0.31, p<0.05).
Yoghurt drinks: The fROI analyses of the brain response totasting showed that there were no areas that respondeddifferentially to NS and SS versions of the yoghurt drink (TableS3). There was a significant interaction between sweetenertype and time in one area within the precentral gyrus, wherebytaste activation was increased for the NS yogurt drink afterconditioning.
For the yoghurt drinks there was no effect of sweetener typeor time on the liking and wanting ratings obtained in the
Table 2. Results of the IAT – Mean (SD) latency for eachcondition × category (positive and negative).
Drink Positive (ms) Negative (ms)Soft drinks Pre-measurement NS 652 (151) 694 (184) SS 692 (197) 691 (221) Post- measurement NS 636 (163) 692 (228) SS 637 (134) 691 (226)Yoghurt drinks Pre-measurement NS 673 (171) 681 (196) SS 695 (213) 674 (133) Post- measurement NS 648 (143) 629 (125) SS 657 (183) 644 (136)
NS = non-caloric sweetened, SS = sugar sweetenedNS: non-caloric sweetened;SS: sugar sweeteneddoi: 10.1371/journal.pone.0081924.t002
scanner (mean±SD liking NS before: 7.5±0.8; NS after:7.3±1.0; SS before: 7.5±0.9; SS after: 7.2±1.4).
Discussion
This study investigated the effect of replacing sugar withnon-caloric sweeteners in a nutrient-empty drink (soft drink)and in a nutrient-rich drink (yoghurt drink) on reward value afterrepeated exposure.
Results of the behavioral tasks showed thatconditioning did not affect the reward value of the
NS and SS versions of the drinks. Overall subjects preferredthe yoghurt drinks to the soft drinks. In addition, they expectedyoghurt drinks to be more satiating; they reduced hunger more,and delayed the first eating episode more. There was also aneffect of sweetener type: overall the SS drinks were preferredover NS drinks in the choice task and the SS soft drinks wereexplicitly liked more than the NS soft drinks. But there were nodifferences between the SS and the NS drinks on (implicit)intake, explicit wanting, results of the IAT and expected satiety.Conditioning did not influence these effects i.e. the rewardvalue of the drinks did not decrease in the absence of energyfrom sugar after repeated exposure. These results did notconcur with our hypothesis as we had expected that the rewardvalue of foods that are nutrient-rich (yoghurt drinks) would beless affected by replacing the sugar content than the rewardvalue of foods that are nutrient-empty (soft drinks).
Many studies have shown that people are able to learn aboutthe satiating capacity of a food after repeated consumption(e.g. 23,24). However, a recent review by Yeomans showedthat studies investigating this phenomenon show mixed results[25]. In our study we chose to use familiar products withfamiliar tastes; our products all have similar counterparts that
Figure 3. Satiety scores in the conditioning period (A) The average delta scores of the hunger ratings in the conditioningperiod (hunger rating after consumption minus hunger rating before consumption) for the NS (◻) and SS (◼) soft drinksand the yoghurt drinks: there was a significant main effect of drink type (p<0.0001): the yoghurt drinks reduced hungermore than the soft drinks. (B) The average time until subjects ate their first item after consumption in the conditioning period forNS (◻) and SS (◼) soft drinks and the yoghurt drinks: there was a significant main effect of drink type (p<0.0001): after the yoghurtdrinks the average time was longer than after the soft drinks. Values are means ± SEMs (n=40). Analyses were performed bymeans of ANOVA (mixed model procedure).doi: 10.1371/journal.pone.0081924.g003
Sugar, Non-Caloric Sweeteners, and Reward Value
PLOS ONE | www.plosone.org 7 November 2013 | Volume 8 | Issue 11 | e81924

are commercially available. By using familiar stimuli we wereable to investigate the process of ‘unlearning’ – will repeatedexposure to a product, with reduced energy content, changethe previously learned association between the sensoryproperties of the food and its (expected) satiation and rewardvalue? Our results show that this did not occur; i.e. theassociation between the sensory properties of the drinks andtheir reward value was not unlearnt in the absence of energy.
Our results do show that from the start of the experiment, the- thicker - yoghurt drinks were expected to be more satiating;they reduced hunger more, and delayed the first eating episodemore than the - thinner - soft drinks, despite similar energycontent of the NS yoghurt drink and the SS soft drink. Thissuggests that the sensory aspects of the drink, like for instanceits viscosity, influenced (expected) satiety and reward valuemore than the energy content, and that these sensory effectswere robust over repeated exposure. This is in accord withstudies which show that texture has a large effect on satietyexpectations (e.g. 26,27). In addition, the association betweendairy and energy is already learned during infancy which is the
most sensitive period for learning associations betweensensory signals and metabolic consequences [28]. Our resultsuggests that learned associations between the sensoryattributes of a food and its satiating capacity are quite robustand not easily adapted if energy content is altered. Aside fromthe enhanced satiety effect, the yoghurt drink had in generalalso a higher reward value than the soft drinks (higher wantingand liking). This could be due to the fact that we conducted oursessions in the morning and yoghurt drinks were considered amore suitable replacement for breakfast.
As mentioned earlier, we chose to use familiar products infamiliar volumes to enhance the ecological validity of ourresults. The difference in energy between the NS and the SSversion for the males was 670 kJ/160 kcal and for the females502 kJ/120 kcal, which might be viewed as a small difference.The recent review of Yeomans [25] however shows that thesequantities have been used in earlier studies where conditioningresults have been reported. In addition, instead of using themore traditional approach of using different flavors to enable‘unlearning’, we chose to use colored labels as a discriminator
Table 3. Identified fROIs and results of analysis on mean beta value in each fROI for tasting soft drinks.a
fROI Peak voxel coordinates of fROI BA Cluster size (voxels) F peak voxel Main effect sweetener type Sweetener type x Time x y z p pOFC L Medial Frontal gyrus -6 59 -14 11 72 5.4 0.91 0.34L Inferior Frontal gyrus -39 32 -5 47 9 2.8 0.95 0.18R Middle Frontal gyrus 27 62 -8 11 11 3.9 0.16 0.49R Superior Frontal gyrus 24 35 -17 11 10 3.4 0.93 0.46R Medial Frontal gyrus 9 59 -14 11 9 3.0 0.53 0.11R Superior Temporal Pole 51 17 -2 38 14 3.8 0.80 0.13Thalamus Thalamus -6 -10 10 - 336 8.1 0.07 0.05Striatum L Caudate -18 8 16 - 136 6.6 0.20 0.04R Caudate 18 17 13 - 255 8.1 0.50 0.11Cingulate gyrus Middle Cingulum 9 -1 34 24 240 8.9 0.02 0.73R Precunues 9 -52 25 23 105 6.8 0.68 0.01Hippocampus L Hippocampus -33 -34 -5 37 27 6.6 0.70 0.08R Hippocampus 30 -37 4 37 9 4.7 0.29 0.86Precentral Gyrus L Precentral gyrus -51 -10 7 48 58 6.4 0.01 0.89L Precentral gyrus -51 -16 28 48 191 4.2 0.17 0.69L Precentral gyrus -24 -25 52 - 15 3.4 0.29 0.14R Precentral gyrus 48 -4 34 4 326 6.4 0.01 0.84R Precentral gyrus 36 -19 46 3 51 4.7 0.21 0.12Taste map L Insula -42 -1 4 48 12 4.6 0.12 0.70R Insula 33 17 10 48 55 5.7 0.23 0.62L Rolandic operculum -48 -16 19 48 24 4.5 0.09 0.17R Rolandic operculum 48 -7 13 48 49 5.6 0.01 0.69a The F map was thresholded at F=2.53, p<0.05, uncorrected for multiple comparisons, with a cluster extent threshold k>8 contiguous voxels. BA=Brodmann areas. L = Left,R=Right hemispheredoi: 10.1371/journal.pone.0081924.t003
Sugar, Non-Caloric Sweeteners, and Reward Value
PLOS ONE | www.plosone.org 8 November 2013 | Volume 8 | Issue 11 | e81924
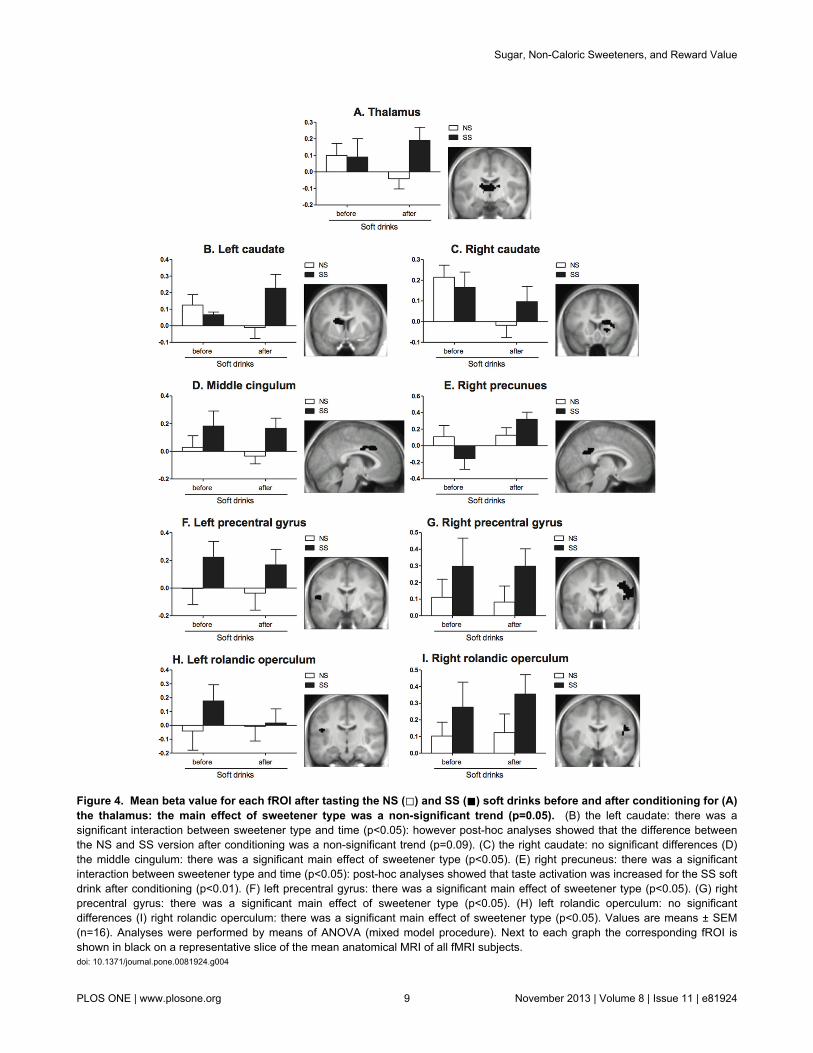
Figure 4. Mean beta value for each fROI after tasting the NS (◻) and SS (◼) soft drinks before and after conditioning for (A)the thalamus: the main effect of sweetener type was a non-significant trend (p=0.05). (B) the left caudate: there was asignificant interaction between sweetener type and time (p<0.05): however post-hoc analyses showed that the difference betweenthe NS and SS version after conditioning was a non-significant trend (p=0.09). (C) the right caudate: no significant differences (D)the middle cingulum: there was a significant main effect of sweetener type (p<0.05). (E) right precuneus: there was a significantinteraction between sweetener type and time (p<0.05): post-hoc analyses showed that taste activation was increased for the SS softdrink after conditioning (p<0.01). (F) left precentral gyrus: there was a significant main effect of sweetener type (p<0.05). (G) rightprecentral gyrus: there was a significant main effect of sweetener type (p<0.05). (H) left rolandic operculum: no significantdifferences (I) right rolandic operculum: there was a significant main effect of sweetener type (p<0.05). Values are means ± SEM(n=16). Analyses were performed by means of ANOVA (mixed model procedure). Next to each graph the corresponding fROI isshown in black on a representative slice of the mean anatomical MRI of all fMRI subjects.doi: 10.1371/journal.pone.0081924.g004
Sugar, Non-Caloric Sweeteners, and Reward Value
PLOS ONE | www.plosone.org 9 November 2013 | Volume 8 | Issue 11 | e81924
as previous studies have shown food likes and preferences canbe developed using this approach [15]. Our main reason forchoosing to use NS and SS variants with the same flavor wasto miminize the chance that the initial reward value would bedifferent.
It is however interesting that, independent of conditioning,the SS soft drinks were explicitly liked more and tended to bechosen over the NS drink in the choice task. In a study byZandstra et al. [15] it was shown that after five exposures to ahigh- or low-energy drink, subjects chose the high-energy drinksignificantly more often than the low-energy drink which madethe authors suggest that they found a conditioned preferencefor a (energy) reward. Unfortunately, this study did not includea baseline measurement, which in light of our findings raisesthe question whether there was a learning effect or whetherthere was already a preference before conditioning.
Our results show that subjects already preferred the SS softdrink over the NS soft drink at the pre-measurement althoughthe NS and SS versions of the drinks were carefully tested bysensory expert panels prior to the study to ensure a similarprofile. As we chose to perform sensory analysis of the drinksby expert panels rather than by the subjects in the mainexperiment, to prevent that subjects would focus their attentionon the sensory aspects of the drinks, we cannot exclude thepossibility that individual differences in taste sensitivity for e.g.sweeteners account for the preference for the sugar-sweetened drinks. In our study we used several behavioralmeasures to assess food reward. The results show that the SSdrinks were preferred over NS drinks in the choice task and theSS soft drinks were explicitly liked more than the NS softdrinks. But there were no differences between the SS and theNS drinks on (implicit) intake, explicit wanting, results of theIAT and expected satiety. It has been shown in earlier studiesthat rank order testing appears to be more sensitive indiscriminating between products than nomadic ratings [15,29].In addition, we added fMRI measurements which gave us theopportunity to further investigate the mechanisms underlyingchanges in the behavioral measures. The fMRI data showedthat the only areas that instantly differentially responded to SSand NS drinks, were the middle cingulum, the precentral gyrusand rolandic operculum, and only in soft drinks. There weresome indications that conditioning with the soft drinks affectedtaste activation in the striatum, thalamus and right precuneus(energy x time interaction). However, these effects were mostlytrends (left caudate and thalamus) and non-significant (rightcaudate) and therefore need to be interpreted with caution. Forthe yoghurt drinks we did not see a difference in responses inany brain area. Several fMRI studies have shown that the braincan differentiate between sugar and sweeteners in severalreward areas [9,10]. It has been suggested, however, thatthese effects might be modulated by the frequency of artificialsweetener use [11,30]. We excluded extreme diet productusers which could have interfered with our results. In addition,the reported differences between sugar and sweeteners ontaste activation are not consistent. It appears that the outcomesof these kind of studies depend heavily on between-studydifferences in experimental design such as the type, number,and hunger state of subjects, the type of stimuli and the type of
administration [9,11,30]. Although this makes it challenging todraw clear conclusions and warrants careful interpretations,such studies do advance our understanding of the complexityof the neural mechanisms underlying the regulation ofeating behavior.
Within our study it was interesting that the majority of areasthat differently responded to the SS and NS versions of the softdrinks (the precentral gyrus and rolandic operculum) were inthe primary sensory areas. This leads us to assume thatindeed, although the drinks were matched on sensorycharacteristics, the taste differences associated with the use ofnon-caloric sweeteners were not completely covered. This mayhave caused the preference for the SS drinks, presumably dueto the subjects' prior experience with SS and NS drinks and theflavor differences between sucrose and sucralose. That thiseffect is larger in the soft drinks concurs with the brain data.Future studies should include prior taste measurements amongstudy participants to take individual differences in tastesensitivity into account.
It is still interesting that although it appeared there were tastedifferences, enhancing the discrimination factor between theNS and the SS versions of the drinks, this was not translatedinto ‘unlearning behavior’. i.e., conditioning with the SS and theNS version had similar impact on feelings hunger after drinkconsumption and on the average time to eating the first item.There is currently still a lot of discussion regarding the role oflow-caloric sweeteners in weight management [31-41].. Thefinding that learned satiety and food preference is notcompletely dependent on energy content suggests that the useof products with low-caloric sweeteners might be effective forweight management. In line with this, many studies haveconcluded that long-term, high-quality, adequately poweredrandomized controlled trials are required to assess therelationship between the use of non-caloric sweeteners andweight control (e.g. 33,40).
To conclude, our study showed that repeated consumption ofa non-caloric sweetened beverage, instead of a sugarsweetened version, appears not to result in changes in thereward value. It cannot be ruled out that learned associationsbetween sensory attributes and food satiating capacity whichdeveloped preceding the conditioning period, during lifetime,affected the reward value of the drinks.
Our data indicate that the learned associations betweensensory attributes and food satiating capacity are quite robustand difficult to alter. These results need to be confirmed infuture experiments.
Supporting Information
Figure S1. Flow diagram of the progress through thephases of the study.(TIFF)
Table S1. Whole-brain statistical F-map with sweetenertype and time as independent variables for tasting softdrinks.(DOCX)
Sugar, Non-Caloric Sweeteners, and Reward Value
PLOS ONE | www.plosone.org 10 November 2013 | Volume 8 | Issue 11 | e81924
Table S2. Whole-brain statistical F-map with sweetenertype and time as independent variables for tasting yoghurtdrinks.(DOCX)
Table S3. Identified fROIs and results of analysis on meanbeta value in each fROI. For tasting yoghurt drinks.(DOCX)
Acknowledgements
We thank Jeni Anggrek, Karin Bonet, Ilse de Jager and Emmyvan den Heuvel for their help in carrying out the study. The use
of the 3T fMRI facility has been made possible by CAT-AgroFood (Shared Research Facilities Wageningen UR).
Author Contributions
Conceived and designed the experiments: SG PS PW CG.Performed the experiments: SG IR. Analyzed the data: SG IB.Wrote the manuscript: SG. Interpretations of the data: SG PSPW IR IB CG. Critical revision of the manuscript: SG PS PW IRIB CG.
References
1. Finucane MM, Stevens GA, Cowan MJ, Danaei G, Lin JK et al. (2011)National, regional, and global trends in body-mass index since 1980:systematic analysis of health examination surveys and epidemiologicalstudies with 960 country-years and 9·1 million participants. Lancet 377:557-567. doi:10.1016/S0140-6736(10)62037-5. PubMed: 21295846.
2. WHO (2007) Protein and amino acid requirements in human nutrition.Report of a Joint WHO/FAO/UNU Expert Consultation. Geneva: WorldHealth Organization.
3. Nishida C, Uauy R, Kumanyika S, Shetty P (2004) The Joint WHO/FAOExpert Consultation on diet, nutrition and the prevention of chronicdiseases: process, product and policy implications. Public Health Nutr7: 245–250. PubMed: 14972063.
4. American Dietetic Associationuni (2011) The Truth about ArtificialSweeteners or Sugar Substitutes. Presented by the ADA EvidenceAnalysis Library.
5. Het Europees Parlement en de Raad van de Europese Unie (2006)Verordening (EG) Nr. 1924/2006 inzake voedings- engezondheidsclaims voor levensmiddelen
6. U.S. Food and Drug Administration (FDA) (September 1994; RevisedApril 2008; Revised (October 2009). Guidance for Industry: a FoodLabeling Guide.
7. Booth DA (1972) Conditioned satiety in the rat. J Comp Physiol Psychol81: 457-471. doi:10.1037/h0033692. PubMed: 4649186.
8. Booth DA (1985) Food-conditioned eating preferences and aversionswith interoceptive elements - conditioned appetites and satieties. Ann NY Acad Sci 443: 22-41. doi:10.1111/j.1749-6632.1985.tb27061.x.PubMed: 3860073.
9. Smeets PAM, Weijzen P, de Graaf C, Viergever MA (2011)Consumption of caloric and non-caloric versions of a soft drinkdifferentially affects brain activation during tasting. NeuroImage 54:1367-1374. doi:10.1016/j.neuroimage.2010.08.054. PubMed:20804848.
10. Frank GKW, Oberndorfer TA, Simmons AN, Paulus MP, Fudge JL et al.(2008) Sucrose activates human taste pathways differently fromartificial sweetener. NeuroImage 39: 1559-1569. doi:10.1016/j.neuroimage.2007.10.061. PubMed: 18096409.
11. Rudenga KJ, Small DM (2012) Amygdala response to sucroseconsumption is inversely related to artificial sweetener use. Appetite 58:504-507. doi:10.1016/j.appet.2011.12.001. PubMed: 22178008.
12. Chambers ES, Bridge MW, Jones DA (2009) Carbohydrate sensing inthe human mouth: effects on exercise performance and brain activity. JPhysiol 587: 1779-1794. doi:10.1113/jphysiol.2008.164285. PubMed:19237430.
13. Smeets PA, de Graaf C, Stafleu A, van Osch MJ, van der Grond J(2005) Functional magnetic resonance imaging of human hypothalamicresponses to sweet taste and calories. Am J Clin Nutr 82: 1011-1016.PubMed: 16280432.
14. Van Strien T (2005) Dutch Eating Behavior Questionnaire manual(Nederlandse Vragenlijst voor eetgedrag Handleiding). Amsterdam:Boom Test Publishers.
15. Zandstra EH, El-Deredy W (2011) Effects of energy conditioning onfood preferences and choice. Appetite 57: 45-49. doi:10.1016/j.appet.2011.05.288. PubMed: 21440593.
16. Greenwald AG, McGhee DE, Schwartz JL (1998) Measuring individualdifferences in implicit cognition: the implicit association test. J Pers SocPsychol 74: 1464-1480. doi:10.1037/0022-3514.74.6.1464. PubMed:9654756.
17. Deichmann R, Gottfried JA, Hutton C, Turner R (2003) Optimized EPIfor fMRI studies of the orbitofrontal cortex. NeuroImage 19: 430-441.doi:10.1016/S1053-8119(03)00073-9. PubMed: 12814592.
18. Rolls BJ, Rolls ET, Rowe EA, Sweeney K (1981) Sensory specificsatiety in man. Physiol Behav 27: 137-142. doi:10.1016/0031-9384(81)90310-3. PubMed: 7267792.
19. Mehta S, Melhorn SJ, Smeraglio A, Tyagi V, Grabowski T et al. (2012)Regional brain response to visual food cues is a marker of satiety thatpredicts food choice. Am J Clin Nutr 96: 989-999. doi:10.3945/ajcn.112.042341. PubMed: 22990034.
20. Siep N, Roefs A, Roebroeck A, Havermans R, Bonte ML et al. (2009)Hunger is the best spice: an fMRI study of the effects of attention,hunger, calorie content on food reward processing in the amygdala andorbitofrontal cortex. Behav Brain Res 198: 149-158. doi:10.1016/j.bbr.2008.10.035. PubMed: 19028527.
21. Veldhuizen MG, Albrecht J, Zelano C, Boesveldt S, Breslin P et al.(2011) Identification of human gustatory cortex by activation likelihoodestimation. Hum Brain Mapp 32: 2256-2266. doi:10.1002/hbm.21188.PubMed: 21305668.
22. Maldjian JA, Laurienti PJ, Kraft RA, Burdette JH (2003) An automatedmethod for neuroanatomic and cytoarchitectonic atlas-basedinterrogation of fMRI data sets. NeuroImage 19: 1233-1239. doi:10.1016/S1053-8119(03)00169-1. PubMed: 12880848.
23. Hogenkamp PS, Stafleu A, Mars M, de Graaf C (2012) Learning aboutthe energy density of liquid and semi-solid foods. Int J Obes (Lond) 36:1229-1235. doi:10.1038/ijo.2011.231. PubMed: 22143621.
24. Yeomans MR, Gould NJ, Leitch M, Mobini S (2009) Effects of energydensity and portion size on development of acquired flavour liking andlearned satiety. Appetite 52: 469-478. doi:10.1016/j.appet.2008.12.010.PubMed: 19136035.
25. Yeomans MR (2012) Flavour–nutrient learning in humans: An elusivephenomenon? Physiology and Behavior 106: 345-355.
26. Hogenkamp PS, Stafleu A, Mars M, Brunstrom JM, de Graaf C (2011)Texture, not flavor, determines expected satiation of dairy products.Appetite 57: 635-641. doi:10.1016/j.appet.2011.08.008. PubMed:21871509.
27. McCrickerd K, Chambers L, Brunstrom J, Yeomans M (2012) Subtlechanges in the flavour and texture of a drink enhance expectations ofsatiety. Flavour 1: 20. doi:10.1186/2044-7248-1-20.
28. Mennella JA (1995) Mother's Milk: A Medium for Early FlavorExperiences. J Hum Lact 11: 39-45. doi:10.1177/089033449501100122. PubMed: 7748264.
29. De Graaf C, Zandstra EH (1999) Sweetness Intensity andPleasantness in Children, Adolescents, and Adults. Physiol Behav 67:513-520. doi:10.1016/S0031-9384(99)00090-6. PubMed: 10549887.
30. Green E, Murphy C (2012) Altered processing of sweet taste in thebrain of diet soda drinkers. Physiol Behav 107: 560-567. doi:10.1016/j.physbeh.2012.05.006. PubMed: 22583859.
31. Anderson GH, Foreyt J, Sigman-Grant M, Allison DB (2012) The Use ofLow-Calorie Sweeteners by Adults: Impact on Weight. Management - JNutr 142: 1163s-1169s. doi:10.3945/jn.111.149617.
32. Bellisle F, Drewnowski A (2007) Intense sweeteners, energy intake andthe control of body weight. Eur J Clin Nutr 61: 691-700. doi:10.1038/sj.ejcn.1602649. PubMed: 17299484.
33. De La Hunty A, Gibson S, Ashwell M (2006) A review of theeffectiveness of aspartame in helping with weight control. Nutr Bull 31:115-128. doi:10.1111/j.1467-3010.2006.00564.x.
Sugar, Non-Caloric Sweeteners, and Reward Value
PLOS ONE | www.plosone.org 11 November 2013 | Volume 8 | Issue 11 | e81924
34. de Ruyter JC, Olthof MR, Seidell JC, Katan MB (2012) A Trial of Sugar-free or Sugar-Sweetened Beverages and Body Weight in Children. NEngl J Med 367: 1397-1406. doi:10.1056/NEJMoa1203034. PubMed:22998340.
35. Raben A, Vasilaras TH, Møller AC, Astrup A (2002) Sucrose comparedwith artificial sweeteners: different effects on ad libitum food intake andbody weight after 10 wk of supplementation in overweight subjects. AmJ Clin Nutr 76: 721-729. PubMed: 12324283.
36. Schulze MB, Manson JE, Ludwig DS, Colditz GA, Stampfer MJ et al.(2004) Sugar-sweetened beverages, weight gain, and incidence of type2 diabetes in young and middle-aged women. JAMA 292: 927-934. doi:10.1001/jama.292.8.927. PubMed: 15328324.
37. Swithers SE, Martin AA, Davidson TL (2010) High-intensity sweetenersand energy balance. Physiol Behav 100: 55-62. doi:10.1016/j.physbeh.2009.12.021. PubMed: 20060008.
38. Tate DF, Turner-McGrievy G, Lyons E, Stevens J, Erickson K et al.(2012) Replacing caloric beverages with water or diet beverages for
weight loss in adults: main results of the Choose Healthy OptionsConsciously Everyday (CHOICE) randomized clinical trial. Am J ClinNutr 95: 555-563. doi:10.3945/ajcn.111.026278. PubMed: 22301929.
39. Tordoff MG, Alleva AM (1990) Effect of drinking soda sweetened withaspartame or high-fructose corn syrup on food intake and body weight.Am J Clin Nutr 51: 963-969. PubMed: 2349932.
40. Wiebe N, Padwal R, Field C, Marks S, Jacobs R et al. (2011) Asystematic review on the effect of sweeteners on glycemic responseand clinically relevant outcomes. BMC Med 9: 123. doi:10.1186/1741-7015-9-123. PubMed: 22093544.
41. Fowler SP, Williams K, Resendez RG, Hunt KJ, Hazuda HP et al.(2008) Fueling the Obesity Epidemic? Artificially Sweetened BeverageUse and Long-term Weight Gain. Obesity (Silver Spring) 16:1894-1900. doi:10.1038/oby.2008.284. PubMed: 18535548.
Sugar, Non-Caloric Sweeteners, and Reward Value
PLOS ONE | www.plosone.org 12 November 2013 | Volume 8 | Issue 11 | e81924
Related Documents