IJoASER, Volume 1, Issue 1, March 2018, ISSN 26148862 9 Effect of Product Quality, Price, and Promotion to Purchase Decision Lita Limpo *1 , Abdul Rahim 2 , Hamzah 3 *1 Faculty of Economics, Universitas Atma Jaya Makassar, Indonesia e-mail: [email protected] 2 Institut Agama Islam Negeri (IAIN) Watampone, Indonesia 3 Fakultas Ekonomi dan Bisnis Islam, Universitas Islam Negeri Alauddin, Makassar, Indonesia Abstract—This study aims to analyze the influence of product quality, price, and promotion of purchasing decision in Indonesia. The data used taken from some Indonesian people who usually drink local tea. The purposive sampling method used in the selection of respondents involving ninety-two people. The results of this study partially indicate that quality had a significant and positive effect on purchasing decisions by sixty percent. Price had a significant and positive effect on purchasing by forty-two percent. The promotion had a significant and positive effect on purchasing decisions by fifty percent. Simultaneously, the quality, price, and promotion significantly affected the purchase decision by seventy-two percent. Keywords—Product quality; price; promotion; purchase decision I. INTRODUCTION A very rapid and dynamic business developments world influence the actions of producers in a marketing strategy. Changes that occur require manufacturers always to be more creative, innovative, follow the direction of change and adapt to consumers who play an essential role in purchasing decisions. Buying decisions from consumers to buy a product is an integral part of a company's production. Purchasing decisions are the selection of two choices or more consumers on purchases [1]. Everyday consumers make decisions about aspects of daily life. However, sometimes the decision was taken without thinking about how to make decisions and what is involved in this decision-making process. Choices must be available to a person when making decisions. Many factors influence purchasing decisions. Promotion, price, value, and quality of a product can affect a person to make a purchase [2]–[5]. Promotion factors also need to be considered considering today's information becomes a critical consideration for consumers. As one of the marketing elements, promotion plays a small role in consumer purchasing decisions. The success of marketers strategy in attracting consumers depends on the ability of the company to consider other elements, such as marketing communication [6]. However, managing the distribution is also crucial to support marketing services [7].

Welcome message from author
This document is posted to help you gain knowledge. Please leave a comment to let me know what you think about it! Share it to your friends and learn new things together.
Transcript

IJoASER, Volume 1, Issue 1, March 2018, ISSN 26148862
9
Effect of Product Quality, Price, and Promotion to Purchase Decision
Lita Limpo*1, Abdul Rahim2, Hamzah3
*1Faculty of Economics, Universitas Atma Jaya Makassar, Indonesia
e-mail: [email protected]
2Institut Agama Islam Negeri (IAIN) Watampone, Indonesia
3Fakultas Ekonomi dan Bisnis Islam, Universitas Islam Negeri Alauddin, Makassar,
Indonesia
Abstract—This study aims to analyze the influence of product quality, price, and
promotion of purchasing decision in Indonesia. The data used taken from some
Indonesian people who usually drink local tea. The purposive sampling method used in
the selection of respondents involving ninety-two people. The results of this study
partially indicate that quality had a significant and positive effect on purchasing
decisions by sixty percent. Price had a significant and positive effect on purchasing by
forty-two percent. The promotion had a significant and positive effect on purchasing
decisions by fifty percent. Simultaneously, the quality, price, and promotion
significantly affected the purchase decision by seventy-two percent.
Keywords—Product quality; price; promotion; purchase decision
I. INTRODUCTION
A very rapid and dynamic business developments world influence the
actions of producers in a marketing strategy. Changes that occur require
manufacturers always to be more creative, innovative, follow the direction of
change and adapt to consumers who play an essential role in purchasing
decisions. Buying decisions from consumers to buy a product is an integral
part of a company's production. Purchasing decisions are the selection of two
choices or more consumers on purchases [1]. Everyday consumers make
decisions about aspects of daily life. However, sometimes the decision was
taken without thinking about how to make decisions and what is involved in
this decision-making process. Choices must be available to a person when
making decisions.
Many factors influence purchasing decisions. Promotion, price, value, and
quality of a product can affect a person to make a purchase [2]–[5]. Promotion
factors also need to be considered considering today's information becomes a
critical consideration for consumers. As one of the marketing elements,
promotion plays a small role in consumer purchasing decisions. The success
of marketers strategy in attracting consumers depends on the ability of the
company to consider other elements, such as marketing communication [6].
However, managing the distribution is also crucial to support marketing
services [7].
International Journal on Advanced Science, Education, and Religion (IJoASER)
10
Dealing with the reality of many goods and services similar to the various
quality and tastes of the multiple consumers and the emergence of new
competitors, resulting in increasingly fierce competition. Companies should
try to gain market share, maintain and even expand the market share to compete
with other similar companies. In addition to the emergence of many identical
consumer goods increasingly smart and selective of products to be purchased.
Sometimes consumers are willing to spend more money for quality goods [8].
Consumers also have different perceptions of a product. The choice of
consumers to a wide range of products becomes an excellent opportunity for
manufacturers to continue to increase sales with appropriate marketing
strategies. One effort that can be done is to identify the behavior of individuals
in their efforts to obtain and use goods or services included in the purchase
decision process. Consumer behavior is influenced by cultural, social, personal
and psychological factors [9].
Consumer behavior dramatically affects the viability of the company as an
institution that seeks to meet the needs and desires of consumers. The purpose
of business is to create and keep consumers mindful of marketing strategies.
In other words, the success of a business depends on the understanding,
service, and ways of influencing the consumer to achieve the goal. Thus, the
companies can compete by maximizing their services to consumers [10]. If
tracing the domestic beverage industry has never lethargic. Various companies
continue to develop products to adapt trends and tastes of the market [11].
II. LITERATURE REVIEW
In the competition of the ready-to-drink tea industry, Indonesia local tea is
brave to innovate and deliver quality products at competitive prices. Quality
product with competitive price in tea industry can influence and become
consumer choice. The growth of ready-to-drink tea in packs have been
associated with consumers who like the practicality of drinking tea. Tea is
ready to drink, good taste, pure to carry everywhere, and the affordable price
makes consumers choose this product. Tea business in Indonesia requires help
for tea farmer to reduce the risk of expenses [12]. Thus, the company can
provide excellent services to globalizing the tea industry.
Indonesia has a large number of people, who spend more time-consuming
tea every day. The tea market provides tea drink products with several sizes
that can be enjoyed by the needs of people [13]. Therefore, this research aims
at analyzing the effect of product quality, price, and promotion of purchasing
decision of Indonesia local tea. This research is expected to enrich the science
of marketing, especially the factors that influence the purchase decision. The
findings of this study can be a picture and an additional consideration for
consumers about things to consider before they buy a tea product. By large tea
consumers, they are expected to be more intelligent in deciding to buy a
IJoASER, Volume 1, Issue 1, March 2018, ISSN 26148862
11
product.
Therefore, marketing understanding for marketers is fundamental to realize
the needs and desires of customers, determine the target market to offer. Thus,
the marketing insight is also highly beneficial for the company to provide the
right products, services, and programs to serve the market to optimize the sales.
Marketing is the process by which the company creates for customers and
builds strong relationships with customers to get from customers in return [9].
In creating and building strong relationships with customers, various ways
can be done such as customer needs, determining the right product for
production, developing the offer through promotion and distribution. The
company requires all these factors to achieve customer satisfaction and
generate more profit which is the company's goal. Effective marketing is one
of the leading programs in modern marketing [14]. All factors controlled by
the company to influence consumer demand for goods and services known as
marketing terms.
Effective marketing programs integrate all elements of the marketing mix
into an integrated marketing program designed to achieve the company's
marketing goals by delivering value to consumers [15]. Marketing mix
comprises a collection of tactically controlled marketing tools that the
company combines to produce the desired response in the target market [16],
[17]. The marketing mix consists of all the things a company can do to
influence its product demand. These possibilities can be grouped into four
groups of variables called four P, product, price, place, and promotion [18],
[19]. The product is a combination of goods and services the company offers
to the target market. Price is the amount of money the customer must pay to
get the product. The place is the placement of a product to be available to the
target consumer, a type of activity related to how to deliver products from
producer to consumer. Promotion is the activity of communicating and
conveying information about the product to the consumer, and persuading the
target consumers to buy the product.
Product quality is the ability of a product to demonstrate its function; it
includes overall durability, reliability, accuracy, ease of operation and product
reparation as well as other attributes [20]. Based on the theory put forward the
means of product quality is defined as the assessment of consumers about
product attributes in products that will meet the needs and provide benefits to
consumers. Quality is also a dominant element to sell to consumers. Eight
dimensions of product quality that marketers can play. Performance, feature,
reliability, conformance, durability, serviceability, aesthetics, and perceived
quality are the eight dimensions.
Performance is the main characteristic or function of a product. This is the
main benefits or benefits of the products we buy [21]. Usually, this is the first
consideration we buy the product. The second dimension is reliability, i.e., the
opportunity for a product free from failure when performing its function.
International Journal on Advanced Science, Education, and Religion (IJoASER)
12
Providing the warranty comprises the indication of product reliability [22]. The
dimensional feature is characteristic or additional characteristics that
complement the primary benefits of a product. Features are optional or option
for consumers. New features of a product tend to make consumers decide to
purchase [23]. Durability indicates the age of the product, i.e., the amount of
use of a product before it is replaced or damaged. Durability is another new
option for the consumer to compare one and another product [24].
Conformance is the conformity of product performance with the stated
standard of a product. It is a kind of promise that must be fulfilled by the
product [25]. The next dimension is the aesthetic dimension is regarded as the
beauty of the product display [26]. The last aspect is perceived quality. This
concerns consumer ratings of imagery, brands, or advertisements. Well-known
branded products are usually perceived to be more qualified than the inaudible
brands [27].
Based on the above dimensions, it can be concluded that a quality dimension
is a requirement for a product value allows to be able to satisfy customers as
expected. Price is the only element of the marketing mix that is often used as
a consideration for consumers in making purchases that cannot be ruled out by
the company. Price is the amount of money that the customer must pay to
obtain the product. Furthermore, prices are the amount of value that consumers
redeem for the number of benefits by owning or using a good or service.
For a company, the price is an essential factor in determining marketing
success [27]. The price is very influential on revenue and a net profit of the
company. Also, the price can compete with other products will form a
competitive advantage of a product in the eyes of consumers. Price is the only
element in the income-generating marketing mix; all other parts symbolize
cost. Price of the product tends to have a positive effect on the purchasing
decision if the price rationally and commensurate with the benefit of the given
product can influence the consumer in making the purchase. Companies use
promotions to trigger transactions, so consumers want to buy a particular brand
and encourage salespeople to sell it aggressively.
Also, promotions can stimulate demand for a product [28]. With the
promotion is expected consumers want to try these products and encourage
existing consumers to buy products more often so that there will be repurchase
and sales volume of a company's products will increase. Through promotional
activities can attract consumers to be interested in buying products, and able to
provide a stable buyer response, dramatize product offerings and boost sales
in the short term. The promotion is expected to affect the purchasing decisions
if the promotion is done continuously and enhanced it can stimulate the
purchase of products and increase the number of goods purchased by
consumers. Through promotions, companies can attract new customers,
encourage consumers to buy more and influence their customers to try new
products.
IJoASER, Volume 1, Issue 1, March 2018, ISSN 26148862
13
III. METHODS
This research involves ninety-two respondents. The sample used by
researchers is determined by the criteria of respondents, i.e., people who once
consumed local Indonesian Tea. Measurements made in this study using a
Likert scale. To measure the variable quality of the product, price, promotion
and purchasing decision by using Likert scale modified to four choice answers,
which strongly agree, agree, disagree, and strongly disagree. Answer strongly
agree, agree, disagree, strongly disagree with a row score 4, 3, 2, 1. This
research used the quantitative method. This research examines the influence of
independent variable that is promotion, price, and product quality with a
dependent variable that is consumer decision to consume Indonesia local Tea.
Data analysis technique used in this research is multiple regression analysis
techniques, this study is designed to examine the variables that influence from
independent variable to dependent variable [29]. This analysis is intended to
identify patterns and measure changes in product quality, price, and promotion
of purchasing decisions.
IV. RESULTS
The questionnaires were distributed to ninety-two respondents are
categorized into an independent and dependent variable. Independent variable
consists of quality of local Indonesian tea (X1), the price of domestic
Indonesian tea (X2), and promotion of local Indonesian tea (X3). The
dependent variable consists of a decision to buy local Indonesian tea (Y). In
the following figures, the author describes the respondents’ perception of local
Indonesian tea.
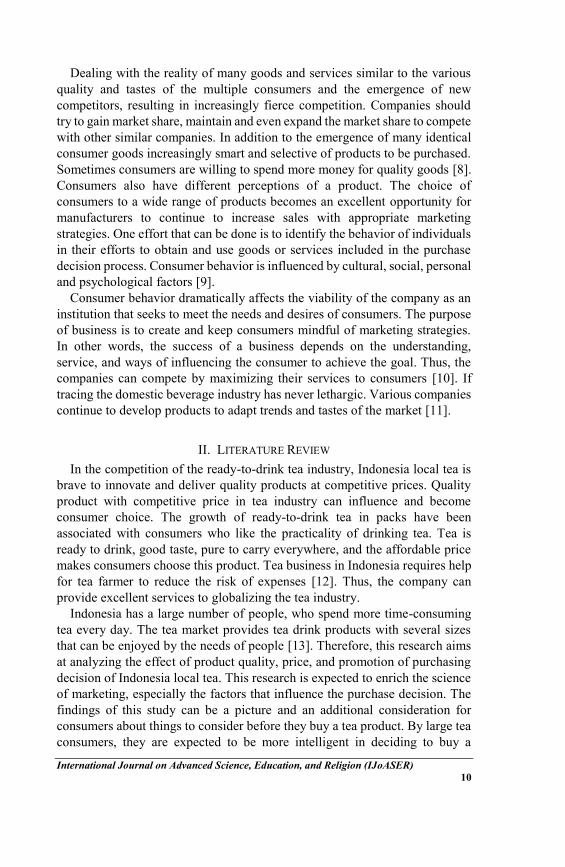
Fig. 1. Quality of Indonesian local tea
0%
10%
20%
30%
40%
50%
60%
70%
StronglyDisagree
Disagree Agree Strongly Agree
Quality of local Indonesian tea
Overcoming thirst Interesting Package Delicious taste
International Journal on Advanced Science, Education, and Religion (IJoASER)
14
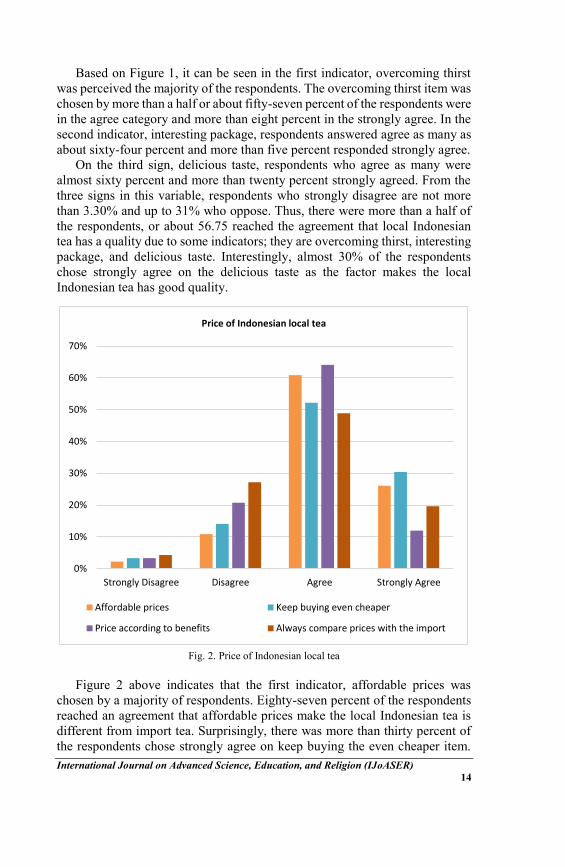
Based on Figure 1, it can be seen in the first indicator, overcoming thirst
was perceived the majority of the respondents. The overcoming thirst item was
chosen by more than a half or about fifty-seven percent of the respondents were
in the agree category and more than eight percent in the strongly agree. In the
second indicator, interesting package, respondents answered agree as many as
about sixty-four percent and more than five percent responded strongly agree.
On the third sign, delicious taste, respondents who agree as many were
almost sixty percent and more than twenty percent strongly agreed. From the
three signs in this variable, respondents who strongly disagree are not more
than 3.30% and up to 31% who oppose. Thus, there were more than a half of
the respondents, or about 56.75 reached the agreement that local Indonesian
tea has a quality due to some indicators; they are overcoming thirst, interesting
package, and delicious taste. Interestingly, almost 30% of the respondents
chose strongly agree on the delicious taste as the factor makes the local
Indonesian tea has good quality.
Fig. 2. Price of Indonesian local tea
Figure 2 above indicates that the first indicator, affordable prices was
chosen by a majority of respondents. Eighty-seven percent of the respondents
reached an agreement that affordable prices make the local Indonesian tea is
different from import tea. Surprisingly, there was more than thirty percent of
the respondents chose strongly agree on keep buying the even cheaper item.
0%
10%
20%
30%
40%
50%
60%
70%
Strongly Disagree Disagree Agree Strongly Agree
Price of Indonesian local tea
Affordable prices Keep buying even cheaper
Price according to benefits Always compare prices with the import
IJoASER, Volume 1, Issue 1, March 2018, ISSN 26148862
15
This is an indication that many of the respondents perceived that the price of
the local Indonesian tea that is cheaper than the imported tea is reasonable.
More than seventy-eight percent of the respondents reached an agreement on
an item of price according to benefits. This means that majority of the
respondents perceived that the price is in line with the benefit they get from
the local Indonesian tea. Also, more than a half of the respondents viewed
always to compare Indonesian local tea price with the imported product.
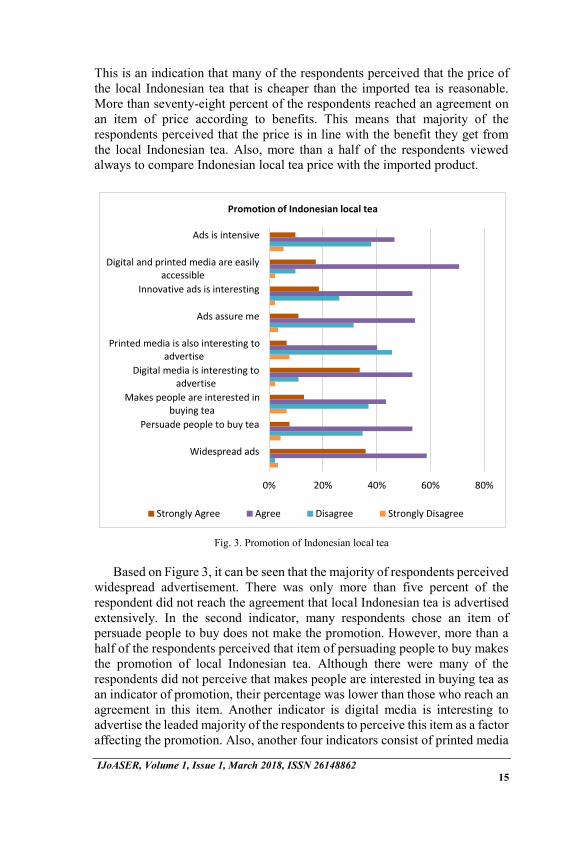
Fig. 3. Promotion of Indonesian local tea
Based on Figure 3, it can be seen that the majority of respondents perceived
widespread advertisement. There was only more than five percent of the
respondent did not reach the agreement that local Indonesian tea is advertised
extensively. In the second indicator, many respondents chose an item of
persuade people to buy does not make the promotion. However, more than a
half of the respondents perceived that item of persuading people to buy makes
the promotion of local Indonesian tea. Although there were many of the
respondents did not perceive that makes people are interested in buying tea as
an indicator of promotion, their percentage was lower than those who reach an
agreement in this item. Another indicator is digital media is interesting to
advertise the leaded majority of the respondents to perceive this item as a factor
affecting the promotion. Also, another four indicators consist of printed media
0% 20% 40% 60% 80%
Widespread ads
Persuade people to buy tea
Makes people are interested inbuying tea
Digital media is interesting toadvertise
Printed media is also interesting toadvertise
Ads assure me
Innovative ads is interesting
Digital and printed media are easilyaccessible
Ads is intensive
Promotion of Indonesian local tea
Strongly Agree Agree Disagree Strongly Disagree

International Journal on Advanced Science, Education, and Religion (IJoASER)
16
is also interesting to advertise, advertisement assures me, the innovative
advertisement is interesting, and Ads is intensive were agreed reasonably by
more than a half of the respondents. Interestingly, the other item, digital and
printed media are easily accessible was perceived by almost ninety percent of
the respondents as an indicator promotion on local Indonesian tea.
Fig. 4. Decision to buy Indonesian local tea
Figure 4 above indicates that the respondents perceived the items
reasonably: 1) drink as needed, 2) compare to the imported product before
buying, 3) decided to keep buying the local Indonesia product, 4) plan to buy
the domestic product in the future and 5) recommended a friend to buy the
domestic product. There were some other items that respondents are
highlighted mostly by the respondents, such as 1) easy to obtain information,
2) easier to search information through advertisement on TV, and 3) suitable
to the expectation. It seems that respondents were balanced in deciding the
item of decide the local product as the leading choice. A questionnaire is said
to be valid if the question on the questionnaire can reveal that the questionnaire
0% 20% 40% 60% 80%
Drink as needed
easy to obtain information
easier to search for informationthrough advertisment on TV
Compare to the import product beforebuying
suitable to the expectation
decide the local product as a mainchoice
decided to keep buying the localindonesia product
plan to buy the local product in thefuture
Recommend a friend buy the localproduct
Decision to buy Indonesian local tea
Strongly Agree Agree Disagree Strongly Disagree
IJoASER, Volume 1, Issue 1, March 2018, ISSN 26148862
17
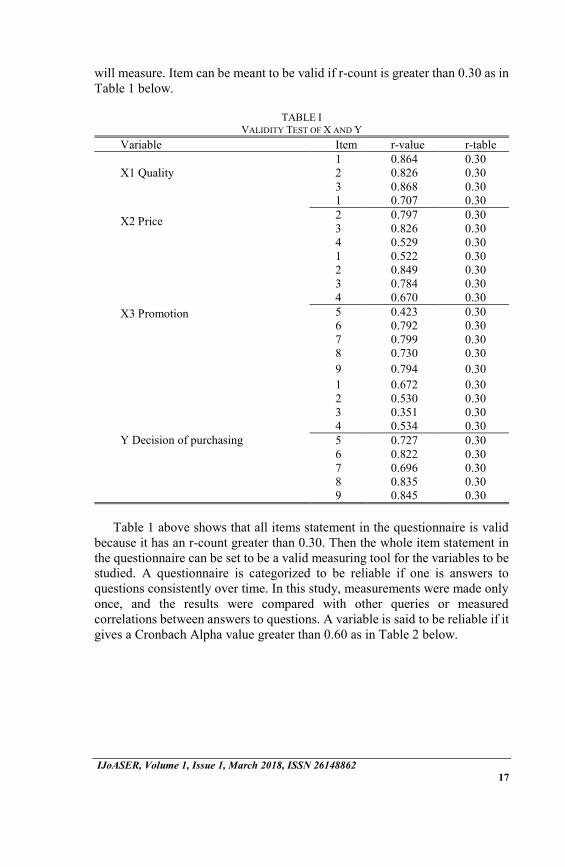
will measure. Item can be meant to be valid if r-count is greater than 0.30 as in
Table 1 below.
TABLE I
VALIDITY TEST OF X AND Y
Variable Item r-value r-table
X1 Quality
1 0.864 0.30
2 0.826 0.30
3 0.868 0.30
X2 Price
1 0.707 0.30
2 0.797 0.30
3 0.826 0.30
4 0.529 0.30
X3 Promotion
1 0.522 0.30
2 0.849 0.30
3 0.784 0.30
4 0.670 0.30
5 0.423 0.30
6 0.792 0.30
7 0.799 0.30
8 0.730 0.30
9 0.794 0.30
Y Decision of purchasing
1 0.672 0.30
2 0.530 0.30
3 0.351 0.30
4 0.534 0.30
5 0.727 0.30
6 0.822 0.30
7 0.696 0.30
8 0.835 0.30
9 0.845 0.30
Table 1 above shows that all items statement in the questionnaire is valid
because it has an r-count greater than 0.30. Then the whole item statement in
the questionnaire can be set to be a valid measuring tool for the variables to be
studied. A questionnaire is categorized to be reliable if one is answers to
questions consistently over time. In this study, measurements were made only
once, and the results were compared with other queries or measured
correlations between answers to questions. A variable is said to be reliable if it
gives a Cronbach Alpha value greater than 0.60 as in Table 2 below.
International Journal on Advanced Science, Education, and Religion (IJoASER)
18
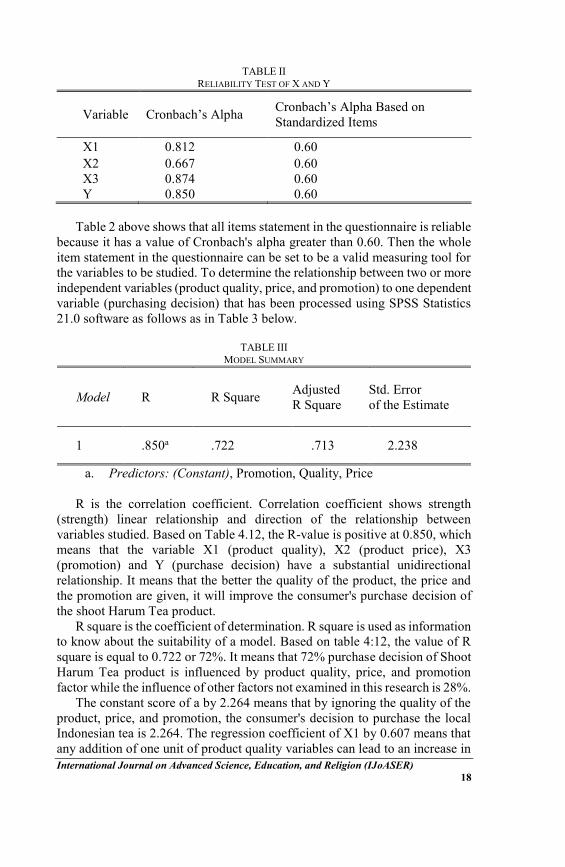
TABLE II
RELIABILITY TEST OF X AND Y
Variable Cronbach’s Alpha Cronbach’s Alpha Based on
Standardized Items
X1 0.812 0.60
X2 0.667 0.60
X3 0.874 0.60
Y 0.850 0.60
Table 2 above shows that all items statement in the questionnaire is reliable
because it has a value of Cronbach's alpha greater than 0.60. Then the whole
item statement in the questionnaire can be set to be a valid measuring tool for
the variables to be studied. To determine the relationship between two or more
independent variables (product quality, price, and promotion) to one dependent
variable (purchasing decision) that has been processed using SPSS Statistics
21.0 software as follows as in Table 3 below.
TABLE III
MODEL SUMMARY
Model R R Square Adjusted
R Square
Std. Error
of the Estimate
1 .850a .722 .713 2.238
a. Predictors: (Constant), Promotion, Quality, Price
R is the correlation coefficient. Correlation coefficient shows strength
(strength) linear relationship and direction of the relationship between
variables studied. Based on Table 4.12, the R-value is positive at 0.850, which
means that the variable X1 (product quality), X2 (product price), X3
(promotion) and Y (purchase decision) have a substantial unidirectional
relationship. It means that the better the quality of the product, the price and
the promotion are given, it will improve the consumer's purchase decision of
the shoot Harum Tea product.
R square is the coefficient of determination. R square is used as information
to know about the suitability of a model. Based on table 4:12, the value of R
square is equal to 0.722 or 72%. It means that 72% purchase decision of Shoot
Harum Tea product is influenced by product quality, price, and promotion
factor while the influence of other factors not examined in this research is 28%.
The constant score of a by 2.264 means that by ignoring the quality of the
product, price, and promotion, the consumer's decision to purchase the local
Indonesian tea is 2.264. The regression coefficient of X1 by 0.607 means that
any addition of one unit of product quality variables can lead to an increase in

IJoASER, Volume 1, Issue 1, March 2018, ISSN 26148862
19
purchasing decisions of local Indonesian tea by 0.607. The regression
coefficient of X2 by 0.419 means that any addition of one unit of price variable
can lead to an increase in purchasing decision of Indonesian local tea product
by 0.419. The regression coefficient of X3 by 0.499 means that every addition
of one unit of product promotion variable can lead to an increase in purchasing
decision of local Indonesian tea by 0.499. The more details of the regression
coefficients are as in Table 4.
TABLE IV
COEFFICIENTS
Model
Unstandardized
Coefficients
Standardized
Coefficients t Sig.
B Std.
Error Beta
1
(Constant) 2.264 6.035 1.442 .153
Quality .607 .192 .242 3.167 .002
Price .419 .147 .205 2.849 .005
Promotion .499 .068 .538 7.332 .000
a. Dependent Variable: Decision of purchasing
The above Table 4 examines whether individual independent variables
affect the dependent variable. The way of testing is if the probability >0.05,
then the independent variable partially does not affect significantly the
dependent variable. If the probability <0.05, then the independent variables
somewhat affect the dependent variable. From the results of multiple
regression analysis of quality variable (X1) as in Table 1, it can be seen that
the significance value is equal to 0.002 smaller than the probability of 0.05.
Thus, it can be concluded that H0 is rejected and H1 "The product quality
positively affects the purchase decision of Indonesian local tea" is accepted.
That is partial there is a significant influence on product quality to the purchase
decision.
The price variable (X2) on Table 1 indicates that the results of multiple
regression analysis are of significant value (sig.) by 0.005 smaller than the
probability of 0.05. Thus, it can be concluded that H0 is rejected and H2 "Price
has a positive effect on purchase decision of Indonesian local tea" is accepted.
This means that there is a partial influence on the price of the purchase
decision. Thus, the promotion variables (X3) indicates that result of multiple
regression analysis in table 1shows that the significance value (sig.) is 0.000
smaller than probability 0.05. Thus, it can be concluded that H0 is rejected and
H3 "Promotion positively affects the purchase decision of Indonesian local

International Journal on Advanced Science, Education, and Religion (IJoASER)
20
tea" is accepted. That is partial there is a significant influence on the promotion
of purchasing decisions.
Moreover, in examining whether the independent variables together affect
the dependent variable, ANOVAs test is used as in Table 2. If
probability >0.05, hence independent variable simultaneously do not affect the
dependent variable. If the probability <0.05, then the independent variables
simultaneously affect the dependent variable.
TABLE V
ANOVA
Model Sum of Squares df Mean
Square F Sig.
1
Regression 861.324 3 287.108 17.192 .000b
Residual 1469.579 88 16.700
Total 2330.902 91
a. Dependent Variable: Decision of purchasing
b. Predictors: (Constant), Quality, Price, Promotion
Based on table 5 above, it can be seen that the value of sig 0.000 is smaller
than probability 0.05. Thus, Table 2 indicates that H0 is rejected and Ha is
accepted. Therefore, it can be concluded that simultaneously, there is
significant influence between the independent variable (quality, price, and
promotion) and the dependent variable (decision of purchasing) of local
Indonesian tea.
V. DISCUSSION
Based on hypothesis test, that is T-test, hence can be concluded that quality
variable (X1) gives significant value by 0.002 which is smaller than <0.05.
Thus, this research indicates that there is a significant partial influence between
the quality of the product on the purchase decision. Therefore, this research
support that quality affects the intention of a consumer to purchase a product
[30]. This research also indicates that the price variable (X2) gives the sig value
by 0.005, which is smaller than <0.05. Hence, this research shows that there is
a significant partial influence between price and purchase decision. Price has
the leading role in making consumers decision to purchase a product [31].
Finally, the promotional variable (X3) gives sig value by 0.000, which is
smaller than <0.05 indicating there is partially significant influence between
promotion to purchase decision. a consumer responds to promotion through to
the intention to buy [32].
The whole value of the regression coefficient is positive, which means that
the quality of the product, price and promotion positively influence the
IJoASER, Volume 1, Issue 1, March 2018, ISSN 26148862
21
decision of purchasing the local Indonesian tea. Based on the SPSS output of
simple linear regression of the Summary Model section, it can be known that
R-value is 0.850, which means that the X1 (quality), X2 (price), X3
(promotion) and Y (decision of purchasing) variables are very clear-cut. It
means that the better the quality of the product, the price and the promotion are
given, it will improve the consumer's purchase decision of local Indonesian
tea. Based on the output of SPSS simple linear regression section Summary
Model can know the value of R square is equal to 0.722 or 72%. It means that
product quality, price influence 72% purchase decision of Indonesian local tea
product and promotion done, while the remaining 28% affected by other
variables not examined in this study. Based on the hypothesis test that has been
done, that is F test; it can be concluded that the value of sig 0.000 <0.05, which
means that there is simultaneously significant influence between product
quality, price, and promotion to consumer decision to purchase local
Indonesian tea.
VI. CONCLUSION
From the result of research variable of local Indonesian tea, quality has
influence strongly to a variable of the decision of purchasing. Hence, to
maintain consumer appraisal to the quality of local Indonesian tea, the
Indonesian local tea companies should able to increase quality. For example,
the tea company can add taste variants by the wishes of consumers. This
research indicates that the price variable Indonesian local tea should be
continuously adjusted with quality. In determining the price, the company
should be better adapted the price of domestic Indonesian tea with the
purchasing interest of the people and the quality of the product itself that affect
the purchase decision. Thus, to maintain consumer appraisal to the promotion
of local Indonesian tea to remain attractive, the tea company should improve
promotion aspect.
REFERENCES
[1] L. G. Schiffman and L. L. Kanuk, “Consumer behavior, 7th,” NY Prentice Hall, pp. 15–36,
2000.
[2] V. A. Zeithaml, “Consumer perceptions of price, quality, and value: a means-end model and synthesis of evidence,” J. Mark., pp. 2–22, 1988.
[3] D. Grewal, R. Krishnan, J. Baker, and N. Borin, “The effect of store name, brand name and
price discounts on consumers’ evaluations and purchase intentions,” J. Retail., vol. 74, no.
3, pp. 331–352, 1998.
[4] R. Arora and C. Stoner, “The effect of perceived service quality and name familiarity on
the service selection decision,” J. Serv. Mark., vol. 10, no. 1, pp. 22–34, 1996. [5] T. G. Williams and M. E. Slama, “Market mavens′ purchase decision evaluative criteria:
Implications for brand and store promotion efforts,” J. Consum. Mark., vol. 12, no. 3, pp.
4–21, 1995. [6] A. F. Villarejo-Ramos and M. J. Sanchez-Franco, “The impact of marketing communication
and price promotion on brand equity,” J. Brand Manag., vol. 12, no. 6, pp. 431–444, 2005.
[7] F. E. Webster Jr, “The changing role of marketing in the corporation,” J. Mark., pp. 1–17, 1992.
[8] J. Mundel, P. Huddleston, and M. Vodermeier, “An exploratory study of consumers’

International Journal on Advanced Science, Education, and Religion (IJoASER)
22
perceptions: What are affordable luxuries?,” J. Retail. Consum. Serv., vol. 35, pp. 68–75,
2017.
[9] G. Armstrong, S. Adam, S. Denize, and P. Kotler, Principles of marketing. Pearson Australia, 2014.
[10] F. Iravani, S. Dasu, and R. Ahmadi, “Beyond price mechanisms: How much can service
help manage the competition from gray markets?,” Eur. J. Oper. Res., vol. 252, no. 3, pp. 789–800, 2016.
[11] M. Salzman and I. Matathia, Next now: Trends for the future. St. Martin’s Press, 2015.
[12] H. Yuliando, K. N. Erma, S. A. Cahyo, and W. Supartono, “The Strengthening Factors of Tea Farmer Cooperative: Case of Indonesian Tea Industry,” Agric. Agric. Sci. Procedia,
vol. 3, pp. 143–148, 2015.
[13] K. Smith, World Atlas of Tea: From the leaf to the cup, the world’s teas explored and enjoyed. Hachette UK, 2016.
[14] J. N. Sheth and A. Parvatiyar, “The evolution of relationship marketing,” Int. Bus. Rev., vol.
4, no. 4, pp. 397–418, 1995. [15] O. Holm, “Integrated marketing communication: from tactics to strategy,” Corp. Commun.
An Int. J., vol. 11, no. 1, pp. 23–33, 2006.
[16] N. H. Borden, “The concept of the marketing mix,” J. Advert. Res., vol. 4, no. 2, pp. 2–7, 1964.
[17] C. Grönroos, “Keynote paper From marketing mix to relationship marketing-towards a
paradigm shift in marketing,” Manag. Decis., vol. 35, no. 4, pp. 322–339, 1997. [18] W. Van Waterschoot and C. Van den Bulte, “The 4P classification of the marketing mix
revisited,” J. Mark., pp. 83–93, 1992.
[19] E. Constantinides, “The marketing mix revisited: towards the 21st century marketing,” J. Mark. Manag., vol. 22, no. 3–4, pp. 407–438, 2006.
[20] J. C. Hallak, “Product quality and the direction of trade,” J. Int. Econ., vol. 68, no. 1, pp.
238–265, 2006. [21] A. Neely, Business performance measurement: theory and practice. Cambridge University
Press, 2002.
[22] C. A. Kelley, “An investigation of consumer product warranties as market signals of product
reliability,” J. Acad. Mark. Sci., vol. 16, no. 2, pp. 72–78, 1988.
[23] S. M. Nowlis and I. Simonson, “The effect of new product features on brand choice,” J.
Mark. Res., pp. 36–46, 1996. [24] M. Kostecki, The durable use of consumer products: new options for business and
consumption. Springer Science & Business Media, 2013.
[25] S. Ghose and S. K. Mukhopadhyay, “Quality as the interface between manufacturing and marketing: a conceptual model and an empirical study,” MIR Manag. Int. Rev., pp. 39–52,
1993. [26] S. Charters, “Aesthetic Products and Aesthetic Consumption: A Review,” Consum. Mark.
Cult., vol. 9, no. 3, pp. 235–255, Sep. 2006.
[27] J. B. Gotlieb, D. Grewal, and S. W. Brown, “Consumer satisfaction and perceived quality: complementary or divergent constructs?,” J. Appl. Psychol., vol. 79, no. 6, p. 875, 1994.
[28] A. Y. L. Chong, E. Ch’ng, M. J. Liu, and B. Li, “Predicting consumer product demands via
Big Data: the roles of online promotional marketing and online reviews,” Int. J. Prod. Res.,
vol. 55, no. 17, pp. 5142–5156, 2017.
[29] P. R. Hinton, I. McMurray, and C. Brownlow, SPSS explained. Routledge, 2014.
[30] E.-J. Lee and S. Y. Shin, “When do consumers buy online product reviews? Effects of review quality, product type, and reviewer’s photo,” Comput. Human Behav., vol. 31, pp.
356–366, 2014.
[31] U. R. Karmarkar, B. Shiv, and B. Knutson, “Cost conscious? The neural and behavioral impact of price primacy on decision making,” J. Mark. Res., vol. 52, no. 4, pp. 467–481,
2015.
[32] P. Hultén and V. Vanyushyn, “Promotion and shoppers’ impulse purchases: the example of clothes,” J. Consum. Mark., vol. 31, no. 2, pp. 94–102, 2014.
Related Documents


