EFFECT OF PRETREATMENT FOR SYNTHESIS OF OIL PALM FROND BASED CATALYST FOR BIODIESEL PRODUCTION HENG ZENG WEI A project report submitted in partial fulfilment of the requirements for the award of Bachelor of Engineering (Honours) Chemical Engineering Lee Kong Chian Faculty of Engineering and Science Universiti Tunku Abdul Rahman May 2019

Welcome message from author
This document is posted to help you gain knowledge. Please leave a comment to let me know what you think about it! Share it to your friends and learn new things together.
Transcript

EFFECT OF PRETREATMENT FOR SYNTHESIS OF OIL PALM FROND
BASED CATALYST FOR BIODIESEL PRODUCTION
HENG ZENG WEI
A project report submitted in partial fulfilment of the
requirements for the award of Bachelor of Engineering
(Honours) Chemical Engineering
Lee Kong Chian Faculty of Engineering and Science
Universiti Tunku Abdul Rahman
May 2019

ii
DECLARATION
I hereby declare that this project report is based on my original work except for
citations and quotations which have been duly acknowledged. I also declare that it
has not been previously and concurrently submitted for any other degree or award at
UTAR or other institutions.
Signature :
Name : HENG ZENG WEI
ID No. : 1402740
Date : 15th APRIL 2019
iii
APPROVAL FOR SUBMISSION
I certify that this project report entitled “EFFECT OF PRETREATMENT FOR
SYNTHESIS OF OIL PALM FROND BASED CATALYST FOR BIODIESEL
PRODUCTION” was prepared by HENG ZENG WEI has met the required
standard for submission in partial fulfilment of the requirements for the award of
Bachelor of Engineering (Honours) Chemical Engineering at Universiti Tunku Abdul
Rahman
Approved by,
Signature :
Supervisor : Dr. Steven Lim
Date : 15th APRIL 2019

iv
The copyright of this report belongs to the author under the terms of the
copyright Act 1987 as qualified by Intellectual Property Policy of Universiti Tunku
Abdul Rahman. Due acknowledgement shall always be made of the use of any
material contained in, or derived from, this report.
© 2019, Heng Zeng Wei. All right reserved.

v
ACKNOWLEDGEMENTS
The completion of this research project would not have been a success if it was not
for the participation, assistance and support of many individuals. First and foremost,
I would like to convey my heartiest thanks to my research supervisor, Dr. Steven
Lim for giving me the opportunity to undertake my final year project under his
supervision. Throughout the research project, Dr. Steven Lim gave me very in-time
valuable advice and extensive guidance with enormous patience.
Next, my deepest thanks to Universiti Tunku Abdul Rahman (UTAR) for
providing me a great platform and learning ground to complete my final year project.
Throughout the project, I was very fortunate to be blessed with the technical supports
from all Assistant Laboratory Managers of Department of Chemical Engineering in
Lee Kong Chian Faculty of Engineering and Science.
Last but not least, I would also like to express my greatest gratitude to my
loving parents who gave me unconditional support and encouragement during my
venture. Their help allowed me to complete my research and thesis successfully. A
special thanks to my helpful seniors, Ms. Tang Zo Ee, Mr. Danny Chin, Ms. Wong
Wan Ying and Mr. Chon Wen Xian who had offered invaluable suggestions and
assistance unconditionally.

vi
ABSTRACT
In this study, cost-effective carbon-based solid catalyst was synthesised by
preparation of activated carbon derived from agricultural waste materials. The
performances of synthesised catalysts were tested in esterification of high free fatty
acid feedstock (Palm Fatty Acid Distillate) to produce biodiesel. The main focus in
this research was to study the effects of pretreatment parameters on the effectiveness
of carbon based catalyst produced by varying the types of biomass precursor and
activating agent used, particle sizes, impregnation ratio (1:0.1, 1:0.5, 1:1),
impregnation temperature (50˚C, 70˚C, 90˚C) and carbonisation temperature (400˚C,
600˚C, 800˚C). The resulting activated carbon was then sulfonated by direct
sulfonation, thermal decomposition of ammonium persulfate and arylation of 4-
benzenediazonium sulfonate (4-BDS) and its catalytic activity was investigated in
the esterification of PFAD and methanol. SEM micrographs showed that the
activated carbon (AC) carbonised at 600 ℃ had porous structure and exhibited
highest surface area. Besides that, EDX and FT-IR had confirmed the successful
attachment of –SO3H groups onto the activated carbon. TGA result showed that the
catalyst was thermally stable up to the temperature of 225 ˚C. Moreover, it was
determined in TPR analysis that 890 °C was the most ideal reduction temperature
with 1052 μmol/g of hydrogen gas was consumed. The optimum pretreatment
condition obtained was at 600 ˚C carbonisation temperature, 1:0.5 impregnation ratio
and at 90 ˚C of impregnation temperature. The optimum catalyst, Cat_0.5 possessed
the total acid density of 7.36 mmol/g and had achieved maximum FAME yield of
82.71% and conversion of 93.54% in the esterification reaction.

vii
TABLE OF CONTENTS
DECLARATION ii
APPROVAL FOR SUBMISSION iii
ACKNOWLEDGEMENTS v
ABSTRACT vi
TABLE OF CONTENTS vii
LIST OF TABLES x
LIST OF FIGURES xii
LIST OF SYMBOLS/ ABBREVIATIONS xv
LIST OF APPENDICES xvi
CHAPTER
1 INTRODUCTION 1
1.1 Global Energy Scenario 1
1.2 Malaysia energy scenario 3
1.3 Biodiesel in Malaysia 4
1.4 Biodiesel Processing Technology 7
1.4.1 Direct use and Blending 7
1.4.2 Micro-emulsification 8
1.4.3 Thermal Cracking/ Pyrolysis 8
1.4.4 Transesterification 8
1.5 Problem Statement 13
1.6 Aims and Objectives 14
1.7 Scope and Limitation of the study 14
1.8 Contribution of the Study 15
1.9 Outline of the Report 15

viii
2 LITERATURE REVIEW 16
2.1 Transesterification mechanism 16
2.1.1 Mechanism for base-catalysed transesterification 16
2.1.2 Mechanism for acid-catalysed transesterification 18
2.2 Esterification mechanism 18
2.3 Carbon-based Solid Catalyst 19
2.3.1 Activated Carbon Precursors 19
2.4 Activated Carbon Preparation 21
2.4.1 Physical Activation 21
2.4.2 Chemical Activation 22
2.5 Effect of Chemical Activation Parameters 23
2.5.1 Effect of activating agents 23
2.5.2 Effect of Impregnation Ratio 28
2.5.3 Effect of Carbonisation Temperature 29
2.6 Sulfonation of activated carbon 31
3 METHODOLOGY AND WORK PLAN 36
3.1 List of materials and apparatus 36
3.1.1 Materials and Chemicals 36
3.1.2 Apparatus, Equipment and Instrument 38
3.2 Research Methodology 40
3.3 Experiment Procedures 41
3.3.1 Activation and Carbonisation of Biomass 41
3.3.2 Sulfonation of Activated Carbon 42
3.3.3 Biodiesel Production by Esterification 44
3.4 Biodiesel Characterisation 45
3.4.1 Gas Chromatography (GC) 45
3.4.2 Acid Value 48
3.5 Catalyst Characterisation 49
3.5.1 Scanning Electron Microscopy (SEM-EDX) 49
3.5.2 Temperature Programmed Reduction (TPR) 49
3.5.3 Fourier Transform - Infrared Spectroscopy (FTIR) 50
3.5.4 Thermogravimetric Analysis (TGA) 50
ix
3.5.5 Total Acid Density 50
4 RESULTS AND DISCUSSION 52
4.1 Preliminary Studies 52
4.2 Characterisation of Activated Carbon and Catalyst 54
4.2.1 Scanning Electron Microscopy 54
4.2.2 Energy Dispersive X-Ray 58
4.2.3 Thermogravimetric Analysis 59
4.2.4 Fourier Transform Infrared Spectroscopy 61
4.2.5 Temperature Programmed Reduction 63
4.2.6 Total Acid Density Test 64
4.3 Pretreatment Parameters Studies 67
4.3.1 Effect of Carbonisation Temperature 68
4.3.2 Effect of Impregnation Ratio 70
4.3.3 Effect of Impregnation Temperature 71
4.4 Effects of Sulfonation Method on Biodiesel Production 72
5 CONCLUSION AND RECOMMENDATIONS 74
5.1 Conclusion 74
5.2 Recommendations for Future Research 75
REFERENCES 77
5 APPENDICES 81

x
LIST OF TABLES
Table 1.1 : Global Primary Energy Consumption by Fuel
(Worldcat.org, 2018)
2
Table 1.2 : Oil Yields for Major Non-edible and Edible Oil
Sources (Gui, Lee and Bhatia, 2008)
7
Table 2.1 : Lignocellulosic Composition of Agricultural Residues
(Yahya, Al-Qodah and Ngah, 2015)
20
Table 2.2 : Various Activating Agent Used and the Corresponding
Performance of the Activated Carbon Catalyst
26
Table 2.3 : Surface Area and Pore Characteristics for Carbonation
and Activation of Sample (Liou and Wu, 2009)
30
Table 2.4 : Different Sulfonation Method of Carbon Catalyst 34
Table 3.1 List of Chemicals and Materials Required for
Experiment
36
Table 3.2 : List of Apparatus and Equipment Required for
Experiment
38
Table 3.3 : List of Instruments Required for Characterisation of
Feedstock, Catalyst and FAME
39
Table 3.4 : Gas Chromatography Setting for Biodiesel Sample 48
Table 3.5 : Conditions for Pretreatment and TPR Analysis 49
Table 3.6 : TGA Setting and Specification 50
Table 4.1 : Total Acid Density of Different Precursors Activated
by Acid and Alkali
53

xi
Table 4.2 : Total Acid Density of Oil Palm Frond with Different
Particle Sizes
54
Table 4.3 : FAME Yield and Conversion of Oil Palm Frond
Derived Catalyst
54
Table 4.4 : Carbon Samples and the Preparation Conditions 54
Table 4.5 : Elemental Composition of Samples 58
Table 4.6 : Infrared Stretching Frequencies (Konwar, et al., 2014) 61
Table 4.7 : Results for Various Sulfonation Methods 73

xii
LIST OF FIGURES
Figure 1.1 : Energy Consumption by Regions (Eia.gov, 2018) 2
Figure 1.2 : Electricity Generation by Southeast Asia Country
from 1995 to 2015 (Renewable Energy Market
Analysis: Southeast Asia, 2018)
4
Figure 1.3 : Total Energy Consumption by Sectors in Malaysia
from 1980 to 2016 (Meih.st.gov.my, 2018)
4
Figure 1.4 : Overall Transesterification Reaction of Triglyceride
with Alcohol (Ma and Hanna, 1999)
9
Figure 2.1 : Transesterification Reactions of Triglyceride with
Alcohol (Ma and Hanna, 1999)
16
Figure 2.2 : Mechanism for Base-catalysed Transesterification
(Ma and Hanna, 1999)
17
Figure 2.3 : Mechanism for Acid-catalysed Transesterification
(Ma and Hanna, 1999)
18
Figure 2.4 : Solid Acid-catalysed Reaction Mechanism of
Esterification (Ma and Hanna, 1999)
19
Figure 2.5 : Effect of Carbonisation Temperature on the Surface
Area of Samples: (a) H3PO4 Activation and (b)
ZnCl2 Activation (Liou and Wu, 2009)
31
Figure 3.1 : Schematic Flow of Research Methodology 40
Figure 3.2 : (A) Raw Oil Palm Frond (B) Dried Palm Frond (C)
Impregnated Palm Frond (D) Carbonised Palm
Frond
42
Figure 3.3 : Experimental Set Up of Direct Sulfonation 43

xiii
Figure 3.4 : Experimental Set Up of 4-BDS 44
Figure 3.5 : Experimental Set Up of Esterification Process 45
Figure 3.6 : External Calibration Curve of Methyl Palmitate 46
Figure 3.7 : External Calibration Curve of Methyl Stearate 46
Figure 3.8 : External Calibration Curve of Methyl Oleate 47
Figure 3.9 : External Calibration Curve of Methyl Linoleate 47
Figure 4.1 : SEM Image of (a) Raw Oil Palm Frond 2000× (b)
Chemically Activated Palm Frond 2000× (c)
Activated Carbon 2000× and (d) Palm Frond
Derived Catalyst 2000×
56
Figure 4.2 : SEM Image of Activated Carbon Carbonised at (a)
400 ˚C at 2000× (b) 400 ˚C at 3000× (c) 600 ˚C at
2000× and (d) 600 ˚C 3000× (e) 800 ˚C at 2000× (f)
800 ˚C 3000×
57
Figure 4.3 : EDX Spectrum of Cat_0.5 59
Figure 4.4 : Temperature Dependant Weight Loss Curve for
Cat_0.5
60
Figure 4.5 : Comparison of FTIR Spectra of Activated Carbon
and Cat_0.5
62
Figure 4.6 : Comparison of FTIR Spectra of Catalyst
Synthesised at Different Carbonisation
Temperatures
63
Figure 4.7 : TPR Spectra of Activated Carbon and Palm Frond
Derived Catalyst
64

xiv
Figure 4.8 : Total Acid Density of Catalyst Carbonised at
Different Temperatures
65
Figure 4.9 : Total Acid Density of Catalyst Synthesised at
Different Impregnation Ratios
66
Figure 4.10 : Total Acid Density of Catalyst Synthesised at
Different Impregnation Temperatures
67
Figure 4.11 : Gas Chromatogram of FAME Produced 68
Figure 4.12 : FAME Yield and Conversion Using Catalyst
Synthesised at Different Carbonisation
Temperatures
69
Figure 4.13 : FAME Yield and Conversion Using Catalyst
Synthesised at Different Impregnation Ratios
71
Figure 4.14 : FAME Yield and Conversion Using Catalyst
Synthesised at Different Impregnation
Temperatures
72

xv
LIST OF SYMBOLS/ ABBREVIATIONS
ai initial acid value of feedstock, mg KOH/g
af final acid value of mixture after reaction, mg KOH/g
M molarity of KOH solution, mol/L
MW molecular weight of KOH, g/mol
V volume of solution used, L
W weight of PFAD, g
4-BDS 4-benzenediazoniumsulfonate
AC activated carbon
BET Brunauer-Emmett-Teller
BP British Petroleum
CI compression ignition
EFB empty fruit bunch
FAME fatty acid methyl ester
FFA free fatty acid
FID flame ionisation detector
FTIR Fourier Transform Infrared Spectroscopy
GC Gas Chromatography
GDP gross domestic product
GHG green house gases
IEA International Energy Agency
mtoe million tons of oil equivalent
MWCNT multi-walled carbon nanotubes
OPF oil palm frond
OPT oil palm trunk
PFAD palm fatty acid distillate
SCB sugarcane bagasse
SEM-EDX Scanning Electron Microscopy with Energy Dispersive X-Ray
TGA Thermogravimetric Analysis
TPR Temperature Programmed Reduction

xvi
LIST OF APPENDICES
APPENDIX A: EDX Reports 81
APPENDIX B: FT-IR Reports 83
APPENDIX C: GC Reports 87
APPENDIX D: TPR Report 97
APPENDIX E: TGA Report 98
APPENDIX F: Sample Calculations 99

1
CHAPTER 1
1 INTRODUCTION
1.1 Global Energy Scenario
Presently, natural gas, coal and crude oil are the main energy sources in the world,
which are the lifeblood of modern era. Due to the new discoveries in science and
technology, world energy consumption is skyrocketing and is increasing at a faster
pace than the population growth. In the near future, this non-renewable energy
source will eventually run out and result in serious shortage. This alarming problem
has attracted the awareness of all nations to search for alternative energy in order to
ensure sustainable development.
According to BP Statistical Review of World Energy (2018), there was an
increase in fuel consumption from 11,588.4 million tons of oil equivalent (Mtoe) to
13,511.2 Mtoe in ten years’ time from 2007 to 2017 as shown in Table 1.1. The total
energy consumption was primarily contributed by fossil fuels which accounted for
85.2%, while hydroelectricity and nuclear energy contributed only a little with 6.8%
and 4.4%, respectively. Astonishingly, the share for renewables still remains small
which reflected that the populations are still strongly relied on traditional fossil fuel
as a primary energy source. World primary energy consumption grew by 2.2% in
2017, which was the fastest growth since 2013. This rapid expansion was mostly
driven by the developing countries in Asia, particularly China which contributed
over one-third of that growth. According to the energy forecast done by International
Energy Agency (IEA), this projected consumption will continue to expand by 30%
until 2040, with a global economy growing at an average rate of 3.4% per year and a
population that expands from 7.4 billion to above 9 billion in 2040 (Iea.org, 2018).
The main driver of this demand growth comes from developing countries in Asia,
especially in India which accounts for almost one-third of global energy growth as
shown in Figure 1.1.

2
Table 1.1: Global Primary Energy Consumption by Fuel (Worldcat.org, 2018)
Source 2007 2017
Mtoe Share (%) Mtoe Share (%)
Petroleum 4167.8 35.97 4621.9 34.21
Coal 3451.8 29.79 3731.5 27.62
Natural Gas 2543.4 21.95 3156.0 23.36
Nuclear 621.5 5.36 596.4 4.41
Hydropower 696.9 6.01 918.6 6.80
Renewables 107.0 0.92 486.8 3.60
Total 11588.4 100 13511.2 100
Figure 1.1: Energy Consumption by Regions (Eia.gov, 2018)
At current production rate, the world oil production is reaching its peak and is
expected to decrease at a constant rate in the future. According to BP statistics, the
global proven oil and natural gas reserves of 1696.6 thousand million barrels and
193.5 trillion cubic meters are only sufficient for 50.2 and 52.6 years respectively.
Conversely, world established coal reserves of 1.04 trillion tonnes at end of 2017 is
estimated to last for 112 years. However, the combustion of fossil fuels to generate
electricity emitted harmful greenhouse gases (GHG) which raised the climate change
issue. It was reported that 19,380 million tons of carbon dioxide was emitted in 1980

3
and the amount continue to rise rapidly to 33,444 million tons in 2017. The
continuous use of fossil fuels will continue to increase the carbon dioxide emission
and aggravate the situation. Due to the short life expectancy of fossil fuels and the
pressing environmental issues, tremendous efforts are needed to develop renewable
energy as an alternative and reliable energy source. Currently, renewable energy only
contributes 10.4% of the total global energy used.
1.2 Malaysia energy scenario
According to Department of Statistics, Malaysia (2017), Malaysia had a population
of 32 million in 2017 and is expected to reach 41.5 million by 2040. Malaysia is a
fast developing country that recorded a 5.9% GDP in 2017 (The Edge Markets,
2018). As such, it is expected that Malaysia’s energy consumption will increase at
the same pace with GDP growth. Due to the rapid urbanisation and industrialisation,
Malaysia’s primary energy supply had increased almost tenfold from 10.9 Mtoe in
1980 to 93.4 Mtoe in 2016, which was the third highest consumption among the
Southeast Asia countries as shown in Figure 1.2. Figure 1.3 shows the total energy
consumption by sectors in Malaysia from 1980 to 2016. The increasing trend
indicated that transportation sector had the highest energy consumption, followed by
the industrial sector, the residential and commercial sector, and lastly the agriculture
sector in the year of 2016. Although advancement in transportation is one of the
drivers for economic growth, this sector also contributes to a substantial amount of
greenhouse gases emissions as it is mostly powered by petroleum products.
Figure 1.2: Electricity Generation by Southeast Asia Country from 1995 to 2015
(Renewable Energy Market Analysis: Southeast Asia, 2018)

4
Figure 1.3: Total Energy Consumption by Sectors in Malaysia from 1980 to 2016
(Meih.st.gov.my, 2018)
Even though Malaysia has abundant fossil fuel resources, it is not sustainable
since it will deplete eventually someday. Considering the depletion of fossil fuel
reserves and adverse environmental impact, energy security and sustainability have
become a challenging issue faced by Malaysia’s power sector currently. In 2000,
Malaysia government had announced renewable energy as the 5th fuel in the Five-
Fuel Diversification Policy which included hydro energy, solar energy, wind energy
and biomass. Malaysia is a potential contributor in biodiesel production since our
country is blessed with abundant amount of palm oil residues such as oil palm shell,
palm oil mill effluent, mesocarp fiber and empty fruit bunch (EFB).
1.3 Biodiesel in Malaysia
As one of the world’s largest palm oil producer and exporter, Malaysia has great
potential in the development of biomass renewable energy thanks to the large amount
of biomass feedstock available. Each year, Malaysia will process approximately 71.3
million tons of fresh fruit bunch and release about 19 million tons of palm oil
leftover waste in the form of, mesocarp fibre, empty fruit bunch (EFB), palm oil mill
effluent and oil palm shell which have a very low economic values (Sumathi, Chai
5
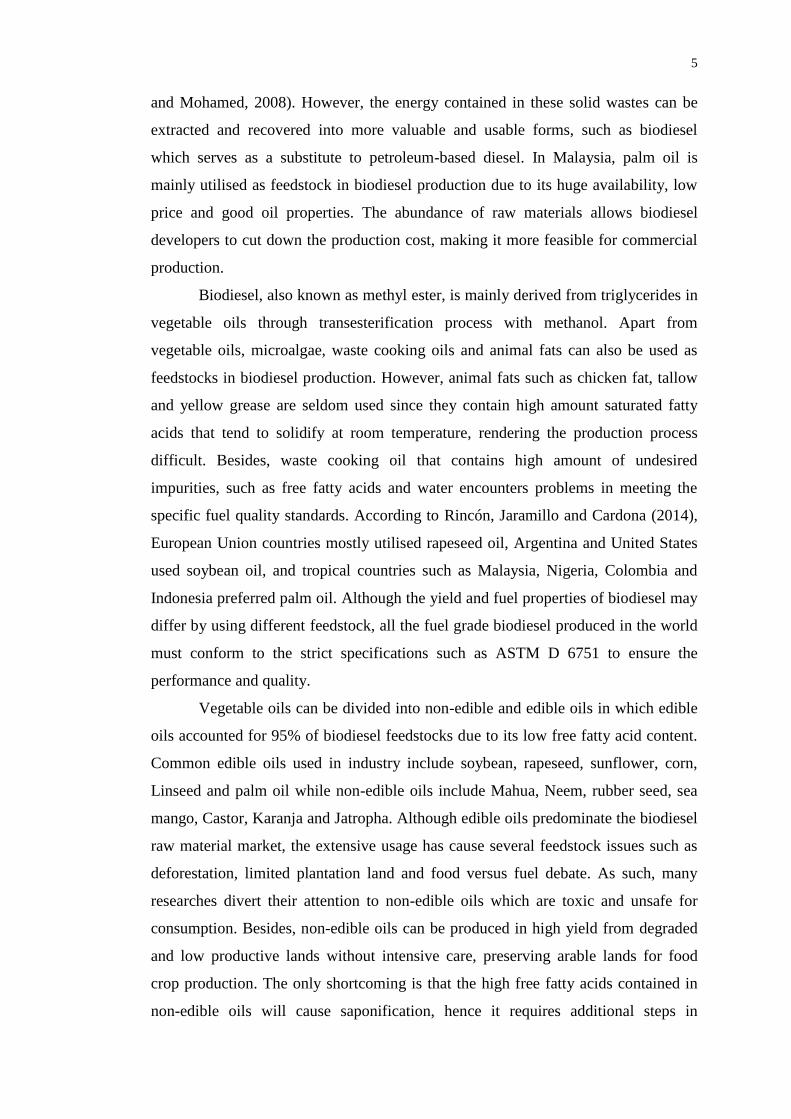
and Mohamed, 2008). However, the energy contained in these solid wastes can be
extracted and recovered into more valuable and usable forms, such as biodiesel
which serves as a substitute to petroleum-based diesel. In Malaysia, palm oil is
mainly utilised as feedstock in biodiesel production due to its huge availability, low
price and good oil properties. The abundance of raw materials allows biodiesel
developers to cut down the production cost, making it more feasible for commercial
production.
Biodiesel, also known as methyl ester, is mainly derived from triglycerides in
vegetable oils through transesterification process with methanol. Apart from
vegetable oils, microalgae, waste cooking oils and animal fats can also be used as
feedstocks in biodiesel production. However, animal fats such as chicken fat, tallow
and yellow grease are seldom used since they contain high amount saturated fatty
acids that tend to solidify at room temperature, rendering the production process
difficult. Besides, waste cooking oil that contains high amount of undesired
impurities, such as free fatty acids and water encounters problems in meeting the
specific fuel quality standards. According to Rincón, Jaramillo and Cardona (2014),
European Union countries mostly utilised rapeseed oil, Argentina and United States
used soybean oil, and tropical countries such as Malaysia, Nigeria, Colombia and
Indonesia preferred palm oil. Although the yield and fuel properties of biodiesel may
differ by using different feedstock, all the fuel grade biodiesel produced in the world
must conform to the strict specifications such as ASTM D 6751 to ensure the
performance and quality.
Vegetable oils can be divided into non-edible and edible oils in which edible
oils accounted for 95% of biodiesel feedstocks due to its low free fatty acid content.
Common edible oils used in industry include soybean, rapeseed, sunflower, corn,
Linseed and palm oil while non-edible oils include Mahua, Neem, rubber seed, sea
mango, Castor, Karanja and Jatropha. Although edible oils predominate the biodiesel
raw material market, the extensive usage has cause several feedstock issues such as
deforestation, limited plantation land and food versus fuel debate. As such, many
researches divert their attention to non-edible oils which are toxic and unsafe for
consumption. Besides, non-edible oils can be produced in high yield from degraded
and low productive lands without intensive care, preserving arable lands for food
crop production. The only shortcoming is that the high free fatty acids contained in
non-edible oils will cause saponification, hence it requires additional steps in
6
pretreatment and separation process. This may add burden to the production cost and
lower the biodiesel quality to below the standards.
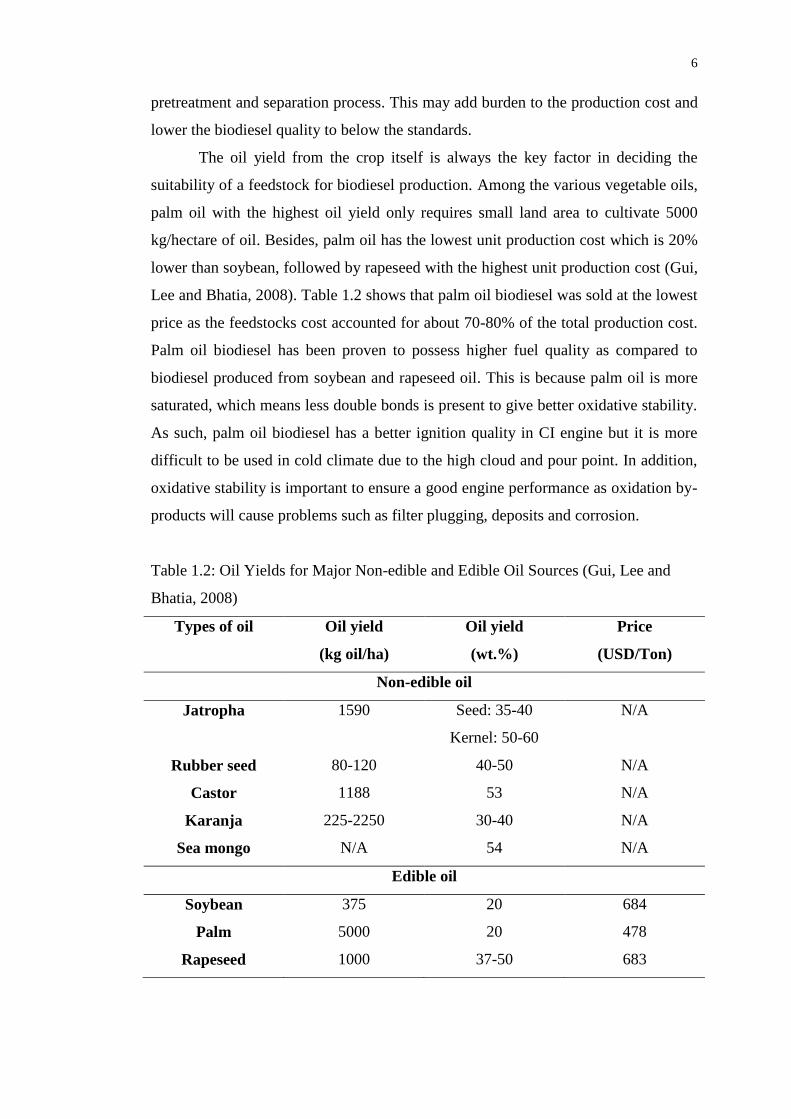
The oil yield from the crop itself is always the key factor in deciding the
suitability of a feedstock for biodiesel production. Among the various vegetable oils,
palm oil with the highest oil yield only requires small land area to cultivate 5000
kg/hectare of oil. Besides, palm oil has the lowest unit production cost which is 20%
lower than soybean, followed by rapeseed with the highest unit production cost (Gui,
Lee and Bhatia, 2008). Table 1.2 shows that palm oil biodiesel was sold at the lowest
price as the feedstocks cost accounted for about 70-80% of the total production cost.
Palm oil biodiesel has been proven to possess higher fuel quality as compared to
biodiesel produced from soybean and rapeseed oil. This is because palm oil is more
saturated, which means less double bonds is present to give better oxidative stability.
As such, palm oil biodiesel has a better ignition quality in CI engine but it is more
difficult to be used in cold climate due to the high cloud and pour point. In addition,
oxidative stability is important to ensure a good engine performance as oxidation by-
products will cause problems such as filter plugging, deposits and corrosion.
Table 1.2: Oil Yields for Major Non-edible and Edible Oil Sources (Gui, Lee and
Bhatia, 2008)
Types of oil Oil yield
(kg oil/ha)
Oil yield
(wt.%)
Price
(USD/Ton)
Non-edible oil
Jatropha 1590 Seed: 35-40
Kernel: 50-60
N/A
Rubber seed 80-120 40-50 N/A
Castor 1188 53 N/A
Karanja 225-2250 30-40 N/A
Sea mongo N/A 54 N/A
Edible oil
Soybean 375 20 684
Palm 5000 20 478
Rapeseed 1000 37-50 683

7
As a clean-burning fuel, biodiesel is non-toxic, biodegradable and
environmental friendly. As compared to conventional diesel, biodiesel with high
cetane number provides high brake power and better combustion due to its auto
ignition characteristic which reduces ignition delays. Besides, biodiesel with low
sulfur and aromatic content has successfully reduced the emissions of exhaust gases
such as sulfur dioxide, carbon monoxide, particulate matter and unburned
hydrocarbons to large extent. Moreover, the high flash point of biodiesel allows safe
handling and storing of biodiesel. The high clarity and purity of biodiesel allow it to
be used without adding additional lubricant which can extend engine life and reduce
the maintenance frequency. Similar to conventional diesel fuel, biodiesel blend fuel
does not require engine modification up to B20 and can be used directly in
compression ignition (CI) engine due to its similar physical properties.
Despite the aforementioned advantages, biodiesel still cannot fully replace
fossil fuel due to numerous practical issues that yet to be solved. Biodiesel with high
pour and cloud point is not suitable for usage in cold climate country as it tends to
gel and freeze, resulting in clogged filters and plugged pipelines. Although biodiesel
has a lower emission profile for most of the exhaust gases, it emits more NOx gases
which can result in the formation of smog and acid rain. Besides, the viscosity of
biodiesel which is about 11–17 times greater than diesel fuel leads to problems in
direct-injection engines (Hassan and Kalam, 2013). High viscosity of biodiesel will
form deposits which plug the orifices of injector systems, resulting in poor
atomisation and fuel pumping. In addition, it will cause problems such as coking
deposits of carbon, gelling and thickening of lubricating oil. Moreover,
polyunsaturated fatty acids contained in biodiesel are prone to oxidative
polymerisation. Hence, biodiesel will degrade easily and cannot be stored for long
periods. In addition, calorific value of biodiesel is 9% lower than conventional diesel,
which gives a lower energy output, resulting in higher biodiesel consumption in
order to produce the same amount of energy (Aransiola, et al., 2014).
1.4 Biodiesel Processing Technology
1.4.1 Direct use and Blending
In the past couple of decades, various researchers found that blending of diesel with
vegetable oil up to 20% had successfully improved the viscosity of pure vegetable
oils so that it can be easily used in diesel engines. However, in terms of long term

8
durability, the performance is unsatisfactory since it has problems with high viscosity,
free fatty-acid content, acid composition, carbon deposits, gum formation and
thickening of lubricating-oil. However, it is possible to use pure vegetable oil after
modification of engine such as changing of injector and piping construction materials.
Or else, it will speed up the engine wear and increase the maintenance costs. It was
reported that other processing methods such as micro-emulsification, pyrolysis and
transesterification could reduce the viscosity of vegetable oils.
1.4.2 Micro-emulsification
Micro-emulsification is described as a transparent, colloidal dispersion of fluid
microstructure with dimension of 1-150 nm in a methanol solvent, forming two
immiscible phases. Micro-emulsions will lower the viscosity of vegetable oils and
ease the atomisation process, thus improve the spray characteristics of biodiesel.
Besides, the methanol solvent used has high latent heats of vaporisation which can
help to cool the combustion chamber and reduces nozzle coking problems. However,
micro-emulsions generate lesser energy than diesel fuel due to its lower volumetric
heating value.
1.4.3 Thermal Cracking/ Pyrolysis
Pyrolysis is defined as the thermal degradation of long chain fatty acids in the
absence of oxygen by using catalyst. (Abbaszaadeh, et al., 2012). Thermal
decomposition of vegetable oils which compose mainly of triglycerides is said to be
a promising pathway for biodiesel production since the fuel properties are likely to
approach diesel fuels. In pyrolysis method, different intermediates and products can
be formed due to the complex mechanism and multiple reaction pathways that makes
pyrolytic chemistry difficult to be characterised. This method, however, is not widely
implemented because cracking process produces low-quality fuel oil that is highly
unstable, corrosive, tarry, and will release foul odour (Balat, 2008). Besides, high
cost of thermal cracking equipment used is not suitable for modest production.
1.4.4 Transesterification
Transesterification is the most widely used method to produce biodiesel by
converting triglycerides with an alcohol to form fatty acid methyl esters (FAME) and
glycerol. According to the overall equation illustrated in Figure 1.4, 1 mole of

9
triglyceride is reacted with 3 moles of alcohol to form 3 moles of FAME as main
product and 1 mole of glycerol as by-product. Excess alcohol is added to shift the
equilibrium towards the production of more biodiesel.
Figure 1.4: Overall Transesterification Reaction of Triglyceride with Alcohol (Ma
and Hanna, 1999)
1.4.4.1 Catalyst and alcohol used
Among all alcohols, methanol and ethanol are the most commonly employed alcohol
in commercial transesterification process because they can react rapidly with
triglyceride molecules and dissolve easily in alkaline catalyst. Methanol is of great
interest because it is very much cheaper and is more abundant than ethanol which
makes the biodiesel production more economical. The usage of methanol allows an
easier downstream recovery of unreacted alcohol since it does not form any
azeotrope with water like ethanol. However, methanol vapour is highly flammable
and is more likely to explode, thus it needs to be handled with care. Although ethanol
is more environmental friendly and is less toxic, it is not a preferred option because it
is more expensive and less reactive than methanol.
Generally, alcohol and triglycerides with different density and polarity are
immiscible, resulting in poor surfaces contact between methanol and vegetable oils
which will impede the reaction. To address this problem, catalysts are used to
improve the surface contact and consequently speed up the reaction rate, giving a
higher yield and conversion. Catalysts used in biodiesel production can be either
homogeneous or heterogeneous types. Homogeneous catalyst is normally in liquid
phase which is the same as the liquid reactants, thus handling becomes much easier.
On the contrary, heterogeneous solid catalyst is immiscible with liquid or gaseous
phase. However, it can be easily recovered after used. Besides that, catalyst can be

10
further divided into acid and base catalyst where the selection generally determined
by the free fatty acid (FFA) content in the feedstock oil.
1.4.4.2 Homogeneous and Heterogeneous Catalyst
Conventionally, homogeneous catalysts such as sodium hydroxide (NaOH),
potassium hydroxide (KOH), sulfuric acid (H2SO4) and phosphoric acid (H3PO4) are
commonly used in industrial biodiesel production as they are cheap and easily
available. They are more preferable due to their high catalytic performance and their
ability to perform under mild operating conditions within short duration time.
According to a report from Bobbili and Mosali (2011), since the catalyst is working
out in same phase as the reactants, handling becomes much easier whereby handling
all materials in liquid state is more convenient than handling liquid and solid together.
However, homogeneous catalysts are very sensitive to FFA, hence high-quality
feedstocks with low FFA (<3 wt%) is needed to prevent undesirable saponification.
Major problems associated with the usage of homogeneous catalysts include the
difficult catalyst recovery, low catalyst reusability, corrosion of equipment, low
purity of glycerin, complicated product purification, high water consumption and
waste stream pollution. Due to the various setback encountered in homogeneous
catalyst, recently, heterogeneous catalysts such as solid catalysts and enzyme
catalysts are highly researched to simplify and economise the transesterification
process.
Presently, the application of heterogeneous catalyst had gain popularity in
biodiesel production due to the numerous advantages that able to solve the technical
problems encountered in homogeneous catalyst. The advantages include
heterogeneous catalyst can produce high yield of biodiesel without the formation of
fatty acid and soap, which results in easier product separation. Next, heterogeneous
process directly produces pharmaceutical grade glycerin with high purity and low
water content, reducing the number of distillation column and refining process.
Meanwhile, no salt contaminants are formed, hence cost associated with waste
treatment is greatly reduced. Even the amount of glycerin generated is 20% less than
that of homogeneous process. However, pharmaceutical grade glycerin is a versatile
and valuable chemical that has high economic profit. Heterogeneous solid catalyst
also reduces the usage of corrosive chemicals such as sulfuric acid and sodium
methoxide, thus less potential contaminants are disposed to waste stream.

11
. Besides, the usage of solid catalyst reduces equipment corrosion and lower
the maintenance and insurance cost as well. Moreover, heterogeneous catalyst like
activated carbon derived from biomass is cheap and thermally stable, and it can be
recovered and reused. The long durability of catalyst makes the operation and
maintenance become easier because it does not need to be replaced regularly. (Kiss,
Jovanović and Bošković, 2010). Furthermore, heterogeneous catalyst does not need
additional storage and careful handling like corrosive chemicals used in
homogeneous process, making the process safer and reliable. In addition,
heterogeneous catalyst has higher tolerance on free fatty acid present in feedstock.
This allows the use of cheaper low-grade oil which can save substantial amount of
biodiesel production cost. Lastly, the usage of solid catalyst increases the number of
reactor options, such as fixed-bed or slurry reactor. The pores of solid catalyst can be
modified to enhance the selectivity towards the desired product. (Kiss, Jovanović and
Bošković, 2010).
On the other hand, there are some limitations of using heterogeneous catalyst.
Due to lower catalyst activity, heterogeneous reaction that requires extreme reaction
condition is carried out at higher pressure and temperature. This increases energy
consumption, therefore, higher utility cost is needed to operate. Besides, the use of
heterogeneous catalyst will contribute to depletion of fossil energy resources and
higher emission of greenhouse gases due to higher energy and methanol consumption.
Lastly, there are some possible issues related to the use of solid catalyst such as
poisoning and leaching of catalyst active site, which will result in contamination of
product.
1.4.4.3 Alkaline-catalysed transesterification
Base-catalysed transesterification is commonly used in commercial production since
it requires only mild operating condition to produce over 98 % conversion yield in
relatively short period (< 1hr); and the conversion rate is high with no intermediate
compounds formed (Refaat, 2009). However, base catalyst which is sensitive to FFA
content needs high-quality feedstock with low FFA content (< 1 % w/w). In addition,
moisture content is crucial in base-catalysed transesterification, hence all reactants
used must be substantially anhydrous (0.06 % w/w). The water present in it will
promote saponification to form soap and hydrolyse the produced ester into FFA.
Subsequently, the FFA will irreversibly consume and deactivate by base catalyst to
12
form alkaline salt. This will reduce catalyst efficiency and lead to lower ester yield.
Meanwhile, the soap formed will increase the viscosity of ester formed, leads to gel
formation and complicates the biodiesel purification process. Saponification can be
avoided by using high-quality refined feedstocks which is much more expensive, and
renders the biodiesel production not profitable.
The most commonly used homogeneous base catalyst includes potassium
hydroxide (KOH), sodium hydroxide (NaOH), potassium methoxide (KOCH3) and
sodium methoxide (NaOCH3). Among these homogeneous alkaline catalysts,
alkaline metal alkoxides such as CH3ONa are believed to perform better since they
can reach high yield (>98 wt%) in short reaction time (30 min) and no water is
formed during the reaction. However due to their toxicity, disposal problem and
lower price of metal hydroxide, NaOH and KOH are mostly employed in large-scale
production. For heterogeneous base catalyst, the most widely used catalysts are
alkaline earth metal oxides (CaO, MgO), zeolites, supported alkali metal and
hydrotalcite. These metal oxides, particularly CaO and MgO are cheap and readily
available. Therefore, they are more to be active and stable, which will be desirable
catalysts for industrial biodiesel production (Abbaszaadeh, et al., 2012). Similar to
their homogeneous counterparts, solid-base catalyst is more active than solid-acid
catalyst due to their higher activity. Heterogeneous base catalyst is better than
homogeneous catalyst in terms of separation and purification. However, the reaction
rate for solid catalyst is relatively slow due to the mass transfer limitation in two-
phase system.
1.4.4.4 Acid-catalysed transesterification
For raw material with high FFA content, a strong acid catalyst such as hydrochloric,
sulfuric, phosphoric acid or organic sulfonic acid is usually more favorable since it
gives a better conversion with no soap formation. Thus, acid catalyst has the
advantage of esterifying low-value feedstock such as waste cooking oil in biodiesel
production. A two-step transesterification is carried out with acid-catalysed
esterification followed by transesterification to convert FFA into methyl ester.
Besides, it is important to maintain the moisture content of raw material below 0.5 wt%
as acid catalyst is very sensitive to the presence of water. According to Dalai and
Baroi (2012), the increase in water content by 5% reduced ester yield significantly

13
from 95% to 5.6%, showing that acid catalyst will be deactivated by the presence of
small amount of water.
Acid-catalysed reactions are less effective as compared to base-catalysed
reactions due to the extreme operating conditions needed to operate. Moreover,
excess methanol is used to increase the conversion of triglyceride molecules. In
practice, in order to reduce the reaction time, acid catalyst is only used to convert
FFA to esters during esterification step while base catalyst is used to catalyse the
transesterification of triglycerides to esters. In general, acid-catalyst
transesterification is usually performed at the following conditions: a high molar
ratio of methanol to oil of 12:1; high temperatures of 80-100 oC; and a strong acid
namely sulfuric acid (Thanh, et al., 2012). Other disadvantages of using acid catalyst
are corrosive effluent, low catalyst regeneration and high equipment cost.
Compared to homogeneous acid catalyst, solid-acid catalyst has better
performance since it contains various strong and weak acid sites such as Bronsted
and Lewis acid. Solid acid catalysts with high acid density such as sulfated zirconia,
Nafion-NR50 and tungstated zirconia are favourable for biodiesel production
(Aransiola, et al., 2014). Besides, heterogeneous acid catalyst is popular in industrial
processes since it eliminates the need for biodiesel purification as the catalyst can be
separated easily. Unlike homogeneous acid catalyst, heterogeneous solid acid
catalyst is insensitive to FFA content and will not cause corrosion problem
(Abbaszaadeh, et al., 2012).
1.5 Problem Statement
Due to the energy security issues and the growing environmental awareness brought
by the extensive usage of fossil fuel, the search for alternatives energy becomes a
worldwide effort. For now, biodiesel is hailed as a potential saviour for the
environment which can substitute diesel fuel in energy generation. Although
biodiesel production is widely studied in industry and research, none of them come
out with a perfect solution to solve the practical issues faces currently. The major
obstacle encountered in commercial biodiesel production is the high production cost
which is about threefold of the conventional diesel. In order to lower the production
cost, low-cost feedstocks with high FFA content such as palm fatty acid distillate
(PFAD) can be used. Yet, current industry practice fails to process low-grade
feedstock with high FFA and moisture content.
14
Besides, design of effective catalyst is also an important element to achieve
more economic production. Currently, homogeneous alkaline catalyst employed in
commercial production has the largest limitation dealing with the high FFA content
although it shows higher reaction rate than acid catalyst. On the contrary,
heterogeneous acid catalyst is a preferable option to deal with high FFA raw
materials as it does not form soap and easy to be separated after reaction. In this case,
heterogeneous catalyst seems to be a potential catalyst to be used in the biodiesel
process due to its high yield of biodiesel formed and simple purification procedure.
In this study, various chemical pretreatment parameters were studied to
obtain the optimum conditions to synthesise a highly porous and reactive biomass
catalyst. The usage of different biomass material as activated carbon precursor need
to be studied as different biomass has its own carbon content.
1.6 Aims and Objectives
This research project aims to study the effect of different pretreatment parameters on
the solid acid and alkaline catalyst derived from three different biomass using three
different sulfonation methods. The objectives of this study include:
i. To investigate the optimum pretreatment conditions for oil palm frond precursor.
ii. To compare the optimum sulfonation method from 4-BDS, ammonium
persulfate and direct sulfonation.
iii. To characterise the chemical and physical properties of synthesised catalyst
using SEM-EDX, TGA, FTIR, TPR and GC.
1.7 Scope and Limitation of the study
This research project focuses on the pretreatment parameters used to synthesis solid
catalyst from the biomass. The first part of the project focus on the selection of
optimum biomass among 3 different biomass precursors which are banana peel, palm
oil frond and empty fruit bunch. Part 2 of the research focuses on the determination
of optimum pretreatment condition to synthesise a thermally stable and high activity
activated carbon. After the biomass is activated, three different sulfonation methods
that include 4-BDS, direct sulfonation and sulfonation with ammonium persulfate are
investigated to obtain the sulfonated activated carbon with the best outcome. Part 4
of the research is carried out to study the production of biodiesel by using the catalyst
15
synthesised from previous parts. The efficiency of sulfonated solid catalyst will be
tested in esterification of palm fatty acid distillate (PFAD) and various parameters of
the process are manipulated to obtain the optimum conditions with best performance.
However, there are several limitations which need to be considered and can
be improved in the near future. The scope of this study only covers the pretreatment
parameter of the catalyst. Other parameters regarding the sulfonation process and
biodiesel production such as sulfonation duration, concentration of sulfuric acid,
catalyst loading, reaction duration, reaction temperature and methanol to PFAD
molar ratio are not being investigated.
1.8 Contribution of the Study
Most of the researchers had discussed about the biomass-derived heterogeneous
catalyst for biodiesel production. Chemical activation of biomass using phosphoric
acid and zinc chloride are the typical acid activating agents used. However, alkaline
activating agent, NaOH is going to be implemented in this research study. Besides,
the impregnation process will be conducted with mild heating, which is not
implemented in the previous research studies. Other than that, activated carbon is
commonly sulfonated via arylation using 4-benzenediazoniumsulfonate (4-BDS).
Nevertheless, in this study, direct sulfonation using concentrated sulfuric acid will be
conducted to synthesise catalyst.
1.9 Outline of the Report
Chapter 1 outlines the brief overview of the current energy scenario and the common
biodiesel production technology used. Problem statement, aims and objectives, scope
and contribution of the study are discussed. Chapter 2 reports the results obtained
from related research journals on heterogeneous catalyst production. This includes
prior empirical study of the types of biomass precursors and activating agent used,
pretreatment conditions such as carbonization temperature and impregnation ratio,
catalyst sulfonation method and reaction mechanisms of biodiesel production. Next,
Chapter 3 describes the research methodology and planning of synthesising the solid
acid catalysts and subsequent biodiesel production. Chapter 4 discuss on the data
obtained through analysis and interpretation on the performance of catalysts. Lastly,
Chapter 5 concludes the study and suggests the possible recommendations.

16
CHAPTER 2
2 LITERATURE REVIEW
2.1 Transesterification mechanism
Biodiesel can be produced by transesterification process which consists of a number
of reversible and consecutive reactions in which alcohol is added in excess to shift
the equilibrium towards the desired fatty acid methyl esters (FAME). Figure 2.1
shows the stepwise conversion of triglyceride to diglyceride and monoglyceride
intermediates, and eventually generates 3 moles of FAME and 1 mole of glycerol.
Commonly, the use of acid or base catalyst is highly dependent on the FFA content
present in the feedstock. Acid-catalyst transesterification is preferable for oils with
high FFA and moisture content while base-catalyst is recommended for oil with FFA
content less than 1wt%.
Figure 2.1: Transesterification Reactions of Triglyceride with Alcohol (Ma and
Hanna, 1999)
2.1.1 Mechanism for base-catalysed transesterification
Figure 2.2 summarises the stepwise mechanism of triglyceride breakdown in base-
catalysed transesterification. Firstly, protonated catalyst and nucleophilic alkoxide
(methoxide ion) are generated in the reaction of alcohol with the base catalyst. The
second step is the formation of tetrahedral intermediate due to the nucleophilic attack
of alkoxide at the electrophilic part of the carbonyl carbon atom on the triglyceride.

17
The third step involves the breakdown of the unstable intermediate tetrahedral into
fatty acid methyl ester and the corresponding diglyceride anion. Lastly, the catalyst is
deprotonated through proton transfer, thus active species are recovered for the use in
subsequent catalytic cycle. The same mechanisms steps are repeated for cleavage of
each fatty acid methyl ester and conversion of diglycerides and monoglycerides to a
mixture of three fatty acid methyl esters and one glycerol.
Figure 2.2: Mechanism for Base-catalysed Transesterification (Ma and Hanna, 1999)
For an alkali-catalysed transesterification, the reaction of hydroxide with
alcohol will form water which will hydrolyse some of the produced esters and cause
saponification. The undesirable soap produced reduces the FAME yield and results
in difficult separation of the separation of ester from by-product due to the formation
of emulsions which increase the viscosity of product mixture. Therefore, feedstock
with low FFA content is needed for alkali-catalysed transesterification. Or else, a
two-step transesterification is employed to esterify the FFA content in triglyceride
before transesterification process can be conducted.

18
2.1.2 Mechanism for acid-catalysed transesterification
Figure 2.3 shows the mechanism of acid-catalysed transesterification of triglycerides.
Firstly, the hydrogen ions generated from the acid catalyst will protonate the
carbonyl group on the triglycerides. Then, a tetrahedral intermediate forms after
nucleophilic attack of the alcohol on the carbonium ion. Lastly, unstable tetrahedral
intermediate will be broken down and leads to proton migration. After repeating
twice, three new fatty acid methyl esters and one glycerol were produced as products
and the catalyst was regenerated. During the catalytic process, protonation of
carbonyl group boosts the catalytic effect of acid catalyst by increasing the
electrophilicity of the adjacent carbonyl carbon atom. However, FAME yield will be
affected due to the competitive formation of carboxylic acids by reaction of water
with carbonium ions generated. This phenomenon can be avoided by conducting the
acid-catalysed transesterification in the absence of water.
Figure 2.3: Mechanism for Acid-catalysed Transesterification (Ma and Hanna, 1999)
2.2 Esterification mechanism
This method is useful when dealing with low-value feedstocks which need to be
pretreated (esterification) to reduce FFA content before base-catalysed
transesterification reaction can be carried out at an FFA mass fraction lower than 0.5%
(Aransiola, et al., 2014). A two-step transesterification process involves the first step
which is the acid catalysed esterification of the FFA to FAME, followed by a second
step which is the common alkali catalysed transesterification.
19
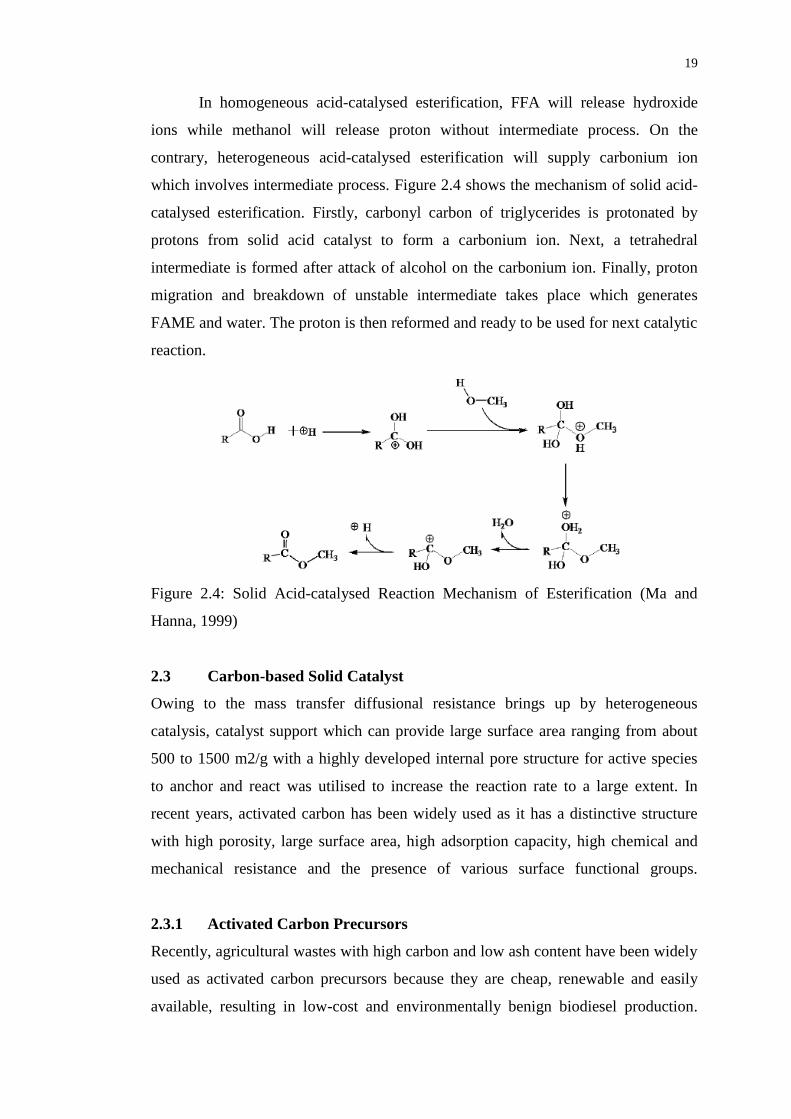
In homogeneous acid-catalysed esterification, FFA will release hydroxide
ions while methanol will release proton without intermediate process. On the
contrary, heterogeneous acid-catalysed esterification will supply carbonium ion
which involves intermediate process. Figure 2.4 shows the mechanism of solid acid-
catalysed esterification. Firstly, carbonyl carbon of triglycerides is protonated by
protons from solid acid catalyst to form a carbonium ion. Next, a tetrahedral
intermediate is formed after attack of alcohol on the carbonium ion. Finally, proton
migration and breakdown of unstable intermediate takes place which generates
FAME and water. The proton is then reformed and ready to be used for next catalytic
reaction.
Figure 2.4: Solid Acid-catalysed Reaction Mechanism of Esterification (Ma and
Hanna, 1999)
2.3 Carbon-based Solid Catalyst
Owing to the mass transfer diffusional resistance brings up by heterogeneous
catalysis, catalyst support which can provide large surface area ranging from about
500 to 1500 m2/g with a highly developed internal pore structure for active species
to anchor and react was utilised to increase the reaction rate to a large extent. In
recent years, activated carbon has been widely used as it has a distinctive structure
with high porosity, large surface area, high adsorption capacity, high chemical and
mechanical resistance and the presence of various surface functional groups.
2.3.1 Activated Carbon Precursors
Recently, agricultural wastes with high carbon and low ash content have been widely
used as activated carbon precursors because they are cheap, renewable and easily
available, resulting in low-cost and environmentally benign biodiesel production.

20
The agricultural wastes used for activated carbon synthesis also offers an
environmental friendly and cost-effective way to overcome the waste disposal
problems. Basically, the choice of precursor to synthesise activated carbon depends
on its availability, purity, price, potential to be activated, possibility of degradation
by aging and inherent porosity and filterability (Yahya, Al-Qodah and Ngah, 2015).
Table 2.1 present the lignocellulosic composition of a variety of agricultural residues,
which will directly affect the properties, quality and performance of the activated
carbon produced.
Table 2.1: Lignocellulosic Composition of Agricultural Residues (Yahya, Al-Qodah
and Ngah, 2015)
Agricultural waste Cellulose Hemicellulose Lignin
Palm shell 29.0 47.7 53.43
Coconut shell 19.8 68.7 30.1
Almond shell 32.5 25.5 24.8
Walnut shell 40.1 20.7 18.2
Almond tree
pruning
33.7 20.1 25.0
Olive stone 30.8 17.1 32.6
Banana empty fruit
bunch
8.30 21.23 19.06
Delonix regia fruit
pod
13.90 24.13 23.36
Pomegranate seed 26.98 25.52 39.67
Coconut husk 0.52 23.70 3.54
Cocoa pods 41.92 35.26 0.95
Kola nut pod 38.72 40.41 21.29
Plantain peel (ripe) 13.87 15.07 1.75
Plantain peel
(unripe)
10.15 11.38 1.75
Coconut shell 15.0 35.0 50.0
Apple pulp 16.0 16.0 21.0
Plum pulp 6.5 14.5 39.0

21
Table 2.1 (Continued)
Agricultural waste Cellulose Hemicellulose Lignin
Plum stone 23.0 20.0 49.0
Olive stone 14.0 15.0 42.0
Soft wood 36.0 18.5 30.5
Coconut shell 14.0 32.0 46.0
Sugarcane bagasse 42.16 36.0 19.30
Cocoa pod husk 41.92 35.26 0.95
2.4 Activated Carbon Preparation
In general, physical and chemical treatment are the two common methods employed
in activated carbon preparation to change the physical properties of the support. In
physical treatment, the biomass precursor is first carbonised followed by activation
under a flow of carbon dioxide or steam. High degree of burning will burn off large
amount of internal carbon mass, which eventually form activated carbon with high
porosity.
In chemical treatment, activating reagent (ZnCl2, H3PO4, NaOH and KOH) is
used to impregnate carbon precursors prior to carbonisation under an inert
atmosphere. The dehydrogenation effect of chemical reagents will form cross-links
and develop a rigid matrix which is less susceptible to volatile loss and is less likely
to shrink when used (Islam, et al., 2018). Nevertheless, chemical activation is now
widely implemented owing to its simplicity, lower activation temperature, lower
volatile matter content, higher product yield, higher surface area and good
development of micropores. However, the impregnated carbon material need to be
washed thoroughly in order to remove the remaining activating agent which is
corrosive. The choice of activation technique will determine the adsorption
performance and pore characteristics of activated carbon.
2.4.1 Physical Activation
As aforementioned, physical treatment consists of two steps which are carbonisation
and activation. It is a dry oxidation process since the sample is reacted under gas
mixture (CO2 and air) or steam at carbonisation and activation temperature ranges
between 400-850oC and 600–900oC respectively (IOANNIDOU and ZABANIOTOU,
2007). It is more preferable to use CO2 gas since it is clean, easy to operate and its
22
slow reaction rate allows the temperature to be maintained at around 800 oC. (Yahya,
Al-Qodah and Ngah, 2015) In addition, activation using CO2 can develop pores with
high uniformity as compared to steam.
According to Prahas, et al. (2008), polymeric cellulose or lignin undergoes
pyrolytic decomposition and eliminates gases and tars which consists of light volatile
elements and aromatic compounds. This process will initiate the formation of pores
in the carbonaceous char with high content of fixed carbon. Then, this carbonaceous
char will be activated to form high porosity activated carbon through further
gasification.
During activation, the pores initially formed in the char is further developed
when organic matter that is more volatile is eliminated selectively, hence generating
highly porous activated carbon. Pores and channels are formed when oxidising gases
entering into the carbon bulk bring away the volatile matters through particles,
creating more pores which result in ordered carbon structure with high porosity. The
pores developed during physical activation can be summarised into three phases;
creation of new pores, widening of old pores, and porosity development by selective
removal of cellulose material (Li, et al., 2008). Physical and chemical properties of
the synthesised activated carbon are highly dependent on the type and degree of
thermal activation.
2.4.2 Chemical Activation
Chemical activation, also known as wet oxidation involves the impregnation of
carbon precursor in activating reagent before it is heat-treated under inert atmosphere.
According to Yahya, Al-Qodah and Ngah, (2015), chemical activation is conducted
at a relatively low temperature range between 450 to 600 oC, depending on the
dehydration action of the activating agent on cellulose component in the starting
material. The chemical catalysts that usually used can be divided into basic reagent
(KOH, NaOH) and acidic reagent (ZnCl2, H3PO4, H2SO4, HCl, HNO3). Of the many
chemical reagents proposed, ZnCl2, H3PO4 and KOH are the most commonly used.
The use of chemical agent restricted the formation of the tar or ash, this not only
increases the carbon yield in the carbonised product but also changes the pyrolysis
decomposition of the precursors, resulting in enhanced porosity. Besides, activating
agents can introduce oxygen functional groups to the surface of the carbon precursor.
After activated by chemical, acid or alkali was used to wash the activated carbon

23
followed by water to wash away the activating agents occupied in the pores of
activated carbon so that porosity can be developed.
2.5 Effect of Chemical Activation Parameters
2.5.1 Effect of activating agents
In chemical activation method, carbon precursors can be impregnated by a wide
range of acid and base chemical agents such as ZnCl2, H3PO4, H2SO4, K2CO3, KOH
and NaOH. Both acid and alkali activating agents could improve the pore properties
of carbonised carbon and introduce different functional groups onto the surface of
biochar, increasing the availability of binding sites. The chemical attack of acid and
alkali agent removes volatile matter which corresponds to the decomposition of
lignin and cellulose component. This develops porosity (micropores and mesopores)
and increases specific surface area of carbon.
Various literatures reported that ZnCl2 and H3PO4 are commonly used among
the acid chemical activating agents for lignocellulosic materials. Chemical treatment
with ZnCl2 mainly produces microporous structure with significant surface area as
compared to H3PO4. ZnCl2 which acts as dehydrating agent induces the charring by
breaking the lateral bond in lignocellulosic structures into fragments. This allows
reorganisation of the fragments into a new matrix, causing the particles to swell and
develop voids between carbon layers. The voids created will eventually develop
microporous structure upon activation. (Kalderis, et al., 2008) Fragmentation also
inhibited the tar formation which avoided the blocking of pores and fissures,
resulting in enhanced carbon yield. Besides, ZnCl2 has the ability to increase the
combustion energy during pyrolysis process could enhance the porosity development
of the activated carbon. (Yahya, Al-Qodah and Ngah, 2015)
It was reported that H3PO4 was effective in producing the mesopores with
high pore volumes and diameter, resulting in wide pore size distribution. The surface
area obtained from the chemical treatment of H3PO4 was far lower than the one
treated by ZnCl2 (350 – 700 m2 /g by H3PO4 activation and 500 –2000 m2 /g by
ZnCl2 activation) (Ismail, Taha and Ramli, 2016). The lower surface area of the
carbon obtained may be due to the strong bonding of phosphates within the
lignocellulosic structure, leading to the formation of cross-link structures which will
shrink and reduce the porosity at activated carbon at high temperature. The usage of
H3PO4 activator only required low activation temperature at around 400 oC and still

24
produce activated carbon with good chemical and thermal stability. Although ZnCl2
activation results in significant surface area, nevertheless H3PO4 is more favourable
than ZnCl2 since it is eco-friendlier.
An example of the usage of ZnCl2 and H3PO4 for activation is the work of
Hayashi, et al. (2000) who prepared activated carbon from Kraft lignin pulping. It
was observed that the surface area obtained for ZnCl2 is higher than that of H3PO4,
which were 1000 m2/g and 700 m2/g at 500 oC, respectively. Similar results were
obtained by Liou and Wu (2009) in his studies on chemical activation of rice husk
using H3PO4 and ZnCl2 as activating agents. The result showed that ZnCl2 activated
carbon had a more remarkable BET surface area (2434 m2/g) as compared to H3PO4
activated carbon (1741 m2/g) at the same activation condition. Unlike Zn salts, the
strong bonding of phosphorus compounds with carbon makes it hard to be recovered
during washing steps after activation, hence restricting the pores development and
resulted in reduced surface area. Pua, et al. (2011) studied the optimum BET surface
area of activated carbon supported catalyst and the optimal reaction conditions of
biodiesel production. It was reported that the phosphoric treated Kraft lignin
activated carbon yielded a high contact area of 654.4 m2/g, indicated that phosphoric
pretreatment developed well-defined pores on the carbon surface. The solid catalyst
produced able to give a high biodiesel yield of 96.3% via esterification of non-
pretreated Jatropha oil. Various researches done by using different carbon precursors
such as coconut shell and Jatropha curcas fruit shell treated with H3PO4 and their
respective reaction conditions were summarised in Table 2.2.
For alkaline activator, KOH and NaOH are the most commonly used
activating agents due to their ability to produce activated carbon with well-developed
porosity and narrow pore size distribution. It has been proposed that the activation
mechanisms of alkaline activators were different from those of acid activators like
ZnCl2 and H3PO4. This is proved in a research work done by Hayashi, et al (2000)
that the alkali treated carbon had a maximum surface area at the temperature of
800oC while ZnCl2 and H3PO4 had the best results at the temperature of 600oC, but
do not work well at temperature beyond that. Although activation with ZnCl2 only
required a low temperature, however, the use of KOH was preferred because it is
eco-friendlier as compared to ZnCl2.
In previous literatures, it has been always concluded that KOH was more
effective than NaOH. However, this statement was proved wrong after a few recent

25
researchers found that the effectiveness of NaOH depends on the structural
organisation of the carbon precursors, which was not previously considered. There
were clear evidences that NaOH was better for carbons with poorly organised
materials (e.g., almond shell), whereas KOH was found effective for carbon with any
structural order (e.g., anthracite), especially more efficient with increasing
crystallinity. The difference in effectiveness is attributed to the ability of K and Na
metal to intercalate into the carbon structure. According to Raymundo-Piñero, et al.
(2005), the intercalation ability of KOH and NaOH was studied using nanotube
materials with different crystallinity including highly ordered graphite walls and
nanotubes with amorphous layers. It was reported that K metal intercalates well into
the well-organised nanotubes walls while Na metal can intercalate better in poorly
organised or defective structure. K metal that intercalates better than Na metal able to
develop microporosity with more binding sites. In conclusion, the degree of
crystallinity of carbon precursor is an important parameter which must be taken into
consideration when dealing with alkali agents.
Muniandy, et al. (2014) had carried out the activation of rice husk by adding
3g of rice husk carbon into 40% (w/w) of KOH and NaOH solution. From the result,
it was observed that KOH activation gave a higher surface area (682.6 m2/g)
compared to NaOH (594.9 m2/g) at the same temperature of 750oC. The larger
surface area was owing to the fact that K metal is more reactive than Na metal, the
effective activation generates highly porous carbon with micropores. Table 2.2
summarises the use of KOH and NaOH to activate various agricultural residues and
their respective reaction conditions for esterification process.

26
Table 2.2: Various Activating Agent Used and the Corresponding Performance of the Activated Carbon Catalyst
Biomass Activating
agent
BET
Surface
Area
(m2/g)
Reaction Conditions Yield
(%)
Reference
Feed Stock Temperature
(oC)
Alcohol to
Oil molar
ratio
Reaction
time (h)
Catalyst
Loading
(wt%)
Kraft Lignin H3PO4 654.4 Jatropha
Oil
80 12:1 5 5 96.3 Pua, et al.
(2011)
Coconut Shell H3PO4 898.6 WFO 60 25:1 2 Catalyst
bed height:
250mm
86 Buasri, et
al.(2012)
Jatropha
curcas Fruit
Shell
H3PO4 927.85 WFO 60 16:1 2 Catalyst
bed height:
250mm
87 Buasri, et al.
(2012)
Albizia
Lebbeck Pods
H2SO4 1827.23 Rubber
Seed Oil
55 7:1 1.5 1.5 97.2 Subramonia
Pillai, et
al.(2017)

27
Table 2.2 (Continued)
Biomass Activating
agent
BET
Surface
Area
(m2/g)
Reaction Conditions Yield
(%)
Reference
Feed Stock Temperature
(oC)
Alcohol to
Oil molar
ratio
Reaction
time (h)
Catalyst
Loading
(wt%)
Pomelo Peel KOH 278.2 Palm Oil 65 8 2.5 6 98 Zhao, et al.
(2018)
Meat and bone
meal
KOH 430.52 Palm Oil 65 7:1 2.5 5 98.2 Wang, et al.
(2017)
Flamboyant
Pods
KOH 820 Rubber
Seed Oil
55 15 1 3.5 89.81 Dhawane,
Kumar and
Halder (2016)
Palm Shell
KOH 1015 Palm Oil 64.1 24 1 30.3 97.72 Baroutian, et
al.(2010)
Green Mussels
Shell
NaOH N/A Palm Oil 65 2:1 weight
ratio
3 7.5 95.12 (Hadiyanto, et
al., 2017)

28
2.5.2 Effect of Impregnation Ratio
Impregnation ratio is defined as the ratio of the weight of the carbon precursor to the
activating agent, which are typically in the range of 1:0.5 to 1:3 based on dry matter.
The degree of impregnation ratio is one of the key factors which will affect the
chemical activation process and is seen as an analogue to the magnitude of burn-off
in physical activation. Generally, at higher chemical concentration, better porosity
development in activated carbon is observed since the effect of the activation agent
increases with increasing dose. According to Ismail, Taha and Ramli (2016), he
found out that by varying impregnation ratio of rice husk to ZnCl2 from 1:1 to 1:4,
the carbon yield and BET surface area increased proportionally with the
impregnation ratio. The yield and BET surface area increased from 37.85% to 40.9%
and from 412.686 m2/g to 922.319 m2/g, respectively. This is because by increasing
the impregnation ratio, the formation of tar was inhibited, hence carbon yield was
enhanced.
Similar result was obtained by Md Arshad, et al. (2016) in which three
different concentrations of KOH activating agent (0.5M, 1.0M and 2.0M) were used
in the impregnation of 4g of activated carbon, which was empty fruit bunch in this
case. BET result indicated that the samples surface area increased from 305 m2/g to
687 m2/g when KOH concentration increased from 0.5M to 2.0M. The increase in
surface area also accompanied by an increase in pore diameter and micropore volume.
At greater amount of KOH impregnation concentration, the dehydration effect
becomes more significant which led to the opening of pores, leading to formation of
porous structure and increased sample surface area.
However, in the study of Kalderis, et al. (2008), the effect of impregnation
ratio to two different carbon precursors, bagasse and rice husk was slightly different
from the previous studies. In this study, both bagasse and rice husk were impregnated
with ZnCl2 at a ratio of 0.25, 0.5, 0.75 and 1. With the increased ratio from 0.75 to 1
for bagasse, a turning point was observed where surface area started to decrease. The
decrease in surface area may due to the collapsing and widening of micropores,
leading to the development of mesopores. Whereas for rice husk, the carbon with the
highest surface area (750 m2/g) was obtained at a ratio of 1:1 (w/w), no turning point
was observed as in bagasse.
In a work by Budi, et al. (2016), coconut shell charcoal carbon was activated
using varied concentration of KOH solution at 30, 40, 50 and 60%. It was reported

29
that the pore number increased and pore size distribution became narrow as KOH
concentration was increased. However, at higher KOH concentration, the number of
pores decreased and pore size distribution was widened due to the aggressive attack
of chemical that weakened and progressively collapsed the incipient carbon structure.
Thus, optimisation of impregnation ratio is important to achieve a balance between
the two competing mechanism phenomenons during activation process, namely
micropore formation and pore widening.
2.5.3 Effect of Carbonisation Temperature
In general, the increase in carbonisation temperature usually accompanied by an
increase in number of pores and surface area because volatile matter tends to escape
from carbon precursor at high temperature, leaving vacancies for new pores
formation. However, the further increase in temperature will destroy the micropore
structure by collapsing or closing of pores and ultimately lowering the surface area
and carbons yields.
Kalderis, et al. (2008) studied the effect of temperature on the pores
properties of activated carbon prepared from bagasse and rice husk by ZnCl2
activation performed at temperatures of 400, 600, 700 and 800 oC. The results
indicated that the highest surface area for both materials, which were 674m2/g and
750 m2/g respectively, was obtained at the optimum activation temperature of 700 oC.
The higher temperature released more tars and gasses which eventually generated
new micro- and mesopores. However, at a temperature beyond 800 oC, the surface
area of activated carbon for both bagasse and rice husk will decrease significantly
due to the violent gasification reaction. This will widen and collapse the existing
pores, hence reducing the surface area available for binding sites attachment.
Zhao, et al. (2018) investigated the effect of the carbonisation temperature on
the surface area and pore structure of activated carbon produced from pomelo peel.
They found that as calcination temperature increased from 500 to 600 oC, the yield
rose from 97.1% to 98%, reaching the maximum. However, further increase of
temperature to 800 oC was not favorable since the elevated temperature might be too
high and cause sintering of catalyst surface to occur. The sharp decreased in surface
area might reduce the availability of active sites on the carbon surface.
Another study showed that when carbonisation temperature varied from 400-
700 oC , both ZnCl2 and H3PO4 activated rice husks samples had the highest BET

30
surface area at 500 oC as shown in Table 2.3 and Figure 2.5. Liou and Wu (2009)
stated that at temperature below 500 oC, biomass precursors was not fully carbonised,
pores may not fully develop and therefore resulted in a low surface area. However, at
a temperature greater than 500 oC, the violent gasification reactions might inhibit the
micropores formation and collapse or destroy part of the developed micropores,
resulting in mesopores formation. As a result, increased carbonisation temperature
widen the micropores and led to an increase in mesopore volume.
Table 2.3: Surface Area and Pore Characteristics for Carbonation and Activation of
Sample (Liou and Wu, 2009)
Activation
Temperature
(oC)
SBET
(m2/g)
VT
(cm3/g)
Vmic
(cm3/g)
Vmeso
(cm3/g)
Vmac
(cm3/g)
Dp
(nm)
H3PO4 activation
400 1278 0.722 0.366 0.308 0.048 2.26
500 1741 1.315 0.286 0.672 0.357 3.02
600 1425 1.004 0.286 0.486 0.232 2.82
700 1380 0.912 0.293 0.405 0.214 2.75
ZnCl2 activation
400 1545 0.798 0.463 0.285 0.050 2.06
500 2434 1.344 0.590 0.682 0.072 2.21
600 2062 1.090 0.473 0.593 0.024 2.11
700 1798 1.008 0.415 0.552 0.041 2.24

31
Figure 2.5: Effect of Carbonisation Temperature on the Surface Area of Samples: (a)
H3PO4 Activation and (b) ZnCl2 Activation (Liou and Wu, 2009)
2.6 Sulfonation of activated carbon
After carbonisation and activation steps, acid functional groups were attached to the
activated carbon surface through different sulfonation methods such as direct
sulfonation, arylation of 4-benzenediazonium sulfonate (4-BDS) and sulfonation by
thermal decomposition of ammonium persulfate to form heterogeneous acid catalyst.
Table 2.4 summarises a number of literatures that reported the application of
sulfonated activated carbon as an effective catalyst for biodiesel production
According to Konwar, et al. (2015), different carbon precursors such as J.
curcas, P. pinnata and M. ferra L were sulfonated to prepare mesoporous solid
catalyst. Direct sulfonation and sulfonation by arylation of 4-BDS methods were
studied to investigate the effects of preparation method on the -SO3H density and
pores characteristics. It was reported that 4-BDS (4-benzenediazoniumsulfoante) was
a better sulfonating agent as compared to the conventional H2SO4 in the sulfonation
of rigid and highly ordered carbon structures such as activated carbon and graphene.
Sulfonated carbon catalyst prepared by 4-BDS method exhibited well-developed
pores and high -SO3H density. 4-BDS sulfonation method was claimed to be more
effective than direct sulfonation method due to the ability to preserve the
morphological structure of catalyst support under a mild temperature. This method is
32
mostly employed for carbon precursors with rigid and highly ordered structures. In
this method, reduction of 4-BDS in the presence of H3PO2 generated aryl radicals
which attached covalently on the carbon surface.
FTIR spectra with emergence band of S=O and -SO3H stretching proved
successful incorporation of -SO3H and PhSO3H groups on the carbon surface. The
attachment of acid groups was consistent with the reduction in pore volume (28–
40%), pore diameters (0.4–1.9 nm) and surface areas (300–400 m2/g) of the
sulfonated materials. It was reported that the SO3H density obtained by 4-BDS was
higher than that of direct sulfonation. The high SO3H density in 4-BDS was due to
the increase in C content where more sites were available for 4-BDS radicals to
attach on it. On the contrary, direct sulfonation exhibited relatively low SO3H density
since H2SO4 sulfonation was difficult to sulfonate activated carbon with rigid and
ordered frameworks even at higher temperature. Furthermore, it was demonstrated
that the weight ratio of 4-BDS to sulfanilic acid barely affect the SO3H density,
instead, the SO3H density depends on the amount of carbon content (Sp2C sites) for
PhSO3H attachment. Besides, Konwar, et al. (2015) also found that the highest acid
conversion in esterification by 4-BDS sulfonated catalyst was attributed to its highly
porous carbon structure with relatively high SO3H density. Further, the stability of 4-
BDS sulfonated catalyst also outperformed the conventional H2SO4 sulfonation
method which had poor reusability owing to the easy leaching of SO3H groups from
the sulfonated catalyst.
According to Ezebor, et al. (2014), activated carbon prepared from oil palm
trunk (OPT) and sugarcane bagasse (SCB) were sulfonated using concentrated
H2SO4 through direct sulfonation method in catalyst production. The study aimed to
investigate the effect of sulfonation method on surface acidity, surface properties and
catalytic activity of catalyst prepared. Results of FT-IR vibration band of –SO3H
functional group indicated that appreciable sulfonation had taken place and the FT-
IR spectra of catalysts prepared at varied sulfonation duration from 4h to 10h showed
no large difference in the intensity of –SO3H peak. This proved that sulfonation
duration had a negligible effect on the total acid density of catalyst surface. Sulfonic
acid density was the highest at the beginning of sulfonation but it started to decrease
and reached a plateau as the available sites for sulfonation decreased with time.
Besides, the decrease in void volume after sulfonation proved that the Bronsted acid
sites were successfully anchored on the carbon surface, resulting in less pore opening.

33
The oil palm trunk and sugarcane bagasse catalyst showed a high FAME
yield of 80.60% and 83.32%, respectively in the esterification of palmitic acid
conducted at 130 °C. SCB derived catalyst had a slightly better result than OPT due
to its higher SO3H density which allowed more reactants to access the Bronsted acid
sites. In addition, both catalysts able to reduce high FFA content oil rapidly from
42wt% to <1 wt% in 15min of esterification. In catalyst reusability test, it was
reported that both catalysts able to maintain the 98% of catalytic activity after four
cycles, this indicated that no leaching of sulfonic acid occurred.
Next, the feasibility of sulfonation by thermal decomposition of ammonium
persulfate was examined by Shuit and Tan (2014). The FAME yield of 88% was
achieved by the sulfonated multi-walled carbon nanotubes (MWCNT) catalysed
esterification at 170 °C for 3 hours. This high yield can be explained by the high
sulfonic acid density in the catalyst (0.029 mmol/g) which can contribute more active
sites for esterification. In catalyst reusability test, the sulfonated MWCNTs can be
reused for at least 5 cycles with the biodiesel yield maintained at above 70%. The
thermal stability of catalyst was tested and the TPD results showed that the
sulfonated catalysts were stable at the temperature of 170 oC, beyond that leaching of
SO3H will occur which reduced the effectiveness of catalyst. This method was highly
recommended since it was easy to operate and was acid-free which does not cause
corrosion problem.

34
Table 2.4: Different Sulfonation Method of Carbon Catalyst
Sulfonation
Method
Carbon Source Characterisation Esterification Reference
Operating Conditions Conversion
(C)/ Yield
(Y)
Catalyst
reusability
Sulfonation by
arylation of 4-
BDS
J. curcas deoiled
seed waste cake
Vpore= 0.23cm3/g;
SBET = 96m2/g;
SO3H density=
0.7mmol/g
Feedstock= Oleic acid;
Methanol/Oil ratio= 20:1;
Reaction time= 10h;
Reaction temperature=
64oC;
Catalyst Loading= 3wt%
C = 68% C = 50% after 3
cycles
Konwar, et
al.(2015)
Sulfonation by
arylation of 4-
BDS
P. pinnata deoiled
seed waste cake
Vpore= 0.46 cm3/g;
SBET = 483m2/g;
SO3H density=
0.84mmol/g
C = 96% C = 60% after 3
cycles
Sulfonation by
arylation of 4-
BDS
M. ferrea L.
deoiled seed waste
cake
Vpore= 0.41 cm3/g;
SBET = 468m2/g;
SO3H density=
0.75mmol/g
C = 95% C = 62% after 3
cycles
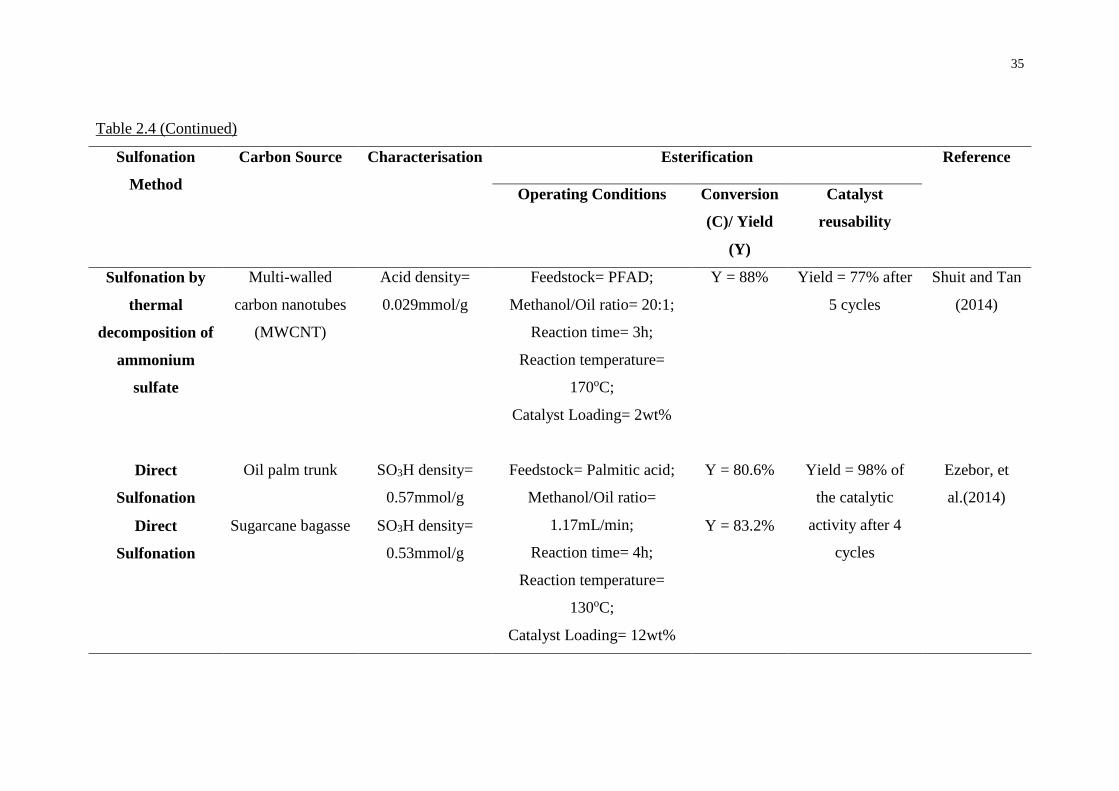
35
Table 2.4 (Continued)
Sulfonation
Method
Carbon Source Characterisation Esterification Reference
Operating Conditions Conversion
(C)/ Yield
(Y)
Catalyst
reusability
Sulfonation by
thermal
decomposition of
ammonium
sulfate
Multi-walled
carbon nanotubes
(MWCNT)
Acid density=
0.029mmol/g
Feedstock= PFAD;
Methanol/Oil ratio= 20:1;
Reaction time= 3h;
Reaction temperature=
170oC;
Catalyst Loading= 2wt%
Y = 88% Yield = 77% after
5 cycles
Shuit and Tan
(2014)
Direct
Sulfonation
Oil palm trunk SO3H density=
0.57mmol/g
Feedstock= Palmitic acid;
Methanol/Oil ratio=
1.17mL/min;
Reaction time= 4h;
Reaction temperature=
130oC;
Catalyst Loading= 12wt%
Y = 80.6% Yield = 98% of
the catalytic
activity after 4
cycles
Ezebor, et
al.(2014)
Direct
Sulfonation
Sugarcane bagasse SO3H density=
0.53mmol/g
Y = 83.2%

36
CHAPTER 3
3 METHODOLOGY AND WORK PLAN
3.1 List of materials and apparatus
3.1.1 Materials and Chemicals
In this study, various types of chemicals and materials need to be prepared prior to
the experiment. In this research, palm empty fruit bunch, palm frond and banana peel
were selected as the biomass precursor to synthesis the solid catalyst for biodiesel
production. Activation of carbon materials was done by using both sodium hydroxide
and phosphoric acid activating agent. Sulfonation was carried out using 3 different
methods which include direct sulfonation, thermal decomposition of ammonium
sulfate and arylation by 4-BDS. The complete list of chemicals and materials needed
in activation of biomass, sulfonation of carbonised char and esterification to produce
FAME are listed in Table 3.1.
Table 3.1: List of Chemicals and Materials Required for Experiment
Chemicals/
Materials
Source Purity Usage
Palm Empty
Fruit Bunch
Oil Palm Estate at
Tanjung Tualang
- Carbon precursor to
synthesise activated
carbon
Oil Palm Frond Oil Palm Estate at
Tanjung Tualang
- Carbon precursor to
synthesise activated
carbon
Banana Peel Pasar Pagi at
Sungai Long
- Carbon precursor to
synthesise activated
carbon
Sodium
Hydroxide
Merck ≥85% Activating agent of carbon
precursor
Palm Fatty Acid
Distillate (PFAD)
UTAR - Feedstock to produce
biodiesel by esterification

37
Table 3.1 (Continued)
Chemicals/
Materials
Source Estimated
Quantity
Usage
Methanol Merck ≥ 99.8% Reactant to produce
biodiesel by esterification
Hydrochloric
acid
Merck 37% To synthesise 4-BDS and
determine acid density of
catalyst
Sulfanilic Acid Merck 99% To synthesise the
sulfonating agent 4-BDS
Sodium Nitrite ACROS Organic 98% To synthesise the
sulfonating agent 4-BDS
Ethanol Synerlab 99.9% To synthesise the
sulfonating agent 4-BDS
Ortho-
Phosphoric Acid
Merck 85% To activate biomass and
sulfonate activated carbon
by 4-BDS method.
Ammonium
Persulfate
Merck 98% To sulfonate activated
carbon by thermal
decomposition of
ammonium sulfate
Sulfuric Acid Merck 98% To sulfonate activated
carbon by direct
sulfonation method,
Potassium
Hydroxide
Merck ≥ 99% To determine the acid
value of ester
Phenolphthalein UTAR 1g/L pH indicator
n-Hexane Merck ≥ 99% To dissolve biodiesel ester
Deionised Water UTAR - To wash off excess
reactant from solid catalyst
Distilled Water UTAR - To wash off excess
reactant from solid catalyst

38
3.1.2 Apparatus, Equipment and Instrument
Table 3.2 shows the apparatus and equipment required to conduct the whole
experiment. The respective specification and usage for each apparatus and equipment
are listed as well. Table 3.3 shows the instruments required in feedstock, catalyst and
biodiesel characterisation.
Table 3.2: List of Apparatus and Equipment Required for Experiment
Apparatus/Equipment Specification Usage
Oven Memmert To dry the carbon precursor and
carbonised carbon.
Furnace Carbolite To carbonise carbon precursors.
Grinder Deer To grind the raw material into
powder.
Sieve Tray 300μm, 1mm,
2mm
To separate the grounded powder
into 3 different sizes.
Mortar and Pestle 3 oz To crush the carbonised material
into smaller form
Hot Plate IKA RH basic 2 To heat up reaction mixture to
desired temperature.
Magnetic Stirrer - To mix the carbon material with
activating agent.
Vacuum Pump - To filter 4-BDS precipitate and
solid catalyst.
Filter Funnel 90mm diameter To filter 4-BDS precipitate and
solid catalyst.
Reflux Condenser Coil type To reflux methanol during
esterification.
Round Bottom Flask Three-necked To carry out esterification of
PFAD
Ice Water Bath 2L To maintain the temperature
during synthesis of 4-BDS and
solid catalyst

39
Table 3.2 (Continued)
Apparatus/ Equipment Specification Usage
Oil Bath 1L To maintain the reaction
temperature of esterification.
Table 3.3: List of Instruments Required for Characterisation of Feedstock, Catalyst
and FAME
Instrument Specification Usage
Scanning Electron
Microscopy (SEM)
Hitachi Model S-3400N To determine surface
morphology, chemical
composition and
crystalline structure of
catalyst.
Energy Dispersive X-
ray Spectroscopy (EDX)
Ametek To identify the elemental
composition of catalyst.
Thermogravimetric
Analysis (TGA)
NETZSCH model STA
2500 Regulus
To determine the thermal
stability of catalyst.
Temperature
Programmed Reduction
(TPR)
Thermo Scientific
(TPDRO 1100)
To determine the
reducibility of the
catalyst.
Fourier Transform
Infrared Spectrometer
(FTIR)
Nicholet IS10 To determine the
functional groups and the
chemisorption of
molecules on the catalyst
Gas Chromatography
(GC)
GC-FID Perkin Elmer
Clarus 500
To determine compound
present in oil feedstock
and biodiesel sample.

40
3.2 Research Methodology
The whole experiment involves a series of methodology steps with pretreatment of
biomass precursors as the main focus of the research. Figure 3.1 summarises the
overall research methodology that can be separated into several sections which
include raw material preparation, synthesis of solid catalyst, characterisation of
catalyst and process study.
Figure 3.1: Schematic Flow of Research Methodology
Preparation of Raw Material
Drying of collected biomass
Cutting dried biomass into
smaller pieces and crush into
powder.
Activation and Sulfonation
Activation and carbonisation
Sulfonation by direct sulfonation,
thermal decomposition of
ammonium sulfate and arylation
of 4-BDS.
Sieved catalyst to obtain desired
size.
Characterisation of Catalyst
Scanning Electron Microscopy
(SEM)
Energy Dispersive X-Ray (EDX)
Thermogravimetric Analysis
(TGA)
Temperature Programmed
Reduction (TPR)
Fourier Transform Infrared
Spectrometer (FTIR)
Gas Chromatography (GC)
Process Study
Effect of impregnation ratio,
carbonisation temperature and
impregnation temperature on
catalytic activity.
Effect of different sulfonation
method on biodiesel yield.
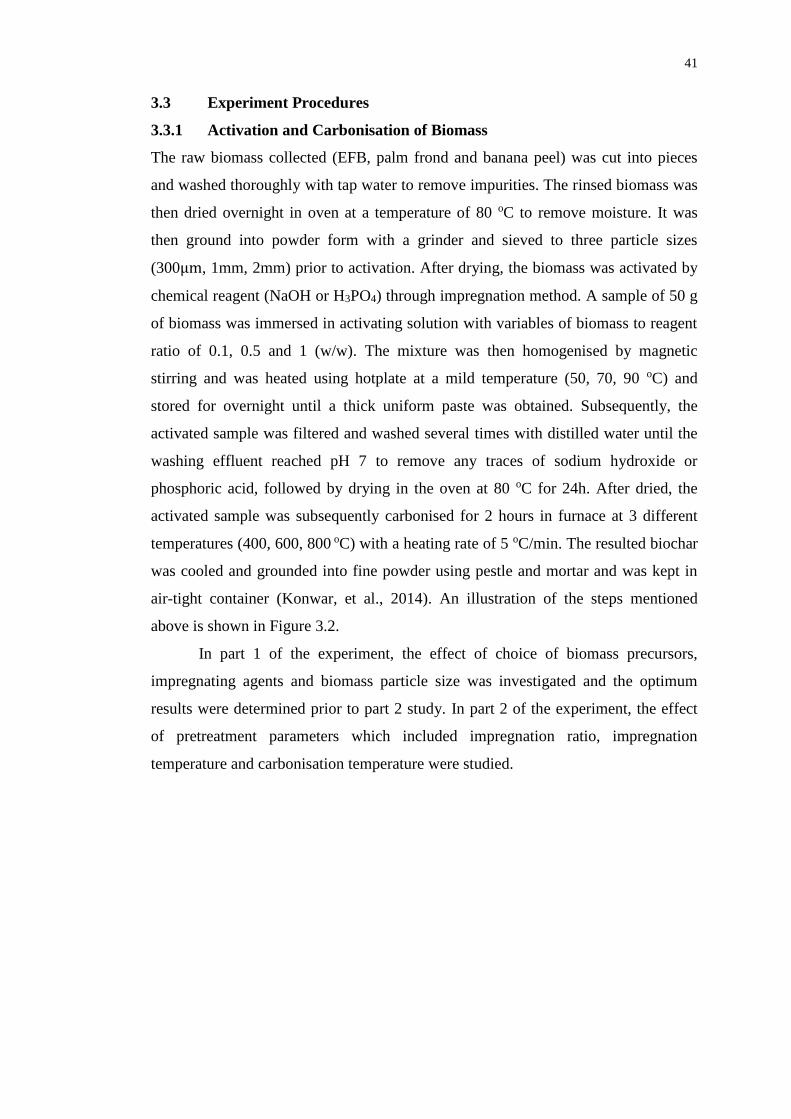
41
3.3 Experiment Procedures
3.3.1 Activation and Carbonisation of Biomass
The raw biomass collected (EFB, palm frond and banana peel) was cut into pieces
and washed thoroughly with tap water to remove impurities. The rinsed biomass was
then dried overnight in oven at a temperature of 80 oC to remove moisture. It was
then ground into powder form with a grinder and sieved to three particle sizes
(300μm, 1mm, 2mm) prior to activation. After drying, the biomass was activated by
chemical reagent (NaOH or H3PO4) through impregnation method. A sample of 50 g
of biomass was immersed in activating solution with variables of biomass to reagent
ratio of 0.1, 0.5 and 1 (w/w). The mixture was then homogenised by magnetic
stirring and was heated using hotplate at a mild temperature (50, 70, 90 oC) and
stored for overnight until a thick uniform paste was obtained. Subsequently, the
activated sample was filtered and washed several times with distilled water until the
washing effluent reached pH 7 to remove any traces of sodium hydroxide or
phosphoric acid, followed by drying in the oven at 80 oC for 24h. After dried, the
activated sample was subsequently carbonised for 2 hours in furnace at 3 different
temperatures (400, 600, 800 oC) with a heating rate of 5 oC/min. The resulted biochar
was cooled and grounded into fine powder using pestle and mortar and was kept in
air-tight container (Konwar, et al., 2014). An illustration of the steps mentioned
above is shown in Figure 3.2.
In part 1 of the experiment, the effect of choice of biomass precursors,
impregnating agents and biomass particle size was investigated and the optimum
results were determined prior to part 2 study. In part 2 of the experiment, the effect
of pretreatment parameters which included impregnation ratio, impregnation
temperature and carbonisation temperature were studied.

42
Figure 3.2:(A) Raw Oil Palm Frond (B) Dried Palm Frond (C) Impregnated Palm
Frond (D) Carbonised Palm Frond
3.3.2 Sulfonation of Activated Carbon
3.3.2.1 Direct Sulfonation
In direct sulfonation method, 5g of activated carbon sample was mixed with 250ml
of concentrated H2SO4 (98%) in a quick-fit round-bottomed flask. It was refluxed at
150oC under continuous stirring for 6h to introduce SO3H groups onto the catalyst
surface. After sulfonation, the mixture was cooled to room temperature and diluted
with distilled water for catalyst to sediment. The precipitate was filtered and washed
thoroughly until a neutral filtrate was obtained to remove impurities such as sulfate
ions. The resulted black catalyst was dried overnight in oven at 80oC to remove
moisture adsorbed on the catalyst. Figure 3.3 shows the experimental set up for direct
sulfonation of activated carbon.
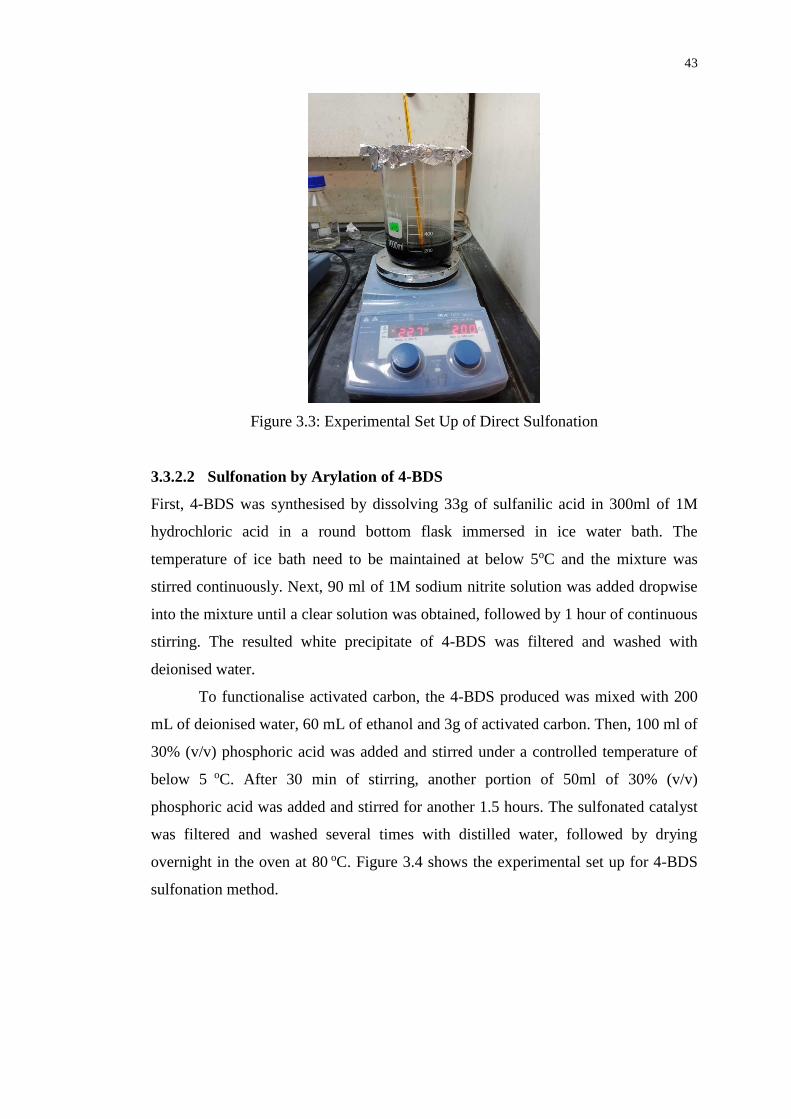
43
Figure 3.3: Experimental Set Up of Direct Sulfonation
3.3.2.2 Sulfonation by Arylation of 4-BDS
First, 4-BDS was synthesised by dissolving 33g of sulfanilic acid in 300ml of 1M
hydrochloric acid in a round bottom flask immersed in ice water bath. The
temperature of ice bath need to be maintained at below 5oC and the mixture was
stirred continuously. Next, 90 ml of 1M sodium nitrite solution was added dropwise
into the mixture until a clear solution was obtained, followed by 1 hour of continuous
stirring. The resulted white precipitate of 4-BDS was filtered and washed with
deionised water.
To functionalise activated carbon, the 4-BDS produced was mixed with 200
mL of deionised water, 60 mL of ethanol and 3g of activated carbon. Then, 100 ml of
30% (v/v) phosphoric acid was added and stirred under a controlled temperature of
below 5 oC. After 30 min of stirring, another portion of 50ml of 30% (v/v)
phosphoric acid was added and stirred for another 1.5 hours. The sulfonated catalyst
was filtered and washed several times with distilled water, followed by drying
overnight in the oven at 80 oC. Figure 3.4 shows the experimental set up for 4-BDS
sulfonation method.
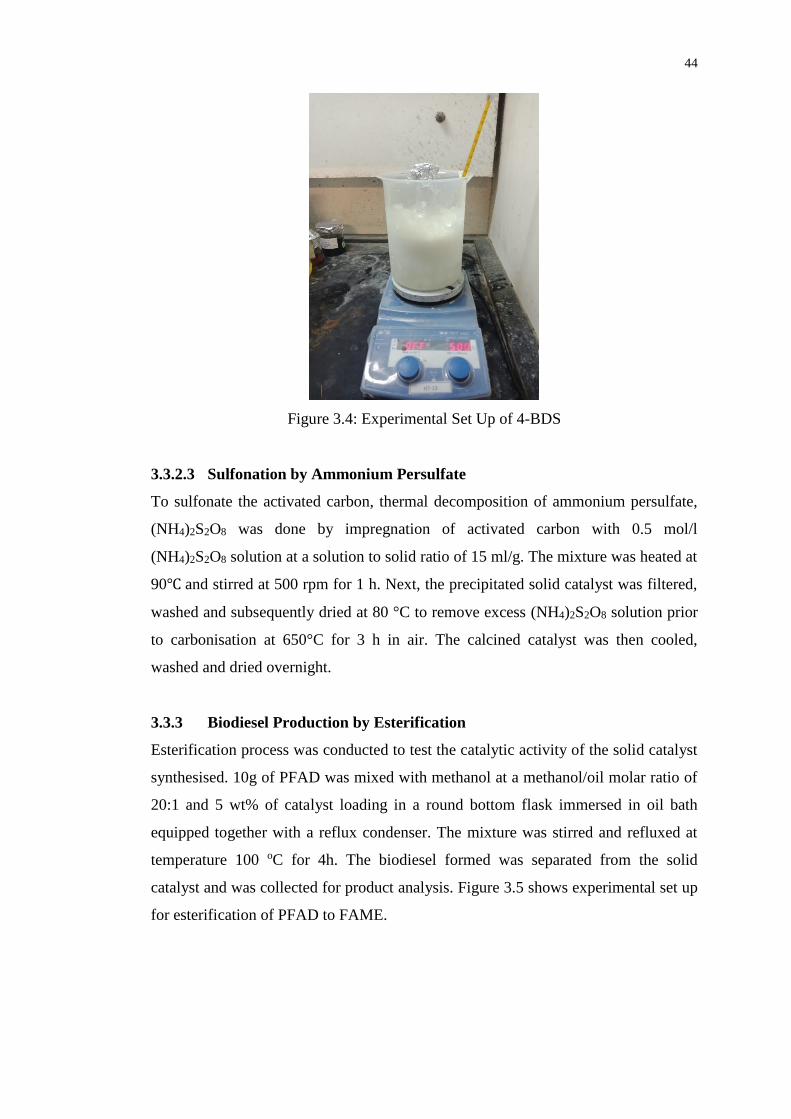
44
Figure 3.4: Experimental Set Up of 4-BDS
3.3.2.3 Sulfonation by Ammonium Persulfate
To sulfonate the activated carbon, thermal decomposition of ammonium persulfate,
(NH4)2S2O8 was done by impregnation of activated carbon with 0.5 mol/l
(NH4)2S2O8 solution at a solution to solid ratio of 15 ml/g. The mixture was heated at
90℃ and stirred at 500 rpm for 1 h. Next, the precipitated solid catalyst was filtered,
washed and subsequently dried at 80 °C to remove excess (NH4)2S2O8 solution prior
to carbonisation at 650°C for 3 h in air. The calcined catalyst was then cooled,
washed and dried overnight.
3.3.3 Biodiesel Production by Esterification
Esterification process was conducted to test the catalytic activity of the solid catalyst
synthesised. 10g of PFAD was mixed with methanol at a methanol/oil molar ratio of
20:1 and 5 wt% of catalyst loading in a round bottom flask immersed in oil bath
equipped together with a reflux condenser. The mixture was stirred and refluxed at
temperature 100 oC for 4h. The biodiesel formed was separated from the solid
catalyst and was collected for product analysis. Figure 3.5 shows experimental set up
for esterification of PFAD to FAME.

45
Figure 3.5: Experimental Set Up of Esterification Process
3.4 Biodiesel Characterisation
3.4.1 Gas Chromatography (GC)
The biodiesel samples collected were analysed with gas chromatography equipped
with a capillary inlet (on column mode) and a Flame Ionization detector (FID). The
biodiesel sample injected into the GC column was instantly vaporised and the gas
mixture travels through the column by the help of inert gas. As the mixture travels
through the column, the constituent gases that travel at different speed were
separated and detected by FID. The GC setting used to analyse the biodiesel sample
was listed in Table 3.4. The methyl ester peaks were identified by comparing the
retention time with the external standard calibration curves while the yield of methyl
ester was quantified by comparing the peak area. The external calibration curves for
methyl palmitate, methyl stearate, methyl oleate and methyl linoleate are shown in
Figure 3.6, Figure 3.7, Figure 3.8, and Figure 3.9, respectively. Biodiesel yield can
be calculated using Equation 3.1.
𝐵𝑖𝑜𝑑𝑖𝑒𝑠𝑒𝑙 𝑌𝑖𝑒𝑙𝑑 (%)
=(∑ 𝐶𝑜𝑛𝑐𝑒𝑛𝑡𝑟𝑎𝑡𝑖𝑜𝑛 𝑜𝑓 𝑒𝑎𝑐ℎ 𝑚𝑒𝑡ℎ𝑦𝑙 𝑒𝑠𝑡𝑒𝑟𝑠)×(𝑉𝑜𝑙𝑢𝑚𝑒 𝑜𝑓 𝑜𝑖𝑙 𝑙𝑎𝑦𝑒𝑟)
10𝑔 𝑜𝑓 𝑃𝐹𝐴𝐷× 10 (3.1)

46
Figure 3.6: External Calibration Curve of Methyl Palmitate
Figure 3.7: External Calibration Curve of Methyl Stearate
y = 1388.1xR² = 0.9981
0
10000
20000
30000
40000
50000
60000
0 5 10 15 20 25 30 35 40 45
Are
a
Concentration (g/L)
y = 1298.1.1xR² = 0.9964
0
10000
20000
30000
40000
50000
60000
0 5 10 15 20 25 30 35 40 45
Are
a
Conentration (g/L)
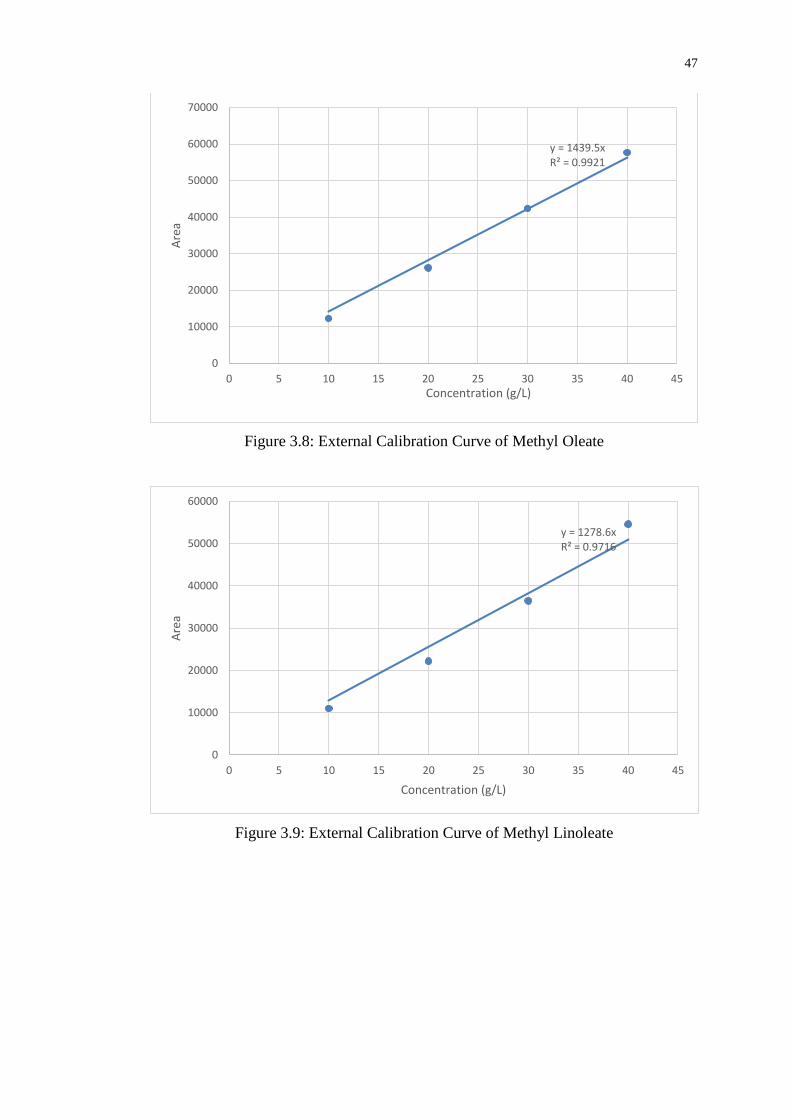
47
Figure 3.8: External Calibration Curve of Methyl Oleate
Figure 3.9: External Calibration Curve of Methyl Linoleate
y = 1439.5xR² = 0.9921
0
10000
20000
30000
40000
50000
60000
70000
0 5 10 15 20 25 30 35 40 45
Are
a
Concentration (g/L)
y = 1278.6xR² = 0.9716
0
10000
20000
30000
40000
50000
60000
0 5 10 15 20 25 30 35 40 45
Are
a
Concentration (g/L)

48
Table 3.4: Gas Chromatography Setting for Biodiesel Sample
GC Setting Specification
Carrier Gas Helium Gas
Carrier Gas Flowrate (mL/min) 2
Carrier Gas Pressure (psi) 24.7
Injector Temperature (oC) 250
Flame Ionization Temperature (oC) 270
3.4.2 Acid Value
Acid values for feedstock PFAD and biodiesel produced were determined by using
titration method. In this experiment, 1g of biodiesel was added with 5 ml of propanol
solvent and 3 drops of phenolphthalein indicator. The mixture in conical flask was
titrated with 0.1N KOH solution until a clear pink colour solution was formed. The
volume of KOH solution used in the titration was recorded. FAME conversion was
calculated using Equation 3.2 and Equation 3.3.
𝐴𝑐𝑖𝑑 𝑉𝑎𝑙𝑢𝑒, 𝐴𝑉 (𝑚𝑔𝐾𝑂𝐻/𝑔) =𝑉×𝑁×𝑀𝑊
𝑊𝑆 (3.2)
where
𝑉 = 𝑉𝑜𝑙𝑢𝑚𝑒 𝑜𝑓 𝐾𝑂𝐻 𝑠𝑜𝑙𝑢𝑡𝑖𝑜𝑛 𝑢𝑠𝑒𝑑
𝑁 = 𝑁𝑜𝑟𝑚𝑎𝑙𝑖𝑡𝑦 𝑜𝑓 𝐾𝑂𝐻 𝑠𝑜𝑙𝑢𝑡𝑖𝑜𝑛; 0.1𝑁
𝑀𝑊 = 𝑀𝑜𝑙𝑒𝑐𝑢𝑙𝑎𝑟 𝑊𝑒𝑖𝑔ℎ𝑡 𝑜𝑓 𝐾𝑂𝐻; 56.11𝑔/𝑚𝑜𝑙
𝐴𝑐𝑖𝑑 𝑉𝑎𝑙𝑢𝑒 𝐶𝑜𝑛𝑣𝑒𝑟𝑠𝑖𝑜𝑛 (%) =𝑎𝑖−𝑎𝑓
𝑎𝑖× 100 (3.3)
where
𝑎𝑖= Acid value of PFAD (𝑚𝑔 𝐾𝑂𝐻
𝑔)
𝑎𝑓 =Acid value of FAME produced (𝑚𝑔 𝐾𝑂𝐻
𝑔)

49
3.5 Catalyst Characterisation
Throughout the study, various characterisation techniques were used to study the
effect of various synthesis parameters on the chemical and physical properties of the
catalyst produced. The characterisation instrument used includes Scanning Electron
Microscope (SEM), Energy Dispersive X-ray (EDX), Temperature Programmed
Reduction (TPR), Fourier Transform Infra-Red (FTIR) and Thermogravimetric
Analysis (TGA).
3.5.1 Scanning Electron Microscopy (SEM-EDX)
The Scanning Electron Microscopy (SEM) was conducted simultaneously with the
Energy-Dispersive X-ray (EDX) to determine the surface texture morphology and
elemental composition of the catalyst using SEM/EDX system. The sulfonated
carbon catalysts were scanned under magnification of 2000x and 3000x. The SEM
images gave information on grain size, pore diameter and the pore development of
catalyst. Elemental analysis of the catalyst surface was done by EDX which
identified the elements attached on the surface and their respective percentage.
3.5.2 Temperature Programmed Reduction (TPR)
TPR was carried out to determine the reduction temperature of solid catalysts. The
oxidised solid catalysts were subjected to a mixture of reducing gas, hydrogen and
inert gases, nitrogen as the analysis proceeded. The reduction rate on the catalysts
was determined based on the amount of hydrogen gas consumed which indicated the
removal of oxygen throughout the analysis. Before running TPR analysis, the solid
catalysts were pre-treated to remove any impurities attached on it. The conditions for
pre-treatment as well as the reduction process were shown in Table 3.5.
Table 3.5: Conditions for Pretreatment and TPR Analysis
Type of Gas Flow rate
(cm3/min)
Temperature
(oC)
Ramp Rate
(oC/min)
Pre-
treatment
Nitrogen
20 250 10
TPR
5.47% Hydrogen and
94.53% Nitrogen
25 1000 5

50
3.5.3 Fourier Transform - Infrared Spectroscopy (FTIR)
FTIR analysis was used to determine the SO3H functional groups or active sites
attached on the carbon-based solid catalyst by observing the vibration of FTIR
spectrum ranging from 400 to 4000 wave number. The amount of functional groups
was also quantified by looking at the size of the peaks in the spectrum.
3.5.4 Thermogravimetric Analysis (TGA)
The thermal stability of the sulfonated catalysts was investigated by
thermogravimetric analysis from room temperature to 1000 oC at a ramping rate of
5oC/min under atmosphere of air or nitrogen. The temperature at which the
functional group detached from the carbon support indicated the thermal stability of
the activated carbon. The settings and specifications of TGA analyser were shown in
Table 3.6.
Table 3.6: TGA Setting and Specification
Setting Specification
Furnace Pt-Rh Furnace
Sample Carrier Platinised slip-on plates
Crucible Al2O3 crucible with pierced lid
Temperature Program 25 oC -1000oC with 5 oC/min
1000 oC-25 oC with 5 oC /min
Atmosphere 25 oC -900 oC under nitrogen (70mL/min)
900 oC -1000 oC under synthetic air (70mL/min)
3.5.5 Total Acid Density
After sulfonation, the total acid density of the catalyst was determined using the
titration method, whereby 0.1 g of sample catalyst was added into 60 ml of 0.01M
sodium hydroxide solution and stirred for 30 minutes at room temperature. Next, the
mixture was filtered and the filtrate was titrated using 0.02M hydrochloric acid with
phenolphthalein as pH indicator. Once the solution turns from pink to colourless, the
amount of HCl used for neutralisation was recorded and the acid density of the
catalyst was calculated by using Equation 3.4 and Equation 3.5.

51
Moles of HCl used (mol)
= 𝑉𝑜𝑙𝑢𝑚𝑒 𝑜𝑓 𝐻𝐶𝑙 𝑢𝑠𝑒𝑑(𝑚𝐿) ×1𝐿
1000𝑚𝐿× 0.02
𝑚𝑜𝑙
𝐿 (3.4)
𝑀𝑜𝑙𝑒 𝑜𝑓 𝑁𝑎𝑂𝐻 𝑢𝑠𝑒𝑑 𝑡𝑜 𝑛𝑒𝑢𝑡𝑟𝑎𝑙𝑖𝑧𝑒 𝑡ℎ𝑒 𝑎𝑐𝑖𝑑 𝑠𝑖𝑡𝑒𝑠 𝑜𝑛 𝑐𝑎𝑡𝑎𝑙𝑦𝑠𝑡
= 𝐼𝑛𝑖𝑡𝑖𝑎𝑙 𝑚𝑜𝑙𝑒 𝑜𝑓 𝑁𝑎𝑂𝐻 − 𝑀𝑜𝑙𝑒 𝑜𝑓 𝑁𝑎𝑂𝐻 𝑛𝑒𝑢𝑡𝑟𝑎𝑙𝑖𝑧𝑒𝑑 𝑏𝑦 𝐻𝐶𝑙
𝑇𝑜𝑡𝑎𝑙 𝐴𝑐𝑖𝑑 𝐷𝑒𝑛𝑠𝑖𝑡𝑦 (𝑚𝑚𝑜𝑙
𝑔𝑁𝑎𝑂𝐻)
=𝑀𝑜𝑙𝑒 𝑜𝑓 𝑁𝑎𝑂𝐻 𝑢𝑠𝑒𝑑 𝑡𝑜 𝑛𝑒𝑢𝑡𝑟𝑎𝑙𝑖𝑧𝑒 𝑎𝑐𝑖𝑑 𝑠𝑖𝑡𝑒𝑠 𝑜𝑛 𝑐𝑎𝑡𝑎𝑙𝑦𝑠𝑡
0.1𝑔 (3.5)

52
CHAPTER 4
4 RESULTS AND DISCUSSION
4.1 Preliminary Studies
A preliminary study was carried out prior to the pretreatment parameters study which
focused on the selection of optimum biomass, activating agent and particle size. In
this study, six catalysts were synthesised from 3 different biomass sources and 2
types of chemical activating agent. The biomass precursors included banana peel, oil
palm frond and empty fruit bunch while the activating agents used included
phosphoric acid and sodium hydroxide. After the optimum precursor and activating
agent were decided, catalyst synthesised from 3 different particle sizes which
included 300𝜇𝑚, 1mm and 2mm was compared. In this section, the efficiency of
catalyst produced was evaluated in terms of their acid density.
Among the six catalysts synthesised, catalyst produced from oil palm frond
activated by NaOH possessed the highest acid density value. The acid density value
for the rest of the catalysts is summarised in Table 4.1. The result shows that catalyst
prepared from oil palm frond activated with H3PO4 and NaOH was the top two in the
list due to the carbon-rich nature of the raw material. According to Salman and
Hameed (2010), oil palm frond had high potential for activation, high possibility of
degradation of lignocellulosic material and inherent good porosity and filterability.
As compared, banana peel and empty fruit bunch showed lower catalytic
performance.
For the activating agent, NaOH was slightly better than H3PO4 as the total
acid density value obtained was near to each other. Various literatures reported that
acid and alkali activating agents work well at a certain carbonisation temperature,
yielding carbon support with maximum surface area for functionalisation purpose. It
was reported that H3PO4 was more effective at lower activation temperature at
around 400℃, which can yield activated carbon with good thermal and chemical
stability. (Ismail, Taha and Ramli, 2016) This was due to the fact that when
activation temperature was high, phosphates in H3PO4 bonded strongly to the
lignocellulosic structure, leading to the formation of cross-link structures which
shrunk and inhibited the pore development of activated carbon. According to
Hayashi, et al. (2000), the research work done proved that alkali treated carbon had a
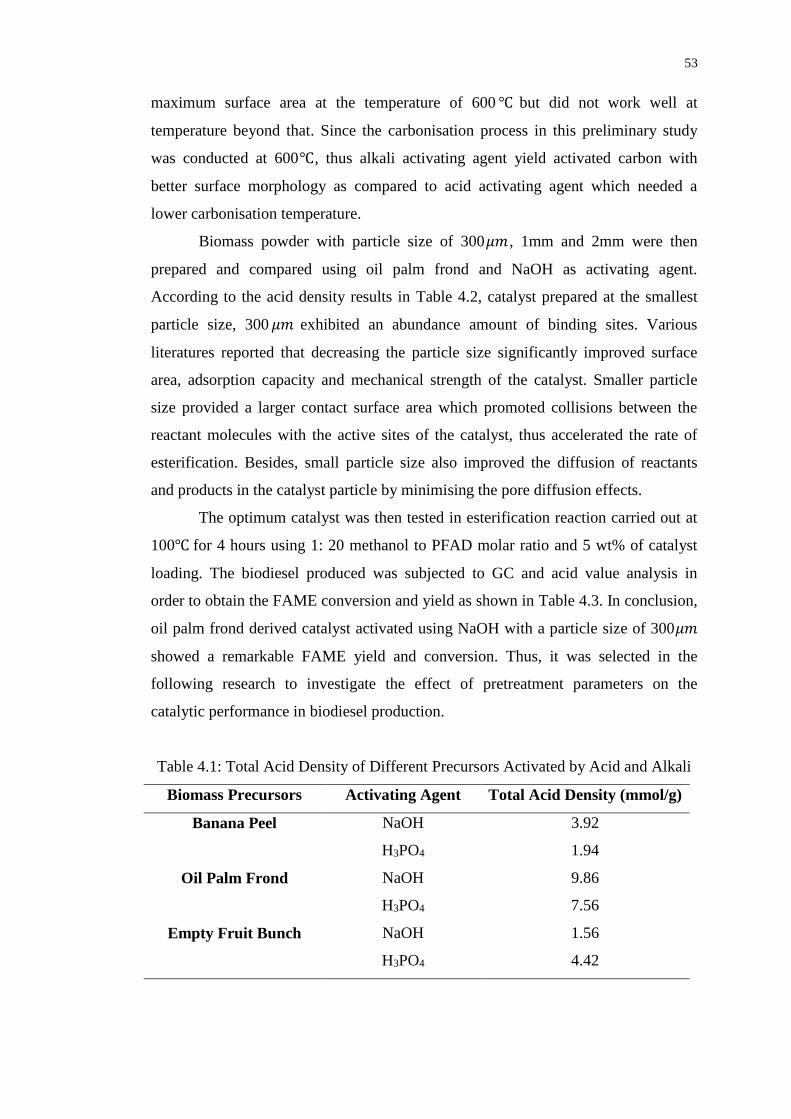
53
maximum surface area at the temperature of 600 ℃ but did not work well at
temperature beyond that. Since the carbonisation process in this preliminary study
was conducted at 600℃, thus alkali activating agent yield activated carbon with
better surface morphology as compared to acid activating agent which needed a
lower carbonisation temperature.
Biomass powder with particle size of 300𝜇𝑚 , 1mm and 2mm were then
prepared and compared using oil palm frond and NaOH as activating agent.
According to the acid density results in Table 4.2, catalyst prepared at the smallest
particle size, 300 𝜇𝑚 exhibited an abundance amount of binding sites. Various
literatures reported that decreasing the particle size significantly improved surface
area, adsorption capacity and mechanical strength of the catalyst. Smaller particle
size provided a larger contact surface area which promoted collisions between the
reactant molecules with the active sites of the catalyst, thus accelerated the rate of
esterification. Besides, small particle size also improved the diffusion of reactants
and products in the catalyst particle by minimising the pore diffusion effects.
The optimum catalyst was then tested in esterification reaction carried out at
100℃ for 4 hours using 1: 20 methanol to PFAD molar ratio and 5 wt% of catalyst
loading. The biodiesel produced was subjected to GC and acid value analysis in
order to obtain the FAME conversion and yield as shown in Table 4.3. In conclusion,
oil palm frond derived catalyst activated using NaOH with a particle size of 300𝜇𝑚
showed a remarkable FAME yield and conversion. Thus, it was selected in the
following research to investigate the effect of pretreatment parameters on the
catalytic performance in biodiesel production.
Table 4.1: Total Acid Density of Different Precursors Activated by Acid and Alkali
Biomass Precursors Activating Agent Total Acid Density (mmol/g)
Banana Peel NaOH 3.92
H3PO4 1.94
Oil Palm Frond NaOH 9.86
H3PO4 7.56
Empty Fruit Bunch NaOH 1.56
H3PO4 4.42

54
Table 4.2: Total Acid Density of Oil Palm Frond with Different Particle Sizes
Particle Size Total Acid Density (mmol/g)
300𝝁𝒎 9.86
1mm 4.76
2mm 3.04
Table 4.3: FAME Yield and Conversion of Oil Palm Frond Derived Catalyst
Catalyst FAME Yield (%) FAME Conversion (%)
Oil palm frond 43.25 89.61
4.2 Characterisation of Activated Carbon and Catalyst
In this study, characterisation of catalyst was conducted to study their differences
between the catalysts produced from different pretreatment conditions. Table 4.4 depicts
the catalyst annotation and the corresponding preparation conditions for the carbon
samples prepared.
Table 4.4: Carbon Samples and the Preparation Conditions
Carbon Samples Pretreatment Conditions
Carbonisation
Temperature
Impregnation
Ratio
Impregnation
Temperature
Cat_400 400 1:1 90
Cat_600 600 1:1 90
Cat_800 800 1:1 90
Cat_0.1 600 1:0.1 90
Cat_0.5 600 1:0.5 90
Cat_50 600 1:0.5 50
Cat_70 600 1:0.5 70
4.2.1 Scanning Electron Microscopy
The surface morphology of the optimum catalyst, Cat_0.5 prepared at different
stages from raw biomass precursor, chemically activated palm frond, palm frond
derived activated carbon to synthesise catalyst was studied using scanning electron
microscope at the magnification of 2000x and 3000x. As shown in Figure 4.1, the
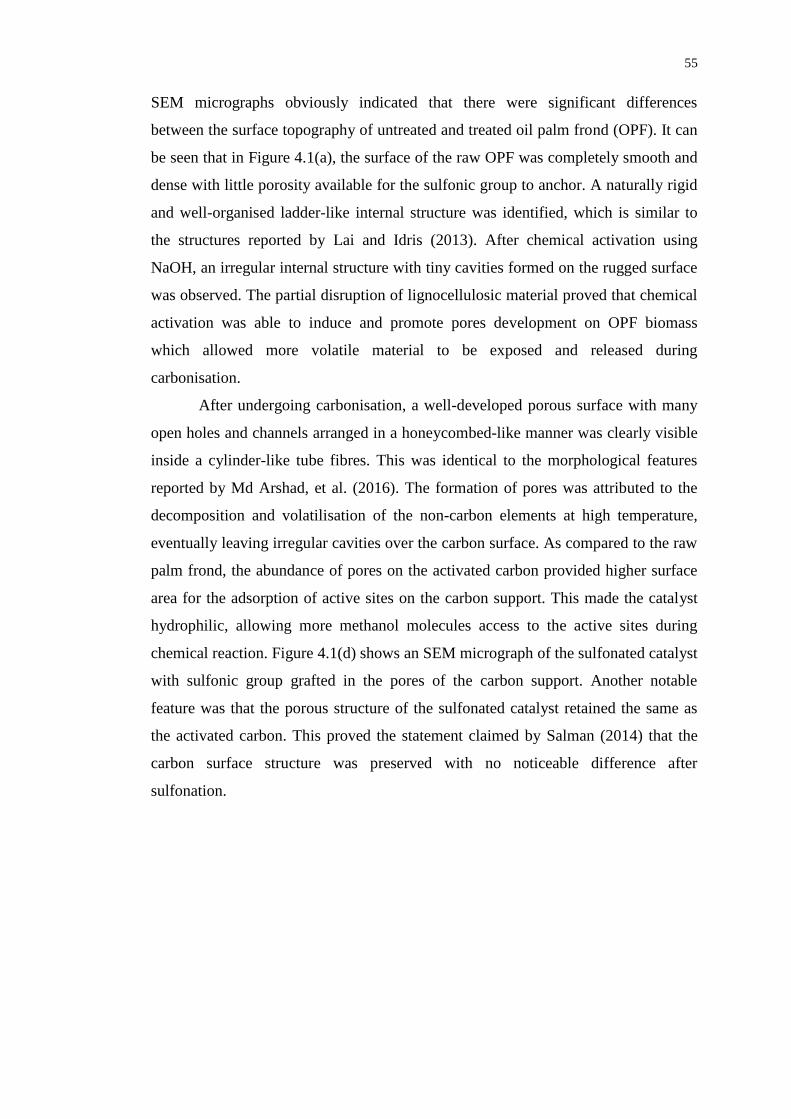
55
SEM micrographs obviously indicated that there were significant differences
between the surface topography of untreated and treated oil palm frond (OPF). It can
be seen that in Figure 4.1(a), the surface of the raw OPF was completely smooth and
dense with little porosity available for the sulfonic group to anchor. A naturally rigid
and well-organised ladder-like internal structure was identified, which is similar to
the structures reported by Lai and Idris (2013). After chemical activation using
NaOH, an irregular internal structure with tiny cavities formed on the rugged surface
was observed. The partial disruption of lignocellulosic material proved that chemical
activation was able to induce and promote pores development on OPF biomass
which allowed more volatile material to be exposed and released during
carbonisation.
After undergoing carbonisation, a well-developed porous surface with many
open holes and channels arranged in a honeycombed-like manner was clearly visible
inside a cylinder-like tube fibres. This was identical to the morphological features
reported by Md Arshad, et al. (2016). The formation of pores was attributed to the
decomposition and volatilisation of the non-carbon elements at high temperature,
eventually leaving irregular cavities over the carbon surface. As compared to the raw
palm frond, the abundance of pores on the activated carbon provided higher surface
area for the adsorption of active sites on the carbon support. This made the catalyst
hydrophilic, allowing more methanol molecules access to the active sites during
chemical reaction. Figure 4.1(d) shows an SEM micrograph of the sulfonated catalyst
with sulfonic group grafted in the pores of the carbon support. Another notable
feature was that the porous structure of the sulfonated catalyst retained the same as
the activated carbon. This proved the statement claimed by Salman (2014) that the
carbon surface structure was preserved with no noticeable difference after
sulfonation.

56
Figure 4.1: SEM Image of (a) Raw Oil Palm Frond 2000x (b) Chemically Activated
Palm Frond 2000x (c) Activated Carbon 2000x and (d) Palm Frond Derived Catalyst
2000x
Figure 4.2 illustrates the changes in the surface pore structure of the activated
carbon carbonised at increased temperature from 400℃ to 800℃. The SEM images
depicted that all samples exhibited the same uniform rough surface, but with
different pores size and distribution at different temperatures. It can be found that
pore development improved with the increased temperature from 400℃ to 600℃, but
it started to decrease from 600℃ onwards. This was due to the fact that 400℃ was
not sufficient to provide high activation burn-off which eventually produced irregular
shaped pores with random pore distribution. As the temperature raised to 600℃, the
current pores were enlarged to a large extent and new pores were formed as well.
Thus, this transforms the irregular carbon support to a honeycomb-like structure with
well-defined pore distribution (Salman, 2014). The enhancement in pore size was
proven by the significant increase of pore diameter from approximately 2.67 μm to
8.33 μm. Larger pore size allowed more molecules to enter the carbon bulk and react,
eliminating the mass transfer problem which decreased the catalytic activity.

57
Figure 4.2: SEM Image of Activated Carbon Carbonised at (a) 400 ˚C at 2000x (b)
400 ˚C at 3000x (c) 600 ˚C at 2000x and (d) 600 ˚C 3000x (e) 800 ˚C at 2000x (f)
800 ˚C 3000x
On the other hand, Figure 4.2(f) shows that the pore diameter of catalyst
carbonised at 800℃ had significantly decreased from 8.33 μm to 2.33 μm. This was
not in accordance with the results reported by Yahya, Al-Qodah and Ngah (2015)
that higher carbonisation temperature provided better activation and pore
development. Yet, the decrease in pore diameter was possible due to the violent
gasification reaction that could cause collapsing or contraction of pores wall,
eventually causing blockage of the pores.
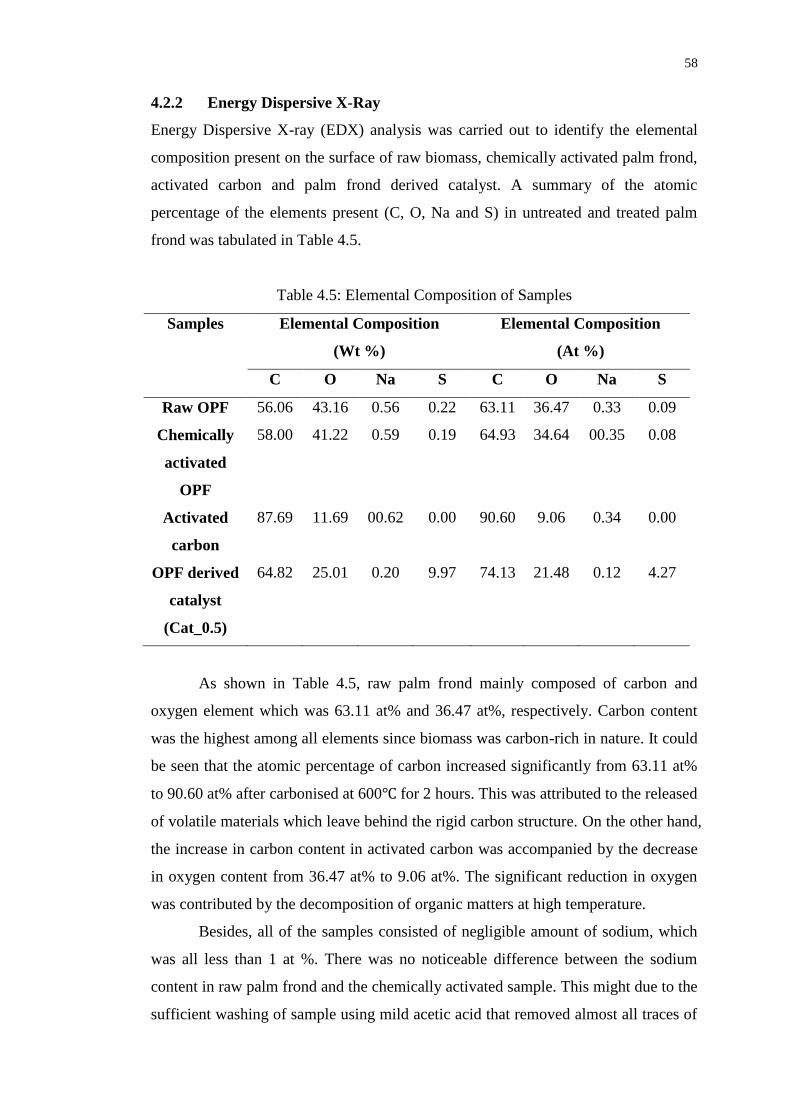
58
4.2.2 Energy Dispersive X-Ray
Energy Dispersive X-ray (EDX) analysis was carried out to identify the elemental
composition present on the surface of raw biomass, chemically activated palm frond,
activated carbon and palm frond derived catalyst. A summary of the atomic
percentage of the elements present (C, O, Na and S) in untreated and treated palm
frond was tabulated in Table 4.5.
Table 4.5: Elemental Composition of Samples
Samples Elemental Composition
(Wt %)
Elemental Composition
(At %)
C O Na S C O Na S
Raw OPF 56.06 43.16 0.56 0.22 63.11 36.47 0.33 0.09
Chemically
activated
OPF
58.00 41.22 0.59 0.19 64.93 34.64 00.35 0.08
Activated
carbon
87.69 11.69 00.62 0.00 90.60 9.06 0.34 0.00
OPF derived
catalyst
(Cat_0.5)
64.82 25.01 0.20 9.97 74.13 21.48 0.12 4.27
As shown in Table 4.5, raw palm frond mainly composed of carbon and
oxygen element which was 63.11 at% and 36.47 at%, respectively. Carbon content
was the highest among all elements since biomass was carbon-rich in nature. It could
be seen that the atomic percentage of carbon increased significantly from 63.11 at%
to 90.60 at% after carbonised at 600℃ for 2 hours. This was attributed to the released
of volatile materials which leave behind the rigid carbon structure. On the other hand,
the increase in carbon content in activated carbon was accompanied by the decrease
in oxygen content from 36.47 at% to 9.06 at%. The significant reduction in oxygen
was contributed by the decomposition of organic matters at high temperature.
Besides, all of the samples consisted of negligible amount of sodium, which
was all less than 1 at %. There was no noticeable difference between the sodium
content in raw palm frond and the chemically activated sample. This might due to the
sufficient washing of sample using mild acetic acid that removed almost all traces of

59
sodium present after alkaline treatment. From Table 4.5, it could be seen that all
samples prior to sulfonation consisted of traces or zero amount of sulfur. Figure 4.3
shows the EDX spectra of the sulfonated catalyst, Cat_0.5. The S peak showed that
sulfur content had increased apparently from 0 at% to 4.27 at% after undergone
sulfonation process, which revealed the successful attachment of sulfonic groups on
the carbon support. The acidic nature of catalyst associated with the presence of
SO3H functional group encouraged a high catalytic activity during biodiesel
production.
Figure 4.3: EDX Spectrum of Cat_0.5
4.2.3 Thermogravimetric Analysis
In order to evaluate the thermal stability and decomposition characteristics of the
synthesised catalyst, the catalyst was subjected to TGA analysis where it was heated
from 30℃ to 1000℃ in nitrogen atmosphere. As shown in Figure 4.4, the TGA
profile could be studied to determine the stages with significant weight loss at a
certain temperature range. From Figure 4.4, it could be seen that the weight loss of
catalyst Cat_0.5 could be divided into three main stages.

60
Figure 4.4: Temperature Dependant Weight Loss Curve for Cat_0.5
The first stage of weight loss occurred at the temperature range of 50℃-150℃.
This phenomenon happened due to the evaporation of moisture that was physically
adsorbed on the catalyst surface. The significant weight loss was approximately 14%
of the total catalyst weight due to the large surface area of catalyst available for
moisture adsorption. The second weight loss region was observed at the temperature
of 225℃ where the catalyst weight was no longer stable and began to decrease
significantly by 13%. The reduction in weight was mostly related to the
decomposition of SO3H functional group anchored on the carbon support. This
finding revealed that palm frond derived catalyst showed excellent thermal stability
up to 225℃. This, in turn, meant that the SO3H groups were stable and the catalyst
could perform well if the reaction temperature did not go beyond the catalyst
decomposition temperature. Similar findings were also made by Konwar, et al. (2015)
who claimed that activated carbon that prepared using direct sulfonation method was
physically stable and could maintain its structure up to 250℃.
Apart from the weight loss occurred in the first two stages, the TGA profile
showed a further weight loss of about 15% at temperature between 500℃ to 700℃.
The weight reduction at this stage was associated with the rapid breakdown and
removal of hemicellulose, cellulose and lignin material present in the carbon-based
catalyst. This thermal decomposition zone corresponded to the SEM results whereby
the catalyst carbonised at 400℃ was only partially carbonised whereas the catalyst
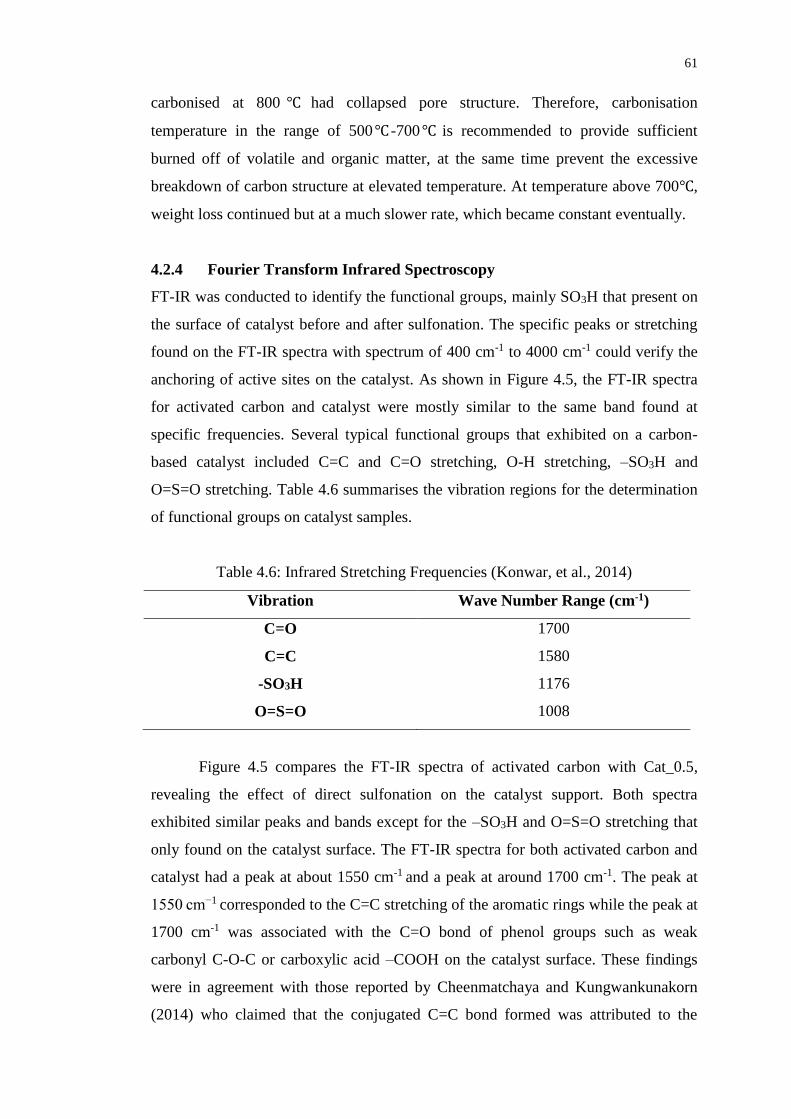
61
carbonised at 800 ℃ had collapsed pore structure. Therefore, carbonisation
temperature in the range of 500 ℃ -700 ℃ is recommended to provide sufficient
burned off of volatile and organic matter, at the same time prevent the excessive
breakdown of carbon structure at elevated temperature. At temperature above 700℃,
weight loss continued but at a much slower rate, which became constant eventually.
4.2.4 Fourier Transform Infrared Spectroscopy
FT-IR was conducted to identify the functional groups, mainly SO3H that present on
the surface of catalyst before and after sulfonation. The specific peaks or stretching
found on the FT-IR spectra with spectrum of 400 cm-1 to 4000 cm-1 could verify the
anchoring of active sites on the catalyst. As shown in Figure 4.5, the FT-IR spectra
for activated carbon and catalyst were mostly similar to the same band found at
specific frequencies. Several typical functional groups that exhibited on a carbon-
based catalyst included C=C and C=O stretching, O-H stretching, –SO3H and
O=S=O stretching. Table 4.6 summarises the vibration regions for the determination
of functional groups on catalyst samples.
Table 4.6: Infrared Stretching Frequencies (Konwar, et al., 2014)
Vibration Wave Number Range (cm-1)
C=O 1700
C=C 1580
-SO3H 1176
O=S=O 1008
Figure 4.5 compares the FT-IR spectra of activated carbon with Cat_0.5,
revealing the effect of direct sulfonation on the catalyst support. Both spectra
exhibited similar peaks and bands except for the –SO3H and O=S=O stretching that
only found on the catalyst surface. The FT-IR spectra for both activated carbon and
catalyst had a peak at about 1550 cm-1 and a peak at around 1700 cm-1. The peak at
1550 cm−1 corresponded to the C=C stretching of the aromatic rings while the peak at
1700 cm-1 was associated with the C=O bond of phenol groups such as weak
carbonyl C-O-C or carboxylic acid –COOH on the catalyst surface. These findings
were in agreement with those reported by Cheenmatchaya and Kungwankunakorn
(2014) who claimed that the conjugated C=C bond formed was attributed to the
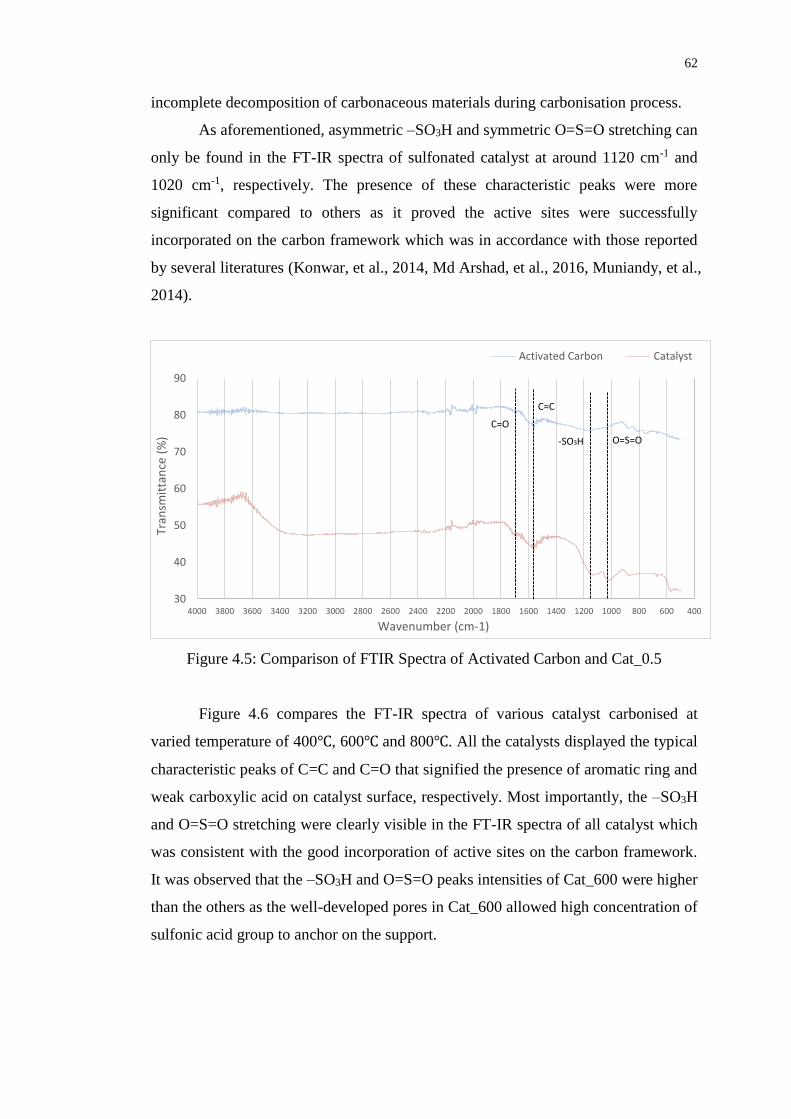
62
incomplete decomposition of carbonaceous materials during carbonisation process.
As aforementioned, asymmetric –SO3H and symmetric O=S=O stretching can
only be found in the FT-IR spectra of sulfonated catalyst at around 1120 cm-1 and
1020 cm-1, respectively. The presence of these characteristic peaks were more
significant compared to others as it proved the active sites were successfully
incorporated on the carbon framework which was in accordance with those reported
by several literatures (Konwar, et al., 2014, Md Arshad, et al., 2016, Muniandy, et al.,
2014).
Figure 4.5: Comparison of FTIR Spectra of Activated Carbon and Cat_0.5
Figure 4.6 compares the FT-IR spectra of various catalyst carbonised at
varied temperature of 400℃, 600℃ and 800℃. All the catalysts displayed the typical
characteristic peaks of C=C and C=O that signified the presence of aromatic ring and
weak carboxylic acid on catalyst surface, respectively. Most importantly, the –SO3H
and O=S=O stretching were clearly visible in the FT-IR spectra of all catalyst which
was consistent with the good incorporation of active sites on the carbon framework.
It was observed that the –SO3H and O=S=O peaks intensities of Cat_600 were higher
than the others as the well-developed pores in Cat_600 allowed high concentration of
sulfonic acid group to anchor on the support.
30
40
50
60
70
80
90
4006008001000120014001600180020002200240026002800300032003400360038004000
Tran
smit
tan
ce (
%)
Wavenumber (cm-1)
Activated Carbon Catalyst
C=C
C=O
-SO3H O=S=O

63
Figure 4.6: Comparison of FTIR Spectra of Catalyst Synthesised at Different
Carbonisation Temperatures
4.2.5 Temperature Programmed Reduction
Temperature programmed reduction (TPR) was conducted to study the reduction
process of oxygen-bearing functional groups attached on the activated carbon. The
reducing gas, hydrogen was being consumed as the catalyst was reduced at
increasing temperature. The oxygen-bearing groups could be categorised into strong
and weak acid site whereby the strong acid site was contributed by the active
sulfonic group (–SO3H) while the weak acid site was due to the presence of
carboxylic acid (-COOH) and hydroxyl (-OH) groups on the carbon surface.
The TPR plot of sulfonated and unsulfonated activated carbon in Figure 4.7
shows the respective peaks at 740℃ and 890℃. The reduction temperatures at 740℃
and 890℃ corresponded to the maximum rate of reduction for activated carbon and
catalyst, respectively. It was also worth pointing that the amount of hydrogen gas
adsorbed was 338.443𝜇𝑚𝑜𝑙/𝑔 for activated carbon and 1051.876 𝜇𝑚𝑜𝑙/𝑔 for palm
frond derived catalyst. The amount of hydrogen adsorbed was assigned to the
removal of oxygen from the oxidised catalyst. It could be observed that the amount
of oxygen removed from sulfonated catalyst was higher than activated carbon. This
was attributed to the removal of additional sulfonic groups (–SO3H) from the catalyst
which confirmed that sulfonated activated carbon exhibited higher acid. Thus, it
could be concluded that the addition of sulfonic group might lead to enhancement of
0
10
20
30
40
50
60
70
80
90
4006008001000120014001600180020002200240026002800300032003400360038004000
Tran
smit
tan
ce (
%)
Wavenumber (cm-1)
C=C
O=S=O-SO3H
C=O

64
the reduction temperature as compared to unsulfonated activated carbon.
Besides, the reduction temperature provided useful information of the
reusability of the catalyst surface, as well as its high sensitivity to chemical changes
resulting from any modification on the catalyst surface. Therefore, TPR result could
act as a benchmark to control the quality of catalyst during manufacturing process.
The high reduction temperature of the catalyst also allowed it to be used in other
applications such as hydrogenation.
Figure 4.7: TPR Spectra of Activated Carbon and Palm Frond Derived Catalyst
4.2.6 Total Acid Density Test
Total acid density test is a measurement of acidic sites using back titration method by
determining the amount of sodium hydroxide used to neutralise the acid functional
group present in the carbon-based catalysts. The acid functional groups not only
contributed by –SO3H group but also include weak carboxylic acid –COOH and
hydroxyl –OH groups which help to enhance the hydrophilicity of the catalyst. The
efficiency of catalyst is determined by measuring the amount of acidic sites present.
The higher the concentration, the better is the catalyst performance since FAME
yield is dependent on the total acid density of catalyst. Besides, carbon catalyst with
high acid density had no mass transfer limitation as it was able to disperse easily in
the reactant mixture as presented by Konwar, et al. (2014). The total acid densities
evaluated for catalyst carbonised under different temperatures were calculated and

65
the corresponding trend is clearly depicted in Figure 4.8.
As depicted in Figure 4.8, Cat_600 was evaluated to be the most efficient
catalyst owing to its high acid density 4.46 mmol/g. The total acid density of the
synthesised catalyst increased when the carbonisation temperature increased from
400℃ to 600℃. However, when the temperature further increased to 800℃, a turning
point was observed with the acid density value decreased significantly to 3.26
mmol/g. This was because as the carbonisation temperature increased from 400℃ to
600℃, more volatiles matter escaped which eventually generated new pores and
widen the existing one. Such a well-developed pore structure provided additional
surface area for more acidic site to be grafted on the catalyst surface and thus
resulting in higher distribution of acidity. However, when beyond a certain
temperature, the violent gasification might destroyed the pore by collapsing or
contraction of pores wall and ultimately lowering the surface area and yielded fewer
acid sites. This trend was in good agreement with the SEM results for activated
carbon synthesised under different carbonisation temperatures.
Figure 4.8: Total Acid Density of Catalyst Carbonised at Different Temperatures
Next, the effect of impregnation ratio on the total acid density of catalyst is
illustrated in Figure 4.9. At the impregnation ratio of 1:0.1, the acid density value
obtained was 6.35 mmol/g. The total acid density was then increased gradually and
0
0.5
1
1.5
2
2.5
3
3.5
4
4.5
5
300 400 500 600 700 800 900
Tota
l Aci
d D
ensi
ty (
mm
ol/
g)
Carbonisation Temperature (ºC)

66
achieve the maximum value of 7.36 mmol/g when the impregnation ratio was 1:0.5.
However, when the impregnation ratio increased above 1:0.5, the total acid density
of the catalyst showed an opposite trend which decreased drastically to 4.46 mmol/g.
As aforementioned, impregnation ratio was the key factors in chemical activation
which determine initial porosity development of carbon prior to carbonisation.
Generally, at higher activating agent concentration, better pores structure in activated
carbon was obtained since the effect of the activation agent increased with increasing
dose. (Ismail, Taha and Ramli, 2016). However, concentrated solution might give
opposite effect to the catalyst due to the excessive chemical attack that weakened and
progressively collapsed the incipient carbon structure. Thus, optimisation of
impregnation ratio was important to achieve a balance between the pore formation
and pore widening (Budi, et al., 2016).
Figure 4.9: Total Acid Density of Catalyst Synthesised at Different Impregnation
Ratios
In the case of chemical activation at different temperatures, Figure 4.10
shows the total acid density of catalysts increased as the impregnation temperature
increased. For Cat_50, the acid density value obtained was the lowest due to the low
temperature. As the temperature increased further, an upward trend was observed and
the total acid density value started to become stable when the temperature reached
90℃, which was 7.36 mmol/g. At very low temperatures, in this case was 50℃, the
0
1
2
3
4
5
6
7
8
0 0.2 0.4 0.6 0.8 1 1.2
Tota
l Aci
d D
ensi
ty (
mm
ol/
g)
Impregnation Ratio

67
activating agent lack of sufficient energy to attack the carbon precursors and created
defects and crevices, allowing less oxidising gases into the char during carbonisation.
This ultimately resulted in narrow pores and poor acid distribution.
Figure 4.10: Total Acid Density of Catalyst Synthesised at Different Impregnation
Temperatures
4.3 Pretreatment Parameters Studies
The catalytic performance for all synthesised catalysts was tested in esterification of
feedstock PFAD with methanol in order to determine the most efficient and cost-
effective method to produce carbon-based catalyst in large scale. The esterification
reaction conditions were kept constant for all the experimental runs in order to focus
on the effect of pretreatment parameters on biodiesel production. The effect of
pretreatment parameters included carbonisation temperature, impregnation ratio and
impregnation temperature.
In Section 4.3.1, the effect of pretreatment parameters on the biodiesel
production was studied based on the results obtained from gas chromatography and
acid value test, which were the main indicator for catalytic activity. The data
obtained from the analysis mentioned could be converted into FAME yield and
FAME conversion respectively. The calculation steps to obtain FAME yield and
conversion could be found in Appendix F. In gas chromatography, the peaks
appeared at the respective retention time was used to confirm the presence of the four
0
1
2
3
4
5
6
7
8
40 50 60 70 80 90 100
Tota
l Aci
d D
ensi
ty (
mm
ol/
g)
Impregnation Temperature (ºC)
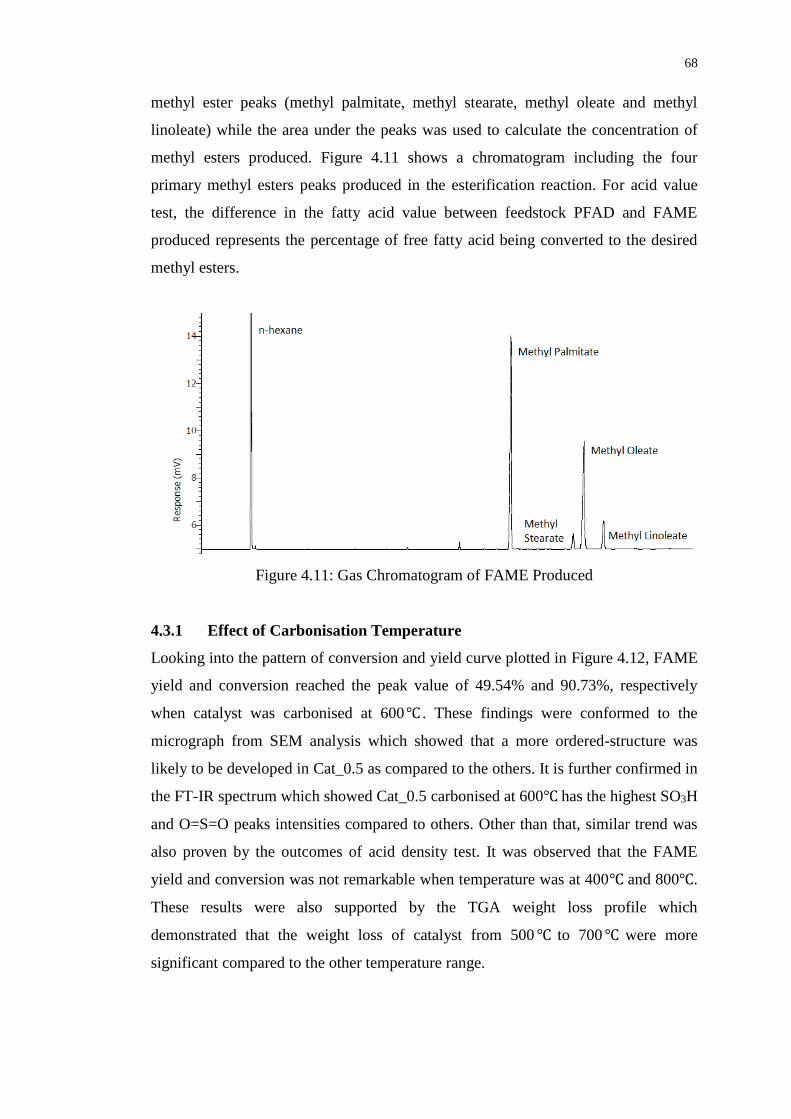
68
methyl ester peaks (methyl palmitate, methyl stearate, methyl oleate and methyl
linoleate) while the area under the peaks was used to calculate the concentration of
methyl esters produced. Figure 4.11 shows a chromatogram including the four
primary methyl esters peaks produced in the esterification reaction. For acid value
test, the difference in the fatty acid value between feedstock PFAD and FAME
produced represents the percentage of free fatty acid being converted to the desired
methyl esters.
Figure 4.11: Gas Chromatogram of FAME Produced
4.3.1 Effect of Carbonisation Temperature
Looking into the pattern of conversion and yield curve plotted in Figure 4.12, FAME
yield and conversion reached the peak value of 49.54% and 90.73%, respectively
when catalyst was carbonised at 600℃ . These findings were conformed to the
micrograph from SEM analysis which showed that a more ordered-structure was
likely to be developed in Cat_0.5 as compared to the others. It is further confirmed in
the FT-IR spectrum which showed Cat_0.5 carbonised at 600℃ has the highest SO3H
and O=S=O peaks intensities compared to others. Other than that, similar trend was
also proven by the outcomes of acid density test. It was observed that the FAME
yield and conversion was not remarkable when temperature was at 400℃ and 800℃.
These results were also supported by the TGA weight loss profile which
demonstrated that the weight loss of catalyst from 500 ℃ to 700 ℃ were more
significant compared to the other temperature range.

69
Carbonisation process was meant to remove volatile and organic matters,
leaving rigid carbon framework and developed highly porous structure under
elevated temperature. Although all activated carbon produced consisted of pores and
channels, however, the size of pores formed was crucial as it affected the surface area
and adsorption of acid functional group on the carbon surface. Most importantly, the
size of pores and the hydrophilicity of catalyst decided whether the reactant
molecules could enter the catalyst bulk and access to the active sites during chemical
reaction.
When carbonisation temperature was too low, incomplete carbonisation
happened where the carbon structure was not destructed sufficiently. The irregular
small pores created did not favour larger reactant molecules such as PFAD to
participate in the reaction and ultimately resulted in low and unsatisfied biodiesel
yield and conversion. The FAME produced solidified at room temperature once
methanol was evaporated, showing that there was still a portion of PFAD unreacted.
The pour point of the biodiesel produced did not compliant with the commercial
biodiesel ASTM standard. On the other hand, although Cat_800 was carbonised at
extremely high temperature, the FAME conversion was still low. The low conversion
was mainly due to the aggressive gasification of oxidising gas which resulted in more
compact pores that inhibited the attachment of sulfonic group.
Figure 4.12: FAME Yield and Conversion using Catalyst Synthesised at Different
Carbonisation Temperatures
0
10
20
30
40
50
60
70
80
90
100
300 400 500 600 700 800 900
Co
nve
rsio
n/Y
ield
(%
)
Carbonisation Temperature (ºC)
Yield Conversion
70
4.3.2 Effect of Impregnation Ratio
Impregnation ratio is one of the essential factors in the chemical activation of
biomass precursors since it had a direct effect on the porosity development of
catalyst. This section is devoted to study the effect of impregnation ratio by varying
the precursor to activating agent ratio from 1:0.1 to 1:1. Figure 4.13 shows that
initially, the increase in impregnation ratio from 1:0.1 to 1:0.5 yielded remarkable
results, which was 82.71% and 93.54% for FAME yield and FAME conversion
respectively. However, a downward trend in FAME yield and conversion was
noticed when the impregnation ratio was increased to 1:1.
During the impregnation process, NaOH solution destructed the lignin
structure and partially dissolved hemicellulose materials, allowing better contact of
the interior of biomass with NaOH to create micropores (Kumar and Jena, 2016). In
general, it was found that higher chemical dose was favourable for activation since it
accelerated the rate of degradation of cellulosic structure. This explained why
impregnation ratio of 1:0.5 found to be better compared to 1:0.1.
After achieving the maximum yield at ratio of 1:0.5, a downward trend was
observed due to the fact that excessive attack of NaOH deteriorated the wall between
microporous structure, leading to the widening of micropores. Beyond a certain
impregnation ratio, the pore size distribution was altered as reported by Mopoung, et
al. (2015) who claimed that an increase in impregnation ratio modified the initial
microporosity of carbon. At high NaOH concentration, there was a competition
between the mechanisms of new pores formation and existing pores widening in
which mesopores or macropores dominated eventually due to collapse of pore walls.
Another drawback of high NaOH concentration was that the excess NaOH molecules
formed a thin coating on the biomass surface, therefore inhibited the degradation of
cellulose in the interior of biomass, causing the surface structure to retain.

71
Figure 4.13: FAME Yield and Conversion Using Catalyst Synthesised at Different
Impregnation Ratios
4.3.3 Effect of Impregnation Temperature
The effect of impregnation temperature on biodiesel production was different from
the effect of carbonisation temperature. As shown in Figure 4.14, the FAME yield
and conversion increased proportionally with the impregnation temperature from
52.52% to 82.71% when the temperature increased from 50℃ to 90℃. Similar trend
was observed from the FAME conversion curve whereby Cat_90 attained the highest
conversion of 93.54% was found to be the most promising catalyst.
The result obtained followed the trend of the total acid density of the catalyst.
Since increasing the impregnation temperature was able to increase the collision
between NaOH molecules and the carbon support, which in turn increased the rate of
reaction between NaOH and carbon surface. The higher destruction rate of lignin and
cellulose structure resulted in more micropores content available for binding sites.
Therefore, the optimum FAME yield and conversion was obtained by using Cat_90
synthesised at 600℃ carbonisation temperature and 1: 0.5 biomass to NaOH weight
ratio.
0
10
20
30
40
50
60
70
80
90
100
0 0.1 0.2 0.3 0.4 0.5 0.6 0.7 0.8 0.9 1 1.1
Co
nve
rsio
n/Y
ield
(%
)
Impregnation Ratio
Yield Conversion

72
Figure 4.14: FAME Yield and Conversion Using Catalyst Synthesised at Different
Impregnation Temperatures
4.4 Effects of Sulfonation Method on Biodiesel Production
Recently, it has been established that sulfonated carbon was found to outperform
homogeneous acid catalyst owing to its high –SO3H density grafted on carbon
surface, which made sulfonated carbon became the most promising heterogeneous
catalyst used in biodiesel production. In this section, the active sites were grafted
onto the activated carbon surface through different sulfonation methods such as
direct sulfonation, arylation of 4-benzenediazonium sulfonate (4-BDS) and
sulfonation by thermal decomposition of ammonium persulfate in order to
investigate the effect of sulfonation methods employed on the performance of
catalyst activity. The sulfonated catalyst prepared from these methods were subjected
to esterification to test the catalytic performance of catalyst using low-value
feedstock, PFAD. The effectiveness of various sulfonation method was credited to
the –SO3H group attachment, which was consistent with the results of total acid
density, FAME yield and FAME conversion.
According to the results summarised in Table 4.7, it was found that catalyst
sulfonated via direct sulfonation method gave the highest FAME yield of 82.71%.
On the contrary, catalyst sulfonated via 4-BDS and thermal decomposition of
ammonium persulfate exhibited very low and unsatisfied FAME yield of 16.99% and
0
10
20
30
40
50
60
70
80
90
100
40 50 60 70 80 90 100
Co
nve
rsio
n/Y
ield
(%
)
Impregnation Temperature (ºC)
Yield Conversion

73
2.21%, respectively. The low FAME conversion explained the solidification of
FAME produced at room temperature. Besides, the total acid density value was
directly proportional to the FAME yield and conversion. Among the sulfonation
methods, direct sulfonation method using concentrated sulfuric acid yielded the
highest –SO3H sites of 7.36mmol/g, which implied that catalyst sulfonated by H2SO4
had high feasibility and stability as compared to other methods. However, this
finding was not in agreement with Konwar, et al. (2015) who claimed that –SO3H
group functionalised by 4-BDS method was higher than that of direct sulfonation and
this method. This might due to the fact that the aryl radical produced during
reduction of 4-BDS was less strongly bonded to the amorphous structure of palm
frond derived activated carbon. In the case of sulfonation using ammonium
persulfate, the low acid density might due to the poor attachment of the sulfate group
on the solid structure. Besides, it also exhibited the possibility of decomposition of
the acid sites during esterification process conducted at 100℃, which is very near to
the decomposition temperature of ammonium persulfate at 120℃.
Table 4.7: Results for Various Sulfonation Methods
Sulfonation Methods Total Acid
Density
(mmol/g)
FAME Yield
(%)
FAME
Conversion
(%)
Direct Sulfonation 7.36 82.71 93.54
4-BDS 3.94 16.99 58.15
Thermal Decomposition
of Ammonium Persulfate
1.10 2.21 16.46

74
CHAPTER 5
5 CONCLUSION AND RECOMMENDATIONS
5.1 Conclusion
The present research focused on the synthesising of carbon-based acid catalyst from
waste oil palm frond (OPF) for biodiesel production. The synthesised catalyst was
successfully used in esterification of low-value feedstock PFAD at a reaction
condition of 1:20 oil to methanol molar ratio, 5 wt% catalyst loading, reaction
temperature of 100℃ and reaction duration of 4 hours. The biodiesel produced using
the best-performed catalyst (Cat_0.5) yielded a remarkable FAME yield of 82.71%
and FAME conversion of 93.54%. The optimum catalyst showed a steady
performance and promising catalytic efficiency in esterifying feedstock with high
FFA value using only a small amount of catalyst which was considered cost-effective
in large-scale biodiesel production.
Several characterisation techniques such as SEM-EDX, FTIR, TGA, TPR and
XRD were conducted for the analysis of synthesised catalysts. SEM micrographs
showed that the catalysts produced had well-developed pores arranged in a
honeycomb manner which allowed sulfonic groups to form covalent bond on the
carbon surface. EDX analysis showed a distinct S peak on the spectra of sulfonated
activated carbon confirmed the successful incorporation of –SO3H groups on the
catalyst support. This finding was further proven by the FT-IR analysis in which the
O=S=O stretching and –SO3H symmetric vibration band found on the spectrum
showed the present of the active functional group on the catalyst.
On the other hand, TGA result showed that the catalyst undergone three
stages of weight loss under nitrogen flow where first mass loss step was due to the
evaporation of moisture that adsorbed within the activated carbon, second weight
loss stage was due to the decomposition of SO3H functional group anchored on the
carbon support and the third weight loss was associated with the thermal
decomposition of cellulose and lignin material within the temperature range of
500℃-700℃. The main finding of this analysis showed that palm frond derived
catalyst exhibited excellent thermal stability up to 225℃. From the TPR analysis, the
TPR plot showed that the reduction of carbon catalyst was the highest at 890 °C. The

75
high reduction temperature of the catalyst allowed it to be used in other application
with low level of reduction such as hydrogenation.
Catalytic performance of catalyst prepared at different pretreatment
parameters was also tested through esterification of PFAD to determine the most
efficient and cost-effective condition to produce carbon-based catalyst in large scale.
First and foremost, catalyst carbonised at varied temperature showed that Cat_600
gave the highest biodiesel yield and conversion as compared to other catalysts. These
findings were confirmed to the SEM micrograph which showed a more ordered-
structure was likely to be developed in Cat_0.5. It was further confirmed in the FT-
IR spectrum which showed Cat_0.5 had the highest –SO3H and O=S=O peaks
intensities compared to others. Other than that, similar trend was also proven by the
outcomes of acid density test. These results were also supported by the TGA weight
loss profile which demonstrated that the weight loss of catalyst from 500℃ to 700℃
were more significant compared to the other temperature range.
Next, the biomass activated at different impregnation ratio and impregnation
temperature were also tested through esterification of PFAD. The result showed that
Cat_0.5 was the optimum catalyst as a too high concentration of activating agent
resulted in excessive destruction of carbon structure. Cat_90 also reported having the
highest biodiesel yield which is 82.71% since at high temperature, activating agent
gains sufficient energy and collide more often with the carbon surface which
accelerate the rate of destruction. In overall, the acidic carbon catalyst synthesised at
a condition of carbonisation temperature of 600℃, impregnation ratio of 1:0.5 and
impregnation temperature of 90 ℃ exhibited the highest total acid density and
biodiesel yield. Overall, all the planned objectives were fulfilled. The presented
results were remarkable but there is always room for improvement. Further research
is still needed to improve and optimise the biodiesel yield in the future.
5.2 Recommendations for Future Research
Despite the experimental work was conducted accordingly to the scope of study,
however there was still some fluctuations in results that need to be further confirmed
by performing more repetition works. The discrepancies in the results might due to
material and equipment limitations, time constraint and most importantly the
inconsistency in each batch samples collected. Therefore, several suggestions were
made to improve the accuracy and reliability of the results. Listed below are the

76
recommendations which may be useful for future research.
i. To ensure the catalysts produced are consistent, mass production of sample in
single batch is more favourable. This is to ensure that the samples produced
carry the same structural properties since production in separate batch will
result in deviation of sample properties although the same condition was
applied.
ii. Ensure that the equipment used in every repetitive reaction set is consistent to
maintain the uniformity of condition such as heating rate of hot plate.
iii. Besides pretreatment parameter study, more parameter studies on sulfonation
and esterification process can be conducted in the next research.
iv. More experimental run is needed for the same parameter study to get a more
accurate and reliable result especially in determining the optimum condition.
v. A wider experimental range in parameter study is required to obtain the
absolute optimum conditions in synthesising the best-performed catalyst.
vi. Characterisation of catalyst should be conducted as soon as the catalysts were
produced to avoid degradation or contamination of samples.
vii. Conduct GC test by using internal standard to reduce deviations in results
caused by the instable equipment response and errors arise during sample
handling.
viii. Use of thermocouple during the sulfonation and esterification process is
required to ensure that the reaction temperature is kept constant throughout
the reaction.

77
REFERENCES
Abbaszaadeh, A., Ghobadian, B., Omidkhah, M. and Najafi, G., 2012. Current
biodiesel production technologies: A comparative review. Energy Conversion and
Management, 63, pp.138-148.
Aransiola, E., Ojumu, T., Oyekola, O., Madzimbamuto, T. and Ikhu-Omoregbe, D.,
2014. A review of current technology for biodiesel production: State of the
art. Biomass and Bioenergy, 61, pp.276-297.
Balat, M., 2008. Diesel-Like Fuel Obtained by Catalytic Pyrolysis of Waste Engine
Oil. Energy Exploration & Exploitation, 26(3), pp.197-208.
Baroutian, S., Aroua, M., Raman, A. and Sulaiman, N., 2010. Potassium hydroxide
catalyst supported on palm shell activated carbon for transesterification of palm
oil. Fuel Processing Technology, 91(11), pp.1378-1385.
Bobbili, S. and Mosali, R., 2011. Biodiesel Magazine - Homogenous Catalyst and
Effects on Multifeedstock Processing. [online] Biodieselmagazine.com. Available at:
<http://www.biodieselmagazine.com/articles/7793/homogenous-catalyst-and-effects-
on-multifeedstock-processing> [Accessed 29 Jun. 2018].
Buasri, A., Chaiyut, N., Loryuenyong, V., Rodklum, C., Chaikwan, T., Kumphan,
N., Jadee, K., Klinklom, P. and Wittayarounayut, W., 2012. Transesterification of
waste frying oil for synthesizing biodiesel by KOH supported on coconut shell
activated carbon in packed bed reactor. ScienceAsia, 38(3), p.283.
Buasri, A., Chaiyut, N., Loryuenyong, V., Rodklum, C., Chaikwan, T. and
Kumphan, N., 2012. Continuous Process for Biodiesel Production in Packed Bed
Reactor from Waste Frying Oil Using Potassium Hydroxide Supported on Jatropha
curcas Fruit Shell as Solid Catalyst. Applied Sciences, 2(3), pp.641-653.
Budi, E., Umiatin, Nasbey, H., Bintoro, R., Wulandari, F. and Erlina, 2016.
Activated coconut shell charcoal carbon using chemical-physical activation.
Cheenmatchaya, A. and Kungwankunakorn, S., 2014. Preparation of Activated
Carbon Derived from Rice Husk by Simple Carbonization and Chemical Activation
for Using as Gasoline Adsorbent. International Journal of Environmental Science
and Development, pp.171-175.
Dalai, A. and Baroi, C., 2012. Catalysis for Alternative Energy Generation. New
York: Springer, pp.237-304.
Dhawane, S., Kumar, T. and Halder, G., 2016. Biodiesel synthesis from Hevea
brasiliensis oil employing carbon supported heterogeneous catalyst: Optimization by
Taguchi method. Renewable Energy, 89, pp.506-514.
Department of Statistics, Malaysia, 2017. Current Population Estimates, Malaysia,
2016-2017. [online] Available at:
<https://www.dosm.gov.my/v1/index.php?r=column/pdfPrev&id=a1d1UTFZazd5ajJ
iRWFHNDduOXFFQT09> [Accessed 29 Jun. 2018].

78
Eia.gov, 2018. EIA - International Energy Outlook 2017. [online] Available at:
<https://www.eia.gov/outlooks/ieo/> [Accessed 29 Jun. 2018].
Ezebor, F., Khairuddean, M., Abdullah, A. and Boey, P., 2014. Esterification of oily-
FFA and transesterification of high FFA waste oils using novel palm trunk and
bagasse-derived catalysts. Energy Conversion and Management, 88, pp.1143-1150.
Gui, M., Lee, K. and Bhatia, S., 2008. Feasibility of edible oil vs. non-edible oil vs.
waste edible oil as biodiesel feedstock. Energy, 33(11), pp.1646-1653.
Hadiyanto, H., Afianti, A., Navi’a, U., Adetya, N., Widayat, W. and Sutanto, H.,
2017. The development of heterogeneous catalyst C/CaO/NaOH from waste of green
mussel shell ( Perna varidis ) for biodiesel synthesis. Journal of Environmental
Chemical Engineering, 5(5), pp.4559-4563.
Hassan, M. and Kalam, M., 2013. An Overview of Biofuel as a Renewable Energy
Source: Development and Challenges. Procedia Engineering, 56, pp.39-53.
Hayashi, J., Kazehaya, A., Muroyama, K. and Watkinson, A., 2000. Preparation of
activated carbon from lignin by chemical activation. Carbon, 38(13), pp.1873-1878.
Iea.org, 2018. WEO 2017 : Key Findings. [online] Available at:
<http://www.iea.org/weo2017/> [Accessed 29 Jun. 2018].
IOANNIDOU, O. and ZABANIOTOU, A., 2007. Agricultural residues as precursors
for activated carbon production—A review. Renewable and Sustainable Energy
Reviews, 11(9), pp.1966-2005.
Islam, M., Rouf, M., Fujimoto, S. and Minowa, T., 2018. Preparation and
characterisation of activated carbon from bio-diesel by-products (Jatropha seedcake)
by steam activation. Fuel, 187, pp180-188.
Ismail, N., Taha, M. and Ramli, A., 2016. Preparation and characterisation activated
carbon from rice husk and oil palm empty fruit bunches for removal of Zn2+ in
aqueous solution. Journal of Environmental Chemical Engineering, 5(5), pp.3679-
3897.
Kalderis, D., Bethanis, S., Paraskeva, P. and Diamadopoulos, E., 2008. Production of
activated carbon from bagasse and rice husk by a single-stage chemical activation
method at low retention times. Bioresource Technology, 99(15), pp.6809-6816.
Kiss, F., Jovanović, M. and Bošković, G., 2010. Economic and ecological aspects of
biodiesel production over homogeneous and heterogeneous catalysts. Fuel
Processing Technology, 91(10), pp.1316-1320.
Konwar, L., Mäki-Arvela, P., Salminen, E., Kumar, N., Thakur, A., Mikkola, J. and
Deka, D., 2015. Towards carbon efficient biorefining: Multifunctional mesoporous
solid acids obtained from biodiesel production wastes for biomass
conversion. Applied Catalysis B: Environmental, 176-177, pp.20-35.
Kumar, A. and Jena, H., 2016. Preparation and characterization of high surface area
activated carbon from Fox nut (Euryale ferox) shell by chemical activation with
H3PO4. Results in Physics.
79
Lai, L. and Idris, A., 2013. Disruption of Oil Palm Trunks and Fronds by
Microwave-Alkali Pretreatment. BioResources, 8(2).
Li, W., Yang, K., Peng, J., Zhang, L., Guo, S. and Xia, H., 2008. Effects of
carbonisation temperatures on characteristics of porosity in coconut shell chars and
activated carbons derived from carbonised coconut shell chars. Industrial Crops and
Products, 28(2), pp.190-198.
Liou, T. and Wu, S., 2009. Characteristics of microporous/mesoporous carbons
prepared from rice husk under base- and acid-treated conditions. Journal of
Hazardous Materials, 171(1-3), pp.693-703.
Ma, F. and Hanna, M., 1999. Biodiesel production: a review1Journal Series #12109,
Agricultural Research Division, Institute of Agriculture and Natural Resources,
University of Nebraska–Lincoln.1. Bioresource Technology, 70(1), pp.1-15.
Md Arshad, S., Ngadi, N., Aziz, A., Amin, N., Jusoh, M. and Wong, S., 2016.
Preparation of activated carbon from empty fruit bunch for hydrogen
storage. Journal of Energy Storage, 8, pp.257-261.
Meih.st.gov.my., 2018. Statistics - Malaysia Energy Information Hub. [online]
Available at: <http://meih.st.gov.my/statistics> [Accessed 29 Jun. 2018].
Mopoung, S., Moonsri, P., Palas, W. and Khumpai, S., 2015. Characterization and
Properties of Activated Carbon Prepared from Tamarind Seeds by KOH Activation
for Fe(III) Adsorption from Aqueous Solution. The Scientific World Journal, 2015,
pp.1-9.
Muniandy, L., Adam, F., Mohamed, A. and Ng, E., 2014. The synthesis and
characterisation of high purity mixed microporous/mesoporous activated carbon
from rice husk using chemical activation with NaOH and KOH. Microporous and
Mesoporous Materials, 197, pp.316-323.
Prahas, D., Kartika, Y., Indraswati, N. and Ismadji, S., 2008. Activated carbon from
jackfruit peel waste by H3PO chemical activation: Pore structure and surface
chemistry characterisation. Chemical Engineering Journal, 140(1-3), pp.32-42.
Pua, F., Fang, Z., Zakaria, S., Guo, F. and Chia, C., 2011. Direct production of
biodiesel from high-acid value Jatropha oil with solid acid catalyst derived from
lignin. Biotechnology for Biofuels, 4(1), p.56.
Raymundo-Piñero, E., Azaïs, P., Cacciaguerra, T., Cazorla-Amorós, D., Linares-
Solano, A. and Béguin, F., 2005. KOH and NaOH activation mechanisms of
multiwalled carbon nanotubes with different structural organisation. Carbon, 43(4),
pp.786-795.
Refaat, A., 2009. Different techniques for the production of biodiesel from waste
vegetable oil. International Journal of Environmental Science & Technology, 7(1),
pp.183-213.
Renewable Energy Market Analysis: Southeast Asia., 2018. [ebook] Abu Dhabi.:
IRENA. Available at: <https://irena.org/-
/media/Files/IRENA/Agency/Publication/2018/Jan/IRENA_Market_Southeast_Asia
_2018.pdf >[Accessed 29 Jun. 2018].

80
Rincón, L., Jaramillo, J. and Cardona, C., 2014. Comparison of feedstocks and
technologies for biodiesel production: An environmental and techno-economic
evaluation. Renewable Energy, 69, pp.479-487.
Salman, J., 2014. Optimization of preparation conditions for activated carbon from
palm oil fronds using response surface methodology on removal of pesticides from
aqueous solution. Arabian Journal of Chemistry, 7(1), pp.101-108.
Salman, J. and Hameed, B., 2010. Effect of preparation conditions of oil palm fronds
activated carbon on adsorption of bentazon from aqueous solutions. Journal of
Hazardous Materials, 175(1-3), pp.133-137.
Shuit, S. and Tan, S., 2014. Feasibility study of various sulphonation methods for
transforming carbon nanotubes into catalysts for the esterification of palm fatty acid
distillate. Energy Conversion and Management, 88, pp.1283-1289.
Subramonia Pillai, N., Kannan, P., Vettivel, S. and Suresh, S., 2017. Optimization of
transesterification of biodiesel using green catalyst derived from Albizia Lebbeck
Pods by mixture design. Renewable Energy, 104, pp.185-196.
Sumathi, S., Chai, S. and Mohamed, A., 2008. Utilization of oil palm as a source of
renewable energy in Malaysia. Renewable and Sustainable Energy Reviews, 12(9),
pp.2404-2421.
Thanh, L., Okitsu, K., Boi, L. and Maeda, Y., 2012. Catalytic Technologies for
Biodiesel Fuel Production and Utilization of Glycerol: A Review. Catalysts, 2(1),
pp.191-222.
The Edge Markets., 2018. Bank Negara: Malaysia 2017 GDP growth at 5.9%.
[online] Available at: <http://www.theedgemarkets.com/article/bank-negara-
malaysia-2017-gdp-growth-59> [Accessed 29 Jun. 2018].
Wang, S., Yuan, H., Wang, Y. and Shan, R., 2017. Transesterification of vegetable
oil on low cost and efficient meat and bone meal biochar catalysts. Energy
Conversion and Management, 150, pp.214-221.
Worldcat.org, 2018. BP statistical review of world energy. [online] Available at:
<http://www.worldcat.org/title/bp-statistical-review-of-world-
energy/oclc/8530077%3Fpage%3Dcitation> [Accessed 29 Jun. 2018].
Yahya, M., Al-Qodah, Z. and Ngah, C., 2015. Agricultural bio-waste materials as
potential sustainable precursors used for activated carbon production: A
review. Renewable and Sustainable Energy Reviews, 46, pp.218-235.
Zhao, C., Lv, P., Yang, L., Xing, S., Luo, W. and Wang, Z., 2018. Biodiesel
synthesis over biochar-based catalyst from biomass waste pomelo peel. Energy
Conversion and Management, 160, pp.477-485.
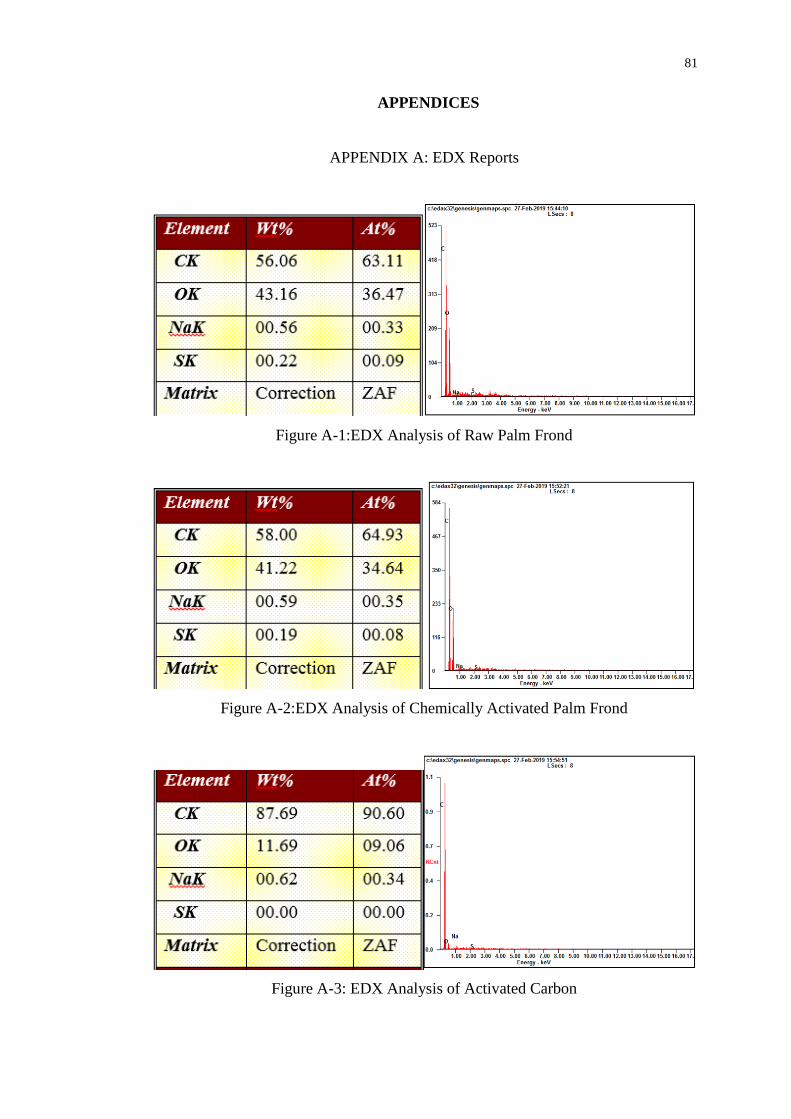
81
5 APPENDICES
APPENDIX A: EDX Reports
Figure A-1:EDX Analysis of Raw Palm Frond
Figure A-2:EDX Analysis of Chemically Activated Palm Frond
Figure A-3: EDX Analysis of Activated Carbon

82
Figure A-4: EDX Analysis of Sulfonated Activated Carbon

83
APPENDIX B: FT-IR Reports
Figure B-1: FTIR Spectrum of Activated Carbon Carbonised at 600oC

84
Figure B-2: FTIR Spectrum of Cat_600
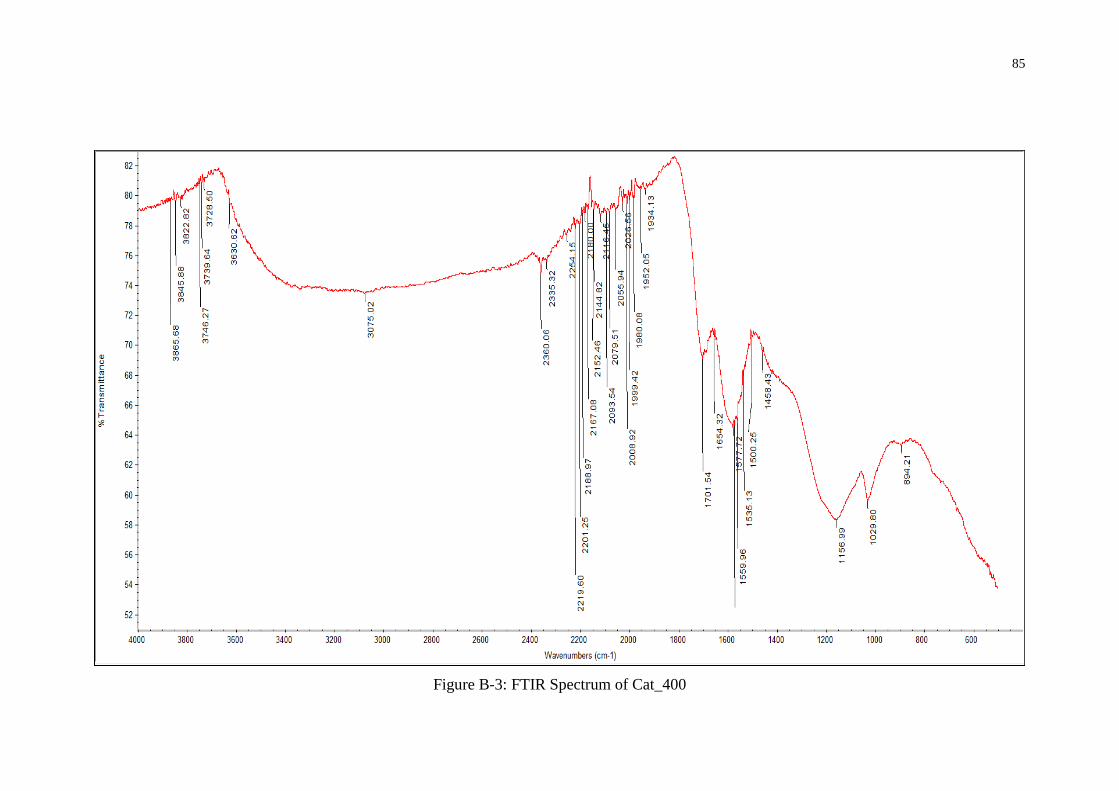
85
Figure B-3: FTIR Spectrum of Cat_400

86
Figure B-4: FTIR Spectrum of Cat_800

87
APPENDIX C: GC Reports
Figure C-1: Peak Report and Chromatogram of Catalyst Prepared in Preliminary
Study

88
Figure C-2: Peak Report and Chromatogram of Cat_400

89
Figure C-3: Peak Report and Chromatogram of Cat_600

90
Figure C-4: Peak Report and Chromatogram of Cat_800
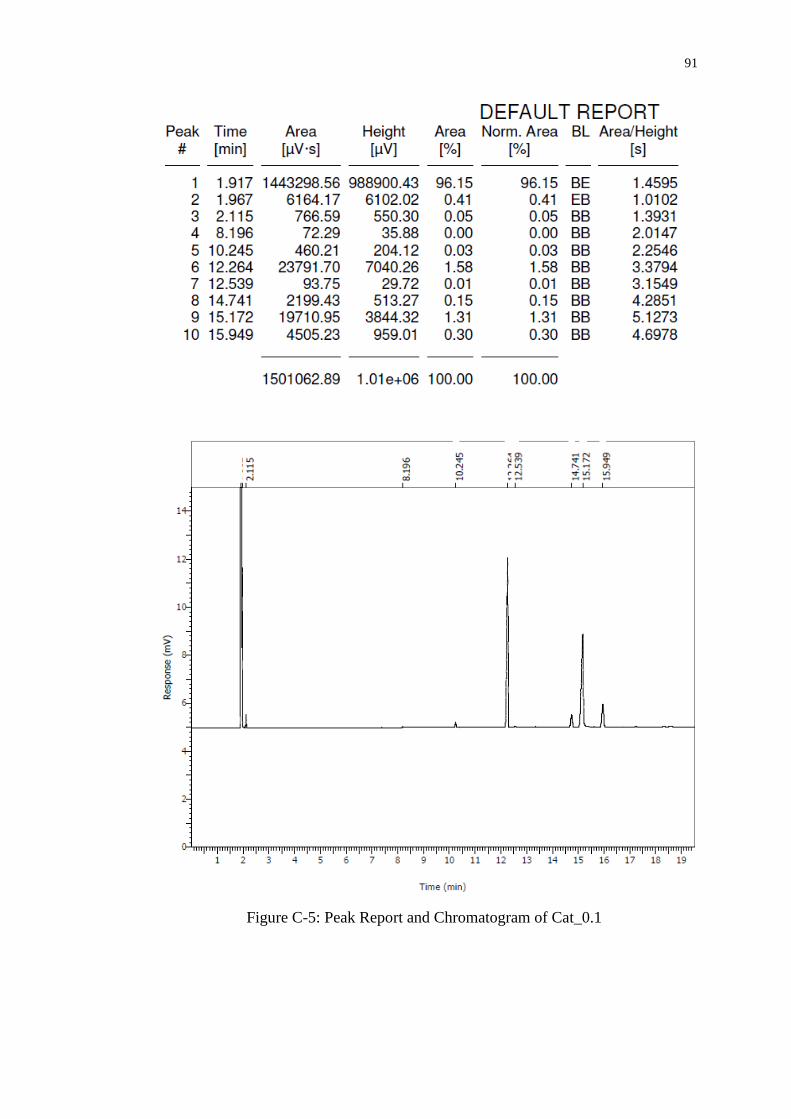
91
Figure C-5: Peak Report and Chromatogram of Cat_0.1

92
Figure C-6: Peak Report and Chromatogram of Cat_0.5

93
Figure C-7: Peak Report and Chromatogram of Cat_50

94
Figure C-8: Peak Report and Chromatogram of Cat_70

95
Figure C-9: Peak Report and Chromatogram of Catalyst Prepared by 4-BDS Method

96
Figure C-10: Peak Report and Chromatogram of Catalyst Prepared by Thermal
Decomposition of Ammonium Persulfate Method

97
APPENDIX D: TPR Report
Figure D- 1: TPR Profile of Activated Carbon and Cat_0.5
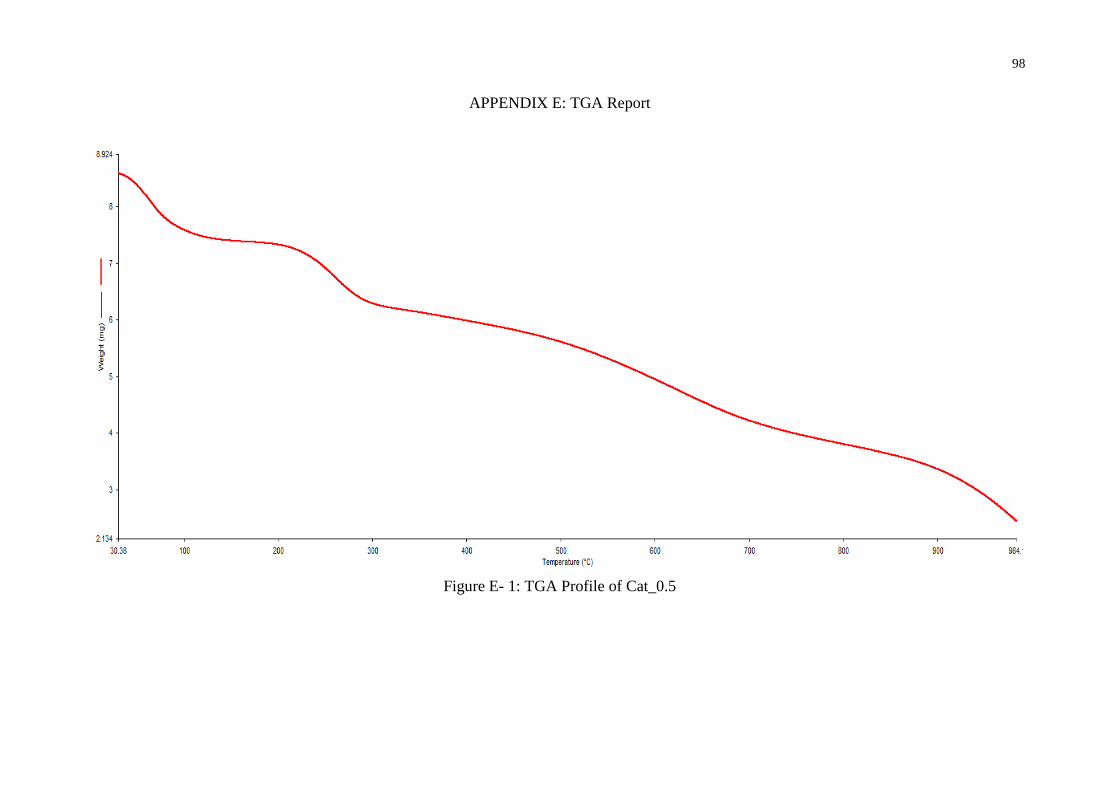
98
APPENDIX E: TGA Report
Figure E- 1: TGA Profile of Cat_0.5
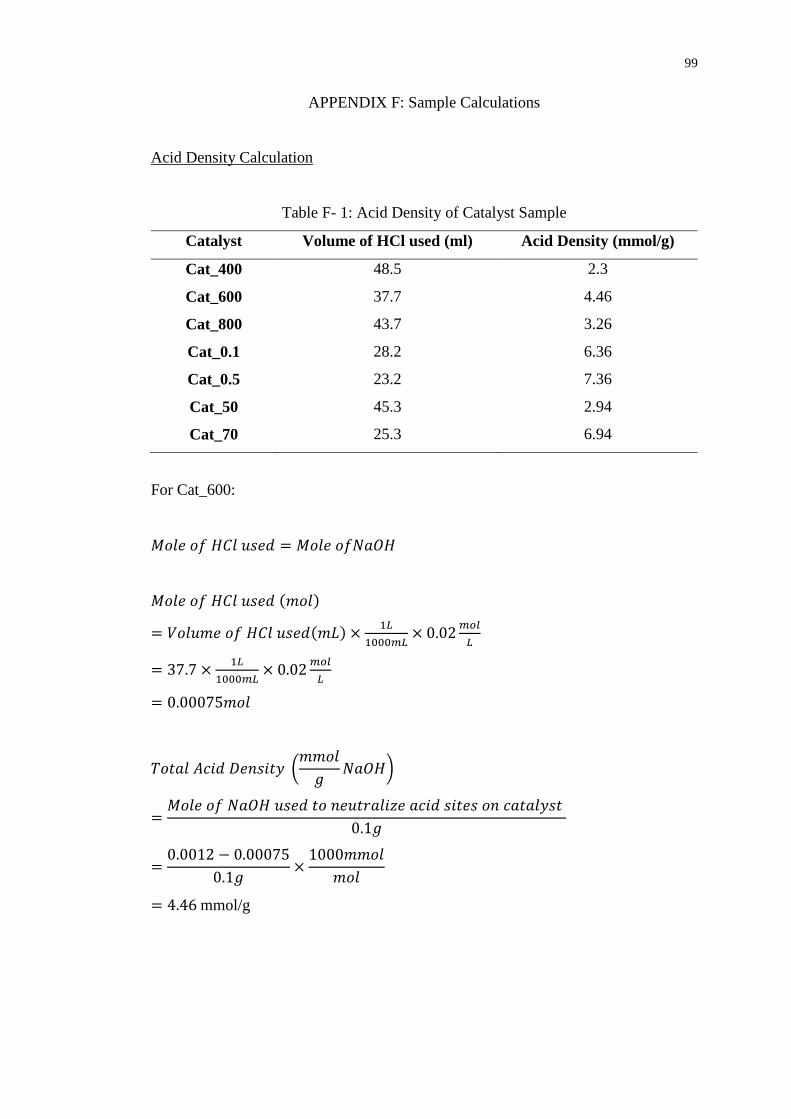
99
APPENDIX F: Sample Calculations
Acid Density Calculation
Table F- 1: Acid Density of Catalyst Sample
Catalyst Volume of HCl used (ml) Acid Density (mmol/g)
Cat_400 48.5 2.3
Cat_600 37.7 4.46
Cat_800 43.7 3.26
Cat_0.1 28.2 6.36
Cat_0.5 23.2 7.36
Cat_50 45.3 2.94
Cat_70 25.3 6.94
For Cat_600:
𝑀𝑜𝑙𝑒 𝑜𝑓 𝐻𝐶𝑙 𝑢𝑠𝑒𝑑 = 𝑀𝑜𝑙𝑒 𝑜𝑓𝑁𝑎𝑂𝐻
𝑀𝑜𝑙𝑒 𝑜𝑓 𝐻𝐶𝑙 𝑢𝑠𝑒𝑑 (𝑚𝑜𝑙)
= 𝑉𝑜𝑙𝑢𝑚𝑒 𝑜𝑓 𝐻𝐶𝑙 𝑢𝑠𝑒𝑑(𝑚𝐿) ×1𝐿
1000𝑚𝐿× 0.02
𝑚𝑜𝑙
𝐿
= 37.7 ×1𝐿
1000𝑚𝐿× 0.02
𝑚𝑜𝑙
𝐿
= 0.00075𝑚𝑜𝑙
𝑇𝑜𝑡𝑎𝑙 𝐴𝑐𝑖𝑑 𝐷𝑒𝑛𝑠𝑖𝑡𝑦 (𝑚𝑚𝑜𝑙
𝑔𝑁𝑎𝑂𝐻)
=𝑀𝑜𝑙𝑒 𝑜𝑓 𝑁𝑎𝑂𝐻 𝑢𝑠𝑒𝑑 𝑡𝑜 𝑛𝑒𝑢𝑡𝑟𝑎𝑙𝑖𝑧𝑒 𝑎𝑐𝑖𝑑 𝑠𝑖𝑡𝑒𝑠 𝑜𝑛 𝑐𝑎𝑡𝑎𝑙𝑦𝑠𝑡
0.1𝑔
=0.0012 − 0.00075
0.1𝑔×
1000𝑚𝑚𝑜𝑙
𝑚𝑜𝑙
= 4.46 mmol/g

100
Acid Value Calculation
Table F- 2: FAME Conversion of Catalyst Sample
Catalyst Volume of KOH used (ml) FAME Conversion
Cat_400 15.8 55.62
Cat_600 3.3 90.73
Cat_800 7.5 78.93
Cat_0.1 2.8 92.13
Cat_0.5 2.3 93.54
Cat_50 4.4 87.64
Cat_70 2.7 92.42
For Cat_600,
𝐴𝑐𝑖𝑑 𝑉𝑎𝑙𝑢𝑒, 𝐴𝑉 (𝑚𝑔𝐾𝑂𝐻
𝑔)
=𝑉 × 𝑁 × 𝑀𝑊
𝑊𝑆
=3.3 × 0.1𝑁 × 56.11𝑔/𝑚𝑜𝑙
1𝑔×
1000𝑚𝑔
𝑔
= 18516.3 𝑚𝑔 𝐾𝑂𝐻/𝑔
𝐴𝑐𝑖𝑑 𝑉𝑎𝑙𝑢𝑒 𝐶𝑜𝑛𝑣𝑒𝑟𝑠𝑖𝑜𝑛 (%)
=𝑎𝑖 − 𝑎𝑓
𝑎𝑖× 100
=199751.6 − 18516.3
199751.6× 100%
= 90.73%

101
FAME Yield Calculation
Table F- 3: Concentration of Methyl Esters in Cat_600
Methyl Ester Calibration
Equation
Peak Area Concentration
(g/L)
Methyl Palmitate y=1388.1x 19686.27 14.18
Methyl Stearate y=1298.1x 1648.12 1.27
Methyl Oleate y=1439.5x 13625.12 9.47
Methyl Linoleate y=1278.6x 3294.16 2.58
Total Concentration 27.49
Methyl Palmitate Concentration:
𝑦 = 1388.1𝑥
𝑥 = 𝑦
1388.1
= 19686.27
1388.1
= 14.18𝑔/𝐿
Methyl Stearate Concentration:
𝑦 = 1298.1𝑥
𝑥 = 𝑦
1298.1
= 1648.12
1298.1
= 1.27𝑔/𝐿
Methyl Oleate Concentration:
𝑦 = 1439.5𝑥
𝑥 = 𝑦
1439.5
= 13625.12
1439.5
= 9.47𝑔/𝐿
Methyl Linoleate Concentration:
𝑦 = 1278.6𝑥
𝑥 = 𝑦
1278.6
= 3249.16
1278.6
= 2.58𝑔/𝐿
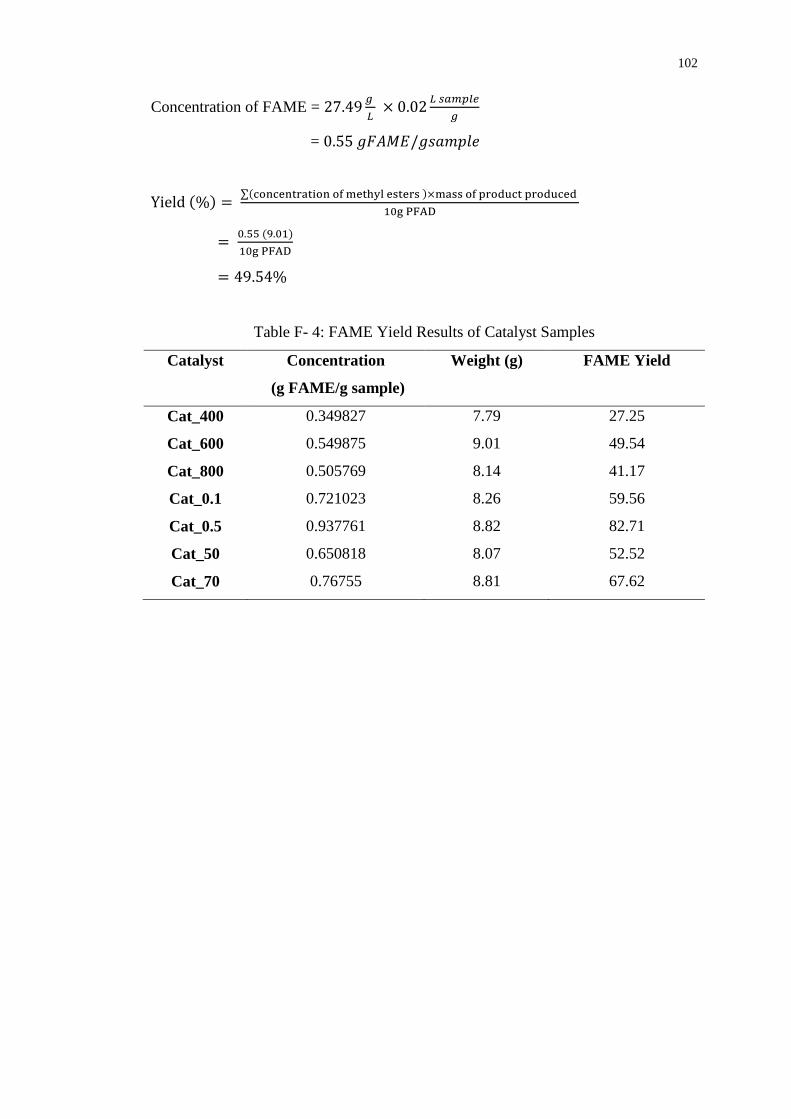
102
Concentration of FAME = 27.49𝑔
𝐿 × 0.02
𝐿 𝑠𝑎𝑚𝑝𝑙𝑒
𝑔
= 0.55 𝑔𝐹𝐴𝑀𝐸/𝑔𝑠𝑎𝑚𝑝𝑙𝑒
Yield (%) = ∑(concentration of methyl esters )×mass of product produced
10g PFAD
= 0.55 (9.01)
10g PFAD
= 49.54%
Table F- 4: FAME Yield Results of Catalyst Samples
Catalyst Concentration
(g FAME/g sample)
Weight (g) FAME Yield
Cat_400 0.349827 7.79 27.25
Cat_600 0.549875 9.01 49.54
Cat_800 0.505769 8.14 41.17
Cat_0.1 0.721023 8.26 59.56
Cat_0.5 0.937761 8.82 82.71
Cat_50 0.650818 8.07 52.52
Cat_70 0.76755 8.81 67.62

103
Related Documents