CERAMICS INTERNATIONAL Available online at www.sciencedirect.com Ceramics International 39 (2013) 3603–3611 Effect of preparation route on the microstructure and electrical conductivity of co-doped ceria Dusan Bucevac a,n , Aleksandar Radojkovic b , Miroslav Miljkovic c , Biljana Babic a , Branko Matovic a a Institute of Nuclear Sciences Vinca, University of Belgrade, P.O. Box 522, 11001 Belgrade, Serbia b Institute for Multidisciplinary Research, University of Belgrade, Kneza Viseslava 1, 11000 Belgrade, Serbia c Center of Electron Microscopy, University of Nis, Bulevar Dr Zorana Djindjica 81, 18000 Nis, Serbia Received 20 August 2012; received in revised form 26 September 2012; accepted 10 October 2012 Available online 23 October 2012 Abstract Dense Ce 0.8 Sm 0.1 Gd 0.1 O 2 d electrolytes were fabricated by sintering of CeO 2 solid solutions which were prepared from metal nitrates and NaOH using self propagating room temperature synthesis (SPRT). Three different routes were employed to obtain CeO 2 solid solution powders: (I) hand mixing of reactants, (II) ball milling of reactants and (III) ball milling of Ce 0.8 Sm 0.2 O 2 d and Ce 0.8 Gd 0.2 O 2 d solid solutions previously prepared by ball milling of corresponding nitrates and NaOH. Density measurements showed that ball milling, which is more convenient than hand mixing, is an effective way to obtain almost full dense samples after presureless sintering at 1550 1C for 1 h. These samples had larger grain size and consequently higher conductivity than the samples obtained by hand mixing. The highest conductivity of 2.704 10 2 (O cm) 1 was measured at 700 1C in a sample prepared by route II. It was found that reduced grain size in samples obtained by hand mixing leads to a decrease in grain boundary conductivity and therefore decrease in the total conductivity. The results showed that mixing of single doped ceria solid solutions improved densification and inhibited grain growth. & 2012 Elsevier Ltd and Techna Group S.r.l. All rights reserved. Keywords: A. Sintering; C. Ionic conduction; Ceria; Microstructure 1. Introduction Solid oxide fuel cells (SOFCs) are power generation devices that convert chemical energy of fuels such as H 2 , CH 4 or CO into electrical energy. The conversion normally involves fuel oxidation on anode and oxygen reduction on cathode [1]. In order to obtain an electron flow from the anode to the cathode it is essential that the fuel and oxygen are physically separated. This is accomplished by placing a solid electrolyte between the electrodes which prevents fuel-oxygen contact and at the same time allows transport of oxygen ions from the cathode to the anode. The oxygen transport is necessary for continuous oxygen supply to the anode and therefore continuous operation of SOFCs. One of the most successful electrolytes for application in SOFCs is doped ceria (CeO 2 ) which posses relatively high oxygen ionic conductivity at intermediate temperatures (500–700 1C) [2,3]. This temperature is considerably lower than 900 1C which is the operation temperature of mainly used SOFCs with yttria-stabilized zirconia (YSZ) electro- lyte [4]. High oxygen ionic conductivity of ceria is ascribed to relatively open cubic fluorite structure which can accommodate wide range of concentrations of aliovalent cations such as rare earth (Re) cations (Yb 3 þ , Nd 3 þ , Dy 3 þ , Gd 3 þ and Sm 3 þ ) [5]. The substitution of Ce 4 þ cations by Re 3 þ cations introduces vacancies in the oxygen sublattice as charge compensation defects [6]. This allows oxygen ions created on the cathode to hop through the vacancies and reach the anode. In general, the conductivity of an electrolyte strongly depends on the size and concentration of dopant cation [7,8]. Besides these parameters, which are considered as intrinsic properties of material itself, there are parameters which are dependent on preparation route and sintering conditions. For example, density and grain size, which are www.elsevier.com/locate/ceramint 0272-8842/$ - see front matter & 2012 Elsevier Ltd and Techna Group S.r.l. All rights reserved. http://dx.doi.org/10.1016/j.ceramint.2012.10.188 n Corresponding author. E-mail address: [email protected] (D. Bucevac).

Welcome message from author
This document is posted to help you gain knowledge. Please leave a comment to let me know what you think about it! Share it to your friends and learn new things together.
Transcript
CERAMICSINTERNATIONAL
Available online at www.sciencedirect.com
0272-8842/$ - se
http://dx.doi.or
nCorrespond
E-mail addr
Ceramics International 39 (2013) 3603–3611
www.elsevier.com/locate/ceramint
Effect of preparation route on the microstructure and electricalconductivity of co-doped ceria
Dusan Bucevaca,n, Aleksandar Radojkovicb, Miroslav Miljkovicc,Biljana Babica, Branko Matovica
aInstitute of Nuclear Sciences Vinca, University of Belgrade, P.O. Box 522, 11001 Belgrade, SerbiabInstitute for Multidisciplinary Research, University of Belgrade, Kneza Viseslava 1, 11000 Belgrade, Serbia
cCenter of Electron Microscopy, University of Nis, Bulevar Dr Zorana Djindjica 81, 18000 Nis, Serbia
Received 20 August 2012; received in revised form 26 September 2012; accepted 10 October 2012
Available online 23 October 2012
Abstract
Dense Ce0.8Sm0.1Gd0.1O2�d electrolytes were fabricated by sintering of CeO2 solid solutions which were prepared from metal nitrates
and NaOH using self propagating room temperature synthesis (SPRT). Three different routes were employed to obtain CeO2 solid
solution powders: (I) hand mixing of reactants, (II) ball milling of reactants and (III) ball milling of Ce0.8Sm0.2O2�d and Ce0.8Gd0.2O2�d
solid solutions previously prepared by ball milling of corresponding nitrates and NaOH. Density measurements showed that ball
milling, which is more convenient than hand mixing, is an effective way to obtain almost full dense samples after presureless sintering at
1550 1C for 1 h. These samples had larger grain size and consequently higher conductivity than the samples obtained by hand mixing.
The highest conductivity of 2.704� 10�2 (O cm)�1was measured at 700 1C in a sample prepared by route II. It was found that reduced
grain size in samples obtained by hand mixing leads to a decrease in grain boundary conductivity and therefore decrease in the total
conductivity. The results showed that mixing of single doped ceria solid solutions improved densification and inhibited grain growth.
& 2012 Elsevier Ltd and Techna Group S.r.l. All rights reserved.
Keywords: A. Sintering; C. Ionic conduction; Ceria; Microstructure
1. Introduction
Solid oxide fuel cells (SOFCs) are power generationdevices that convert chemical energy of fuels such as H2,CH4 or CO into electrical energy. The conversion normallyinvolves fuel oxidation on anode and oxygen reduction oncathode [1]. In order to obtain an electron flow from theanode to the cathode it is essential that the fuel and oxygenare physically separated. This is accomplished by placing asolid electrolyte between the electrodes which preventsfuel-oxygen contact and at the same time allows transportof oxygen ions from the cathode to the anode. The oxygentransport is necessary for continuous oxygen supply to theanode and therefore continuous operation of SOFCs. Oneof the most successful electrolytes for application inSOFCs is doped ceria (CeO2) which posses relatively high
e front matter & 2012 Elsevier Ltd and Techna Group S.r.l. A
g/10.1016/j.ceramint.2012.10.188
ing author.
ess: [email protected] (D. Bucevac).
oxygen ionic conductivity at intermediate temperatures(500–700 1C) [2,3]. This temperature is considerably lowerthan 900 1C which is the operation temperature of mainlyused SOFCs with yttria-stabilized zirconia (YSZ) electro-lyte [4]. High oxygen ionic conductivity of ceria is ascribedto relatively open cubic fluorite structure which canaccommodate wide range of concentrations of aliovalentcations such as rare earth (Re) cations (Yb3þ , Nd3þ ,Dy3þ , Gd3þ and Sm3þ) [5]. The substitution of Ce4þ
cations by Re3þ cations introduces vacancies in the oxygensublattice as charge compensation defects [6]. This allowsoxygen ions created on the cathode to hop through thevacancies and reach the anode.In general, the conductivity of an electrolyte strongly
depends on the size and concentration of dopant cation[7,8]. Besides these parameters, which are considered asintrinsic properties of material itself, there are parameterswhich are dependent on preparation route and sinteringconditions. For example, density and grain size, which are
ll rights reserved.

D. Bucevac et al. / Ceramics International 39 (2013) 3603–36113604
also reported to control conductivity [9,10], are affectednot only by sintering temperature and time but also byparticle size of starting powder. While the positive effect ofdensity on conductivity is well documented, the clearrelationship between grain size and conductivity has notbeen established. Lenka at al. [11] have found that reducedgrain size improves conductivity at lower temperatures(o650 1C), whereas conductivity at higher temperatureactually decreases with reduction in grain size.
In order to achieve high density at temperature as low aspossible it is essential to synthesize nanosized powders withhigh specific surface and therefore high driving force forsintering. Although there are a plenty of methods that havebeen used to obtain fine powders, self propagating roomtemperature synthesis (SPRT) is one of the most cost andtime effective methods. It is based on the reaction betweenmetal (Me) nitrates and sodium hydroxide (NaOH) aspresented by following equation [12]:
2{(1�x)Ce(NO3)3 � 6H2O}þ{xMe(NO3)3 � 6H2O}þ6NaOHþ (1/2�d)O2-2Ce1�xMexO2�dþ6NaNO3þ15H2O (1)
The advantage of SPRT method is the possibility ofsynthesizing nanopowders at room temperature withoutthe need for subsequent calcinations of the obtainedpowder. Unlike SPRT method, there are synthesis methodssuch as sol–gel [13,14] or combustion syntheses [15,16]which require subsequent calcination of obtained powdersin order to remove the organic components. The calcina-tion step increases production cost and prolongs the timeof synthesis. Furthermore, SPRT synthesis normallyinvolves hand mixing of starting materials in an aluminamortar which is quite inconvenient when it comes to largeramounts of powder [17,18].
The intention of this study is to fabricate samarium(Sm)/gadolinium (Gd) co-doped ceria powder using simpleball milling instead of hand mixing. Sm and Gd dopantswere chosen as there are a number of studies showing thepositive effect of these dopants on electrical conductivity ofceria. Another novelty of this work is related to animprovement of driving force for sintering. It will beshown that almost full dense Sm and Gd co-doped ceriacan be fabricated by pressureless sintering of homogenousmixture of Sm doped ceria and Gd doped ceria powders at1550 1C.
2. Material and methods
2.1. Powder preparation
Starting reactants used in this study were cerium nitratehexahydrate (Ce(NO3)3 � 6H2O), samarium nitrate hexahy-drate (Sm(NO3)3 � 6H2O), gadolinium nitrate hexahydrate(Gd(NO3)3 � 6H2O) and NaOH from Alfa Aesar GmbH,Germany. Amounts of nitrates and NaOH were calculatedaccording to the nominal compositions of solid solutions:
Ce0.8Sm0.1Gd0.1O2�d, Ce0.8Sm0.2O2�d and Ce0.8Gd0.2O2�d. The first batch (I), with composition Ce0.8Sm0.1Gd0.1O2�d, was made by hand mixing of the reac-tants in alumina mortar for�5 min. After an exposure toair for 3 h, the reaction product mixture was rinsed in acentrifuge-Megafuge 1.0, Heraeus, at 3500 rpm to removeNaNO3. This procedure was repeated three times withdistilled water and twice with ethanol. The powder wasdried at 90 oC. The second batch (II) with compositionCe0.8Sm0.1Gd0.1O2�d, was prepared in the same way exceptthat 1-h long milling was done in plastic jar with aluminaballs. The preliminary experiments showed that millingtime of 5 min was too short to provide homogenization ofstarting reactants. For this reason the milling time wasextended to 1 h. Water was used as milling media. Thethird batch (III) was an equimolar mixture of single dopedceria solutions: Ce0.8Sm0.2O2�d and Ce0.8Gd0.2O2�d.Thesingle doped ceria solutions were prepared similarly tobatch II, starting from cerium nitrate, NaOH and corre-sponding nitrate as a source of dopant. Sm(NO3)3 � 6H2Owas used to prepare Sm doped ceria, whereasGd(NO3)3 � 6H2O was used to prepare Gd doped ceria.After rinsing and drying, the two single doped ceriapowders were mixed by ball milling for 1 h in order toobtain overall composition of Ce0.8Sm0.1Gd0.1O2�d. Themixture was dried in order to remove milling media(water). It is important to point out the difference betweenbatches II and III. Although the overall compositions ofboth batches are the same, the distribution of Sm and Gddopants in powder particles is different. Unlike batch IIwhich consists of particles with uniform compositioncontaining both Sm and Gd dopant, batch III is a mixtureof particles containing only Sm and particles containingonly Gd. In order to make sample notation easier, bothobtained powders and sintered samples will be designatedwith I, II, III which refers to the route that was used tosynthesize powder. Quite often an extended notation willbe also used: I (hand mixing of co-doped ceria), II (ball-milling of co-doped ceria) and III (ball milling of singledoped ceria powders).
2.2. Compaction and sintering
Green pellets were prepared by mechanical, uniaxialpressing of obtained powders under 60 MPa. Sintering wasperformed at 1550 1C for 1 h in air. The heating rate was51/min.
2.3. Sample characterization
Density of sintered samples was measured by Archi-medes method. The relative density was given as a ratiobetween the measured density and theoretical densitywhich was calculated applying a rule of mixture. Thespecific surface area of powders was measured byBrunauer–Emmett–Teller (BET) method using N2 absorp-tion at �196 1C. The phase composition of powders as
D. Bucevac et al. / Ceramics International 39 (2013) 3603–3611 3605
well as sintered samples was determined by XRD. Thepowder particle morphology and microstructure of sin-tered samples were examined under scanning electronmicroscopy (SEM). Interception method was used tomeasure grain size of sintered samples. The chemicalcomposition of grains was determined by energy dispersiveX-ray spectroscopy (EDS). Electrical conductivity wasmeasured by impedance spectroscopy method. Platinumpaste was applied on both flat sides of the sintered pelletsand heated up to 700 1C. The measurements were carriedout in temperature range from 250 to 700 1C in air usingHP 4194A equipment under 42 Hz–1 MHz frequency. Theimpedance data were fitted by software Z-View2 (version2.6 demo).
3. Results and discussion
3.1. XRD analysis of powders
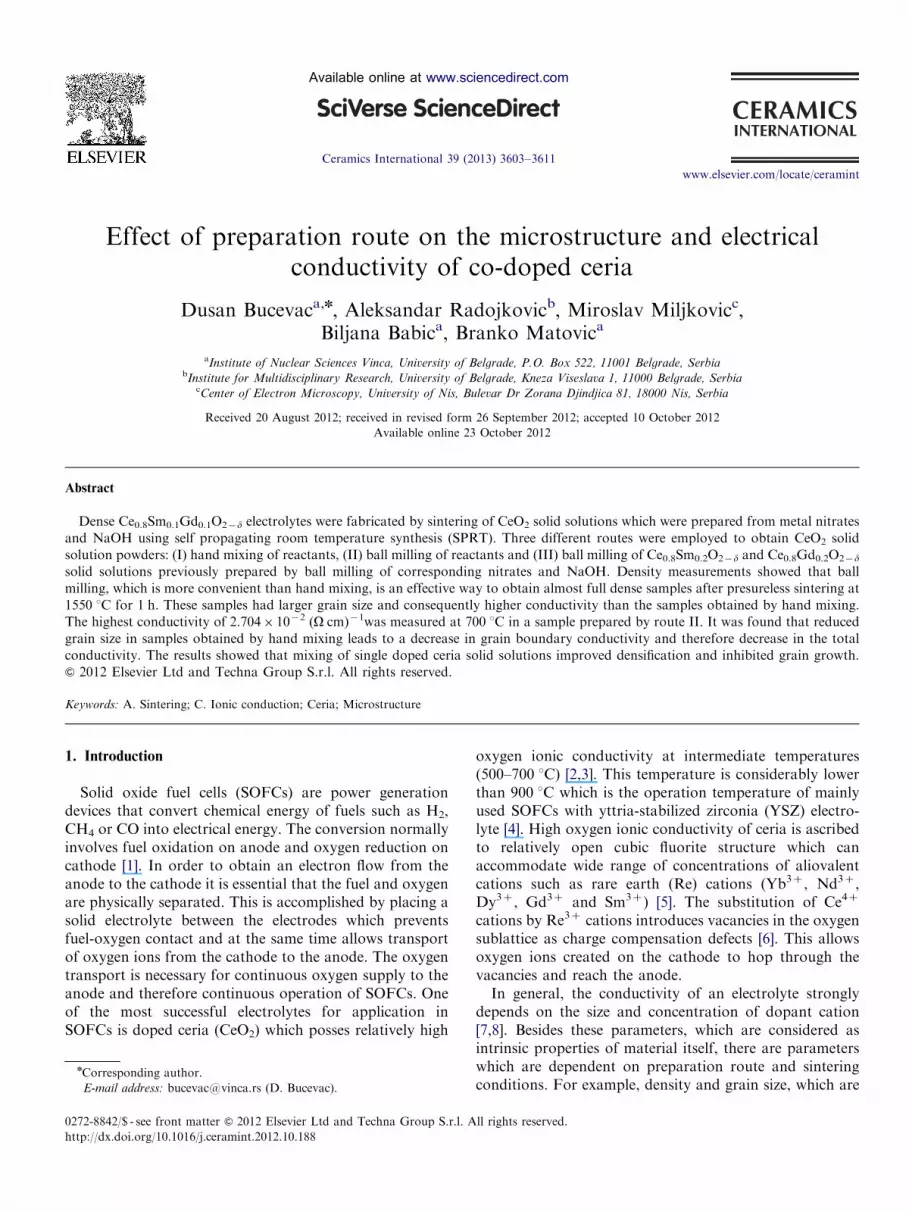
X-ray patterns of powders obtained using the threedifferent routes are presented in Fig. 1. As can be seen,the obtained powders are single phase ceria with fluoritecrystal structure. Considerable broadening of X-ray linesimplies nanometric crystallite size. It is important to stressthat the intensity of diffraction lines of samples obtainedby milling (II and III) is higher than that for samplesobtained by hand mixing (I) which indicates that millingprovides energy sufficiently high to improve diffusion andtherefore promote powder crystallization. The highestdegree of crystallinity was observed for powder III asa result of an additional 1-h long milling of single-dopedceria powders. The calculation of the crystallite sizewas performed on the basis of the full width at halfmaximum intensity (FWHM) of the peak at �28.51
20
311220
200
111
I
II
Inte
nsity
(a.u
.)
III
2Θ (degree)30 40 50 60 70
Fig. 1. X-ray diffraction patterns of powders obtained by hand mixing of
co-doped ceria (I), ball-milling of co-doped ceria (II) and ball milling of
single doped ceria powders (III).
applying Williamson–Hall method [19]. The values forcrystallite size are given in Table 1, which shows that thecrystallite size lies in the range 3–6 nm. The smallest valuewas measured for hand-mixed powder (I) which, again,indicates that milling promotes crystallite growth.
3.2. Specific surface area of powders
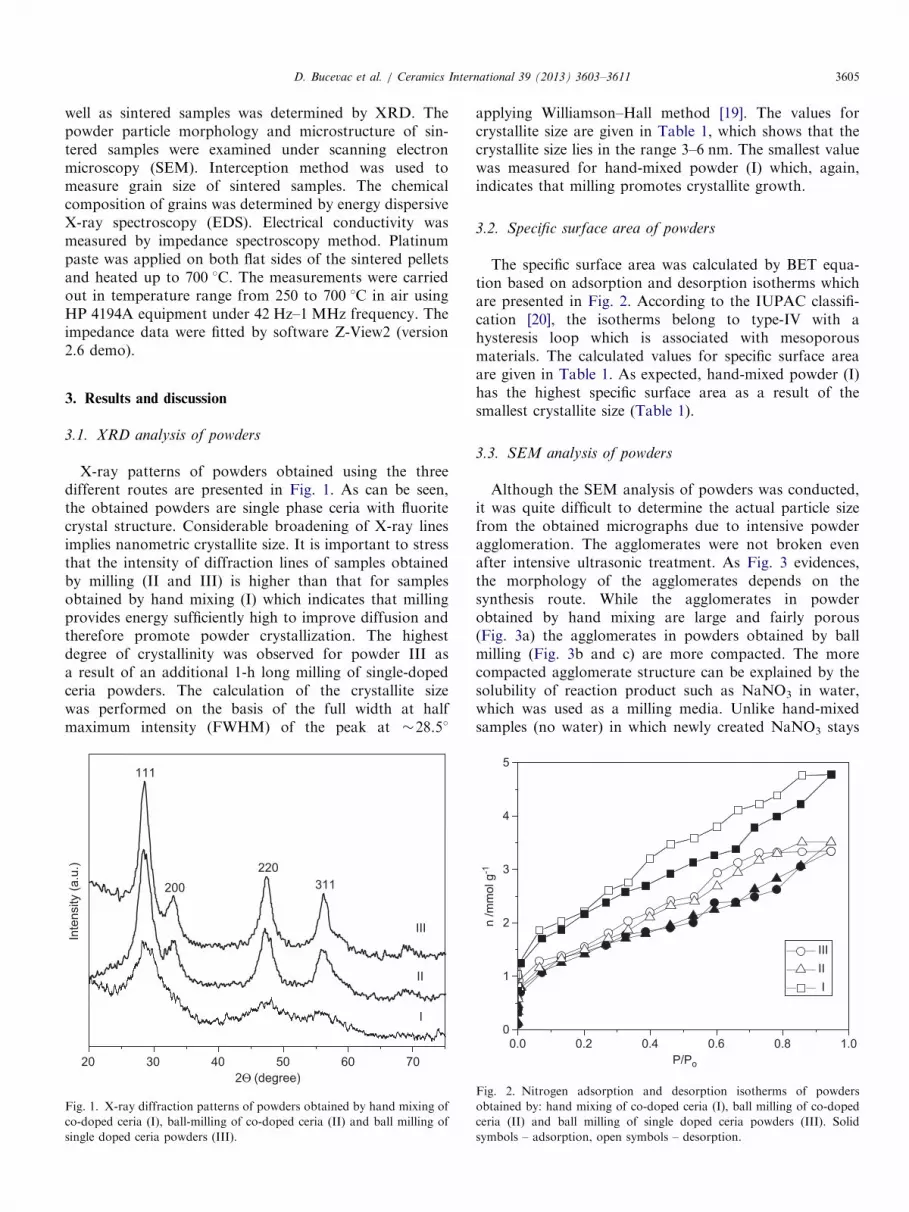
The specific surface area was calculated by BET equa-tion based on adsorption and desorption isotherms whichare presented in Fig. 2. According to the IUPAC classifi-cation [20], the isotherms belong to type-IV with ahysteresis loop which is associated with mesoporousmaterials. The calculated values for specific surface areaare given in Table 1. As expected, hand-mixed powder (I)has the highest specific surface area as a result of thesmallest crystallite size (Table 1).
3.3. SEM analysis of powders
Although the SEM analysis of powders was conducted,it was quite difficult to determine the actual particle sizefrom the obtained micrographs due to intensive powderagglomeration. The agglomerates were not broken evenafter intensive ultrasonic treatment. As Fig. 3 evidences,the morphology of the agglomerates depends on thesynthesis route. While the agglomerates in powderobtained by hand mixing are large and fairly porous(Fig. 3a) the agglomerates in powders obtained by ballmilling (Fig. 3b and c) are more compacted. The morecompacted agglomerate structure can be explained by thesolubility of reaction product such as NaNO3 in water,which was used as a milling media. Unlike hand-mixedsamples (no water) in which newly created NaNO3 stays
0.00
1
2
3
4
5
n /m
mol
g-1
P/Po
IIIII I
0.2 0.4 0.6 0.8 1.0
Fig. 2. Nitrogen adsorption and desorption isotherms of powders
obtained by: hand mixing of co-doped ceria (I), ball milling of co-doped
ceria (II) and ball milling of single doped ceria powders (III). Solid
symbols – adsorption, open symbols – desorption.

Table 1
Crystallite size and specific surface area of powders obtained by: hand
mixing of co-doped ceria (I), ball milling of co-doped ceria (II) and ball
milling of single doped ceria powders (III).
Sample Crystallite
size (nm)
Specific surface
area (m2/g)
I 3.36 144
II 4.36 113
III 5.15 105
Fig. 3. SEM micrographs of powder samples obtained by: (a) hand
mixing of co-doped ceria (I), (b) ball milling of co-doped ceria (II) and (c)
ball milling of single doped ceria powders (III).
D. Bucevac et al. / Ceramics International 39 (2013) 3603–36113606
evenly dispersed between ceria particles, in ball-milledsamples, NaNO3 partially dissolves in water, leaves thespace between ceria particles and allows their agglomera-tion. After drying, the dissolved NaNO3 normally formsNaNO3 rich layer on the top of the powder cake. Highporosity as well as specific surface area of agglomerates inhand-mixed sample can be ascribed to rinsing of fineNaNO3 particles evenly dispersed between ceria particles.
3.4. XRD analysis and density of sintered samples
Fig. 4 shows X-ray patterns of samples sintered at1550 1C for 1 h. As can be seen, all samples are solidsolutions of ceria without any trace of secondary phase.
Densities of powder compacts sintered at 1550 1C for 1 hare given in Table 2. It is quite unexpected that the lowestdensity was measured in sample I which was made ofpowder with the smallest particle size and therefore withthe highest driving force for sintering. It is believed that thelow sintering density of sample I is a result of an unevenstress distribution within the green compact. The presenceof relatively large, porous, agglomerates in the startingpowder obtained by hand mixing simply does not allow aneven compaction of the powder resulting in inhomoge-neous density of the green samples as well as the sinteredsamples. Fig. 5 shows high density area surrounded byporous area. Normally, these dense areas contain fairlylarge cracks which might be formed owing to the presenceof tensile stress in the dense areas. The stress is created dueto larger shrinkage of dense areas than that of thesurrounding, porous, areas. It can be inferred from theabove results that the decrease in particle size of powderdoes not necessarily lead to improved densification.
Another important finding is related to the density ofsamples obtained by sintering of powders prepared by ballmilling (II and III). As Table 2 shows, the density ofsample III, which is obtained by sintering of mixture ofsingle doped ceria powders, is higher than that of sampleII, which is obtained by sintering of co-doped ceria. Itappears that the different composition of powder particlesin sample III can enhance mass transport during sinteringand thus improve density to above 99%TD. As mentioned,powder III is a mixture of particles containing Sm andparticles containing Gd, whereas powder II consists ofparticles containing both Sm and Gd dopant. Although
the chemical composition of particles in powders II and IIIis not the same, EDS analysis reveals that the chemicalcomposition of grains in sintered samples II and III is the

20
331400222
311220
200
111
III
II
Inte
nsity
(a.u
)
I
30 40 50 60 70 802Θ (degree)
Fig. 4. X-ray patterns of samples sintered at 1550 1C for 1 h. The samples
were obtained by sintering of powder prepared by hand mixing of
co-doped ceria (I), ball milling of co-doped ceria (II) and ball milling of
single doped ceria powders (III).
Table 2
Density and grain size of samples obtained by sintering of powders
prepared by: hand mixing of co-doped ceria (I), ball milling of co-doped
ceria (II) and ball milling of single doped ceria powders (III).
Sample Density (%TD) Grain size (mm)
I 95.3 1.270.1
II 98.5 2.170.2
III 99.2 1.970.2
Fig. 5. Dense region surrounded by porous area in sample I (hand mixing
of co-doped ceria) sintered at 1550 1C for 1 h.
D. Bucevac et al. / Ceramics International 39 (2013) 3603–3611 3607
same (Fig. 6). This indicates that Sm and Gd diffusebetween Sm doped ceria and Gd doped ceria particlesduring sintering of sample III. The result of this diffusion
is a uniform distribution of dopants over the volume ofsintered sample III. Finally, it would be very important tostress that such high density of samples II and III wasachieved without cold isostatic pressing (CIP) which isnormally used to further improve green density ofmechanically pressed pellets. A direct benefit of elimina-tion of CIP is the fabrication cost reduction.
3.5. SEM analysis of sintered samples
Microstructures of sintered samples are presented inFig. 7. Fig. 7b and c shows that samples II and III arequite similar regarding porosity and grain size. The figuresreveal that both samples have low porosity (high density)and similar grain size. Results of careful measurement ofgrain size are listed in Table 2. The results evidence that thegrain size of sample III is slightly smaller than that ofsample II, which was measured to be about 2.1 mm.Furthermore, Fig. 7a reveals that the porosity of sampleI is higher than that of samples II and III, whereas thegrain size of sample I is considerably smaller (1.2 mm) thanthat of samples II and III. Although the mechanicalproperties of ceria electrolyte are not the object of thisstudy it is believed that samples II and III might havebetter mechanical properties than sample I despite coarsermicrostructure. It is well known that strength, which isconsidered as the most important mechanical property, isaffected by both grain size and porosity [21]. The effect ofgrain size is especially pronounced in an anisotropicmaterial in which an increase in grain size is normallyfollowed by a decrease in strength due to residual stresses.However, bearing in mind that ceria is isotropic material(due to cubic crystal structure) it is quite possible thatstrength is controlled by porosity rather than by grain size.Therefore, samples II and III which have higher densitythan sample I are expected to have higher strength despitethe fact that grain size is larger. In addition, when it comesto comparison of samples II and III it is evident thatsample III will have higher strength since density is higherand grain size is somewhat smaller than that in sample II.Careful observation of microstructures of samples II andIII reveals that the largest grain in sample III was below5 mm, whereas grains with diameter of more than 7 mmwere observed in sample II.It can be summarized that samples obtained by sintering
of powder prepared by ball milling (II and III) have higherdensity but larger grain size than samples obtained bysintering of powder prepared by hand mixing (I). When itcomes to samples obtained by sintering of powder pre-pared by ball milling (II and III) it appears that sinteringof mixture of single doped ceria powders (III) givessamples with higher density and smaller grain size thansintering of normally used, co-doped, ceria powder (II).Now, when high density is achieved, it would be of
interest to study ionic conductivity of these samples.

0
1000
2000
3000
3
Inte
nsity
(a.u
.)
Energy (keV)
Ce
Ce
SmGd
Gd
SampleII
0
1000
2000
3000
Inte
nsity
(a.u
.)
Ce
Ce
SmGd
Gd
SampleIII
4 5 6 7 8 9 3Energy (keV)
4 5 6 7 8 9
Fig. 6. EDS spectra of samples sintered at 1550 1C for 1 h. The samples were obtained by sintering of powder prepared by (a) ball milling of co-doped
ceria (II) and (b) ball milling of single doped ceria powders (III). The spectra were recorded in the middle of grains.
D. Bucevac et al. / Ceramics International 39 (2013) 3603–36113608
3.6. Conductivity
The impedance spectra measured at 300 and 600 1C arepresented in Fig. 8. The horizontal axis refers to the realresistance, whereas the vertical axis refers to the imaginaryresistance. The spectra were interpreted using the equiva-lent electrical circuits. The impedance spectra measured at300 1C were well simulated by the equivalent circuitconsisting of a series of one resistance (R), two parallelcircuits of resistance and capacitance (C) and Warburgimpedance (W) (Fig. 8a). The incomplete semicircle in thehigh frequency range is normally attributed to the migra-tion of oxygen ions in the bulk, i.e., bulk resistivity. Veryoften it is simulated by parallel connected resistance (R1)and capacitor (C1). However, in this study, a good matchbetween the measured spectra and the spectra of proposedcircuit was obtained by adding another resistance (R2). Itwas found that careful variation of R2 changes the shapeof the high frequency semicircle and therefore bulkresistivity which may be roughly determined from the rightintercept of the semicircle and horizontal axis (real resis-tance). Although it is quite difficult to determine thephenomenon to which R2 element corresponds it isbelieved that R2 is related to the pore presence. Thisreasoning was supported by the impedance spectra given inFig. 8a showing that the high frequency semicircle ofsample I (sample with the highest porosity) is slightly widerthan those of samples II and III indicating that the bulkresistance of sample I is also slightly higher than that ofsamples II and III. Unlike the high frequency semicirclewhich appears only partially in the limited frequency rangeof equipment (r1 MHz), the middle range frequencysemicircle is complete. In this case the parallel connectedresistance (R3) and capacitor (C2) are used to model theexperimental data. The middle range frequency semicirclecorresponds to the migration of oxygen ions across thegrain boundary and very often is used to determine boththe grain bulk resistance and the grain boundary resis-tance. The left intercept of grain boundary semicircle and
the horizontal axis represents the bulk resistivity, whereasthe distance between the left and the right interceptrepresents the grain boundary resistivity. As Fig. 8aindicates the grain boundary resistivity of sample I isconsiderably higher than those of samples II and III. Theincreased grain boundary resistivity is considered to be theresult of small grain size and thus increased fraction ofgrain boundaries. Therefore the total resistivity from thebulk and grain boundary is the highest for sample I.Finally, the origin of the low frequency semicircle was
simulated by Warburg impedance (W1), which corre-sponds to the sample/electrode interfacial impedance. Thisimpedance is associated with formation of oxygen ions atthe interface through reaction: O2þ4e
�-2O2�.The impedance spectra measured at 600 1C are presented
in Fig. 8b. At such high temperature the semicircles areshifted to the frequencies higher than 1 MHz, which areout of the range of equipment. Therefore the totalresistivity from the bulk and grain boundary is measuredbased on the intercept of electrode semicircle and thehorizontal axis. As expected, the total resistivity of sampleI is higher than that of samples II and III. Again, thesmaller grain size and higher porosity of sample I areconsidered to be the reason for higher total resistance ofsample I at 600 1C. Furthermore, Dusastre et al. [22]proposed another way to verify that the semicircles whichappear in the impedance spectra are associated with thegrain bulk and grain boundary resistance. This evaluationis based on the capacitance (C0) which can be obtained foreach semicircle using following equation:
C0 ¼1
2pfR0ð2Þ
Whereeis the frequency at the semicircle maximum and R’is the resistance (ZRe) at the semicircle maximum. Theyhave found that the values of C0 for grain boundaryresponse were typically from 7 to 25 nF, whereas thecapacitance values for grain bulk were from 30 to 60 pF.In this study, the values of C0 for the middle range

Fig. 7. SEM micrographs of polished and etched surface of samples
sintered at 1550 1C for 1 h. The samples were obtained by sintering of
powders prepared by (a) hand mixing of co-doped ceria (I), (b) ball
milling of co-doped ceria (II) and (c) ball milling of single-doped ceria
powders (III). The surface of samples contains impurities which fell of the
wall of the tube furnace during thermal etching.
400
40
80
120
160
200
240
42 Hz
III II I
-ZIm
(kΩ
cm)
300°C
1 MHz
4000
100
200
300
400
500
-ZIm
(Ω c
m)
III
II
I
600°C
42 Hz
ZRe (kΩcm)
ZRe (Ω cm)
80 120 160 200 240
500 600 700 800 900
Fig. 8. Complex impedance spectra of samples obtained by sintering of
powder prepared by hand mixing of co-doped ceria (I), ball milling of
co-doped ceria (II) and ball milling of single doped ceria powders (III)
measured at (a) 300 1C and (b) 600 1C. The inserted diagram in Fig. 8a
presents the fitted spectra of corresponding equivalent circuit.
D. Bucevac et al. / Ceramics International 39 (2013) 3603–3611 3609
frequency semicircle for samples I, II and III (Fig. 8a) arecalculated to be 0.3, 1.3 and 1.9 nF, respectively. Thecalculated values of C0 are very close to the expected valuesfor grain boundary response which confirms that themiddle range frequency semicircle in the impedance spectrameasured at 300 1C is associated with the grain boundaryresistance.
The measured values of total resistivity were used tocalculate the total conductivity in temperature range 250–700 1C.
Fig. 9. presents the change of total conductivity withtemperature in the form of Arrhenius plots. The graphs
were plotted based on Nernst–Einstein equation [23]
ln sT ¼ lnso�Ea
RTð3Þ
where s is the total conductivity, T is the temperature, so isthe constant associated with the frequency factor ofmigration of oxide ions, Ea is the activation energy ofmigration of oxide ions and R is the gas constant. Thefigure shows that the coarse-grained samples II and IIIhave higher conductivity than the fine-grained sample I.However, it is quite difficult to distinguish the effect ofgrain size on conductivity from the effect of porosity.Bearing in mind that the density of sample I is lowerthan that of samples II and III it is expected that theporosity present in sample I decreases its conductivity.This is also supported by the study conducted by Jo et al.[9], which showed that porosity can considerably reduce

1,0x10⁻³ 1,2x10⁻³ 1,4x10⁻³ 1,6x10⁻³ 1,8x10⁻³ 2,0x10⁻³-8
-6
-4
-2
0
2
4
ln (σ
Τ) (S
cm-1
K)
I II III
1/T (K-1)
Fig. 9. Arrhenius plots of total conductivity of samples sintered at
1550 1C for 1 h. The samples were obtained by sintering of powder
prepared by: hand mixing of co-doped ceria (I), ball milling of co-doped
ceria (II) and ball milling of single doped ceria powders (III).
D. Bucevac et al. / Ceramics International 39 (2013) 3603–36113610
the conductivity of fine-grained ceria. When it comes to thedense samples II and III it can be seen that the conductiv-ity of sample II is somewhat higher than that of sample III,which has slightly smaller average grain size than sampleII. It appears that in this system, an increase in grain sizeleads to an increase in the total conductivity due toreduction in grain boundary fraction and consequentincrease in the grain boundary conductivity. The activationenergy of migration of oxide ions, Ea, was calculated basedon the slope of linear fit of conductivity values given inFig. 9. The results show that the highest Ea of 87.9 kJ/molwas calculated for sample I, whereas the lowest Ea of86.1 kJ/mol was calculated for sample II. Very smalldifference in activation energy of different samples sug-gests that pre-exponential factor so (Eq. 3), which isassociated with the frequency factor of migration of oxideions, might be responsible for the lower conductivity ofsample I. According to Eq. 3, the decrease in pre-exponential factor so results in the decrease in ionicconductivity. It is quite expected that the frequency factorof migration of oxide ions in porous sample I is smallerthan that of dense samples II and III. The considerableporosity present in sample I simply reduces the actual crosssection area available for the oxide ion migration.
4. Conclusions
Ball milling is an effective way to fabricate dense samples ofco-doped ceria, (Ce0.8Sm0.1Gd0.1O2�d) using SPRT method.The samples obtained by ball milling had higher density, largergrains size and higher conductivity than samples obtained byhand mixing. Even higher density can be achieved by sinteringthe mixture of single-doped ceria powders (Ce0.8Sm0.2O2�d
and Ce0.8Gd0.2O2�d). It appears that uneven distribution ofdopants improves densification and slightly inhibits graingrowth. It was found that in system such this, the electricalconductivity increases with an increase in grain size.
Acknowledgments
This work has been supported by the Ministry ofEducation and Science of Serbia (project number: 45012).
References
[1] B.C. Steele, A. Heinzel, Materials for fuel-cell technologies, Nature
414 (2001) 345–352.
[2] S. Kuharuangrong, Ionic conductivity of Sm, Gd, Dy and Er-doped
ceria, Journal of Power Sources 171 (2007) 506–510.
[3] X. Sha, Z. Lu, X. Huang, J. Miao, Z. Ding, X. Xin, W. Su, Study on
La and Y co-doped ceria-based electrolyte materials, Journal of
Alloys and Compounds 428 (2007) 59–64.
[4] J.X. Zhu, D.F. Zhou, S.R. Guo, J.F. Ye, X.F. Hao, X.Q. Cao,
J. Meng, Grain boundary conductivity of high purity neodymium-
doped ceria nanosystem with and without the doping of molybdenum
oxide, Journal of Power Sources 174 (2007) 114–123.
[5] H. Inaba, H. Tagawa, Ceria-based solid electrolytes, Solid State
Ionics 83 (1996) 1–16.
[6] R.K. Lenka, T. Mahata, A.K. Tyagi, P.K. Sinha, Influence of grain
size on the bulk and grain boundary conductivity behaviour in
gadolinia-doped ceria, Solid State Ionics 181 (2010) 262–267.
[7] T. Mori, J. Drennan, J.H. Lee, J.G. Li, T. Ikegami, Oxide ionic
conductivity and microstructures of Sm- or La-doped CeO2-based
systems, Solid State Ionics 154-155 (2002) 461–466.
[8] H.J. Avila-Paredes, K. Choi, C.T. Chen, S. Kim, Dopant-
concentration dependence of grain-boundary conductivity in ceria:
A space-charge analysis, Journal of Materials Chemistry 19 (2009)
4837–4842.
[9] S.H. Jo, P. Muralidharan, D.K. Kim, Electrical characterization of
dense and porous nanocrystalline Gd-doped ceria electrolytes, Solid
State Ionics 178 (2008) 1990–1997.
[10] D.S. Kim, P.S. Cho, J.H. Lee, D.Y. Kim, S.B. Lee, Improvement of
grain-boundary conduction in gadolinia-doped ceria via post-
sintering heat treatment, Solid State Ionics 177 (2006) 2125–2128.
[11] R.K. Lenka, T. Mahata, A.K. Tyagi, P.K. Sinha, Influence of grain
size on the bulk and grain boundary ion conduction behavior in
gadolinia-doped ceria, Solid State Ionics 181 (2010) 262–267.
[12] S. Boskovic, D. Djurovic, Z. Dohcevic-Mitrovic, Z. Popovic,
M. Zinkevich, F. Aldinger, Self-propagating room temperature
synthesis of nanopowders for solid oxide fuel cells, Journal of Power
Sources 145 (2005) 237–242.
[13] C.D.E. Lakeman, D.A. Payne, Sol-gel processing of electrical and
magnetic ceramics, Materials Chemistry and Physics 38 (1994)
305–324.
[14] L.C. Klein, Sol–gel processing of ionic conductors, Solid State Ionics
32–33 (1989) 639–645.
[15] T. Mahata, G. Das, R.K. Mishra, D.P. Sharma, Combustion
synthesis of gadolinia doped ceria powder, Journal of Alloys and
Compounds 391 (1-2) (2005) 129–135.
[16] B. Matovic, D. Bucevac, N. Jiraborvornpongsa, K. Yoshida,
T. Yano, Synthesis and characterization of nanometric strontium-
doped ceria solid solutions via glycine-nitrate procedure, Journal of
the Ceramic Society of Japan 120 (2) (2012) 69–73.
[17] B. Matovic, Z. Dohcevic-Mitrovic, M. Radovic, Z. Brankovic,
G. Brankovic, S. Boskovic, Z.V. Popovic, Synthesis and character-
ization of ceria based nanometric powders, Journal of Power Sources
193 (1) (2009) 146–149.
[18] X. Yu, F. Li, X. Ye, X. Xin, Z. Xue, Synthesis of cerium(IV) oxide
ultrafine particles by solid-state reactions, Journal of the American
Ceramic Society 83 (4) (2000) 964–966.
[19] B. Lonnberg, Characterization of milled Si3N4 powder using X-ray
peak broadening and surface area analysis, Journal of Materials
Science 29 (12) (1994) 3224–3230.
[20] K.S.W. Sing, D.H. Everett, R.A.W. Haul, L. Moscou, R.A. Pierotti,
J. Rouquerol, T. Siemieniewska, Reporting physisorption data for

D. Bucevac et al. / Ceramics International 39 (2013) 3603–3611 3611
gas/solid systems with special reference to the determination of surface
area and porosity, Pure and Applied Chemistry 57 (1985) 603–619.
[21] V.D. Krstic, Effect of microstructure on fracture of brittle materials:
unified approach, Theoretical and Applied Fracture Mechanics
45 (2006) 212–226.
[22] V. Dusastre, J.A. Kilner, Optimisation of composite cathodes
for intermediate temperature SOFC applications, Solid State Ionics
126 (1999) 163–174.
[23] P.G. Shewnon, Diffusion in Solids, New York, McGrew-Hill Book
Company, 1963 286-287.
Related Documents


![The prevalence of surface oxygen vacancies over the ...Nanocubes Nanostructures Crystal size Morphology Toluene Surface oxygen vacancies ... ity in zirconium-doped ceria [15]. However,](https://static.cupdf.com/doc/110x72/5f1ea2eb43495322d6612a8a/the-prevalence-of-surface-oxygen-vacancies-over-the-nanocubes-nanostructures.jpg)