Effect of pH on the formation of disinfection byproducts in swimming pool water – Is less THM better? Kamilla M. S. Hansen 1 , Sarah Willach 1,2 , Maria G. Antoniou 1,3 , Hans Mosbæk 1 , Hans-Jørgen Albrechtsen 1 and Henrik R. Andersen 1, *. 1 Department of Environmental Engineering, Technical University of Denmark (DTU), Miljoevej, Building 113, 2800 Kgs. Lyngby, Denmark 2 Department of Chemistry, University of Duisburg – Essen, Germany 3 Department of Environmental Science and Technology, Cyprus University of Technology, PO Box: 50329, 3603 Lemesos, Cyprus * Corresponding authors e-mail: [email protected] Article published in Water Research, 46(19), pp. 6399-6409. http://dx.doi.org/10.1016/j.watres.2012.09.008

Welcome message from author
This document is posted to help you gain knowledge. Please leave a comment to let me know what you think about it! Share it to your friends and learn new things together.
Transcript
Effect of pH on the formation of disinfection
byproducts in swimming pool water
– Is less THM better?
Kamilla M. S. Hansen1, Sarah Willach1,2
, Maria G. Antoniou1,3, Hans
Mosbæk1, Hans-Jørgen Albrechtsen1 and Henrik R. Andersen1,*.
1Department of Environmental Engineering, Technical University of Denmark (DTU),
Miljoevej, Building 113, 2800 Kgs. Lyngby, Denmark
2Department of Chemistry, University of Duisburg – Essen, Germany
3Department of Environmental Science and Technology, Cyprus University of
Technology, PO Box: 50329, 3603 Lemesos, Cyprus
*Corresponding authors e-mail: [email protected]
Article published in Water Research, 46(19), pp. 6399-6409. http://dx.doi.org/10.1016/j.watres.2012.09.008

Hansen et al., 2012. Water Research, 46(19), pp. 6399-6409 http://dx.doi.org/10.1016/j.watres.2012.09.008
2
Abstract This study investigated the formation and predicted toxicity of different groups of disinfection byproducts (DBPs) from human exudates in relation to chlorination of pool water at different pH values. Specifically, the formation of the DBP groups trihalomethanes (THMs), haloacetic acids (HAAs), haloacetonitriles (HANs) and trichloramine (NCl3), resulting from the chlorination of body fluid analog, were investigated at 6.0 ≤ pH ≤ 8.0. Either the initial concentration of active chorine or free chlorine was kept constant in the tested pH range. THM formation was reduced by decreasing pH but HAN, and NCl3 formation increased at decreasing pH whereas the formation of HAAs remained constant. Under our experimental conditions, the formation of NCl3 (suspected asthma inducing compound) at pH = 6.0 was an order of magnitude higher than at pH = 7.5. Furthermore, the effect of the presence of bromide on DBP formation was investigated and found to follow the same pH dependency as without bromide present, with the overall DBP formation increasing, except for HAAs. Estimation of genotoxicity and cytotoxicity of the chlorinated human exudates showed that among the quantified DBP groups, HAN formation were responsible for the majority of the toxicity from the measured DBPs in both absence and presence of bromide. Keywords: pH; swimming pool; trihalomethane; haloacetonitrile; toxicity
1 Introduction
Swimming pools are used around the world for recreational, rehabilitation purposes and physical activity and therefore it is imperative that the water and air quality are maintained at safe levels to protect the health of bathers. Chlorination is the most frequently applied method for controlling pool water quality and preventing spreading of pathogenic diseases among bathers because of its residual disinfection effect. Chlorine exhibits a pH and temperature dependent-equilibrium between the hypochlorous acid (HOCl) and the hypochlorite ion (OCl-
), with the sum of the two commonly known as free chlorine (White, 1992). At 25°C and pH = 7.54 both species are found in equal concentrations (pKa25°C = 7.537; (Morris, 1966)), but the concentration of HOCl is reduced to 35.3% of the added chlorine at pH25°C =7.8 and to17.8% at pH25°C =8.2. HOCl is the main active specie responsible for the disinfection effect of chlorine. Therefore it is crucial to closely monitor and control pool water pH to ensure disinfection effectiveness (White, 1992). Cl2(aq) is also in equilibrium with HOCl, but the proportion of chlorine that is found in this form is very low in the pH-range used in swimming pools. E.g. in a swimming pool at pH 7.0 only 0,0017% of the total chlorine is found as Cl2(aq) (20 °C, 2.5 g/L Cl-, White, 1992). In addition to potential contamination from pathogenic microorganisms, swimming pool water is polluted by organic matter deposited from the bathers such as saliva, urine and sweat, hair, moisturizing lotions and sunscreens, also known as bather load (Judd and Bullock, 2003; Zwiener et al., 2007). Since chlorine is a strong oxidant it oxidizes the natural organic matter (NOM) found in the source water and the organic material deposited by the bathers. A part of
Hansen et al., 2012. Water Research, 46(19), pp. 6399-6409 http://dx.doi.org/10.1016/j.watres.2012.09.008
3
the organic material is mineralized (Judd and Bullock, 2003) while the rest form chlorinated organic compounds commonly known as disinfection by-products (DBPs). Overall it appears that all the organic bather load is eventually either mineralized or evaporates (Judd and Bullock, 2003). Currently, more than 600 different DBPs have been detected in chlorinated drinking water (Richardson, 2011) but the identified compounds only comprise approximately 30 – 50 % of the total organic halogens (Krasner et al., 2006; Richardson et al., 2007). In pool water approximately 50% of the total organic halogens are comprised by four groups of DBPs: Trihalomethane (THM), haloacetic acids (HAAs), haloacetonitriles (HANs), and chloral hydrate (Brunet et al., 2010). THMs were the first carbon based DBP group to be detected in chlorinated drinking water (Bellar et al., 1974; Rook, 1974) and linked to NOM for their formation. Other DBP groups include HAAs (Cowman and Singer, 1996; Heller-Grossman et al., 1993), HANs (Oliver, 1983), halonitromethanes (Thibaud et al., 1987), and haloketones (Suffet et al., 1976) have later been detected in chlorinated drinking water. These organic DBPs have been identified in swimming pool water as well (Richardson et al., 2010) together with inorganic nitrogenous DBPs like trichloramine (NCl3) (Hery et al., 1995). The major concern regarding DBP formation is their effects to human health because some exhibit carcinogenic behavior (Richardson et al., 2007) while others are suspected to cause asthma (Goodman and Hays, 2008; Thickett et al., 2002), and irritations to the eyes and mucous membrane (Chiswell and Wildsoet, 1989; Erdinger et al., 1998). If bromide ions are present in the water, they are oxidized by chlorine to hypobromous acid (HOBr), which can form brominated DBPs that are generally more toxic than their equivalent chlorinated DBPs (Muellner et al., 2007; Plewa et al., 2002; Plewa et al., 2008). Regulations on levels of DBPs in swimming pools have so far only focused on THMs and combined chlorine (chloroamines), which are easily analyzed. However, recently other chlorinated DBPs such as cyanogen halides, HAAs and HANs (Glauner et al., 2005; Zwiener et al., 2007) has been shown to be far more dangerous for human health since they are directly linked to cancer risk and are generally more toxic than the regulated DBPs. The cyto- and genotoxic potency of HANs is higher than for HAAs which is higher than for THMs (Plewa et al., 2008). Recently two HANs, dibromoacetonitrile and bromochloroacetonitrile, were found to be the main contributors to the overall toxicity of pool water (Kramer et al., 2009). In addition, a study of seven public swimming pools with different disinfection and water treatment practices, measured higher genotoxic potency of the pool water compared to the supply water (Liviac et al., 2010). One approach to limit the formation of some DBPs is to reduce the chlorine concentration and the pH value, so that the HOCl concentration, and thus the disinfection efficiency, remains constant because HOCl is a stronger disinfectant than OCl-. The validity of this assumption is supported by a Danish full scale study on a public indoor pool, where the DBP formation at 0.4 mg chlorine/L and pH = 6.7, were compared to 1.5 mg/L of chlorine at pH = 7.3. The study reported a decrease in THMs, absorbable organic halogen (AOX) and combined chlorine while microbiological quality was maintained at the lower pH (Kristensen et al., 2007). Based on that study it has been suggested to change the Danish regulations for swimming pools and lower the limit for pH from 7.0 to 6.8, while it has been

Hansen et al., 2012. Water Research, 46(19), pp. 6399-6409 http://dx.doi.org/10.1016/j.watres.2012.09.008
4
suggested to depress the value of pH even lower, at pH = 6.0. Though this may reduce the formation of THM, AOX and combined chlorine it has not been considered how lowering pool pH would influence the non-regulated but more harmful DBPs groups. Studies on drinking water chlorination at pH <7 reported decrease in THMs concentration while HAA formation increases or decreases depending on the source water (Bougeard et al., 2008; Liang and Singer, 2003). A recent study with particles of anthropogenic origin found that THM and HAA formations were reduced by decreasing pH while HAN formation increased with decreasing pH (Hansen et al., 2012). Though formation of DBPs has been recognized as a problem in swimming pool water for the past forty years, there are yet limited studies on their formation especially from anthropogenic precursors. Therefore studies of drinking water chlorination cannot be utilized to optimize the treatment conditions of swimming pool water. This study aimed to investigate how variations of the pH level affect the formation of THMs, HAAs, HANs, trichloramine (NCl3), trichloronitromethane, dichloropropanone, and trichloropropanone (see Table 1 for the complete list) from an analog of human exudates named body fluid analog (BFA; (Judd and Bullock, 2003)) under controlled chlorination conditions. All the experiments were conducted as batch experiments with BFA in freshly made reversed osmosis water. First the effect of chlorine dose on the DBP formation was investigated in order to select experimental conditions for the DBP formation test. Then the effect of pH was examined with respect to the chlorine added either as initial constant free chlorine concentration (HOCl + OCl-) or as initial constant active chlorine (HOCl) at pH 6.0, 6.5, 7.0, 7.5 or 8.0. This was done in order to investigate the difference between changes in the pH value with and without changing the active chlorine level. The two chlorination approaches were chosen since in the experiment with constant active chlorine concentration the disinfection ability of chlorine was kept constant. Bromide was also added to record its effect on the formation of DBPs and solution toxicity. Finally, the toxic potency of each compound was used to estimate the overall genotoxicity and cytotoxicity of the treated water at the different pH levels.
2 Materials and methods
2.1 Reagents
All chemicals and standard solutions were purchased from Sigma-Aldrich.
2.2 Analysis of THMs and HANs
Free chlorine in THM and HAN samples was quenched by adding ammonium chloride (APHA, 2005; Munch and Hautman, 1995) to 40 mL borosilicate glass vials before they were filled head-space-free with the sample. The samples were analyzed the same day by Purge and Trap (Velocity XPT Purge and Trap Sample Concentrator, Teledyne Tekmar, with autosampler AQUATek 70, Teledyne Tekmar) coupled with a GC-MS (HP 6890 Series GC System - 5973 Mass selective detector, Hewlett Packard). This method was also used for the
Hansen et al., 2012. Water Research, 46(19), pp. 6399-6409 http://dx.doi.org/10.1016/j.watres.2012.09.008
5
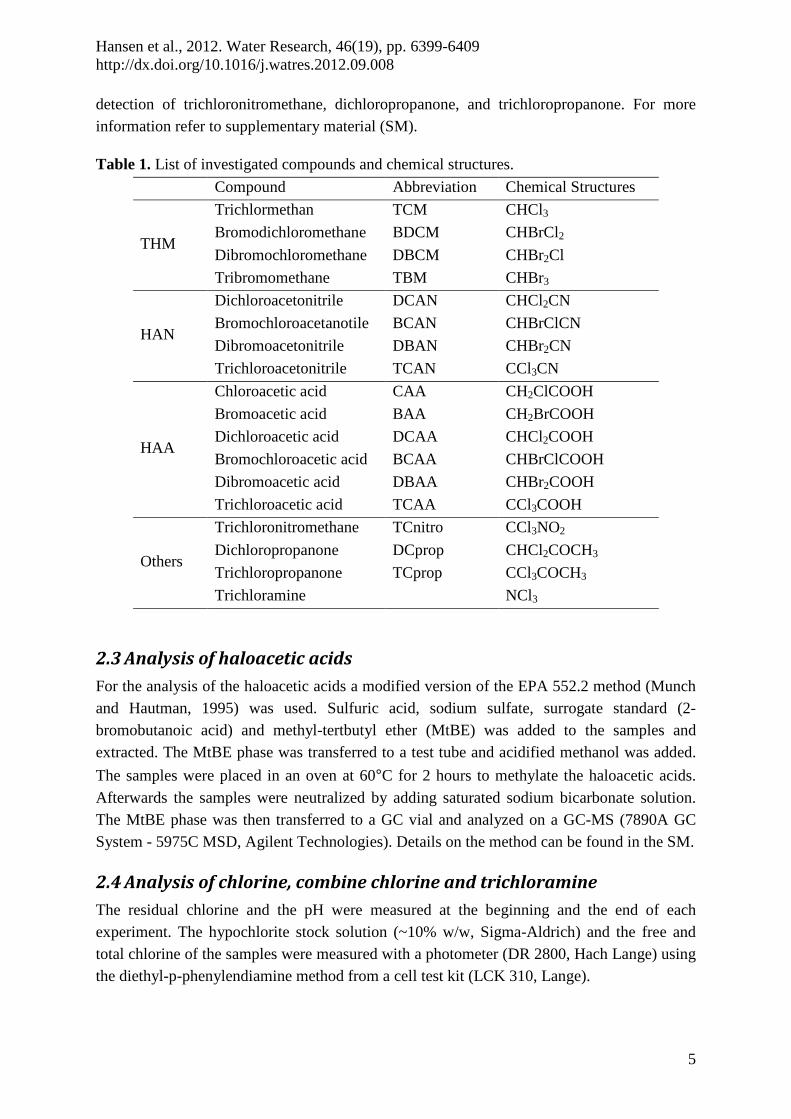
detection of trichloronitromethane, dichloropropanone, and trichloropropanone. For more information refer to supplementary material (SM).
Table 1. List of investigated compounds and chemical structures.
Compound Abbreviation Chemical Structures
THM
Trichlormethan TCM CHCl3
Bromodichloromethane BDCM CHBrCl2
Dibromochloromethane DBCM CHBr2Cl
Tribromomethane TBM CHBr3
HAN
Dichloroacetonitrile DCAN CHCl2CN
Bromochloroacetanotile BCAN CHBrClCN
Dibromoacetonitrile DBAN CHBr2CN
Trichloroacetonitrile TCAN CCl3CN
HAA
Chloroacetic acid CAA CH2ClCOOH
Bromoacetic acid BAA CH2BrCOOH
Dichloroacetic acid DCAA CHCl2COOH
Bromochloroacetic acid BCAA CHBrClCOOH
Dibromoacetic acid DBAA CHBr2COOH
Trichloroacetic acid TCAA CCl3COOH
Others
Trichloronitromethane TCnitro CCl3NO2
Dichloropropanone DCprop CHCl2COCH3
Trichloropropanone TCprop CCl3COCH3
Trichloramine NCl3
2.3 Analysis of haloacetic acids
For the analysis of the haloacetic acids a modified version of the EPA 552.2 method (Munch and Hautman, 1995) was used. Sulfuric acid, sodium sulfate, surrogate standard (2-bromobutanoic acid) and methyl-tertbutyl ether (MtBE) was added to the samples and extracted. The MtBE phase was transferred to a test tube and acidified methanol was added.
The samples were placed in an oven at 60°C for 2 hours to methylate the haloacetic acids. Afterwards the samples were neutralized by adding saturated sodium bicarbonate solution. The MtBE phase was then transferred to a GC vial and analyzed on a GC-MS (7890A GC System - 5975C MSD, Agilent Technologies). Details on the method can be found in the SM.
2.4 Analysis of chlorine, combine chlorine and trichloramine
The residual chlorine and the pH were measured at the beginning and the end of each experiment. The hypochlorite stock solution (~10% w/w, Sigma-Aldrich) and the free and total chlorine of the samples were measured with a photometer (DR 2800, Hach Lange) using the diethyl-p-phenylendiamine method from a cell test kit (LCK 310, Lange).
Hansen et al., 2012. Water Research, 46(19), pp. 6399-6409 http://dx.doi.org/10.1016/j.watres.2012.09.008
6
Trichloramine was measured with a method for air analysis described by Hery et al. (1995) with modifications described by Lützenkirchen and Breuer (2006) (see SM for details). Trichloramine was stripped from the water by aerating the sample for 20 min and then the trichloramine in the air was trapped on a filter where it was reduced to chloride. The filter was equipped with protecting column consisting of sulfamic acid impregnated silica gel, which prevents airborne water droplets of chloride, monochloramine and dichloramine from being included in the sample. The purge time for samples for trichloramine analysis was checked by purging selected samples with high trichloramine content, a second time for another 20 min. These samples gave results similar to the blank values. Chloride was subsequently measured photometrically (Spectroquant® NOVA 60, Merck) with Chloride Cell Test Spectroquant® from Merck. A more detailed description of the method can be found in the SM.
2.5 Range finding experiments
The effect of chlorine dose on the formation of DBPs was examined by adding chlorine at different levels at pH 6.0, 7.0 and 8.0. The water was buffer with phosphate buffer and BFA was added corresponding to 1 mg/L TOC. After that 10, 20, 25 and 35 mg/L chlorine were added and the samples were kept at 25°C for 48 h before THMs and HANs were measured.
2.6 DBP formation tests
The formation of DBPs from reaction of BFA with chlorine was investigated. Similar tests have been used in other studies that investigated the potential of formation of NCl3 (Schmalz et al., 2011), THM and HAA in swimming pool water (Kanan and Karanfil, 2011), and THM, HAN and HAA from particles from a swimming pool (Hansen et al., 2012). The main principle of these experiments was the use of excess chlorine compared to the theoretically required dose for complete oxidation of the organic material of the water. For the experiments with constant free chlorine (HOCl + OCl-) the initial concentration was 35 mg Cl2/L and the BFA dose 1.0 mg/L TOC. The selection of the initial free chlorine concentration of 35 mg/L as basis for the design of the DBP-formation experiments, is based on the range finding experiment discussed in Section 3.1. Due to the pH dependent speciation, the concentration of active chlorine (HOCl) varied and was calculated to be 34 mg Cl2/L at pH 6 and 9.1 mg Cl2/L at pH 8. For the experiments with constant initial concentration of active chlorine (HOCl), chlorine was added according to the speciation at each given pH value to obtain a calculated initial concentration of HOCl of 26.6 mg/L. So due to the speciation the free chlorine concentration was 27 mg Cl2/L at pH 6 and 102 mg Cl2/L at pH 8. The concentration of free chlorine and HOCl at the used pH values can be found in SM.
The ratio between the initial Cl2 and TOC in this formation test is much higher than the ratios between measured Cl2 and TOC in swimming pools. This does not mean that the experimental conditions are unrealistic since most of the TOC in pool water has been in the water a long time and reflects the fraction of carbon added over a long time period which is not reactive to chlorine.

Hansen et al., 2012. Water Research, 46(19), pp. 6399-6409 http://dx.doi.org/10.1016/j.watres.2012.09.008
7
2.7 Experiments performed
The body fluid analogue used for experiments consisted of ammonia (2.00 g/L), urea (14.8 g/L), creatinine (1.80 g/L), histidine (1.21 g/L), hippuric acid (1.71 g/L), uric acid (0.49 g/L) and citric acid (0.64 g/L) (Judd and Bullock, 2003). Based on the concentration of each compound and their carbon content the total theoretical organic carbon (TOC) was determined to be 5.73 g/L. The chlorination experiments were carried out as batch experiments. Freshly produced reversed osmosis water was buffered with phosphate buffer (25 mM) at pH 6.0, 6.5, 7.0, 7.5 and 8.0, followed by the addition of BFA corresponding to 1.0 mg/L (71 µmol/L) TOC (for more details refer to the SM). For the investigation of formation of THMs, HANs and HAAs the chlorination was applied either as constant initial concentration of free chlorine (HOCl + OCl-) or active chlorine as described in the previous section. The experiments were performed in headspace-free borosilicate glass bottles sealed with caps with a PTFE seal (SCHOTT DURAN®) to avoid stripping of the volatile compounds. The bottles were kept at 25°C for 48 h, and then samples were taken for analysis of THMs, HANs, HAAs and chlorine residues and for measuring the pH. Table 1 contains the complete list of the compounds analysed and their abbreviations. The experiments were repeated in the presence of 1.0 mg/L (13 µmol/L) Br-. For the investigation of trichloramine formation the chlorination was applied as constant initial concentration of free chlorine (35 mg/L). The experiments were performed in different sizes of borosilicate glass bottles at different pH values to avoid overloading the filter. Specifically, for pH values 6.0 and 6.5, the total volume was 100 mL, while for pH values 7.0, 7.5, and 8.0 the volume was 250, 500, and 1000 mL, respectively. To avoid any degradation of NCl3 due to UV-radiation the bottles were wrapped with aluminum-foil. The bottles were allowed to react for 24 h at 25 °C before the NCl3 was measured.
2.8 Estimation of cyto- and genotoxicity
Based on the measured concentration of the different DBPs, the cyto- and genotoxicity was estimated as the sum of the concentration of each compound divided by its EC50 (Equation1)
∑=i
i
i
EC
CToxicity
1 50,
(Equation 1)
All the EC50 values were used as reported in the literature (Muellner et al., 2007; Plewa et al., 2002; Plewa et al., 2008). These references were chosen because all the investigated compounds were tested in the same assay, except dichloropropanone and trichloropropanone which were not detected in the experiments. The assay used was an in vitro cellular toxicological assays based on Chinese hamster ovary cells and the cytotoxicity was measured as the reduction in cell density while the genotoxicity was measured by single cell gel electrophoresis (Muellner et al., 2007; Plewa et al., 2002; Plewa et al., 2008). The EC50 values used for the estimations are given in Table S2 in the SM.

Hansen et al., 2012. Water Research, 46(19), pp. 6399-6409 http://dx.doi.org/10.1016/j.watres.2012.09.008
8
3 Results and discussion
3.1 Range finding for batch experiments
In swimming pools organic pollutants react with chlorine over a long time period as the residence time of the pool water (the water exchange) is in the order of weeks to months (and in some cases even years). As the TOC level in swimming pools does not increase significantly over time it can be assumed that dissolved organic material added to the pool water by bathers is consumed with reactions with chlorine to form either CO2 or volatile DBPs (THMs, HANs etc.). This complete reaction of anthropogenic derived organic matter has also been found by Judd & Bullock (2003). In pools, volatile DBP are stripped from the pool continuously and the main exposure route to bathers is believed to be through inhalation with ingestion and dermal uptake as two other important exposure routes. Laboratory scale batch experiments that aim to quantify the production of volatile DBPs under realistic conditions are simulated best when exposure with low chlorine concentration is used. Unfortunately, DBPs like HANs are not stable in water over timescales of several weeks (Munch and Hautman, 1995; Oliver, 1983). This suggests that a simulation test needs to be made as an accelerated test. Increasing chlorine concentration will decrease reaction time. Reactions may be proportional to chlorine exposure. E.g. 70 days with 1.0 mg/L Cl2 can be compared to 2 days (48 h) with 35 mg/L Cl2. The drawback of this approach is that the chlorine concentration may affects which DBPs are formed. In the design experiment TCM, TCAN and DCAN was formed when chlorine reacted with BFA (Figure 1). The brominated species of THM and HAN were not formed since bromide was not added. The formation of DCAN decreased with increasing chlorine dose (Figure 1a). However, at pH 6.0 the
formation was constant for chlorine dosage ≤ 25 mg/L and then decreasing at 35 mg/L. The TCM formation increased with increasing chlorine dose for all three pH levels investigated (Figure 1c). The results indicated that the species formed varied with chlorine dose. At pH 6.0, DCAN was formed at low chlorine doses, however when the chlorine dose was increased, TCAN was formed instead. At high chlorine doses (35 mg/L) DCAN and TCAN formation decreased but TCM formation increased. Based on the above and since in swimming pool water the concentrations of THMs are generally higher than the concentrations of HANs (WHO, 2006), a chlorine dose of 35 mg/L was chosen as the basis for the experiments conducted in this study. This approach, of utilizing high chlorine concentrations in relation to the TOC, has been used by other researchers (Kanan and Karanfil, 2011; Schmalz et al., 2011) and in some cases even at higher chlorine doses, e.g. 50 mg/L Cl2 with 1.0 mg/L TOC.

Hansen et al., 2012. Water Research, 46(19), pp. 6399-6409 http://dx.doi.org/10.1016/j.watres.2012.09.008
9
10 15 20 25 30 350.00
0.05
0.10
0.15
0.20
0.25 c) TCMpH 6pH 7pH 8
10 15 20 25 30 350.00
0.05
0.10
0.15 a) DCAN
10 15 20 25 30 350.00
0.05
0.10
0.15 b) TCAN
Initial chlorine concentration (mg Cl 2/L)
µµ µµmol
/L
Figure 1. Effect of initial chlorine concentration and pH on THM and HAN formation from chlorination of BFA. (Reaction time = 48 h, temperature = 25 °C and BFA addition = 1 mg TOC/L). The dashed line indicates the limit of quantification of the analysis. Abbreviation of compounds is found in Table 1.
3.2 Effect of pH on THM, HAN and HAA formation
The reaction of chlorine with BFA formed chlorinated species of THMs, HAAs and HANs (Figure 2). Control experiment with freshly made reverse osmosis water at pH 7.0 revealed a low concentration of TCM (0.02 µmol/L) which may come from the chlorine stock solution
and the reaction with NOM in the reverse osmosis water (TOC ≈ 100 ug/L). The pH was measured at the end of the experiments and the deviation from the target pH never exceeded 0.05. DBPs formation exhibited similar pH dependency when the initial free or active chlorine concentration was constant. However, in the experiments with constant initial concentration of active chlorine, slightly higher experimental total molar concentration of DBPs (14 %) were observed in the experiment at pH = 7.5, with the increase in total molar DBP concentration becoming more pronounced for pH = 8.0 (37 %) compared to the experiment with constant initial concentration of free chlorine. This is due to the difference in the initial free chlorine concentration which is 1.5 and 3 times higher in the active chlorine experiments at pH values 7.5 and 8.0, respectively. It is important to note that, although OCl-
is a weaker oxidant compare to HOCl (White, 1992) it enhances DBP formation once found in sufficiently high concentrations. This combination of high pH and very high total chlorine is properly unrealistic for swimming pools since the increasing concentration of OCl- would contribute to the disinfection power (White, 1992) and the high total chlorine would have other undesired effects for swimmers. The effect of the chlorination approach combined with the effect of pH on DBP formation, differed for each of the investigated DBP groups. Specifically, THM concentration in the constant free and active chlorine experiments, increased with increasing pH. This increase was particularly apparent for pH = 8.0 under constant active chlorine conditions, indicating that THM formation depends on the pH, as well as the chlorine concentration. Apart from our study on chlorination of BFA, similar pH dependency on THM formation was observed in drinking water chlorination (Bougeard et al., 2008; Liang and Singer, 2003).

Hansen et al., 2012. Water Research, 46(19), pp. 6399-6409 http://dx.doi.org/10.1016/j.watres.2012.09.008
10
6.0 6.5 7.0 7.5 8.00.00
0.05
0.10
0.15
0.0
0.1
0.2
0.3(b) Active chlorine
pH
THM
or
HA
N (
µmol
/L)
HA
A (µm
ol/L)
6.0 6.5 7.0 7.5 8.00.00
0.05
0.10
0.15
0.0
0.1
0.2
0.3(a) Free chlorine
pH
THM
or
HA
N (
µmol
/L)
HA
A (µm
ol/L)DCAA
TCAA
TCM
DCAN
TCAN
Figure 2. Effect of pH on THM, HAN and HAA formation from chlorination of BFA with constant initial concentration of free chlorine (a) and active chlorine (b), in the absence of bromide. The error bars represent the standard deviation of six replicates. (Reaction time = 48 h, temperature = 25 °C and BFA addition = 1 mg TOC/L). Abbreviation of compounds is found in Table 1.
In general, the formation of dichlorinated HAAs was favored over trichlorinated HAAs (Figure 2), while no monochlorinated HAA was detected at any of the two chlorination approaches. In addition, the concentration of HAAs was not affected by the pH, but increased with increasing free chlorine concentration. Since studies of DBP formation during chlorination of pool water are limited, our findings were compared with studies on the chlorination of drinking water. The main difference between the organic matter found in drinking water and pools comes from the anthropogenic DBP precursors in the pool water which are easier to oxidize and have higher carbon to nitrogen molar ratio than NOM in drinking water. As an example, in the study by Kanan and Karanfil (2011) on formation of chlorination byproducts in swimming pools the C/N ratios in the investigated filling waters from five drinking water treatment plants in South Carolina varied between 6 and 24. This compares to a calculated C/N ratio for the body fluid analogue proposed by Judd and Bullock (2003) which was used both in this study and by Kanan and Karanfil (2011) of 0.77. Two alternative BFA formulas also used by Kanan and Karanfil (2011) had calculated C/N ratios of 0.59 and 0.65.Some studies reported

Hansen et al., 2012. Water Research, 46(19), pp. 6399-6409 http://dx.doi.org/10.1016/j.watres.2012.09.008
11
increasing HAA concentration with decreasing pH (Cowman and Singer, 1996; Liang and Singer, 2003) while others found contradictory pH dependencies for two different types of drinking water (Bougeard et al., 2008). The formation of HANs was favored at low pH for both chlorination approaches, with the highest formation found when free chlorine was kept constant (Figure 2). When pH increased from pH = 6.0 to pH = 7.5 and free chlorine was kept constant, HANs concentration was reduced to one third, while for constant active chlorine the HANs concentration reduced to half. The BFA consist of four compounds which may act as precursor for HANs. Histidine has been identified as precursor for dichloracetonitrile where as creatinine was found not to form HANs (Li and Blatchley III, 2007). It is important to note, that HANs are the most toxic DBP group examined in this study (Plewa et al., 2008), and HAN have also been reported to be the DBP group that contributes the most to the toxicity of chlorinated pool water (Kramer et al., 2009). Therefore, in order to limit HAN formation it is imperative to identify the conditions where HANs are produced.
At pH 7.0 the relative DBP formation was 0.077 µmol mg-1 THMs/TOC, 0.27 µmol mg-1
HAAs/TOC and 0.025 µmol mg-1 HANs/TOC. Kanan and Karanfil (2011) reported a higher
formation (THMs/TOC = 0.25 µmol mg-1 and HAAs/TOC = 0.51 µmol mg-1) when chlorinating the BFA suggested by Judd and Bullock (2003), however they used a higher chlorine to TOC ratio (50 mg Cl2/ mg TOC) compared to our study. The DBP formation from
filling water has been reported at 0.62 µmol mg-1 THMs/TOC and 0.26 µmol mg-1 HAAs/TOC (Kanan and Karanfil, 2011). Regardless of the difference in chlorine to TOC ratio both studies found higher formation of HAAs than of THM when chlorinating BFA, while the opposite is the case for the filling water. In addition to the above mentioned compounds, trichloronitromethane, dichloropropanone, and trichloropropanone were also monitored in all the experiments. However, their concentrations were close to the method detection limit and therefore, no conclusions on the effects of pH and chlorination approaches on formation of these can be made.
3.3 Effect of bromide
The effect of bromide on DBPs formation in pool water was also investigated, since studies with drinking water have shown increased DBPs levels in the presence of bromide, as well as the formation of Br-based DBPs (Chang et al., 2001; Hua et al., 2006; Hua and Reckhow, 2008). This is due to the oxidation of Br- by the HOCl, forming of hypobromous acid (HOBr) (White, 1992). The hypobromous acid reacts with the dissolved organic matter and forms brominated DBPs which at the same time reacts with chlorine to form mixed Br-Cl-DBPs. Since, the pKa of HOBr is 8.7 (White, 1992), hypobromous acid, which is a stronger oxidant than OBr-, was the dominant specie at all pH values tested. We conducted the experiments under constant initial free and active chlorine concentrations with constant bromide concentration (1.0 mg/L Br-). In addition to the detection of the Cl-based DBPs, Br-based DBPs were also characterized and quantified (Figure 3). The identified Cl- and Br-based DBPs were separated into HAAs, THMs and HANs to evaluate the individual effect of
Hansen et al., 2012. Water Research, 46(19), pp. 6399-6409 http://dx.doi.org/10.1016/j.watres.2012.09.008
12
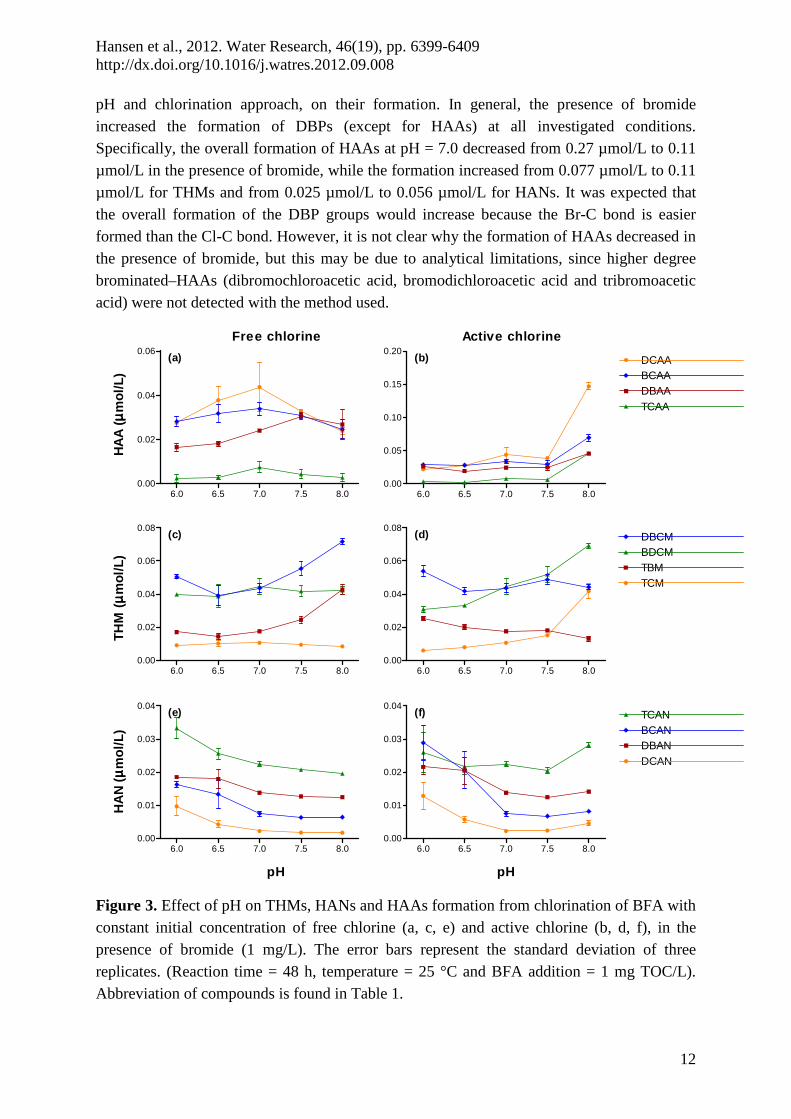
pH and chlorination approach, on their formation. In general, the presence of bromide increased the formation of DBPs (except for HAAs) at all investigated conditions. Specifically, the overall formation of HAAs at pH = 7.0 decreased from 0.27 µmol/L to 0.11 µmol/L in the presence of bromide, while the formation increased from 0.077 µmol/L to 0.11 µmol/L for THMs and from 0.025 µmol/L to 0.056 µmol/L for HANs. It was expected that the overall formation of the DBP groups would increase because the Br-C bond is easier formed than the Cl-C bond. However, it is not clear why the formation of HAAs decreased in the presence of bromide, but this may be due to analytical limitations, since higher degree brominated–HAAs (dibromochloroacetic acid, bromodichloroacetic acid and tribromoacetic acid) were not detected with the method used.
6.0 6.5 7.0 7.5 8.00.00
0.05
0.10
0.15
0.20(b) DCAA
TCAA
BCAADBAA
6.0 6.5 7.0 7.5 8.00.00
0.02
0.04
0.06(a)
6.0 6.5 7.0 7.5 8.00.00
0.02
0.04
0.06
0.08(c)
6.0 6.5 7.0 7.5 8.00.00
0.02
0.04
0.06
0.08(d)
TCM
BDCMDBCM
TBM
6.0 6.5 7.0 7.5 8.00.00
0.01
0.02
0.03
0.04(f)
DCAN
TCANBCANDBAN
6.0 6.5 7.0 7.5 8.00.00
0.01
0.02
0.03
0.04(e)
Free chlorine Active chlorine
HA
A (
µµ µµm
ol/L
)
pH pH
TH
M (
µµ µµm
ol/L
)H
AN
(µµ µµ
mol
/L)
Figure 3. Effect of pH on THMs, HANs and HAAs formation from chlorination of BFA with constant initial concentration of free chlorine (a, c, e) and active chlorine (b, d, f), in the presence of bromide (1 mg/L). The error bars represent the standard deviation of three replicates. (Reaction time = 48 h, temperature = 25 °C and BFA addition = 1 mg TOC/L). Abbreviation of compounds is found in Table 1.
Hansen et al., 2012. Water Research, 46(19), pp. 6399-6409 http://dx.doi.org/10.1016/j.watres.2012.09.008
13
As far as the effect of pH, there was no clear effect on HAA formation under constant free and active chlorine conditions. However, under constant active chlorine condition the chlorine dosing affected the HAA formation (Figure 3b), especially at pH =8.0, since the free chlorine concentration was high to achieve 26 mg/L HOCl. For the higher degree of brominated THMs (DBCM and TBM, abbreviation found in Table 1) the effect of the pH was more profound, when free chlorine was constant (Figure 3c). For the same chlorination approach, BDCM and TCM formation remained constant at all pH values. At constant active chlorine conditions (Figure 3d), the DBCM formation fluctuated with increasing pH values but overall the formation was not affected by the pH level. A slight reduction in the concentration of TBM was observed with increasing pH values, while, the concentration of BDCM and TCM increased with increasing pH values. It is apparent that BDCM and TCM formation was also affected from the chlorine dosing in addition to the pH. Finally, the formation of HANs decreased when the pH increased from 6.0 to 7.0 and remained stable for
pH ≥ 7.0 under both constant free and active chlorine (Figure 3e & f). Based on the above, the presence of bromide did not affect the formation tendencies of three investigated DBP groups under different pH values and chlorination approaches but it did increase the overall amount of DBPs formed.
3.4 Trichloramine
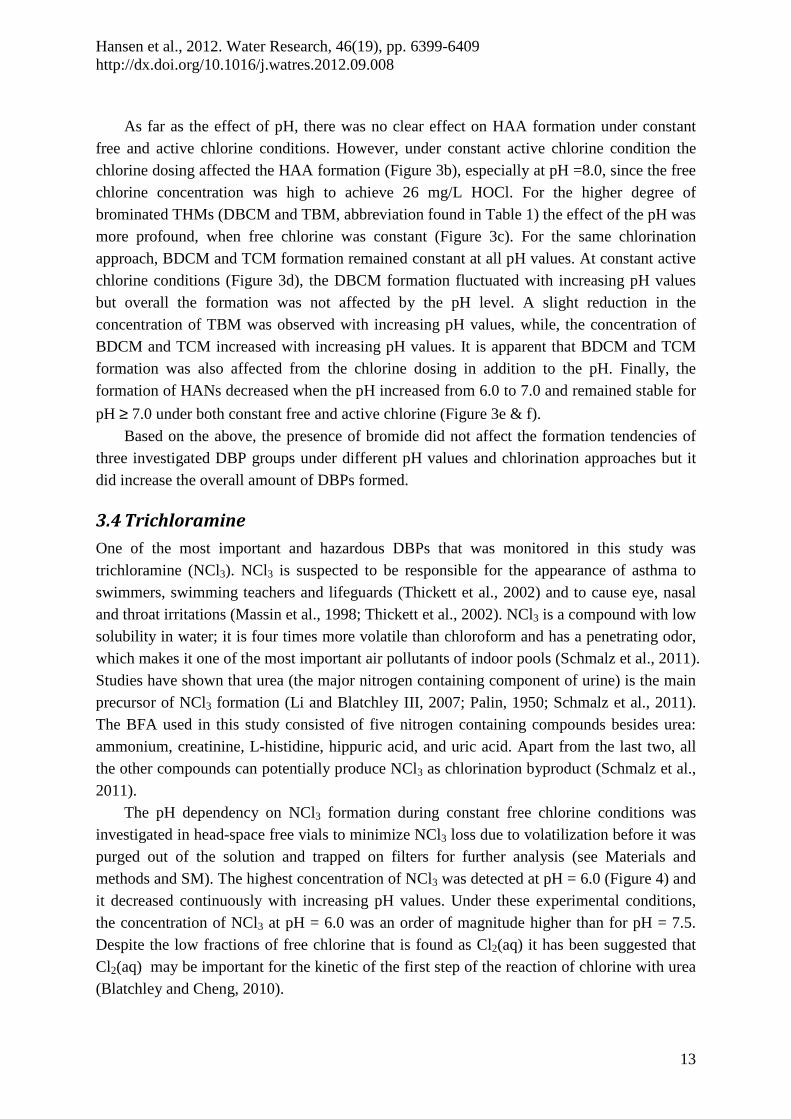
One of the most important and hazardous DBPs that was monitored in this study was trichloramine (NCl3). NCl3 is suspected to be responsible for the appearance of asthma to swimmers, swimming teachers and lifeguards (Thickett et al., 2002) and to cause eye, nasal and throat irritations (Massin et al., 1998; Thickett et al., 2002). NCl3 is a compound with low solubility in water; it is four times more volatile than chloroform and has a penetrating odor, which makes it one of the most important air pollutants of indoor pools (Schmalz et al., 2011). Studies have shown that urea (the major nitrogen containing component of urine) is the main precursor of NCl3 formation (Li and Blatchley III, 2007; Palin, 1950; Schmalz et al., 2011). The BFA used in this study consisted of five nitrogen containing compounds besides urea: ammonium, creatinine, L-histidine, hippuric acid, and uric acid. Apart from the last two, all the other compounds can potentially produce NCl3 as chlorination byproduct (Schmalz et al., 2011). The pH dependency on NCl3 formation during constant free chlorine conditions was investigated in head-space free vials to minimize NCl3 loss due to volatilization before it was purged out of the solution and trapped on filters for further analysis (see Materials and methods and SM). The highest concentration of NCl3 was detected at pH = 6.0 (Figure 4) and it decreased continuously with increasing pH values. Under these experimental conditions, the concentration of NCl3 at pH = 6.0 was an order of magnitude higher than for pH = 7.5. Despite the low fractions of free chlorine that is found as Cl2(aq) it has been suggested that Cl2(aq) may be important for the kinetic of the first step of the reaction of chlorine with urea (Blatchley and Cheng, 2010).
Hansen et al., 2012. Water Research, 46(19), pp. 6399-6409 http://dx.doi.org/10.1016/j.watres.2012.09.008
14
6.0 6.5 7.0 7.5 8.00
10
20
30
40
pH
NC
l 3 (
µmol
/L)
Figure 4. Effect of pH on NCl3 formation from chlorination of BFA at constant initial concentration of free chlorine. The error bars represent the standard deviation of treatment duplicates. (Reaction time = 24 h, temperature = 25 °C and BFA addition = 1 mg TOC/L).
It is also noticeable, that NCl3 formation at all pH values was about 10 to 100 times higher compared to the C-based DBPs (Figure 2a). Based on the above, it is concluded that NCl3 formation is strongly depended on the pH level. This pH dependency was also confirmed by other studies, since NCl3 is one of the few DBPs where the pH effect on its formation in pool water was previously investigated (Palin, 1950; Schmalz et al., 2011). Other parameters which have been investigated include the chlorine dosing (Cl/N mass ratio) as well as the different N-based compounds found in pool water which can act as NCl3 precursors (Li and Blatchley III, 2007; Palin, 1950; Schmalz et al., 2011). Each compound was investigated at different pH values to identify its individual effect on NCl3 formation (Schmalz et al., 2011). For example, the yield of NCl3 from urea is 95% at pH = 6.0 while at pH = 7.7 it is significantly less, at 24% (Schmalz et al., 2011). Recognizing the effect of pH on NCl3 formation, legislators should take this into account if it is considered to reduce the legal limit of pH in public swimming pools. Especially since, the effect on bather’s health from this compound was recognized since the early 50s (Palin, 1950), and reinforced in this study.
3.5 Cytotoxicity and genotoxicity
To evaluate the effect of DBP formation on bathers’ health, the cyto- and genotoxicity of the chlorinated BFA at the different pH values and chlorination approaches was estimated as described in Materials and methods section using Equation 1. When the pH level was changed from pH 6.0 to pH 7.0, the cytotoxic potency was reduced by half in both the experiments with constant free and active chlorine (Figure 5a & b). In the case of constant
free chlorine, the cytotoxicity did not change at pH values ≥ 7.0, while for constant active chlorine the calculated cytotoxicity was higher at pH 8.0 than at pH 7.0 and pH 7.5. The contribution of THMs to the overall solution toxicity was negligible compared to the other groups. However, the absolute value of THM toxicity increased with the increasing pH which relates to the increasing THMs concentration shown in Figure 2. Likewise, the HAA
Hansen et al., 2012. Water Research, 46(19), pp. 6399-6409 http://dx.doi.org/10.1016/j.watres.2012.09.008
15
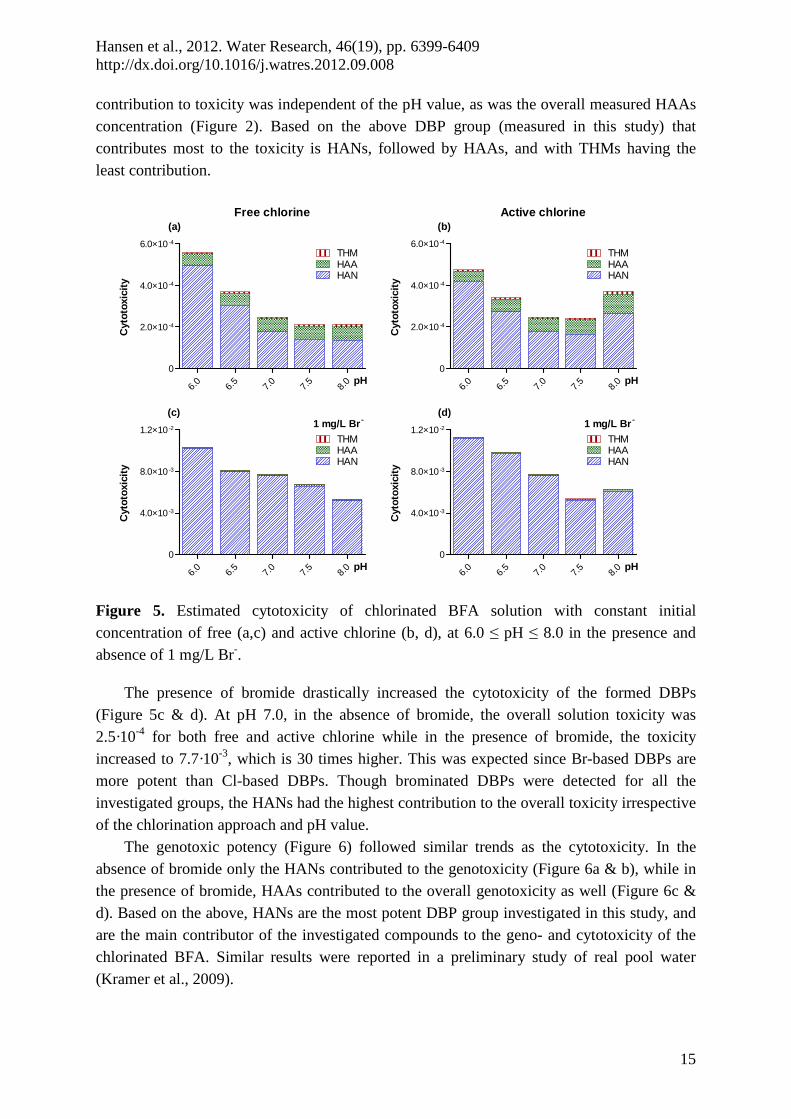
contribution to toxicity was independent of the pH value, as was the overall measured HAAs concentration (Figure 2). Based on the above DBP group (measured in this study) that contributes most to the toxicity is HANs, followed by HAAs, and with THMs having the least contribution.
6.0
6.5
7.0
7.5
8.0
0
2.0×10 -4
4.0×10 -4
6.0×10 -4
HAN
pH
(a)
HAATHM
Free chlorine
Cyt
otox
icity
6.0
6.5
7.0
7.5
8.0
0
4.0×10 -3
8.0×10 -3
1.2×10 -2
HAN
pH
(c)
HAATHM
1 mg/L Br -
Cyt
otox
icity
6.0
6.5
7.0
7.5
8.0
0
2.0×10 -4
4.0×10 -4
6.0×10 -4
HAN
pH
(b)
HAATHM
Active chlorine
Cyt
otox
icity
6.0
6.5
7.0
7.5
8.0
0
4.0×10 -3
8.0×10 -3
1.2×10 -2
HAN
pH
(d)
HAATHM
1 mg/L Br -
Cyt
otox
icity
Figure 5. Estimated cytotoxicity of chlorinated BFA solution with constant initial concentration of free (a,c) and active chlorine (b, d), at 6.0 ≤ pH ≤ 8.0 in the presence and absence of 1 mg/L Br-.
The presence of bromide drastically increased the cytotoxicity of the formed DBPs (Figure 5c & d). At pH 7.0, in the absence of bromide, the overall solution toxicity was 2.5·10-4 for both free and active chlorine while in the presence of bromide, the toxicity increased to 7.7·10-3, which is 30 times higher. This was expected since Br-based DBPs are more potent than Cl-based DBPs. Though brominated DBPs were detected for all the investigated groups, the HANs had the highest contribution to the overall toxicity irrespective of the chlorination approach and pH value. The genotoxic potency (Figure 6) followed similar trends as the cytotoxicity. In the absence of bromide only the HANs contributed to the genotoxicity (Figure 6a & b), while in the presence of bromide, HAAs contributed to the overall genotoxicity as well (Figure 6c & d). Based on the above, HANs are the most potent DBP group investigated in this study, and are the main contributor of the investigated compounds to the geno- and cytotoxicity of the chlorinated BFA. Similar results were reported in a preliminary study of real pool water (Kramer et al., 2009).

Hansen et al., 2012. Water Research, 46(19), pp. 6399-6409 http://dx.doi.org/10.1016/j.watres.2012.09.008
16
6.0
6.5
7.0
7.5
8.0
0
2.0×10 -5
4.0×10 -5
6.0×10 -5
HAN
pH
(a)
HAATHM
Free chlorineG
enot
oxic
ity
6.0
6.5
7.0
7.5
8.0
0
3.0×10 -4
6.0×10 -4
9.0×10 -4
HAN
pH
(d)
HAATHM
1 mg/L Br -
Gen
otox
icity
6.0
6.5
7.0
7.5
8.0
0
2.0×10 -5
4.0×10 -5
6.0×10 -5
HAN
pH
(b)
HAATHM
Active chlorine
Gen
otox
icity
6.0
6.5
7.0
7.5
8.0
0
3.0×10 -4
6.0×10 -4
9.0×10 -4
HAN
pH
(c)
HAATHM
1 mg/L Br -
Gen
otox
icity
Figure 6. Estimated genotoxicity of chlorinated BFA solution with constant initial concentration of free (a,c) and active chlorine (b, d), at 6.0 ≤ pH ≤ 8.0 in the presence and absence of 1 mg/L Br-.
4 Conclusions
In conclusion, pH and chlorination approach affected the formation of the three DBP groups (THMs, HAAs and HANs) and NCl3 differently. At pH<7.0 the formation of the currently regulated THMs decreased, while HAA formation remained constant and HAN was increased. The formation of NCl3 increased drastically at pH<7.0. Bromide was also added to record its effect on the formation of DBPs and solution toxicity. Overall, the presence of bromide did not affect the pH dependency on DBP formation, but it did increase the total amount formed each time, except for HAAs. Finally, the cyto- and genotoxic potency of the chlorinated BFA was estimated in the absence and presence of bromide. The pool water treated at pH = 6.0 had the highest cyto- and genotoxicity, which decreased with increasing pH. In addition, HANs were the most toxic compounds detected in this study and though found at low concentrations (<0.03 µmol/L, Figure 3e & f) they had the highest impact on toxicity. Based on the above, reducing swimming pool water pH<7 to reduce THM concentration may not be the best approach to control DBP formation, since the formation of more toxic DBPs increases.

Hansen et al., 2012. Water Research, 46(19), pp. 6399-6409 http://dx.doi.org/10.1016/j.watres.2012.09.008
17
Acknowledgment
K.M.S.H. is thankful to DTU Environment for giving her a PhD Scholarship and the Graduate School Urban Water Technology of Denmark (www.urbanwatertech.dk) for intellectual input and support on her research activities. Aurelia Piketty assistance with experiments and analysis at DTU Environment is acknowledged.
Supplementary material
Supplementary material associated with this article can be found, in the online version, at http://dx.doi.org/10.1016/j.watres.2012.09.008
References
APHA, 2005. Standard methods for the examination of water & wastewater. American Public Health Association, American Water Works Association and Water Environment Federation, Washington, DC, USA.
Bellar, T.A., Lichtenberg, J.J., Kroner, R.C., 1974. Occurrence of Organohalides in Chlorinated Drinking Waters. Journal American Water Works Association 66 (12), 703-706.
Blatchley, E.R., Cheng, M.M., 2010. Reaction Mechanism for Chlorination of Urea. Environmental Science & Technology 44 (22), 8529-8534.
Bougeard, C.M.M., Janmohamed, I.H.S., Goslan, E.H., Jefferson, B., Watson, J.S., Morgan, G.H., Parsons, S.A., 2008. Parameters Affecting Haloacetic Acid and Trihalomethane Concentrations in Treated UK Drinking Waters. In: Karanfil T, Krasner SW, Xie Y (Eds.), Disinfection By-Products in Drinking Water: Occurrence, Formation, Health Effects, and Control (95-108). American Chemical Society, Washington, DC.
Brunet, R., Berne, F., De Laat, J., 2010. Disinfection by-products in chlorinated swimming pool waters (In French, Sous-produits de chloration dans les eaux de piscines publiques). L'Eau, L'Industrie, Les Nuisances 333 83-88.
Chang, E.E., Lin, Y.P., Chiang, P.C., 2001. Effects of bromide on the formation of THMs and HAAs. Chemosphere 43 1029-1034.
Chiswell, B., Wildsoet, C.F., 1989. The Causes of Eye Irritation in Swimming Pools. Water Science and Technology 21 (2), 241-244.
Cowman, G.A., Singer, P.C., 1996. Effect of bromide ion on haloacetic acid speciation resulting from chlorination and chloramination of aquatic humic substances. Environmental Science & Technology 30 (1), 16-24.
Erdinger, L., Kirsch, F., Sonntag, H.G., 1998. Irritating effects of disinfection by-products in swimming pools. Zentralblatt fur Hygiene und Umweltmedizin 200 (5-6), 491-503.

Hansen et al., 2012. Water Research, 46(19), pp. 6399-6409 http://dx.doi.org/10.1016/j.watres.2012.09.008
18
Glauner, T., Waldmann, P., Frimmel, F.H., Zwiener, C., 2005. Swimming pool water-fractionation and genotoxicological characterization of organic constituents. Water Research 39 (18), 4494-4502.
Goodman, M., Hays, S., 2008. Asthma and Swimming: A Meta-Analysis. Journal of Asthma 45 (8), 639-647.
Hansen, K.M.S., Willach, S., Mosbæk, H., Andersen, H.R., 2012. Particles in swimming pool filters - Does pH determine the DBP formation? Chemosphere 87 (3), 241-247.
Heller-Grossman, L., Manka, J., Limoni-Relis, B., Rebhun, M., 1993. Formation and distribution of haloacetic acids, THM and TOX in chlorination of bromide-rich lake water. Water Research 27 (8), 1323-1331.
Hery, M., Hecht, G., Gerber, J.M., Gendre, J.C., Hubert, G., Rebuffaud, J., 1995. Exposure to Chloramines in the Atmosphere of Indoor Swimming Pools. Annals of Occupational Hygiene 39 (4), 427-439.
Hua, G.H., Reckhow, D.A., 2008. Relationship between Brominated THMs, HAAs, and Total Organic Bromine during Drinking Water Chlorination. In: Karanfil T, Krasner SW, Xie Y (Eds.), Disinfection By-Products in Drinking Water: Occurrence, Formation, Helth Effects, and Control (109-123). American Chemical Society, Washington, DC.
Hua, G.H., Reckhow, D.A., Kim, J., 2006. Effect of bromide and iodide ions on the formation and speciation of disinfection byproducts during chlorination. Environmental Science & Technology 40 (9), 3050-3056.
Judd, S.J., Bullock, G., 2003. The fate of chlorine and organic materials in swimming pools. Chemosphere 51 (9), 869-879.
Kanan, A., Karanfil, T., 2011. Formation of disinfection by-products in indoor swimming pool water: The contribution from filling water natural organic matter and swimmer body fluids. Water Research 45 (2), 926-932.
Kramer, M., Hübner, I., Rörden, O., Schmidt, C.K., 2009. Haloacetonitriles - another importent group of disinfection byproducts in swimming pool water. In: Swimming Pool & Spa International Conference. London, UK.
Krasner, S.W., Weinberg, H.S., Richardson, S.D., Pastor, S.J., Chinn, R., Sclimenti, M.J., Onstad, G.D., Thruston, A.D., 2006. Occurrence of a new generation of disinfection byproducts. Environmental Science & Technology 40 (23), 7175-7185.
Kristensen, G.H., Klausen, M.M., Janning, K., 2007. Experimental operation of a warm water pool in Glasaxe swimming pool at low chlorine level and pH (In Danish: Forsøgsdrift af varmtvandsbassin i Gladsaxe Svømmehal ved lavt indhold af frit klor og reduceret pH). Report from DHI, Denmark. www.dhigroup.com
Hansen et al., 2012. Water Research, 46(19), pp. 6399-6409 http://dx.doi.org/10.1016/j.watres.2012.09.008
19
Li, J., Blatchley III, E.R., 2007. Volatile Disinfection Byproduct Formation Resulting from Chlorination of Organic-Nitrogen Precursors in Swimming Pools. Environmental Science & Technology 41 (19), 6732-6739.
Liang, L., Singer, P.C., 2003. Factors influencing the formation and relative distribution of haloacetic acids and trihalomethanes in drinking water. Environmental Science & Technology 37 (13), 2920-2928.
Liviac, D., Wagner, E.D., Mitch, W.A., Altonji, M.J., Plewa, M.J., 2010. Genotoxicity of Water Concentrates from Recreational Pools after Various Disinfection Methods. Environmental Science & Technology 44 (9), 3527-3532.
Lützenkirchen, C., Breuer, D., 2006. Trichloramine, no. 8623 (In German: Stickstofftrichlorid (Kennzahl 8623)). In: BGIA - Institut für Arbeitsschutz (Ed.), BGIA - Arbeitsmappe Messung von Gefahrstoffen. Erich Schmidt Verlag, Berlin.
Massin, N., Bohadana, A.B., Wild, P., Hery, M., Toamain, J.P., Hubert, G., 1998. Respiratory symptoms and bronchial responsiveness in lifeguards exposed to nitrogen trichloride in indoor swimming pools. Occupational and Environmental Medicine 55 (4), 258-263.
Morris, J.C., 1966. Acid Ionization Constant of HOCl from 5 to 35 Degrees. Journal of Physical Chemistry 70 (12), 3798-3805.
Muellner, M.G., Wagner, E.D., McCalla, K., Richardson, S.D., Woo, Y.T., Plewa, M.J., 2007. Haloacetonitriles vs. regulated haloacetic acids: Are nitrogen-containing DBPs more toxic? Environmental Science & Technology 41 (2), 645-651.
Munch, D.J., Hautman, D.P., 1995. Determination of Chlorination Disinfection Byproducts, Chlorinated Solvents, and halogenated pesticides/herbicides in Drinking Water by Liquid-Liquid Extraction and Gas Chromatography with Electron-Capture Detection - Method 551.1. U.S. Environmental Protection Agentcy
Oliver, B.G., 1983. Dihaloacetonitriles in drinking-water - algae and fulvic-acid as precursors. Environmental Science & Technology 17 (2), 80-83.
Palin, A.T., 1950. Chemical Aspects of Swimming Bath Treatment. The Baths Service: The journal of the national association of bath superintendents 9 12-20.
Plewa, M.J., Kargalioglu, Y., Vankerk, D., Minear, R.A., Wagner, E.D., 2002. Mammalian cell cytotoxicity and genotoxicity analysis of drinking water disinfection by-products. Environmental and Molecular Mutagenesis 40 (2), 134-142.
Plewa, M.J., Wagner, E.D., Muellner, M.G., Hsu, K.M., Richardson, S.D., 2008. Comparative Mammalian Cell Toxicity of N-DBPs and C-DBPs. In: Karanfil T, Krasner SW, Xie Y (Eds.), Disinfection By-Products in Drinking Water: Occurrence, Formation, Helth Effects, and Control (36-50). American Chemical Society, Washington, DC.
Hansen et al., 2012. Water Research, 46(19), pp. 6399-6409 http://dx.doi.org/10.1016/j.watres.2012.09.008
20
Richardson, S.D., 2011. Disinfection By-Products: Formation and Occurrence of Drinking Water. In: Nriagu, J.O. (Ed.), The Encyclopedia of Environmental Health, Vol. 2 (110-136). Elsevier, Burlington.
Richardson, S.D., Plewa, M.J., Wagner, E.D., Schoeny, R., DeMarini, D.M., 2007. Occurrence, genotoxicity, and carcinogenicity of regulated and emerging disinfection by-products in drinking water: A review and roadmap for research. Mutation Research-Reviews in Mutation Research 636 (1-3), 178-242.
Richardson, S.D., DeMarini, D.M., Kogevinas, M., Fernandez, P., Marco, E., Lourencetti, C., Ballesté, C., Heederik, D., Meliefste, K., McKague, A.B., Marcos, R., Font-Ribera, L., Grimalt, J.O., Villanueva, C.M., 2010. What's in the Pool? A Comprehensive Identification of Disinfection By-products and Assessment of Mutagenicity of Chlorinated and Brominated Swimming Pool Water. Environmental Health Perspectives 118 (11), 1523-1530.
Rook, J.J., 1974. Formation of haloforms during chlorination of natural waters. Water Treatment Examination 23 478-482.
Schmalz, C., Frimmel, F.H., Zwiener, C., 2011. Trichloramine in swimming pools - Formation and mass transfer. Water Research 45 (8), 2681-2690.
Suffet, I.H., Brenner, L., Silver, B., 1976. Identification of 1,1,1-trichloroacetone (1,1,1-trochloropropanone) in 2 drinking waters - known precursor in haloform reaction. Environmental Science & Technology 10 (13), 1273-1275.
Thibaud, H., De Laat, J., Merlet, N., Dore, M., 1987. Chloropicrin formation in aqueous solution effect of nitrites on precursors formation during the oxidation of organic compounds. Water Research 21 (7), 813-822.
Thickett, K.M., McCoach, J.S., Gerber, J.M., Sadhra, S., Burge, P.S., 2002. Occupational asthma caused by chloramines in indoor swimming-pool air. European Respiratory Journal 19 (5), 827-832.
White, G.C., 1992. Handbook of chlorination and alternative disinfectants. Van Nostrand Reinhold, New York.
WHO, 2006. Guidelines for safe recreational water environments. Volume 2, Swimming pools and similar environments. World Health Organization, WHO Press, Geneva, Switzerland.
Zwiener, C., Richardson, S.D., DeMarini, D.M., Grummt, T., Glauner, T., Frimmel, F.H., 2007. Drowning in Disinfection Byproducts? Assessing Swimming Pool Water. Environmental Science & Technology 41 (2), 363-372.

SM page 1
Supplementary material
Effect of pH on formation of disinfection by
products in swimming pool water – Is less THMs
better?
Kamilla M. S. Hansena, Sarah Willacha,b, Maria G. Antonioua,c, Hans Mosbæka, Hans-
Jørgen Albrechtsena and Henrik R. Andersena,*
aDepartment of Environmental Engineering, Technical University of Denmark (DTU), Miljoevej, Building 113, 2800 Kgs. Lyngby, Denmark
bDepartment of Chemistry, University of Duisburg – Essen, Germany
cDepartment of Environmental Science and Technology, Cyprus University of Technology, PO Box: 50329, 3603 Lemesos, Cyprus
*Corresponding author e-mail: [email protected]
Number of pages: 9 Content: Analysis of Trihalomethans and Haloacetonitriles (SM page 2) Analysis of Haloacetic acids (SM page 3) Analysis of Trichloroamine (SM page 4) Formation potential tests (SM page 5) Body fluid analogue (BFA) (SM page 6) EC50 values of cyto- and genotoxicity (SM page 7) References

SM page 2
Analysis of THMs and HANs
Free chlorine in THMs and HANs samples was quenched by adding 200 µL ammonium chloride solution (50 g/L) to 40 mL borosilicate glass vials before it was filled head-space-free with the sample and were analyzed the same day. An autosampler (AQUATek 70, Teledyne Tekmar) with a 5 mL loop was used to transfer the samples to the purge cell (Velocity XPT Purge and Trap Sample Concentrator, Teledyne Tekmar). The sample was purged for 11 minutes by bubbling nitrogen with a flow rate of 44 mL/min. The compound was adsorbed on a trap, VOCARB 3000, Telmark®. The sample was desorbed for 3 minutes at 250 °C from the trap. Simultaneously, with desorption from the trap, the GC (HP 6890 Series GC System, Hewlett Packard) was started with a flow rate of helium at 2.5 mL/min, which was set to 1 mL/min after the 3 minutes. The analysis was performed in split mode with a ratio of 3:1. To clean the trap and minimize carryover it was baked at 260°C with a flow rate of 200 mL/min for 5 minutes. The compounds were separated with a fused silica capillary column (30.0 m x 0.25 mm i.D., 1.5 µm film thickness; VOCOL, Supelco). The initial temperature of the oven was 45 °C for the first 3 minutes and then it increased with a rate of by 25 °C/min until it reached 230 °C. The compounds were detected with a mass spectrometer (5973 Mass selective detector, Hewlett Packard) set in SIM mode.
Table S1. Detection and quantification limit for the trihalomathanes, haloacetonitrile, halopropanone and trichloronitromethane based on their quantifier and qualifier ions.
Compound Quantifier ion
Qualifier ion
Detection limit [mol/l]
Quantification limit [mol/l]
Trichlormethan (TCM) 83 85, 47 4.2·10-9 1.4·10-8 Bromodichloromethane (BDCM)
129 83, 85 1.7·10-9 5.8·10-9
Dibromochloromethane (DBCM)
129 127, 131 5.0·10-9 1.7·10-8
Tribromomethane (TBM) 173 171, 175, 252
5.6·10-10 7.6·10-10
Dichloroacetonitrile (DCAN) 74 76, 84 7.7·10-10 2.6·10-9 Bromochloroacetanotile (BCAN)
76 74, 155 1.9·10-8(* ) 1.9·10-8(* )
Dibromoacetonitrile (DBAN) 120 118, 199 1.1·10-8 1.5·10-8 Trichloroacetonitrile (TCAN) 108 110, 73, 82 1.6·10-8 1.6·10-8 Trichloronitromethane (TCnitro)
117 119, 121, 82 6.1·10-9(* ) 6.1·10-9(* )
Dichloropropanone (DCprop) 63 83 4.9·10-9 1.6·10-8 Trichloropropanone (TCprop) 125 127, 97 8.3·10-11 8.3·10-10
(* ) Detection and quantification limit are given based on the lowest detected standard.
Preparation of standards
For each run a new calibration curve was prepared, with a range of 1 - 100 µg/L and if found necessary it was extended to 0.1 – 200 µg/L. Standard solutions for HANs were made from the EPA 551B Halogenated Volatiles Mix (2000 µg/mL) standard mixture. The THMs

SM page 3
standard solution (2000 µg/mL) was prepared by mixing the 4 individual THMs in methanol, based on their density.
Analysis of Haloacetic Acids
For the analysis of the haloacetic acids a modified version of the EPA 552.2 method was used. To quench the residual chlorine of the samples 200 µL of 50 g/mL sodium sulfite were filled into each P&T vial, following by the addition of 30 mL of sample. The analysis was subdivided into four main steps: extraction, methylation (i.e., derivatization), neutralization and finally analysis in the GC-MS.
In order to extract the haloacetic acids, a stepwise acidification of the water sample with 3 mL of concentrated H2SO4, was performed in order to avoid sudden changes in the solution temperature. In addition, the samples were cooled-down in an ice bath. 100 µL of the surrogate standard, 2-bromobutanoicacid (0.1 g/L in methanol) and approximately 9.5 g of sodium sulfate were added to the samples. Following this, the P&T vials were sealed with a teflon-lined screw cap and were hand-shaken in order to make a saturated salt solution. Finally, 2 mL of MtBE were added to the samples. The samples were then sealed with the caps and placed on a mechanical shaking table for another 30 min.
Following that, time was given, so the two solution phases (water vs. MtBE phase) were separated, so that the MtBE phase can be transferred into a conical tube. The control derivatization standard was prepared by adding 15 µL of the EPA 552.2 standard mix and 100 µL of surrogate standard to 1.5 mL of MtBE. 0.5 mL of acidified methanol (10% H2SO4) was then added to each conical tube. The tubes were tightly sealed with a Teflon-lined screw cap and placed into the oven at 60°C for 2 h.
The tubes were left to cool-down before the caps were removed. The samples were neutralized by adding 2 mL of saturated sodium bicarbonate (50 g NaHCO3 in 400 mL deionized water). After the neutralization the MtBE phase was partly transferred to a GC vial, sealed with a silicone/PTFE screw cap and analyzed at the same day.
The samples were analyzed in a GC-MS (7890 A GC System and 5975 C VLMSD, Agilent Technologies). The compounds were separated in a fused silica capillary column (30 m x 0.25 i.D. 1.5 µm film thickness; VOCOL, Supelco). The carrier gas was helium with a flow rate of 1.3 mL/min. The starting temperature was 45 °C for 1 min and then it increased with a rate of 20 °C/min until 140 °C were reached. Then the temperature rate was reduced to 10 °C/min until 155 °C. The third ramp was set at 5 °C/min until 170 °C were reached, followed by a rate of 15 °C/min until 190 °C. Finally a rate of 40°C/min was used to reach 230°C, which was held for 2 min.
Preparation of standards
For each run a new calibration curve was prepared, with a range of 2 – 100 µg/L and if found necessary it was extended to 200 µg/L. Standard solutions were made from EPA 552.2 Halogenated Acetic Acids Mix (2000 µg/mL each component in methyl tert-butyl ether,
SM page 4
Supelco). The standards were treated like the samples i.e. extracted, derivatized, neutralized and analyzed with the GC-MS.
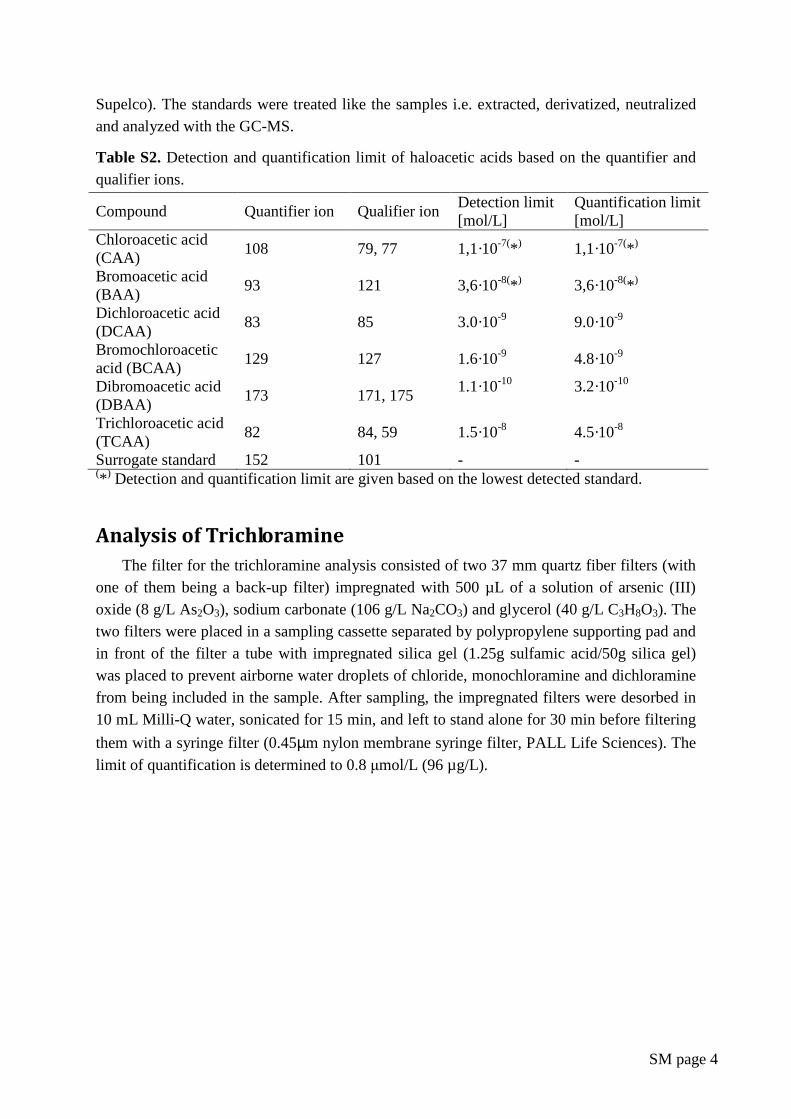
Table S2. Detection and quantification limit of haloacetic acids based on the quantifier and qualifier ions.
Compound Quantifier ion Qualifier ion Detection limit [mol/L]
Quantification limit [mol/L]
Chloroacetic acid (CAA)
108 79, 77 1,1·10-7(* ) 1,1·10-7(* )
Bromoacetic acid (BAA)
93 121 3,6·10-8(* ) 3,6·10-8(* )
Dichloroacetic acid (DCAA)
83 85 3.0·10-9 9.0·10-9
Bromochloroacetic acid (BCAA)
129 127 1.6·10-9 4.8·10-9
Dibromoacetic acid (DBAA)
173 171, 175 1.1·10-10 3.2·10-10
Trichloroacetic acid (TCAA)
82 84, 59 1.5·10-8 4.5·10-8
Surrogate standard 152 101 - - (* ) Detection and quantification limit are given based on the lowest detected standard.
Analysis of Trichloramine
The filter for the trichloramine analysis consisted of two 37 mm quartz fiber filters (with one of them being a back-up filter) impregnated with 500 µL of a solution of arsenic (III) oxide (8 g/L As2O3), sodium carbonate (106 g/L Na2CO3) and glycerol (40 g/L C3H8O3). The two filters were placed in a sampling cassette separated by polypropylene supporting pad and in front of the filter a tube with impregnated silica gel (1.25g sulfamic acid/50g silica gel) was placed to prevent airborne water droplets of chloride, monochloramine and dichloramine from being included in the sample. After sampling, the impregnated filters were desorbed in 10 mL Milli-Q water, sonicated for 15 min, and left to stand alone for 30 min before filtering
them with a syringe filter (0.45µm nylon membrane syringe filter, PALL Life Sciences). The limit of quantification is determined to 0.8 µmol/L (96 µg/L).
SM page 5
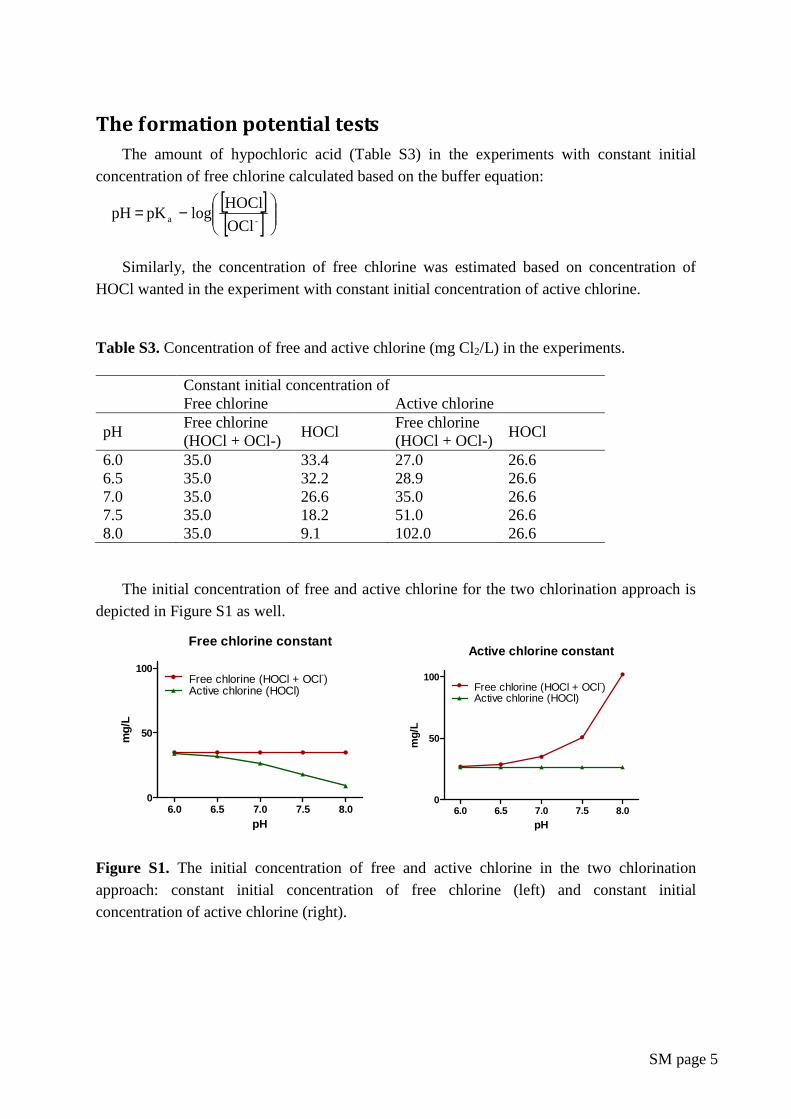
The formation potential tests
The amount of hypochloric acid (Table S3) in the experiments with constant initial concentration of free chlorine calculated based on the buffer equation:
[ ][ ]
−=
-aOCl
HOCllogpK pH
Similarly, the concentration of free chlorine was estimated based on concentration of HOCl wanted in the experiment with constant initial concentration of active chlorine.
Table S3. Concentration of free and active chlorine (mg Cl2/L) in the experiments.
Constant initial concentration of Free chlorine Active chlorine
pH Free chlorine (HOCl + OCl-)
HOCl Free chlorine (HOCl + OCl-)
HOCl
6.0 35.0 33.4 27.0 26.6 6.5 35.0 32.2 28.9 26.6 7.0 35.0 26.6 35.0 26.6 7.5 35.0 18.2 51.0 26.6 8.0 35.0 9.1 102.0 26.6
The initial concentration of free and active chlorine for the two chlorination approach is depicted in Figure S1 as well.
Free chlorine constant
6.0 6.5 7.0 7.5 8.00
50
100Free chlorine (HOCl + OCl-)Active chlorine (HOCl)
pH
mg/
L
Active chlorine constant
6.0 6.5 7.0 7.5 8.00
50
100Free chlorine (HOCl + OCl-)Active chlorine (HOCl)
pH
mg/
L
Figure S1. The initial concentration of free and active chlorine in the two chlorination approach: constant initial concentration of free chlorine (left) and constant initial concentration of active chlorine (right).

SM page 6
Body fluid analogue (BFA)
The compound of the BFA used in the experiments and their concentration are listed Table S4.
Table S4. The composition of the BFA
Compound CAS no. mg/L Sodiumdihydrogenphosphate NaH2PO4 7558-79-4 4300 Ammonium chloride NH4Cl 7664-41-7 2000 Urea NH2CONH2 57-13-6 14800 Creatinine C4H7N3O 60-27-5 1800 Histidine C6H9N3O2 71-00-1 1210 Hippuric acid C9H9NO3 495-69-2 1710 Uric acid C5H4N4O3 69-93-2 490 Citric acid C6H8O7 77-92-9 640
Based on the concentration of each compound and their carbon content the total organic
carbon (TOC) was determined theoretically to 5.73 g/L. This value was used to determine the dose of BFA to achieve 1 mg/L TOC in the experiments.

SM page 7
EC50 values of cyto- and genotoxicity
The EC50 value of cyto- and genotoxicity used for the estimation of sample toxicity are given in Table S3.
Table S5. The EC50 values for cyto- and genotoxicity taken from Plewa et al. (2002), Muellner et al. (2007) and Plewa et al. (2008).
Cytotoxicity EC50 (mol/L)
Genotoxicity EC50 (mol/L)
THM
Trichlormethan (TCM)
9.1·10-3 *
Bromodichloromethane (BDCM)
9.1·10-3 *
Dibromochloromethane (DBCM)
5.2·10-3 *
Tribromomethane (TBM)
4.0·10-3 *
HAN
Dichloroacetonitrile (DCAN)
5.8·10-5 2.8·10-3
Trichloroacetonitrile (TCAN)
1.7·10-4 1.0·10-3
Bromochloroacetanotile (BCAN)
8.4·10-6 3.2·10-4
Dibromoacetonitrile (DBAN)
2.9·10-6 3.0·10-5
HAA
Chloroacetic acid (CAA)
9.0·10-4 4.1·10-4
Bromoacetic acid (BAA)
9.8·10-6 1.6·10-5
Dichloroacetic acid (DCAA)
7.2·10-3 *
Trichloroacetic acid (TCAA)
2.3·10-3 *
Bromochloroacetic acid (BCAA)
8.4·10-4 3.7·10-3
Dibromoacetic acid (DBAA)
5.2·10-4 1.7·10-3
Trichloronitromethane (TCnitro)
5.2·10-4 9.1·10-5
* The compounds were not found genotoxic in the assay used.
References
Muellner,M.G., Wagner,E.D., McCalla,K., Richardson,S.D., Woo,Y.T., and Plewa,M.J. (2007) Haloacetonitriles vs. regulated haloacetic acids: Are nitrogen-containing DBPs more toxic? Environmental Science & Technology 41 (2), 645-651.

SM page 8
Plewa,M.J., Kargalioglu,Y., Vankerk,D., Minear,R.A., and Wagner,E.D. (2002) Mammalian cell cytotoxicity and genotoxicity analysis of drinking water disinfection by-products. Environmental and Molecular Mutagenesis 40 (2), 134-142.
Plewa,M.J., Wagner,E.D., Muellner,M.G., Hsu,K.M., and Richardson,S.D. (2008) Comparative Mammalian Cell Toxicity of N-DBPs and C-DBPs. In: Karanfil T, Krasner SW, and Xie Y (eds), Disinfection By-Products in Drinking Water: Occurrence, Formation, Helth Effects, and Control. 36-50, American Chemical Society, Washington, DC.
Related Documents