Effect of oxygen on the microstructure and hydrogen storage properties of VeTieCreFe quaternary solid solutions Ulrich Ulmer a,* , Kohta Asano b , Thomas Bergfeldt c , Venkata Sai Kiran Chakravadhanula d,e , Roland Dittmeyer f , Hirotoshi Enoki b , Christian Ku ¨ bel a,d,e , Yumiko Nakamura b , Alexander Pohl a , Maximilian Fichtner a,d a Karlsruhe Institute of Technology (KIT), Institute of Nanotechnology, P.O. Box 3640, D-76021 Karlsruhe, Germany b National Institute of Advanced Industrial Science and Technology (AIST), AIST Central-5, 1-1-1 Higashi, Tsukuba, Ibaraki 305-8565, Japan c Karlsruhe Institute of Technology (KIT), Institute of Applied Materials, P.O. Box 3640, D-76021 Karlsruhe, Germany d Karlsruhe Institute of Technology (KIT), Helmholtz Institute Ulm for Electrochemical Energy Storage, Helmhotzstr. 11, 89081 Ulm, Germany e Karlsruhe Nano Micro Facility, Hermann-von-Helmholtz Platz 1, 76344 Eggenstein-Leopoldshafen, Germany f Karlsruhe Institute of Technology (KIT), Institute of Micro Process Engineering, P.O. Box 3640, D-76021 Karlsruhe, Germany article info Article history: Received 12 June 2014 Received in revised form 8 August 2014 Accepted 19 August 2014 Available online 22 October 2014 Keywords: BCC alloys Hydrogen storage Oxygen effect abstract The effect of low (<300 ppm O) and high (10,000 ppm O) residual oxygen concentration in vanadium raw metals on the microstructure and hydrogenation properties of V 40 Fe 8 T- i 26 Cr 26 , was investigated by means of XRD, SEM, TEM and pressure-composition isotherms. A high oxygen concentration in the vanadium raw metal led to the formation of an oxygen- rich secondary phase isostructural with a-Ti. The lattice parameter of the BCC main phase of the high-oxygen sample was reduced to 3.0141 (3) A ˚ compared to 3.0308 (2) A ˚ for the low- oxygen sample. As a result of the high oxygen content the equilibrium hydrogen pressure of the material was increased from 1 MPa to 4 MPa. Deoxidization through the addition of 1 at% rare earth metal could be achieved. The lattice constant of the deoxidized sample was 3.0297 (3) A ˚ , and the thermodynamic properties were also the same as in case of the low-oxygen sample. Copyright © 2014, Hydrogen Energy Publications, LLC. Published by Elsevier Ltd. All rights reserved. * Corresponding author. Tel.: þ49 (0) 721 608 22680; fax: þ49 (0) 721 608 26368. E-mail address: [email protected] (U. Ulmer). Available online at www.sciencedirect.com ScienceDirect journal homepage: www.elsevier.com/locate/he international journal of hydrogen energy 39 (2014) 20000 e20008 http://dx.doi.org/10.1016/j.ijhydene.2014.08.152 0360-3199/Copyright © 2014, Hydrogen Energy Publications, LLC. Published by Elsevier Ltd. All rights reserved.

Welcome message from author
This document is posted to help you gain knowledge. Please leave a comment to let me know what you think about it! Share it to your friends and learn new things together.
Transcript
ww.sciencedirect.com
i n t e rn a t i o n a l j o u r n a l o f h y d r o g e n en e r g y 3 9 ( 2 0 1 4 ) 2 0 0 0 0e2 0 0 0 8
Available online at w
ScienceDirect
journal homepage: www.elsevier .com/locate/he
Effect of oxygen on the microstructure andhydrogen storage properties of VeTieCreFequaternary solid solutions
Ulrich Ulmer a,*, Kohta Asano b, Thomas Bergfeldt c,Venkata Sai Kiran Chakravadhanula d,e, Roland Dittmeyer f,Hirotoshi Enoki b, Christian Kubel a,d,e, Yumiko Nakamura b,Alexander Pohl a, Maximilian Fichtner a,d
a Karlsruhe Institute of Technology (KIT), Institute of Nanotechnology, P.O. Box 3640, D-76021 Karlsruhe, Germanyb National Institute of Advanced Industrial Science and Technology (AIST), AIST Central-5, 1-1-1 Higashi, Tsukuba,
Ibaraki 305-8565, Japanc Karlsruhe Institute of Technology (KIT), Institute of Applied Materials, P.O. Box 3640, D-76021 Karlsruhe, Germanyd Karlsruhe Institute of Technology (KIT), Helmholtz Institute Ulm for Electrochemical Energy Storage,
Helmhotzstr. 11, 89081 Ulm, Germanye Karlsruhe Nano Micro Facility, Hermann-von-Helmholtz Platz 1, 76344 Eggenstein-Leopoldshafen, Germanyf Karlsruhe Institute of Technology (KIT), Institute of Micro Process Engineering, P.O. Box 3640, D-76021 Karlsruhe,
Germany
a r t i c l e i n f o
Article history:
Received 12 June 2014
Received in revised form
8 August 2014
Accepted 19 August 2014
Available online 22 October 2014
Keywords:
BCC alloys
Hydrogen storage
Oxygen effect
* Corresponding author. Tel.: þ49 (0) 721 608E-mail address: [email protected] (U.
http://dx.doi.org/10.1016/j.ijhydene.2014.08.10360-3199/Copyright © 2014, Hydrogen Energ
a b s t r a c t
The effect of low (<300 ppm O) and high (10,000 ppm O) residual oxygen concentration in
vanadium raw metals on the microstructure and hydrogenation properties of V40Fe8T-
i26Cr26, was investigated by means of XRD, SEM, TEM and pressure-composition isotherms.
A high oxygen concentration in the vanadium raw metal led to the formation of an oxygen-
rich secondary phase isostructural with a-Ti. The lattice parameter of the BCC main phase
of the high-oxygen sample was reduced to 3.0141 (3) A compared to 3.0308 (2) A for the low-
oxygen sample. As a result of the high oxygen content the equilibrium hydrogen pressure
of the material was increased from 1 MPa to 4 MPa. Deoxidization through the addition of
1 at% rare earth metal could be achieved. The lattice constant of the deoxidized sample
was 3.0297 (3) A, and the thermodynamic properties were also the same as in case of the
low-oxygen sample.
Copyright © 2014, Hydrogen Energy Publications, LLC. Published by Elsevier Ltd. All rights
reserved.
22680; fax: þ49 (0) 721 608 26368.Ulmer).52y Publications, LLC. Published by Elsevier Ltd. All rights reserved.
i n t e r n a t i o n a l j o u r n a l o f h y d r o g e n en e r g y 3 9 ( 2 0 1 4 ) 2 0 0 0 0e2 0 0 0 8 20001
Introduction
The utilization of hydrogen storage materials provides a
compact, safe, and energy efficient method of hydrogen
storage for stationary and mobile applications [1]. For sta-
tionary hydrogen storage applications, the gravimetric
hydrogen density is less crucial than for mobile applications,
however, candidate hydridesmust satisfy a number of criteria
for successful utilization such as H-storage capacity >1 mass
%, low cost (both materials and processing), fast kinetics,
durability during pressure/temperature swing cycles, safety
and low toxicity, resistance to contamination and common
impurities and minimal demands for hydride sorbent bed
activation [2].
The volumetric hydrogen density of common intermetallic
AB-, AB2- and AB5-type alloys is high (around 60 kg/m3), while
their gravimetric hydrogen density does not exceed 2 mass%
H [3]. Gravimetric capacities of >2 mass% H at ambient tem-
perature and pressure conditions are achieved only with
vanadium-based alloys with a body centred cubic (BCC) crys-
tal structure [4e6]. However, hydrogenation reactions of BCC
alloys exhibit two plateau regions. In the lower plateau region
up to a hydrogen content of ~1.2e1.5mass%, themonohydride
is formed: M þ H / MH1, where M stands for metal and H
stands for hydrogen. This region typically shows a very low
equilibrium pressure of <1 kPa at ambient temperature. The
second plateau region begins at ~1.5 mass% where the dihy-
dride is formed: MH1 þ H / MH2. A total capacity of up to
4.37 mass% for both pressure plateaus has been reported [7].
At ambient temperature and pressure conditions, only the
formation/dissociation of the dihydride is useful for hydrogen
storage, with reversible capacities typically ranging between
1.7 and 2.6 mass%.
High raw material costs, especially for vanadium, hinder
the commercial application of V-based hydrogen storage
materials with BCC structure. The development of ternary or
quaternary alloys has considerably decreased the material
cost through the partial substitution of expensive rawmetals,
e.g. V (390 US $/kg) or Ti (35 US $/kg), by cheaper raw metals,
such as Mn (4 US $/kg) or Fe (1 US $/kg) [8e10]. In order to
further decrease the cost of V, several researchers have
attempted to replace V by a ferrovanadium master alloy
[11e13]. Another strategy to reduce the price of V is to use low-
purity V containing impurities [14,15].
The effect of impurities on the microstructure and
hydrogen storage properties of BCC alloys has been reported
by various authors [16e22]. Nakamura et al. recently reported
a high oxygen concentration of 10,000 mass-ppm in the V raw
metal to raise the second plateau of a VeTieMn alloy
compared to the alloy prepared with low oxygen V (300 mass-
ppm O) [23]. The thermodynamic characteristics of the lower
plateau of the high oxygen containing alloy were essentially
the same as those of the low oxygen alloy. This behaviour was
attributed to two origins, the primary and the secondary ox-
ygen effect. The primary effect was related to oxygen atoms
dissolving in the BCC main phase and interacting with
hydrogen. The secondary effect was related to the formation
of a secondary, oxygen rich phase. Oxygen reacts with ele-
ments showing a high affinity towards oxygen, e.g. Ti, which
promotes the formation of a secondary phase. The composi-
tion of the BCC main phase is hereby changed, altering the
microstructure and thermodynamic properties of the alloy
[22]. A detailed analysis of the forming phases has not been
provided yet.
In this paper, the effect of oxygen on the microstructure,
hydrogen storage characteristics and thermodynamics of a
quaternary VeTieCreFe alloy is investigated. The negative
effect of oxygen on the structure and hydrogenation proper-
ties can be circumvented through the addition of 1 at% rare
earth metal, which is in agreement with the results published
by Mi et al. [24].
Experimental
Three different types of alloys were prepared by arcmelting in
a water-cooled copper crucible using two V materials of
differing oxygen concentration (low oxygen: <300 ppmO; high
oxygen: <10,000 ppm O), Ti, Fe, Cr and rare earth (La, Y or Ce)
materials (purity > 99.9%). One sample was prepared with low
oxygen V, one sample with high oxygen V and one sample
with high oxygen vanadium and 1 at% of rare earth metal (La,
Y or Ce). Rare earth metal oxides agglomerated mainly at the
ingot's surfaces and could be easily removed by grinding.
Special care was taken during the preparation of the alloys to
avoid contamination with impurities such as oxygen or
nitrogen.
The oxygen content was analysed by carrier gas hot
extraction (CGHE). A commercial oxygen/nitrogen analyser
TC600 (LECO) was used which was calibrated with dried Fe
powder (JK47) and verified with a standard from LECO (502-
201) and a standard from Alpha Resources (AR 640-ZR702B).
The calibration range was close to the concentration of the
samples. The standard oxides and the samples were weighed
with a mass in the range from 50 to 300 mg (weighing
accuracy ±0.002mg) in Sn crucibles (9e10 mm). Together with
a nickel capsule (about 500 mg), which served as fusion aid,
the package was put into an outgassed (outgassing power:
6300 W) high temperature graphite crucible. The measure-
ments were performed at 5800W heating power. The evolving
gases CO2 and CO were swept out by helium as inert carrier
gas and measured by infrared detectors. The oxygen concen-
tration of each material was measured three times, and an
average value was calculated.
The alloy morphology and composition was analysed by
SEM (S3400-N, Hitachi) and EDX spectroscopy (GENESIS 2000H,
EDAX). According to the manufacturer, the accuracy of the
compositions as determined by EDX was ±0.5 at%. Average
compositions were determined at three different spots of the
ingots: at the edge (x1z r), at the centre (x2¼ 0$r) and at a third
spot between those two points (x3 z 1/2$r). They were deter-
mined by collecting EDX spectra of an area of approximately
100 � 100 mm and are referred to in the text as average
composition. In addition, the compositions of individual
points within the different phases were also determined by
collecting EDX point spectra. These are the relative concen-
trations referred to in Table 1.
TEM samples were prepared by focused Gaþ-ion beam
milling using a Strata 400 A (FEI Company) with the final
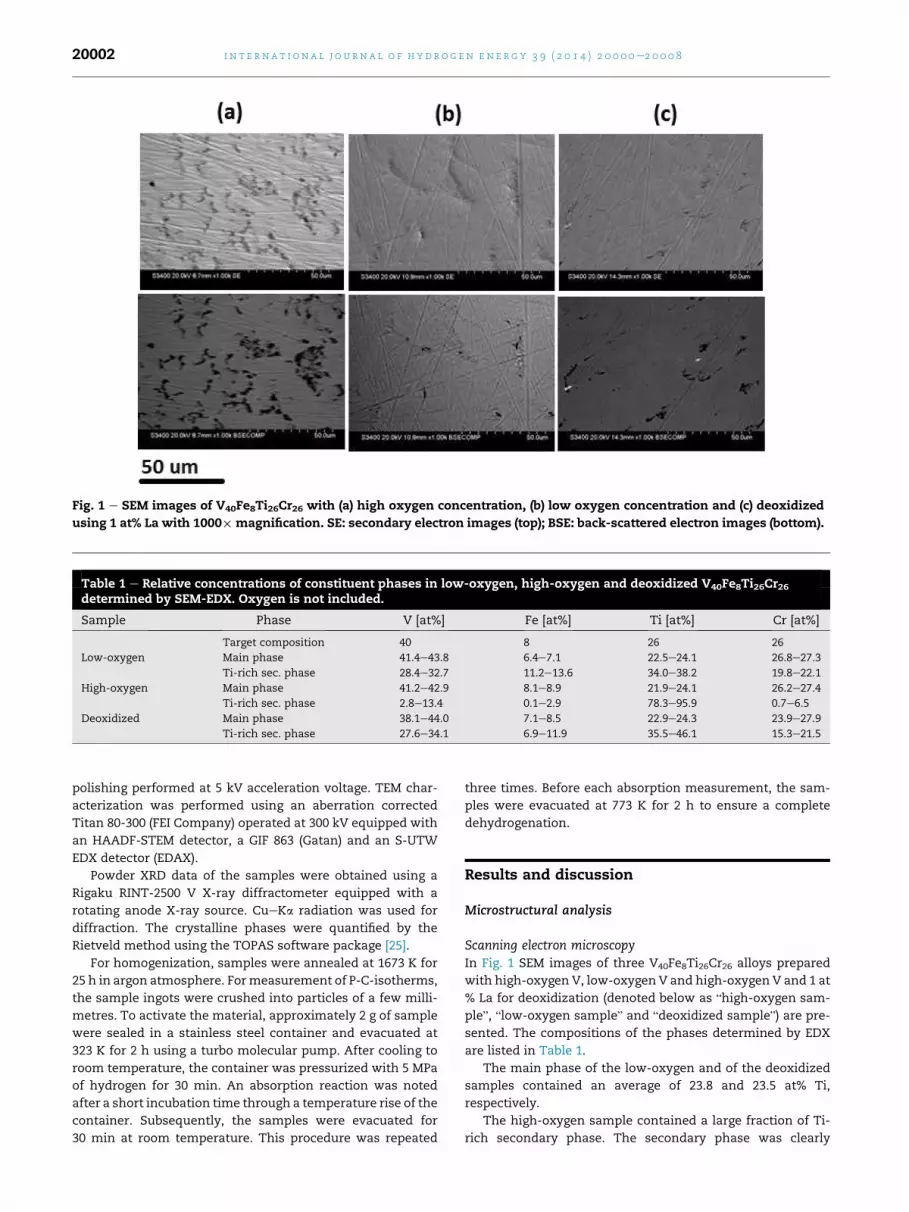
Fig. 1 e SEM images of V40Fe8Ti26Cr26 with (a) high oxygen concentration, (b) low oxygen concentration and (c) deoxidized
using 1 at% La with 1000£ magnification. SE: secondary electron images (top); BSE: back-scattered electron images (bottom).
Table 1 e Relative concentrations of constituent phases in low-oxygen, high-oxygen and deoxidized V40Fe8Ti26Cr26determined by SEM-EDX. Oxygen is not included.
Sample Phase V [at%] Fe [at%] Ti [at%] Cr [at%]
Target composition 40 8 26 26
Low-oxygen Main phase 41.4e43.8 6.4e7.1 22.5e24.1 26.8e27.3
Ti-rich sec. phase 28.4e32.7 11.2e13.6 34.0e38.2 19.8e22.1
High-oxygen Main phase 41.2e42.9 8.1e8.9 21.9e24.1 26.2e27.4
Ti-rich sec. phase 2.8e13.4 0.1e2.9 78.3e95.9 0.7e6.5
Deoxidized Main phase 38.1e44.0 7.1e8.5 22.9e24.3 23.9e27.9
Ti-rich sec. phase 27.6e34.1 6.9e11.9 35.5e46.1 15.3e21.5
i n t e rn a t i o n a l j o u r n a l o f h y d r o g e n en e r g y 3 9 ( 2 0 1 4 ) 2 0 0 0 0e2 0 0 0 820002
polishing performed at 5 kV acceleration voltage. TEM char-
acterization was performed using an aberration corrected
Titan 80-300 (FEI Company) operated at 300 kV equipped with
an HAADF-STEM detector, a GIF 863 (Gatan) and an S-UTW
EDX detector (EDAX).
Powder XRD data of the samples were obtained using a
Rigaku RINT-2500 V X-ray diffractometer equipped with a
rotating anode X-ray source. CueKa radiation was used for
diffraction. The crystalline phases were quantified by the
Rietveld method using the TOPAS software package [25].
For homogenization, samples were annealed at 1673 K for
25 h in argon atmosphere. Formeasurement of P-C-isotherms,
the sample ingots were crushed into particles of a few milli-
metres. To activate the material, approximately 2 g of sample
were sealed in a stainless steel container and evacuated at
323 K for 2 h using a turbo molecular pump. After cooling to
room temperature, the container was pressurized with 5 MPa
of hydrogen for 30 min. An absorption reaction was noted
after a short incubation time through a temperature rise of the
container. Subsequently, the samples were evacuated for
30 min at room temperature. This procedure was repeated
three times. Before each absorption measurement, the sam-
ples were evacuated at 773 K for 2 h to ensure a complete
dehydrogenation.
Results and discussion
Microstructural analysis
Scanning electron microscopyIn Fig. 1 SEM images of three V40Fe8Ti26Cr26 alloys prepared
with high-oxygen V, low-oxygen V and high-oxygen V and 1 at
% La for deoxidization (denoted below as “high-oxygen sam-
ple”, “low-oxygen sample” and “deoxidized sample”) are pre-
sented. The compositions of the phases determined by EDX
are listed in Table 1.
The main phase of the low-oxygen and of the deoxidized
samples contained an average of 23.8 and 23.5 at% Ti,
respectively.
The high-oxygen sample contained a large fraction of Ti-
rich secondary phase. The secondary phase was clearly
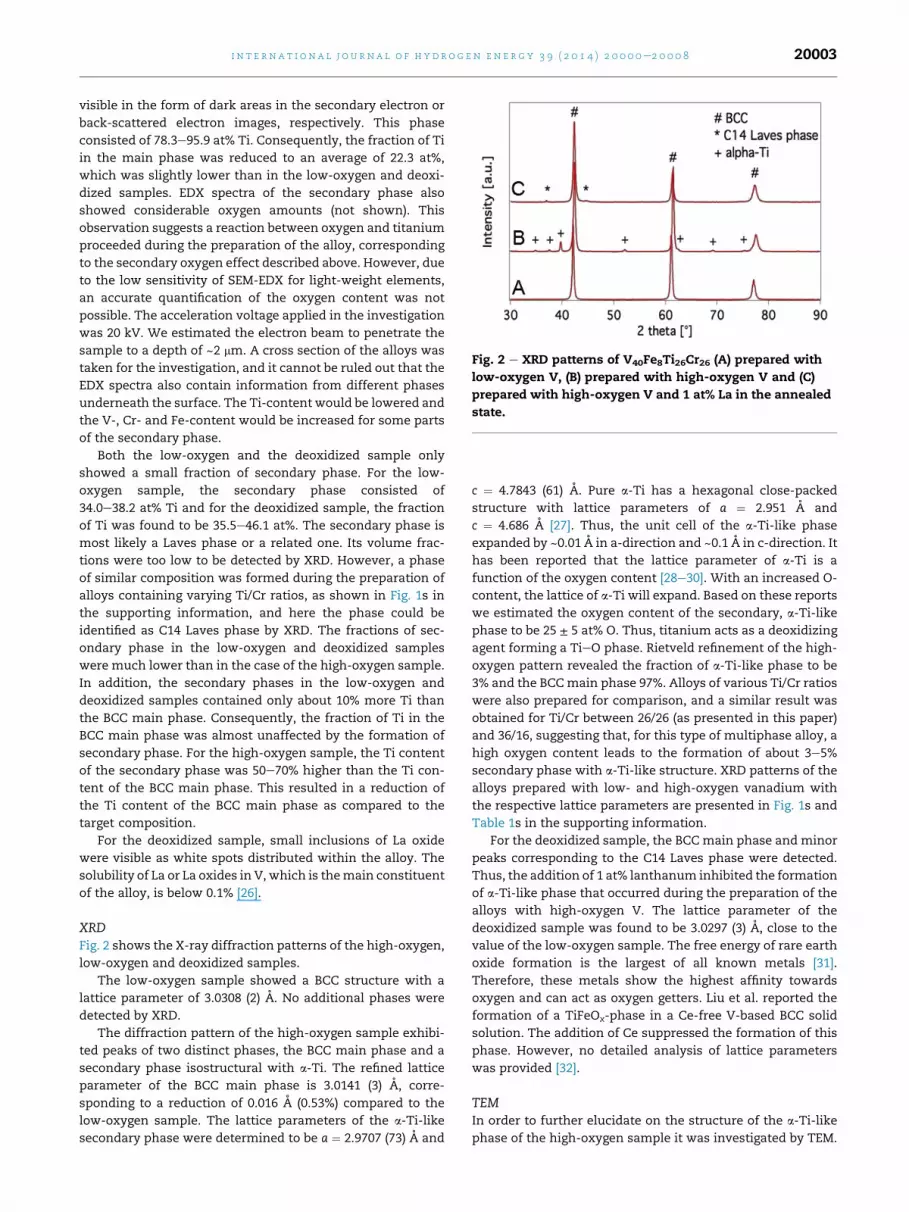
Fig. 2 e XRD patterns of V40Fe8Ti26Cr26 (A) prepared with
low-oxygen V, (B) prepared with high-oxygen V and (C)
prepared with high-oxygen V and 1 at% La in the annealed
state.
i n t e r n a t i o n a l j o u r n a l o f h y d r o g e n en e r g y 3 9 ( 2 0 1 4 ) 2 0 0 0 0e2 0 0 0 8 20003
visible in the form of dark areas in the secondary electron or
back-scattered electron images, respectively. This phase
consisted of 78.3e95.9 at% Ti. Consequently, the fraction of Ti
in the main phase was reduced to an average of 22.3 at%,
which was slightly lower than in the low-oxygen and deoxi-
dized samples. EDX spectra of the secondary phase also
showed considerable oxygen amounts (not shown). This
observation suggests a reaction between oxygen and titanium
proceeded during the preparation of the alloy, corresponding
to the secondary oxygen effect described above. However, due
to the low sensitivity of SEM-EDX for light-weight elements,
an accurate quantification of the oxygen content was not
possible. The acceleration voltage applied in the investigation
was 20 kV. We estimated the electron beam to penetrate the
sample to a depth of ~2 mm. A cross section of the alloys was
taken for the investigation, and it cannot be ruled out that the
EDX spectra also contain information from different phases
underneath the surface. The Ti-content would be lowered and
the V-, Cr- and Fe-content would be increased for some parts
of the secondary phase.
Both the low-oxygen and the deoxidized sample only
showed a small fraction of secondary phase. For the low-
oxygen sample, the secondary phase consisted of
34.0e38.2 at% Ti and for the deoxidized sample, the fraction
of Ti was found to be 35.5e46.1 at%. The secondary phase is
most likely a Laves phase or a related one. Its volume frac-
tions were too low to be detected by XRD. However, a phase
of similar composition was formed during the preparation of
alloys containing varying Ti/Cr ratios, as shown in Fig. 1s in
the supporting information, and here the phase could be
identified as C14 Laves phase by XRD. The fractions of sec-
ondary phase in the low-oxygen and deoxidized samples
were much lower than in the case of the high-oxygen sample.
In addition, the secondary phases in the low-oxygen and
deoxidized samples contained only about 10% more Ti than
the BCC main phase. Consequently, the fraction of Ti in the
BCC main phase was almost unaffected by the formation of
secondary phase. For the high-oxygen sample, the Ti content
of the secondary phase was 50e70% higher than the Ti con-
tent of the BCC main phase. This resulted in a reduction of
the Ti content of the BCC main phase as compared to the
target composition.
For the deoxidized sample, small inclusions of La oxide
were visible as white spots distributed within the alloy. The
solubility of La or La oxides in V, which is themain constituent
of the alloy, is below 0.1% [26].
XRDFig. 2 shows the X-ray diffraction patterns of the high-oxygen,
low-oxygen and deoxidized samples.
The low-oxygen sample showed a BCC structure with a
lattice parameter of 3.0308 (2) A. No additional phases were
detected by XRD.
The diffraction pattern of the high-oxygen sample exhibi-
ted peaks of two distinct phases, the BCC main phase and a
secondary phase isostructural with a-Ti. The refined lattice
parameter of the BCC main phase is 3.0141 (3) A, corre-
sponding to a reduction of 0.016 A (0.53%) compared to the
low-oxygen sample. The lattice parameters of the a-Ti-like
secondary phase were determined to be a ¼ 2.9707 (73) A and
c ¼ 4.7843 (61) A. Pure a-Ti has a hexagonal close-packed
structure with lattice parameters of a ¼ 2.951 A and
c ¼ 4.686 A [27]. Thus, the unit cell of the a-Ti-like phase
expanded by ~0.01 A in a-direction and ~0.1 A in c-direction. It
has been reported that the lattice parameter of a-Ti is a
function of the oxygen content [28e30]. With an increased O-
content, the lattice of a-Ti will expand. Based on these reports
we estimated the oxygen content of the secondary, a-Ti-like
phase to be 25 ± 5 at% O. Thus, titanium acts as a deoxidizing
agent forming a TieO phase. Rietveld refinement of the high-
oxygen pattern revealed the fraction of a-Ti-like phase to be
3% and the BCCmain phase 97%. Alloys of various Ti/Cr ratios
were also prepared for comparison, and a similar result was
obtained for Ti/Cr between 26/26 (as presented in this paper)
and 36/16, suggesting that, for this type of multiphase alloy, a
high oxygen content leads to the formation of about 3e5%
secondary phase with a-Ti-like structure. XRD patterns of the
alloys prepared with low- and high-oxygen vanadium with
the respective lattice parameters are presented in Fig. 1s and
Table 1s in the supporting information.
For the deoxidized sample, the BCCmain phase and minor
peaks corresponding to the C14 Laves phase were detected.
Thus, the addition of 1 at% lanthanum inhibited the formation
of a-Ti-like phase that occurred during the preparation of the
alloys with high-oxygen V. The lattice parameter of the
deoxidized sample was found to be 3.0297 (3) A, close to the
value of the low-oxygen sample. The free energy of rare earth
oxide formation is the largest of all known metals [31].
Therefore, these metals show the highest affinity towards
oxygen and can act as oxygen getters. Liu et al. reported the
formation of a TiFeOx-phase in a Ce-free V-based BCC solid
solution. The addition of Ce suppressed the formation of this
phase. However, no detailed analysis of lattice parameters
was provided [32].
TEMIn order to further elucidate on the structure of the a-Ti-like
phase of the high-oxygen sample it was investigated by TEM.
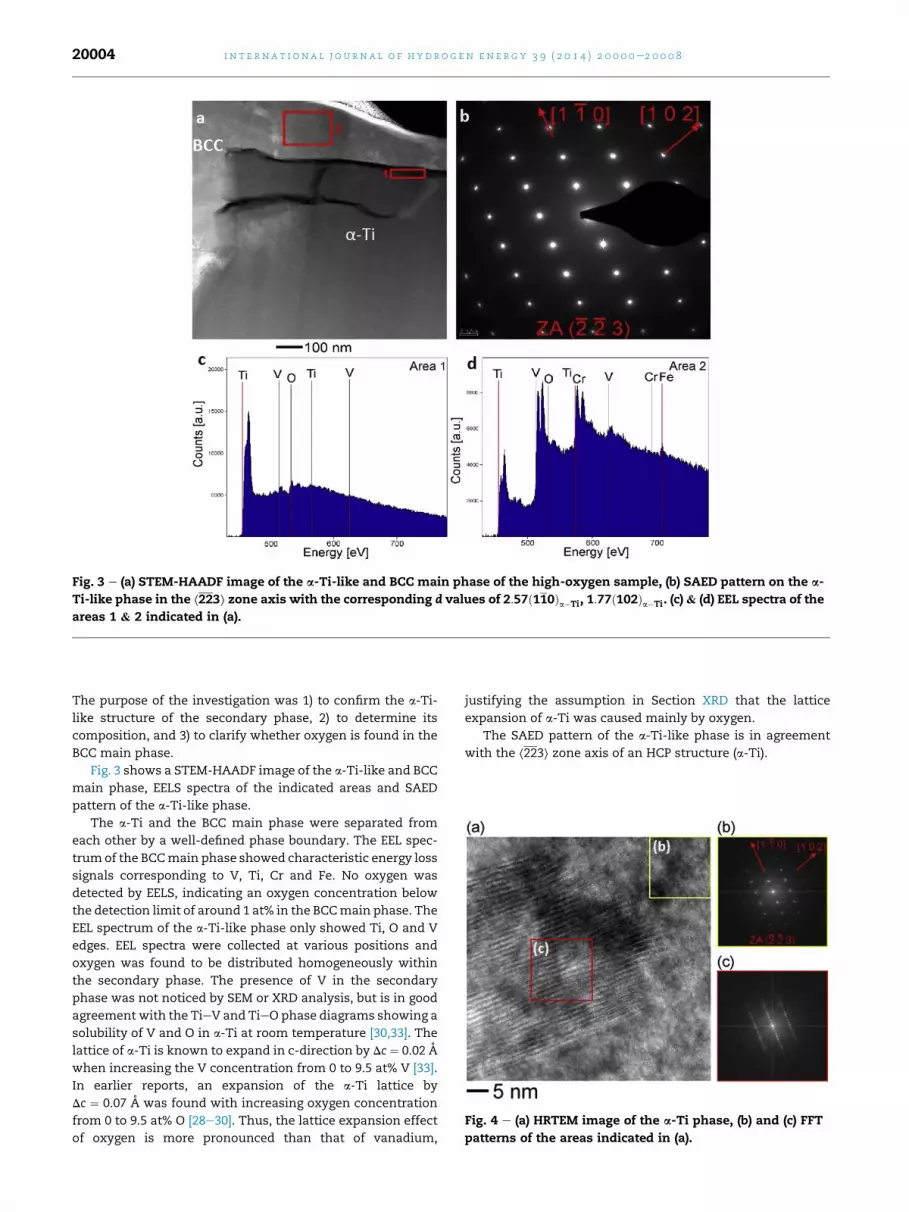
Fig. 3 e (a) STEM-HAADF image of the a-Ti-like and BCC main phase of the high-oxygen sample, (b) SAED pattern on the a-
Ti-like phase in the ⟨223⟩ zone axis with the corresponding d values of 2:57ð110Þa�Ti, 1:77ð102Þa�Ti. (c) & (d) EEL spectra of the
areas 1 & 2 indicated in (a).
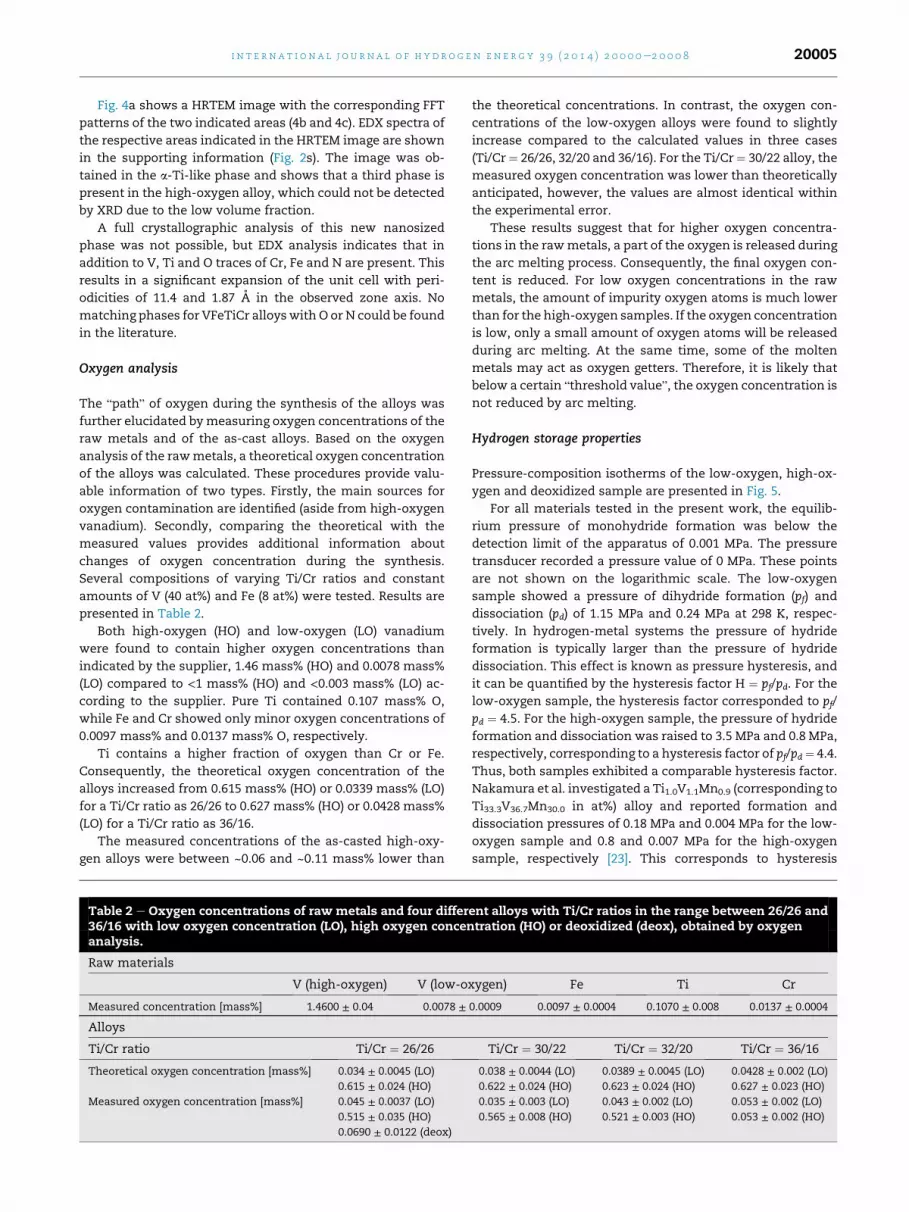
Fig. 4 e (a) HRTEM image of the a-Ti phase, (b) and (c) FFT
patterns of the areas indicated in (a).
i n t e rn a t i o n a l j o u r n a l o f h y d r o g e n en e r g y 3 9 ( 2 0 1 4 ) 2 0 0 0 0e2 0 0 0 820004
The purpose of the investigation was 1) to confirm the a-Ti-
like structure of the secondary phase, 2) to determine its
composition, and 3) to clarify whether oxygen is found in the
BCC main phase.
Fig. 3 shows a STEM-HAADF image of the a-Ti-like and BCC
main phase, EELS spectra of the indicated areas and SAED
pattern of the a-Ti-like phase.
The a-Ti and the BCC main phase were separated from
each other by a well-defined phase boundary. The EEL spec-
trumof the BCCmain phase showed characteristic energy loss
signals corresponding to V, Ti, Cr and Fe. No oxygen was
detected by EELS, indicating an oxygen concentration below
the detection limit of around 1 at% in the BCCmain phase. The
EEL spectrum of the a-Ti-like phase only showed Ti, O and V
edges. EEL spectra were collected at various positions and
oxygen was found to be distributed homogeneously within
the secondary phase. The presence of V in the secondary
phase was not noticed by SEM or XRD analysis, but is in good
agreement with the TieV and TieO phase diagrams showing a
solubility of V and O in a-Ti at room temperature [30,33]. The
lattice of a-Ti is known to expand in c-direction by Dc ¼ 0.02 A
when increasing the V concentration from 0 to 9.5 at% V [33].
In earlier reports, an expansion of the a-Ti lattice by
Dc ¼ 0.07 A was found with increasing oxygen concentration
from 0 to 9.5 at% O [28e30]. Thus, the lattice expansion effect
of oxygen is more pronounced than that of vanadium,
justifying the assumption in Section XRD that the lattice
expansion of a-Ti was caused mainly by oxygen.
The SAED pattern of the a-Ti-like phase is in agreement
with the ⟨223⟩ zone axis of an HCP structure (a-Ti).
i n t e r n a t i o n a l j o u r n a l o f h y d r o g e n en e r g y 3 9 ( 2 0 1 4 ) 2 0 0 0 0e2 0 0 0 8 20005
Fig. 4a shows a HRTEM image with the corresponding FFT
patterns of the two indicated areas (4b and 4c). EDX spectra of
the respective areas indicated in the HRTEM image are shown
in the supporting information (Fig. 2s). The image was ob-
tained in the a-Ti-like phase and shows that a third phase is
present in the high-oxygen alloy, which could not be detected
by XRD due to the low volume fraction.
A full crystallographic analysis of this new nanosized
phase was not possible, but EDX analysis indicates that in
addition to V, Ti and O traces of Cr, Fe and N are present. This
results in a significant expansion of the unit cell with peri-
odicities of 11.4 and 1.87 A in the observed zone axis. No
matching phases for VFeTiCr alloyswith O or N could be found
in the literature.
Oxygen analysis
The “path” of oxygen during the synthesis of the alloys was
further elucidated bymeasuring oxygen concentrations of the
raw metals and of the as-cast alloys. Based on the oxygen
analysis of the rawmetals, a theoretical oxygen concentration
of the alloys was calculated. These procedures provide valu-
able information of two types. Firstly, the main sources for
oxygen contamination are identified (aside from high-oxygen
vanadium). Secondly, comparing the theoretical with the
measured values provides additional information about
changes of oxygen concentration during the synthesis.
Several compositions of varying Ti/Cr ratios and constant
amounts of V (40 at%) and Fe (8 at%) were tested. Results are
presented in Table 2.
Both high-oxygen (HO) and low-oxygen (LO) vanadium
were found to contain higher oxygen concentrations than
indicated by the supplier, 1.46 mass% (HO) and 0.0078 mass%
(LO) compared to <1 mass% (HO) and <0.003 mass% (LO) ac-
cording to the supplier. Pure Ti contained 0.107 mass% O,
while Fe and Cr showed only minor oxygen concentrations of
0.0097 mass% and 0.0137 mass% O, respectively.
Ti contains a higher fraction of oxygen than Cr or Fe.
Consequently, the theoretical oxygen concentration of the
alloys increased from 0.615 mass% (HO) or 0.0339 mass% (LO)
for a Ti/Cr ratio as 26/26 to 0.627 mass% (HO) or 0.0428 mass%
(LO) for a Ti/Cr ratio as 36/16.
The measured concentrations of the as-casted high-oxy-
gen alloys were between ~0.06 and ~0.11 mass% lower than
Table 2 e Oxygen concentrations of raw metals and four differ36/16 with low oxygen concentration (LO), high oxygen concenanalysis.
Raw materials
V (high-oxygen) V (low-o
Measured concentration [mass%] 1.4600 ± 0.04 0.0078 ±
Alloys
Ti/Cr ratio Ti/Cr ¼ 26/26
Theoretical oxygen concentration [mass%] 0.034 ± 0.0045 (LO)
0.615 ± 0.024 (HO)
Measured oxygen concentration [mass%] 0.045 ± 0.0037 (LO)
0.515 ± 0.035 (HO)
0.0690 ± 0.0122 (deox)
the theoretical concentrations. In contrast, the oxygen con-
centrations of the low-oxygen alloys were found to slightly
increase compared to the calculated values in three cases
(Ti/Cr¼ 26/26, 32/20 and 36/16). For the Ti/Cr¼ 30/22 alloy, the
measured oxygen concentration was lower than theoretically
anticipated, however, the values are almost identical within
the experimental error.
These results suggest that for higher oxygen concentra-
tions in the rawmetals, a part of the oxygen is released during
the arc melting process. Consequently, the final oxygen con-
tent is reduced. For low oxygen concentrations in the raw
metals, the amount of impurity oxygen atoms is much lower
than for the high-oxygen samples. If the oxygen concentration
is low, only a small amount of oxygen atoms will be released
during arc melting. At the same time, some of the molten
metals may act as oxygen getters. Therefore, it is likely that
below a certain “threshold value”, the oxygen concentration is
not reduced by arc melting.
Hydrogen storage properties
Pressure-composition isotherms of the low-oxygen, high-ox-
ygen and deoxidized sample are presented in Fig. 5.
For all materials tested in the present work, the equilib-
rium pressure of monohydride formation was below the
detection limit of the apparatus of 0.001 MPa. The pressure
transducer recorded a pressure value of 0 MPa. These points
are not shown on the logarithmic scale. The low-oxygen
sample showed a pressure of dihydride formation (pf) and
dissociation (pd) of 1.15 MPa and 0.24 MPa at 298 K, respec-
tively. In hydrogen-metal systems the pressure of hydride
formation is typically larger than the pressure of hydride
dissociation. This effect is known as pressure hysteresis, and
it can be quantified by the hysteresis factor H ¼ pf/pd. For the
low-oxygen sample, the hysteresis factor corresponded to pf/
pd ¼ 4.5. For the high-oxygen sample, the pressure of hydride
formation and dissociation was raised to 3.5 MPa and 0.8 MPa,
respectively, corresponding to a hysteresis factor of pf/pd¼ 4.4.
Thus, both samples exhibited a comparable hysteresis factor.
Nakamura et al. investigated a Ti1.0V1.1Mn0.9 (corresponding to
Ti33.3V36.7Mn30.0 in at%) alloy and reported formation and
dissociation pressures of 0.18 MPa and 0.004 MPa for the low-
oxygen sample and 0.8 and 0.007 MPa for the high-oxygen
sample, respectively [23]. This corresponds to hysteresis
ent alloys with Ti/Cr ratios in the range between 26/26 andtration (HO) or deoxidized (deox), obtained by oxygen
xygen) Fe Ti Cr
0.0009 0.0097 ± 0.0004 0.1070 ± 0.008 0.0137 ± 0.0004
Ti/Cr ¼ 30/22 Ti/Cr ¼ 32/20 Ti/Cr ¼ 36/16
0.038 ± 0.0044 (LO) 0.0389 ± 0.0045 (LO) 0.0428 ± 0.002 (LO)
0.622 ± 0.024 (HO) 0.623 ± 0.024 (HO) 0.627 ± 0.023 (HO)
0.035 ± 0.003 (LO) 0.043 ± 0.002 (LO) 0.053 ± 0.002 (LO)
0.565 ± 0.008 (HO) 0.521 ± 0.003 (HO) 0.053 ± 0.002 (HO)
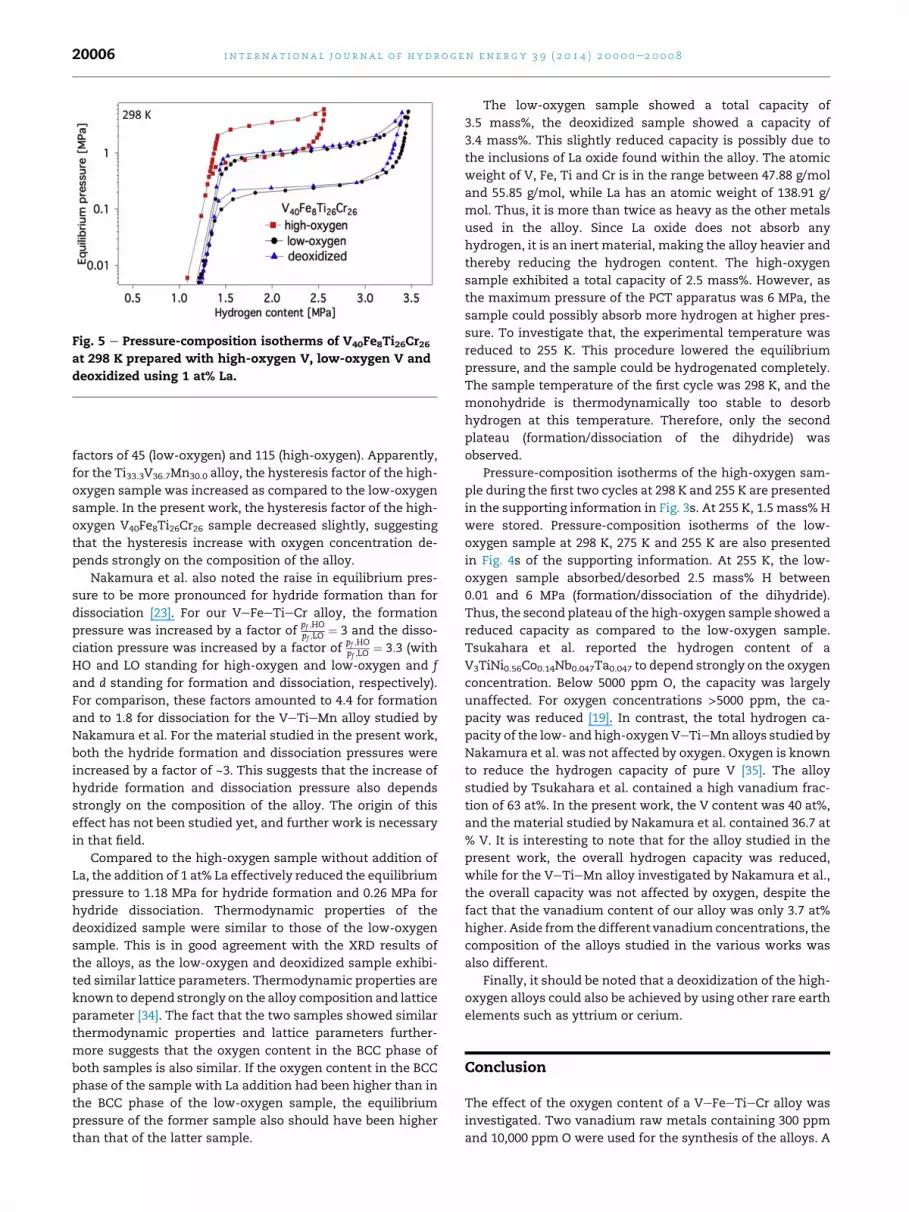
Fig. 5 e Pressure-composition isotherms of V40Fe8Ti26Cr26at 298 K prepared with high-oxygen V, low-oxygen V and
deoxidized using 1 at% La.
i n t e rn a t i o n a l j o u r n a l o f h y d r o g e n en e r g y 3 9 ( 2 0 1 4 ) 2 0 0 0 0e2 0 0 0 820006
factors of 45 (low-oxygen) and 115 (high-oxygen). Apparently,
for the Ti33.3V36.7Mn30.0 alloy, the hysteresis factor of the high-
oxygen sample was increased as compared to the low-oxygen
sample. In the present work, the hysteresis factor of the high-
oxygen V40Fe8Ti26Cr26 sample decreased slightly, suggesting
that the hysteresis increase with oxygen concentration de-
pends strongly on the composition of the alloy.
Nakamura et al. also noted the raise in equilibrium pres-
sure to be more pronounced for hydride formation than for
dissociation [23]. For our VeFeeTieCr alloy, the formation
pressure was increased by a factor ofpf ;HOpf ;LO
¼ 3 and the disso-
ciation pressure was increased by a factor ofpf ;HOpf ;LO
¼ 3:3 (with
HO and LO standing for high-oxygen and low-oxygen and f
and d standing for formation and dissociation, respectively).
For comparison, these factors amounted to 4.4 for formation
and to 1.8 for dissociation for the VeTieMn alloy studied by
Nakamura et al. For the material studied in the present work,
both the hydride formation and dissociation pressures were
increased by a factor of ~3. This suggests that the increase of
hydride formation and dissociation pressure also depends
strongly on the composition of the alloy. The origin of this
effect has not been studied yet, and further work is necessary
in that field.
Compared to the high-oxygen sample without addition of
La, the addition of 1 at% La effectively reduced the equilibrium
pressure to 1.18 MPa for hydride formation and 0.26 MPa for
hydride dissociation. Thermodynamic properties of the
deoxidized sample were similar to those of the low-oxygen
sample. This is in good agreement with the XRD results of
the alloys, as the low-oxygen and deoxidized sample exhibi-
ted similar lattice parameters. Thermodynamic properties are
known to depend strongly on the alloy composition and lattice
parameter [34]. The fact that the two samples showed similar
thermodynamic properties and lattice parameters further-
more suggests that the oxygen content in the BCC phase of
both samples is also similar. If the oxygen content in the BCC
phase of the sample with La addition had been higher than in
the BCC phase of the low-oxygen sample, the equilibrium
pressure of the former sample also should have been higher
than that of the latter sample.
The low-oxygen sample showed a total capacity of
3.5 mass%, the deoxidized sample showed a capacity of
3.4 mass%. This slightly reduced capacity is possibly due to
the inclusions of La oxide found within the alloy. The atomic
weight of V, Fe, Ti and Cr is in the range between 47.88 g/mol
and 55.85 g/mol, while La has an atomic weight of 138.91 g/
mol. Thus, it is more than twice as heavy as the other metals
used in the alloy. Since La oxide does not absorb any
hydrogen, it is an inert material, making the alloy heavier and
thereby reducing the hydrogen content. The high-oxygen
sample exhibited a total capacity of 2.5 mass%. However, as
the maximum pressure of the PCT apparatus was 6 MPa, the
sample could possibly absorb more hydrogen at higher pres-
sure. To investigate that, the experimental temperature was
reduced to 255 K. This procedure lowered the equilibrium
pressure, and the sample could be hydrogenated completely.
The sample temperature of the first cycle was 298 K, and the
monohydride is thermodynamically too stable to desorb
hydrogen at this temperature. Therefore, only the second
plateau (formation/dissociation of the dihydride) was
observed.
Pressure-composition isotherms of the high-oxygen sam-
ple during the first two cycles at 298 K and 255 K are presented
in the supporting information in Fig. 3s. At 255 K, 1.5 mass% H
were stored. Pressure-composition isotherms of the low-
oxygen sample at 298 K, 275 K and 255 K are also presented
in Fig. 4s of the supporting information. At 255 K, the low-
oxygen sample absorbed/desorbed 2.5 mass% H between
0.01 and 6 MPa (formation/dissociation of the dihydride).
Thus, the second plateau of the high-oxygen sample showed a
reduced capacity as compared to the low-oxygen sample.
Tsukahara et al. reported the hydrogen content of a
V3TiNi0.56Co0.14Nb0.047Ta0.047 to depend strongly on the oxygen
concentration. Below 5000 ppm O, the capacity was largely
unaffected. For oxygen concentrations >5000 ppm, the ca-
pacity was reduced [19]. In contrast, the total hydrogen ca-
pacity of the low- and high-oxygen VeTieMn alloys studied by
Nakamura et al. was not affected by oxygen. Oxygen is known
to reduce the hydrogen capacity of pure V [35]. The alloy
studied by Tsukahara et al. contained a high vanadium frac-
tion of 63 at%. In the present work, the V content was 40 at%,
and the material studied by Nakamura et al. contained 36.7 at
% V. It is interesting to note that for the alloy studied in the
present work, the overall hydrogen capacity was reduced,
while for the VeTieMn alloy investigated by Nakamura et al.,
the overall capacity was not affected by oxygen, despite the
fact that the vanadium content of our alloy was only 3.7 at%
higher. Aside from the different vanadiumconcentrations, the
composition of the alloys studied in the various works was
also different.
Finally, it should be noted that a deoxidization of the high-
oxygen alloys could also be achieved by using other rare earth
elements such as yttrium or cerium.
Conclusion
The effect of the oxygen content of a VeFeeTieCr alloy was
investigated. Two vanadium raw metals containing 300 ppm
and 10,000 ppm O were used for the synthesis of the alloys. A
i n t e r n a t i o n a l j o u r n a l o f h y d r o g e n en e r g y 3 9 ( 2 0 1 4 ) 2 0 0 0 0e2 0 0 0 8 20007
significant effect was observed for the sample containing
10,000 ppm O where a secondary isostructural with a-Ti, was
formed and the Ti content of the BCC main phase was
reduced. Apart from Ti and O, the secondary phase also con-
tained V. Furthermore, a third so far unknown phase con-
sisting of Ti, V, Cr, Fe and traces of O and N was confirmed.
Thermodynamic properties of the high-oxygen sample were
altered with respect to its hydrogen absorption properties: a
high oxygen concentration led to an increased pressure of
hydride formation and dissociation. The total hydrogen ca-
pacity of the high-oxygen samplewas reduced as compared to
the low-oxygen sample. The addition of 1 at% rare earthmetal
(La, Y or Ce) effectively deoxidized the alloys, as confirmed by
XRD and oxygen analysis. This resulted in comparable ther-
modynamic properties and a similar hydrogen storage ca-
pacity as the low-oxygen sample.
Acknowledgements
This work was funded partly by the Japanese Society for the
Promotion of Science (JSPS) and the German Helmholtz
Association.
TEM, FIB and oxygen analysis was performed at the
Karlsruhe Nano Micro Facility (KNMF, www.knmf.kit.edu).
The authors thank Torsten Scherer and Robby Prang (KIT-INT)
for TEM sample preparation.
Appendix A. Supplementary data
Supplementary data related to this article can be found at
http://dx.doi.org/10.1016/j.ijhydene.2014.08.152.
r e f e r e n c e s
[1] Schlapbach L, Zuttel A. Hydrogen-storage materialsfor mobile applications. Nature Nov. 2001;414(6861):353e8.
[2] Wilson PR, Bowman RC, Mora JL, Reiter JW. Operation of aPEM fuel cell with LaNi4.8Sn0.2 hydride beds. J Alloys CompdOct. 2007;446e447:676e80.
[3] Sakintuna B, Lamaridarkrim F, Hirscher M. Metal hydridematerials for solid hydrogen storage: a review. Int JHydrogen. Energy Jun. 2007;32(9):1121e40.
[4] Akiba E, Iba H. Hydrogen absorption by laves phaserelated BCC solid solution. Intermetallics Jan.1998;6(6):461e70.
[5] Akiba E, Okada M. Metallic hydrides III: cubic solid-solutionalloys. MRS Bull 2002;(September):699e703.
[6] Cho S-W, Han C-S, Park C-N, Akiba E. The hydrogen storagecharacteristics of TieCreV alloys. J Alloys Compd Jun.1999;288(1e2):294e8.
[7] Kumar A, Shashikala K, Banerjee S, Nuwad J, Das P,Pillai CGS. Effect of cycling on hydrogen storageproperties of Ti2CrV alloy. Int J Hydrogen Energy Feb.2012;37(4):3677e82.
[8] Okada M, Kuriiwa T, Tamura T, Takamura H, Kamegawa A.Ti�V�Cr BCC alloys system with high protium content.Metals Mater Int Feb. 2001;7(1):67e72.
[9] Yan Y, Chen Y, Liang H, Wu C, Tao M. Hydrogen storageproperties of V30eTieCreFe alloys. J Alloys Compd Jan.2007;427(1e2):110e4.
[10] Seo C, Kim J, Lee PS, Lee J. Hydrogen storage properties ofvanadium-based B.C.C. solid solution metal hydrides. JAlloys Compd Jan. 2003;348(1e2):252e7.
[11] Nomura K, Akiba E. H2 absorbingedesorbing characterizationof the TieVeFe alloy system. J Alloys Compd Dec.1995;231(1e2):513e7.
[12] Yan Y, Chen Y, Wu C, Tao M, Liang H. A low-cost BCCalloy prepared from a FeV80 alloy with a highhydrogen storage capacity. J Power Sources Feb.2007;164(2):799e802.
[13] Wu C, Borgschulte A, Frischknecht U, Yan Y, Yang F, Luo L,et al. Surface properties of V40(TiCr)51Fe8Mn alloy duringhydrogenation/dehydrogenation cycles. J Alloys Compd Feb.2013;40:30e2.
[14] Moskalyk R, Alfantazi A. Processing of vanadium: a review.Miner Eng Sep. 2003;16(9):793e805.
[15] Nakagawa S. Personal communication. Taiyo Koko Ltd; 2013.[16] Yan Y, Chen Y, Liang H, Wu C, Tao M. The effect of Si on
V30Ti35Cr25Fe10 BCC hydrogen storage alloy. J Alloys CompdAug. 2007;441(1e2):297e300.
[17] Yan Y, Chen Y, Liang H, Wu C, Tao M, Mingjing T. Effect of Alon hydrogen storage properties of V30Ti35Cr25Fe10 alloy.J Alloys Compd Dec. 2006;426(1e2):253e5.
[18] Reilly JJ, Wiswall RH. Higher hydrides of vanadium andniobium. Inorg Chem Jul. 1970;9(7):1678e82.
[19] Tsukahara M, Takahashi K, Isomura A, Sakai T. Influence ofoxygen on hydrogen storage and electrode properties formicro-designed V-based battery alloys. J Alloys Compd Jan.1998;265(1e2):257e63.
[20] Tsukahara M, Takahashi K, Mishima T, Isomura A, Sakai T.Influence of various additives in vanadium-based alloysV3TiNi0.56 on secondary phase formation, hydrogen storageproperties and electrode properties. J Alloys Compd Nov.1996;245(1e2):59e65.
[21] Shi J, Sakai T, Takeshita HT, Kuriyama N, Tsukahara M.Influence of carbon impurity on microstructures andelectrode properties for V-based battery alloys. J AlloysCompd Aug. 1999;290(1e2):267e72.
[22] Shen C-C, Chou JC-P, Li H-C, Wu Y-P, Perng T-P. Effect ofinterstitial boron and carbon on the hydrogenationproperties of Ti25V35Cr40 alloy. Int J Hydrogen Energy Nov.2010;35(21):11975e80.
[23] Nakamura Y, Nakamura J, Sakaki K, Asano K, Akiba E.Hydrogenation properties of TieVeMn alloys with a BCCstructure containing high and low oxygen concentrations.J Alloys Compd Feb. 2011;509(5):1841e7.
[24] Mi J, Lu F, Liu X, Jiang L, Li Z, Wang S. Enhancement of ceriumand hydrogen storage property of a low-cost TieV based BCCalloy prepared by commercial ferrovanadium. J Rare EarthsOct. 2010;28(5):781e4.
[25] Coelho AA. TOPAS academic version 4.1 technical reference.Brisbane, Australia. 2007.
[26] Kornilov II, Matveeva NM. The metal chemistry of vanadium.Russ Chem Rev Sep. 1962;31(9):512e28.
[27] Wood RM. The lattice constants of high purity alphatitanium. Proc Phys Soc Sep. 1962;80(3):783e6.
[28] Yamaguchi S, Hiraga K, Hirabayashi M. Interstitialorderedisorder transformation in the TieO solid solution. IV.A neutron diffraction study. J Phys Soc Jpn Apr.1970;28(4):1014e23.
[29] Yamaguchi S. Interstitial orderedisorder transformation inthe TieO solid solution. I. Ordered arrangement of oxygen.J Phys Soc Jpn Jan. 1969;27(1):155e63.
[30] Murray JL, Wriedt HA. The O�Ti (OxygeneTitanium) system.J Phase Equilib Apr. 1987;8(2):148e65.

i n t e rn a t i o n a l j o u r n a l o f h y d r o g e n en e r g y 3 9 ( 2 0 1 4 ) 2 0 0 0 0e2 0 0 0 820008
[31] Karen P, Kjekshus A. High-temp. superconductors e I, vol. 30.Elsevier; 2000. p. 229e373.
[32] Liu XP, Cuevas F, Jiang LJ, Latroche M, Li ZN, Wang SM.Improvement of the hydrogen storage properties ofTieCreVeFe BCC alloy by Ce addition. J Alloys Compd May2009;476(1e2):403e7.
[33] Murray JL. The Ti�V (titaniumevanadium) system. Bull AlloyPhase Diagrams Jun. 1981;2(1):48e55.
[34] Nakamura Y, Akiba E. Hydriding properties and crystalstructure ofNaCl-typemono-hydrides formed fromTieVeMnBCCsolid solutions. J AlloysCompdOct. 2002;345(1e2):175e82.
[35] Asano K, Havashi S, Mimura K, Enoki H, Nakamura Y.Hydrogen diffusion in V studied by 1H-NMR.pdf. In:Collected book of abstracts, metal hydrides conference; 2012.p. 375.
Related Documents