1 EFFECT OF NUTRIENT LOADING ON BIOGEOCHEMICAL PROCESSES IN TROPICAL TIDAL CREEKS Jodie Smith 1* , Michele A. Burford 2 , Andrew T. Revill 3 , Ralf R. Haese 1 , Julia Fortune 4 1 Tropical Rivers and Coastal Knowledge Program, Geoscience Australia, Canberra, Australia 2 Tropical Rivers and Coastal Knowledge Program, Australian Rivers Institute, Griffith University, Brisbane, Australia 3 Tropical Rivers and Coastal Knowledge Program, CSIRO Marine and Atmospheric Research, Hobart, Australia 4 Tropical Rivers and Coastal Knowledge Program, Northern Territory Department of Natural Resources, Environment, the Arts and Sport, Darwin, Australia *Corresponding author: [email protected]; GPO Box 378, Canberra, ACT, 2601, Australia. Ph: +61 2 6249 9487. Fax: +61 2 6249 9961 Keywords benthic fluxes, coupled nitrification-denitrification, hypoxia, nutrient loads, primary production

Welcome message from author
This document is posted to help you gain knowledge. Please leave a comment to let me know what you think about it! Share it to your friends and learn new things together.
Transcript
1
EFFECT OF NUTRIENT LOADING ON BIOGEOCHEMICAL
PROCESSES IN TROPICAL TIDAL CREEKS
Jodie Smith1*
, Michele A. Burford2, Andrew T. Revill
3, Ralf R. Haese
1, Julia Fortune
4
1 Tropical Rivers and Coastal Knowledge Program, Geoscience Australia, Canberra,
Australia
2 Tropical Rivers and Coastal Knowledge Program, Australian Rivers Institute,
Griffith University, Brisbane, Australia
3 Tropical Rivers and Coastal Knowledge Program, CSIRO Marine and Atmospheric
Research, Hobart, Australia
4 Tropical Rivers and Coastal Knowledge Program, Northern Territory Department of
Natural Resources, Environment, the Arts and Sport, Darwin, Australia
*Corresponding author: [email protected]; GPO Box 378, Canberra, ACT,
2601, Australia. Ph: +61 2 6249 9487. Fax: +61 2 6249 9961
Keywords
benthic fluxes, coupled nitrification-denitrification, hypoxia, nutrient loads, primary
production
2
Abstract
The effect of increased nutrient loads on biogeochemical processes in macrotidal,
mangrove-lined creeks was studied in tropical Darwin Harbour, Australia. This study
uses an integrative approach involving multiple benthic and pelagic processes as
measures of ecosystem function, and provides a comparison of these processes in
three tidal creeks receiving different loads of treated sewage effluent. There were
significant differences in process rates between Buffalo Creek (hypereutrophic),
which receives the largest sewage loads; Myrmidon Creek (oligotrophic-mesotrophic)
which receives smaller sewage inputs; and Reference Creek (oligotrophic) which is
comparatively pristine. Benthic nutrient fluxes and denitrification were more than an
order of magnitude higher and lower, respectively, in Buffalo Creek and
denitrification efficiency was less than 10%. Pelagic primary production rates were
also much higher in Buffalo Creek but respiration exceeded primary production
resulting in severe drawdown of O2 concentrations at night. Hypoxic conditions
released oxide-bound phosphorus and inhibited coupled nitrification-denitrification,
enhancing benthic nitrogen and phosphorus fluxes, leading to a build-up of excess
nutrients in the water column. Poor water quality in Buffalo Creek was exacerbated
by limited tidal flushing imposed by a narrow meandering channel and sandbar across
the mouth. In contrast to Buffalo Creek, the effect of the sewage load in Myrmidon
Creek was confined to the water column, and the impact was temporary and highly
localized. This is attributed to the effective flushing of the sewage plume with each
tidal cycle. Denitrification rates in Myrmidon and Reference Creeks were high (up to
6.83 mmol N m-2
d-1
) and denitrification efficiency was approximately 90%. This
study has identified denitrification, benthic nutrient fluxes and pelagic primary
production as the biogeochemical processes most affected by nutrient loading in these

3
tidal creek systems. Physical process play a key role and the combined influence of
nutrient loading and poor tidal flushing can have serious consequences for ecosystem
functioning.
4
Introduction
Estuaries are complex, open systems that often experience large inputs of organic
matter and inorganic nutrients from land. Biogeochemical processes subsequently
determine the extent of nutrient transformations, retention and export to the ocean.
Tropical estuaries are among the most biogeochemically active regions in the
biosphere, but the processes are complex due to factors such as highly variable
hydrodynamics, particularly in macrotidal systems (e.g. Wolanski et al. 1980), large
organic matter inputs from fringing mangroves (e.g. Dittmar et al. 2006), large
monsoonal freshwater inputs (e.g. Sarma et al. 2009), as well as heavy bioturbation in
intertidal sediments (e.g. Pratihary et al. 2009).
Changes to the structure and function of estuaries due to increased anthropogenic
nutrient loadings arising from such diverse sources as urban and rural run-off, sewage
discharges and aquaculture are well known (Nixon 1995; Herbert 1999; Cloern 2001;
Clarke et al. 2006). The increased input of nutrients to shallow marine environments,
including estuaries, and the accompanying stimulation of primary production enhance
organic matter supply to sediments, increasing benthic metabolism and resulting in
greater nutrient release and rates of oxygen consumption (Richardson & Jørgensen
1996; Herbert 1999; Cloern 2001). Hypoxia is a common effect of nutrient loading in
coastal marine ecosystems and the effects are most severe in areas such as shallow
embayments or where tidal flushing is limited (Herbert 1999; Diaz & Rosenberg
2008). Hypoxia influences biogeochemical processes that control nutrient
concentrations in the water column (Conley et al. 2009) and can lead to dead zones
which have serious consequences for ecosystem structure and functioning (Diaz &
5
Rosenberg 2008). Thus, increased nutrient loads can have important consequences for
the structure of estuarine communities, aquatic food webs and estuarine water quality.
Nutrient loading is considered to be the most widespread problem in estuaries around
the world and is likely to increase in the future (Howarth et al. 2002). The impact is
expected to be greater in the tropics than at higher latitudes (Downing et al. 1999) and
on a global scale, tropical regions such as southeast Asia are particularly vulnerable in
terms of ecosystem alteration due to anthropogenic nutrient loading (Mackenzie et al.
2002; Jennerjahn et al. 2004; Halpern et al. 2008). The effects of altered nutrient
cycling in tropical ecosystems can be understood most easily in the context of nutrient
dynamics in undisturbed or minimally disturbed tropical ecosystems, however,
nutrient processing in tropical estuaries, in general, is poorly studied relative to
temperate environments (Downing et al. 1999; Bianchi 2007) and there are even
fewer studies comparing biogeochemical cycles in disturbed and undisturbed tropical
systems (Trott et al. 2004; Kristensen et al. 2008). Additionally, these studies are
often limited in the suite of processes measured, with much of the information
available tending to be focused on individual processes (Boynton et al. 2008). This
study uses an integrative approach involving multiple benthic and pelagic processes
as measures of ecosystem function, and provides a comparison of these processes
across a gradient of nutrient loads in a tropical estuary. This study also provides the
first reported measurements of denitrification in Darwin Harbour.
The aim of this study was to determine the effect of increased nutrient loads on
multiple biogeochemical processes within tropical tidal creeks in Darwin Harbour and
to identify which processes are most effective in determining eutrophication impacts
in tidal creeks. Darwin Harbour is an N-limited system and is subject to
6
anthropogenic nutrient inputs from urban and rural-runoff, as well as treated sewage
effluent. Impacts on water quality in Darwin Harbour as a result of seasonal and point
source nutrient inputs have been reported previously (e.g. McKinnon et al. 2006;
Burford et al. 2008) and fish kills have occurred in tidal creeks receiving sewage
effluent. There is potential for more severe impacts on water quality and overall
ecological health in the future due to increasing population and land development.
Indeed, Darwin has the most rapid population growth in Australia. Considering the
rapid changes occurring in tropical estuaries as a result of nutrient enrichment
associated with point and non-point sources, understanding the functioning of these
systems and their interactions is important to be able to correctly assess the health of
estuaries (Bouillon & Connolly 2009).
Materials and Methods
Study Area
The study was performed in three tidal creeks in Darwin Harbour in northern
Australia (Fig. 1). Darwin Harbour is a large macrotidal estuary with a maximum tidal
range of 7.8 m. The harbour is fringed by dense mangroves and during low tide,
extensive intertidal mudflats are exposed (Fig. 1). The region is influenced by a
tropical monsoonal climate characterized by high year-round temperatures and a
highly seasonal rainfall pattern, with over 1300 mm falling during the monsoon
season (December to March). River flow into the harbour is also highly seasonal with
maximum flow between January and March and a cessation in flow between May and
July. Although the harbour experiences a distinct wet season, the catchment is
relatively small and wet season runoff has relatively little impact over the whole
harbour. Most of the freshwater runoff occurs in the form of a few discrete flood
7
events during which the upper reaches of the harbour may become fully fresh.
However, there is no marked river plume exiting the harbour and salinity remains
almost constant at the mouth of the harbour throughout the year, implying that
freshwater runoff is strongly diluted by the time it reaches the mouth (Williams et al.
2006).
The majority of nutrients that enter the harbour are imported from the ocean and are
typically in the particulate or organic form (Burford et al. 2008). Nutrients also enter
the harbour from the surrounding catchment and include both diffuse sources, such as
urban and rural runoff, and point sources such as treated sewage effluent which is
discharged into both the main body of the harbour and several tidal creeks on the
fringes. Overall, the harbour is considered relatively pristine (McKinnon et al. 2006).
Field Stations and Sampling
Sediment and water column sampling was carried out at two sites in three tidal creeks;
an unnamed creek (herein referred to as Reference Creek, RC) and Myrmidon Creek
(MC) in East Arm of Darwin Harbour, and Buffalo Creek (BC) in Shoal Bay (Fig. 1).
RC and MC have similar geomorphology with predominantly straight channels,
widening downstream (Fig. 1a & b). At low tide, intertidal mudflats, several metres
wide, are exposed along the length of the creeks. The upper reaches of the creeks may
be fully drained at low tide, however the creeks contain water at all times. BC consists
of a long, narrow channel with large meander bends at the downstream end (Fig. 1c).
Upstream the channel becomes even narrower and meanders through dense,
overhanging mangroves. Intertidal mudflats occur on the meander bends and along
sections of the main channel. A large intertidal sand bar across the mouth inhibits
tidal movement to a significant degree.
8
RC is considered to be near-pristine with no known impact from urbanization or land
development (Woodroffe et al. 1988). MC and BC receive sewage effluent from
sewage treatment plants (STP) which use waste stabilization ponds to remove organic
matter and nutrients. MC receives 69 t TN yr-1
and 18 t TP yr-1
and the treated sewage
effluent is discharged into the mangroves close to site MC1 (Fig. 1b). BC receives 79
t TN yr-1
and 43 t TP yr-1
and the treated sewage effluent is discharged into dense
mangroves at the upstream end of the creek (Fig. 1c). While the sewage loads entering
BC and MC are similar, the dimensions and hence water volume, are much lower in
BC than in MC. The sewage discharge is gravity-fed, i.e. there is only discharge when
the tide level is below the outflow pipe. At high tide, flow is stopped.
This study was conducted during 2007-8 over 3 sampling periods. Rapidly changing
tidal conditions limited boat access to many areas of the harbour and the sampling
sites and times were chosen based on those areas that were accessible in practice.
Therefore, we have to assume that the tidal creeks and sites within each creek were
representative. Each sampling period lasted 5-6 days in between spring and neap tides
during the 2-week tidal cycle. Surveys during the wet and dry season were undertaken
to differentiate land runoff effects from sewage effluent inputs. Sewage effluent
inputs are relatively constant all year round. RC and MC were sampled in the dry and
wet seasons (October 2007 and March 2008). BC was sampled at the end of the dry
season (early December 2008). We have assumed that our sampling periods were
representative of the seasonal cycles and we have no reason to believe environmental
conditions (e.g. STP discharge, water quality conditions) would be significantly
different at other times during each season.
9
Water column physico-chemical conditions
Water sampling was conducted at least twice (typically on consecutive days) at each
site in MC and RC during the ebb tide. In BC, initial field observations indicated
rapidly changing physico-chemical conditions during the tidal cycle so water
sampling was conducted every 1-2 hrs during the benthic chamber deployments and
additional sampling conducted on consecutive days.
Water column parameters (temperature, salinity, dissolved oxygen) were recorded at
each site with a YSI sonde (6000XLM). Photosynthetically active radiation (PAR)
was measured during the middle of the day at water depth intervals of 0.5-1 m using a
LI-COR light meter with a 4π quantum underwater sensor (LI-192) and this data used
to calculate the euphotic depth (Zeu). Surface water samples were collected in 1L
bottles. Total suspended solids (TSS) was determined by filtering water samples using
pre-weighed membrane filters (0.45 µm, Millipore), drying at 60oC and re-weighing.
Sub-samples were filtered (0.45 µm, Bonnet) into 30 mL tubes and frozen until
analysis for nutrients. Samples for chlorophyll a (chl a) were collected by filtering
water from just below the surface through GF/F filters (Whatman) using a manual
pump. The filters were placed in cryotubes and stored in liquid nitrogen until analysis.
During the December 2008 field campaign in MC, continuous measurements of
physico-chemical parameters were made using a YSI sonde over a 5 hr period from
high tide to low tide to measure the treated sewage effluent plume as it emerged from
the mangroves. Surface water samples were collected at approximately 1 hr intervals
and were measured for TSS, total nutrients and chl a.
10
Pelagic Primary Productivity and Respiration
Water column primary production was measured using 13
C-uptake incubations. Water
samples collected just below the surface were stored in buckets during transport to the
field laboratory. 500 ml acid-washed polycarbonate bottles were filled with water
collected from each site. Triplicate bottles from each bucket were incubated at 0, 5,
14, 25, 50 and 100% of surface light using shade bags of appropriate light attenuation.
13C-sodium bicarbonate was added to bottles to give a final enrichment of between 3
and 5% of the total bicarbonate concentration.
The bottles were incubated in a large tank with flowing water at ambient water
temperature. Bottles were incubated on either side of local apparent noon (when the
sun was highest in the sky) for 2 to 3 h. Known volumes of water from the bottles
were filtered onto precombusted glass fibre (Whatman GF/F) filters which were
frozen until analysis. Hourly primary production rates were calculated as the change
in carbon concentration at each light level. Maximum productivity (Pmax, mmol C m-3
h-1
) was estimated from the 100% light incubation. Daily depth-integrated net primary
production (NPP) was calculated by integrating primary production rates through the
water column based on the 13
C-bicarbonate incubation and light data, based on a 10 h
daylight period.
Maximum production and respiration were also measured by means of oxygen
production and consumption, respectively. Surface water was collected and incubated
in four (2 transparent, 2 opaque) gas-tight, 100 mL glass syringes (Hamilton). The
syringes were incubated within the water column for 3 to 4 h. Four samples were
removed from each syringe during the incubation for O2 analysis, transferred into 12
ml gas-tight glass vials with glass stoppers, preserved with saturated HgCl2 and stored
11
submerged just below ambient temperature in the dark until analysis. Pmax and
respiration (mmol O2 m-3
h-1
) were estimated as the change in oxygen concentration
during light and dark incubations, respectively. Daily depth-integrated community
respiration (CR, mmol C m-2
d-1
) was calculated assuming that respiration rates were
constant with depth and respiration rates converted to carbon units assuming a
respiratory quotient (RQ) of 1 (Laws 1991). Gross primary production (GPP) was
calculated as the sum of NPP and CR during a 10 h daylight period, and the
productivity:respiration (P:R) ratio calculated as the ratio GPP:CR.
Surface Sediments
Sediment cores (6 cm dia.) were collected at each site using a push corer. Surface
sediment (to 1 cm depth) from one core was transferred into clean glass jars and
homogenized. Clean aluminium foil was placed between the lid and contents to
minimize organic contamination. The samples were frozen until analysis for TOC, TN
and stable isotope composition. Subsamples were taken for chl a analysis and placed
in cryo-vials in a liquid nitrogen dry shipper. Surface sediment from a second core
was transferred to plastic vials and frozen for total phosphorus (TP) analysis. Porosity
was determined on a subsample by weight difference between wet and dry sediment
following freeze-drying.
Sediment Primary Productivity
Sediment cores (4.5 cm dia.) were collected at each site for measurement of primary
productivity in the sediment. Capped cores were transported with overlying water
from the study site to the field laboratory. Primary productivity was measured at 0,
10, 50 and 100% of surface light using shade bags of appropriate light attenuation.
12
13C-sodium bicarbonate was added to bottles to give a final enrichment of between 40
and 50% of the total bicarbonate concentration to the overlying water.
The cores were incubated in a large tank with flowing water at ambient water
temperature around local apparent noon for 2 to 3 h. The temperature was logged
throughout the incubations. Cores were then kept in the dark until processed. The top
2 cm was sliced off each core and frozen until analysis.
Benthic flux incubations
Benthic chamber incubations were used to quantify the flux of dissolved inorganic
nutrients (fNH4+, fNOx, fPO4
3-, fSiO4) and dissolved gas (fDO, fDIC, fN2). Four
manually operated benthic chambers (2 transparent, 2 opaque), as described by Haese
et al. (2007), were deployed at each site. Self-logging probes (YSI-600XL)
continuously measured temperature, salinity and oxygen concentration inside and
outside of the chambers. The incubation began after manually closing the chamber lid.
Five or six chamber-water samples with a volume of 100 mL were taken during an
incubation period typically lasting 3 to 5 h. Water samples for nutrient analysis were
filtered immediately (0.45 µm) into 30 mL tubes and frozen until analysis. Samples
for DIC were filtered (0.45 µm) into gas-tight vials (3 ml, Exetainer), preserved with
saturated HgCl2 and stored in the dark until analysis. Samples for N2 were transferred
into 12 ml gas-tight vials with glass stoppers, preserved with saturated HgCl2 and
stored submerged just below ambient temperature in the dark until analysis.
Benthic nutrient and gas fluxes were calculated from concentration changes over time,
accounting for the incubated sediment surface area and water volume and corrected
for the replenishment of sample volumes by ambient bottom water. During high tide,
13
the light chambers were beyond the photic zone, and data collected during these
periods were used in the calculation of dark fluxes. Only the linear proportion of the
concentration versus incubation time curve was used in the flux calculations. Water
incubated by benthic chambers never reached oxygen concentrations below 20%
saturation, with the exception of BC1 where ambient water was at or below this level
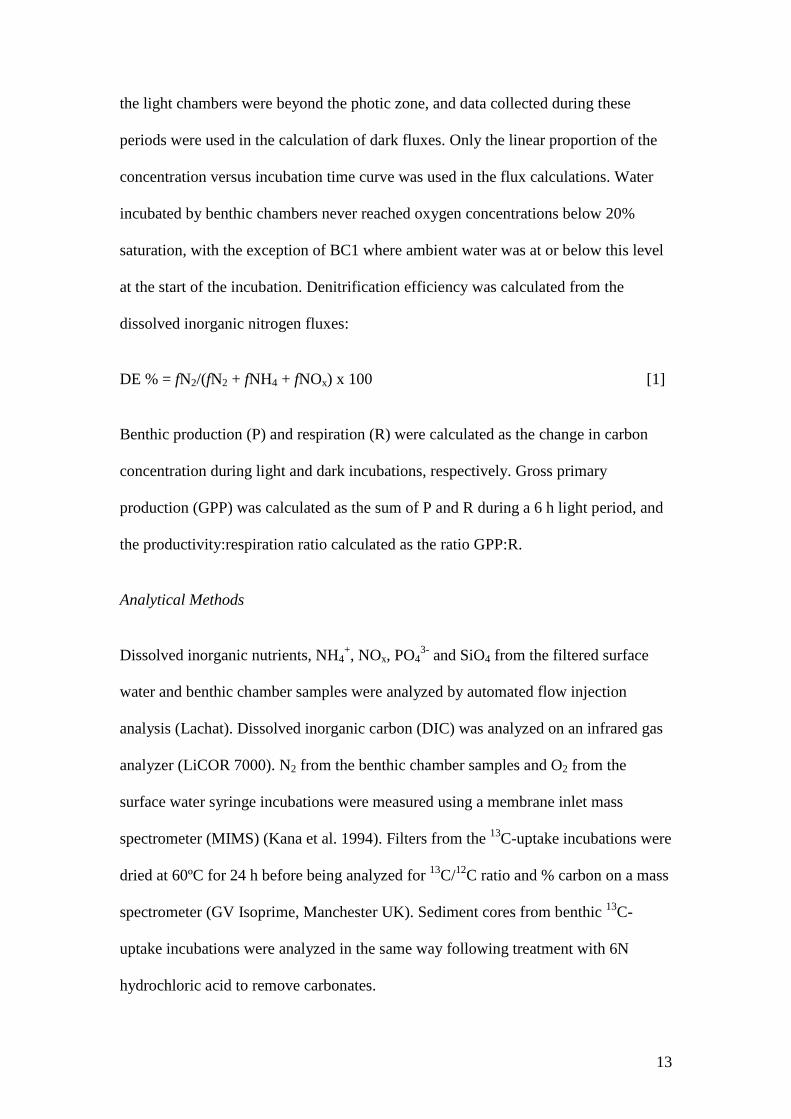
at the start of the incubation. Denitrification efficiency was calculated from the
dissolved inorganic nitrogen fluxes:
DE % = fN2/(fN2 + fNH4 + fNOx) x 100 [1]
Benthic production (P) and respiration (R) were calculated as the change in carbon
concentration during light and dark incubations, respectively. Gross primary
production (GPP) was calculated as the sum of P and R during a 6 h light period, and
the productivity:respiration ratio calculated as the ratio GPP:R.
Analytical Methods
Dissolved inorganic nutrients, NH4+, NOx, PO4
3- and SiO4 from the filtered surface
water and benthic chamber samples were analyzed by automated flow injection
analysis (Lachat). Dissolved inorganic carbon (DIC) was analyzed on an infrared gas
analyzer (LiCOR 7000). N2 from the benthic chamber samples and O2 from the
surface water syringe incubations were measured using a membrane inlet mass
spectrometer (MIMS) (Kana et al. 1994). Filters from the 13
C-uptake incubations were
dried at 60ºC for 24 h before being analyzed for 13
C/12
C ratio and % carbon on a mass
spectrometer (GV Isoprime, Manchester UK). Sediment cores from benthic 13
C-
uptake incubations were analyzed in the same way following treatment with 6N
hydrochloric acid to remove carbonates.
14
Chl a was extracted from sediment and water column filters prior to analysis by high
performance liquid chromatography following the procedures outlined in Cook et al.
(2004) and Haese et al. (2007), respectively. Sediment samples for stable isotope
analysis (13
C and 15
N) were processed and analyzed for 13
C and 15
N as described
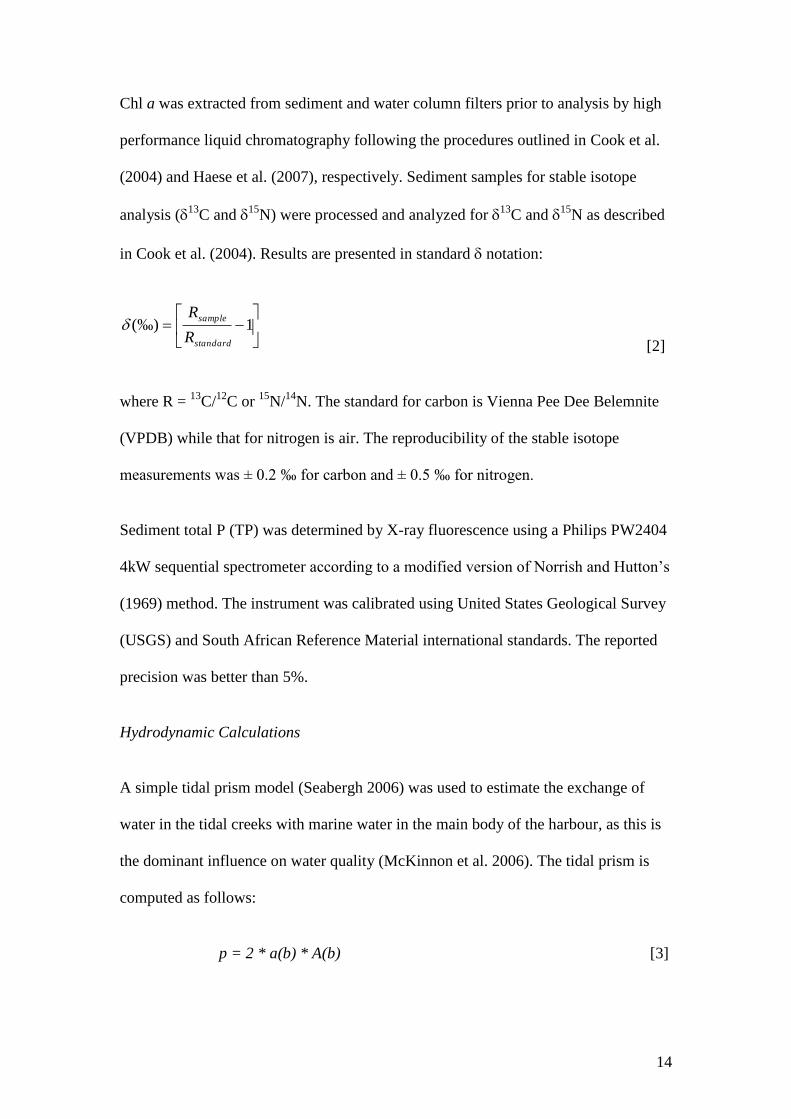
in Cook et al. (2004). Results are presented in standard notation:
1)‰(
standard
sample
R
R
[2]
where R = 13
C/12
C or 15
N/14
N. The standard for carbon is Vienna Pee Dee Belemnite
(VPDB) while that for nitrogen is air. The reproducibility of the stable isotope
measurements was ± 0.2 ‰ for carbon and ± 0.5 ‰ for nitrogen.
Sediment total P (TP) was determined by X-ray fluorescence using a Philips PW2404
4kW sequential spectrometer according to a modified version of Norrish and Hutton’s
(1969) method. The instrument was calibrated using United States Geological Survey
(USGS) and South African Reference Material international standards. The reported
precision was better than 5%.
Hydrodynamic Calculations
A simple tidal prism model (Seabergh 2006) was used to estimate the exchange of
water in the tidal creeks with marine water in the main body of the harbour, as this is
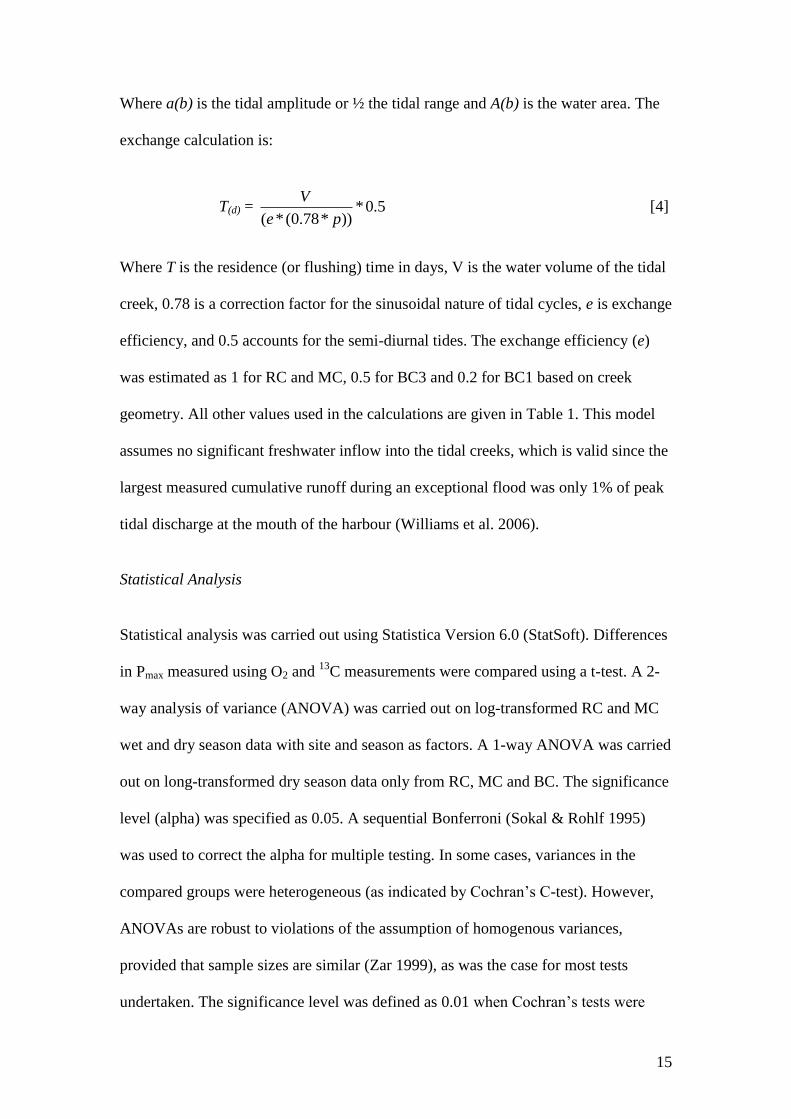
the dominant influence on water quality (McKinnon et al. 2006). The tidal prism is
computed as follows:
p = 2 * a(b) * A(b) [3]
15
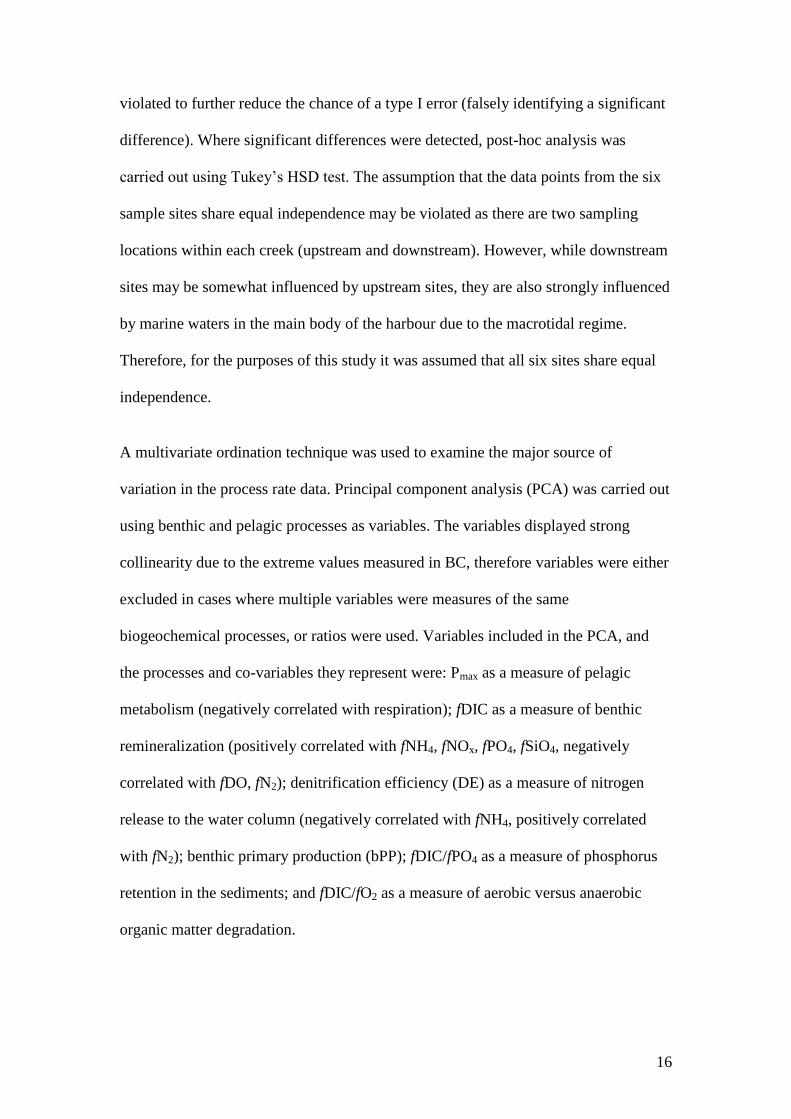
Where a(b) is the tidal amplitude or ½ the tidal range and A(b) is the water area. The
exchange calculation is:
T(d) = 5.0*))*78.0(*( pe
V [4]
Where T is the residence (or flushing) time in days, V is the water volume of the tidal
creek, 0.78 is a correction factor for the sinusoidal nature of tidal cycles, e is exchange
efficiency, and 0.5 accounts for the semi-diurnal tides. The exchange efficiency (e)
was estimated as 1 for RC and MC, 0.5 for BC3 and 0.2 for BC1 based on creek
geometry. All other values used in the calculations are given in Table 1. This model
assumes no significant freshwater inflow into the tidal creeks, which is valid since the
largest measured cumulative runoff during an exceptional flood was only 1% of peak
tidal discharge at the mouth of the harbour (Williams et al. 2006).
Statistical Analysis
Statistical analysis was carried out using Statistica Version 6.0 (StatSoft). Differences
in Pmax measured using O2 and 13
C measurements were compared using a t-test. A 2-
way analysis of variance (ANOVA) was carried out on log-transformed RC and MC
wet and dry season data with site and season as factors. A 1-way ANOVA was carried
out on long-transformed dry season data only from RC, MC and BC. The significance
level (alpha) was specified as 0.05. A sequential Bonferroni (Sokal & Rohlf 1995)
was used to correct the alpha for multiple testing. In some cases, variances in the
compared groups were heterogeneous (as indicated by Cochran’s C-test). However,
ANOVAs are robust to violations of the assumption of homogenous variances,
provided that sample sizes are similar (Zar 1999), as was the case for most tests
undertaken. The significance level was defined as 0.01 when Cochran’s tests were
16
violated to further reduce the chance of a type I error (falsely identifying a significant
difference). Where significant differences were detected, post-hoc analysis was
carried out using Tukey’s HSD test. The assumption that the data points from the six
sample sites share equal independence may be violated as there are two sampling
locations within each creek (upstream and downstream). However, while downstream
sites may be somewhat influenced by upstream sites, they are also strongly influenced
by marine waters in the main body of the harbour due to the macrotidal regime.
Therefore, for the purposes of this study it was assumed that all six sites share equal
independence.
A multivariate ordination technique was used to examine the major source of
variation in the process rate data. Principal component analysis (PCA) was carried out
using benthic and pelagic processes as variables. The variables displayed strong
collinearity due to the extreme values measured in BC, therefore variables were either
excluded in cases where multiple variables were measures of the same
biogeochemical processes, or ratios were used. Variables included in the PCA, and
the processes and co-variables they represent were: Pmax as a measure of pelagic
metabolism (negatively correlated with respiration); fDIC as a measure of benthic
remineralization (positively correlated with fNH4, fNOx, fPO4, fSiO4, negatively
correlated with fDO, fN2); denitrification efficiency (DE) as a measure of nitrogen
release to the water column (negatively correlated with fNH4, positively correlated
with fN2); benthic primary production (bPP); fDIC/fPO4 as a measure of phosphorus
retention in the sediments; and fDIC/fO2 as a measure of aerobic versus anaerobic
organic matter degradation.
17
Results
Water Column Physico-Chemical Data
Water quality in RC and MC were similar and varied seasonally (Table 2). Water
temperature was relatively constant all year (approx. 30°C). The surface waters were
well saturated with oxygen (> 77 %) but varied with tides, being typically lower
during low tide. During the dry season, MC and RC had high salinity (up to 37), very
low nutrient concentrations (<0.3 µM DIN and <0.21 µM PO43-
) and very low N:P
ratios (<1.5). During the wet season survey, freshwater from the Elizabeth River
flowed into East Arm and was pushed into the tidal creeks during the flood tide,
lowering the salinity (22-29) and increasing nitrogen concentrations (up to 1.9 µM).
N:P ratios increased during the wet season, particularly in RC (up to 12.5).
Concentrations of chl a in the water column remained relatively low all year round
(<3 µg l-1
). The euphotic depth decreased during the wet season and was also lower
during low tide.
Sewage effluent strongly affected physico-chemical parameters in the water column.
It was observed that sewage effluent entered the creek at MC1 from the mangroves
following the tidal maximum and rapidly changed water quality conditions. Surface
water during periods of sewage effluent discharge in MC had a higher temperature
(>32°C) and lower salinity (~28) than the surrounding creek water (MC-S; Table 2),
resulting in a temporary surface plume. Mean TSS and nutrient concentrations
increased dramatically, chl a concentrations were elevated (9.9 µg l-1
) and the N:P
ratio was higher than typical creek water (6.4). The sewage effluent plume caused a
decrease in light penetration (Zeu = 3 m) and oxygen saturation (69%). As the tide
receded, nutrient and TSS concentrations gradually decreased as the plume was
18
dispersed and diluted. Within several hours the impact of the plume was undetected
with nutrient concentrations and salinity returning to background levels.
Water quality in BC varied considerably over short sampling periods (4-5 hrs) in
December 2008 as indicated by the high standard deviation values for most
parameters (Table 2). Overall, during our sampling periods, salinity was lower and
highly variable (20.6 ± 10.0) due to the influence of tides, terrestrial freshwater inputs
and sewage effluent. Dissolved oxygen concentrations in BC were also much lower
(43 ± 25 %) than in the other two creeks and highly variable. Measured DO saturation
ranged from less than 10% to supersaturation, with the lowest values occurring early
in the mornings. The high phytoplankton biomass (chl a) and TSS concentrations
limits light penetration, with the euphotic depth much lower (Zeu = 1.6). The mean
nutrient concentrations in BC were several orders of magnitude higher than in the
other two creeks, including the mean sewage effluent plume concentrations in MC
(MC-S) (with the exception of SiO4) and nutrient concentrations in BC decreased
downstream (data not shown).
Tidal flushing is restricted in BC by a sand bar across the mouth, a narrow channel
and several large meander bends (Fig. 1c) and the estimated flushing time varied from
0.5 to 5 d, depending on location in the creek and the nature of the tides (Table 1).
The degree of flushing decreased upstream and during neap tides. In contrast, RC and
MC have wide open mouths and relatively straight channels (Fig. 1a & b), allowing
efficient flushing. Hence, estimated flushing times were shorter (~0.5 d; Table 1) and
both creeks were well flushed with water from East Arm during each tidal cycle. This
is consistent with the observed sewage effluent plume in MC1 which was diluted and
dispersed following each low tide.
19
Sediment Characteristics
Sediment TOC, TN and TP concentrations were higher at the upstream sites reflecting
the higher mud content (as indicated by porosity). Mean TOC concentrations ranged
from 1.8 to 4.6 wt% and were highest at RC1 and BC1. TN concentrations ranged
from 0.08 to 0.42% and were highest in BC. TP concentrations were highest in BC
(997 to 1363 mg kg-1
) and MC1 (762-825 mg kg-1
) compared to the other sites (< 646
mg kg-1
). The molar C:P ratios in BC and MC were lower than typical terrestrial and
marine C:P ratios (C:P<106) suggesting an additional phosphorus source, most likely
from sewage. The mean δ13
C values ranged between -25.7 and -23.3 ‰ and the mean
δ15
N values ranged from 2.3 to 12.6 ‰ with the most enriched values in BC and at
MC1 (Table 3). Benthic chl a concentrations ranged from 17 to 60 mg m-2
in RC and
MC and were higher in BC, ranging from 161 to 532 mg m-2
(Table 3).
Pelagic Primary Production and Respiration
Pmax rates measured as both O2 and 13
C gave comparable results (data not shown) with
no significant differences between the two methods (p=0.977, t-test). The 13
C results
are reported herein since this method was used to calculate depth-integrated
production. Pmax rates in BC were significantly higher (1-way ANOVA, p<0.02532,
Fig. 2) than in the other two creeks with values ranging from 23.5 to 42.7 mmol C m-3
h-1
and these two sites were significantly different from each other. Mean Pmax rates in
MC and RC were similar, ranging from 1.17 to 2.93 mmol C m-3
h-1
and there were no
significant differences between sites or season, however there were significant
interactions between site and season (2-way ANOVA, p<0.05, Table 4). Mean
respiration rates in BC ranged from 4.5 to 10.8 mmol O2 m-3
h-1
and were
significantly higher at BC1 (1-way ANOVA, p<0.02532, Fig. 2) compared to other
20
sites. In RC and MC, respiration rates were similar and low, ranging from 0.73 to 1.82
mmol O2 m-3
h-1
with no significant differences in season or site (Table 4). The
sewage effluent plume in MC was sampled on one occasion during the October 2007
survey (MC-S) and Pmax (measured using the O2 syringe method) and respiration rates
(19.1 and 8.6 mmol O2 m-3
h-1
, respectively) were significantly higher than other sites
in RC and MC but comparable to BC1 and BC3.
Mean depth-integrated primary production (NPP) ranged from 10.1 to 248.5 mmol C
m-2
d-1
and there were significant differences between the 6 sites (1-way ANOVA,
p<0.01, Fig. 3). Net primary production rates were similar at RC1, RC2 and MC3,
ranging between 10.1 and 16.5 mmol C m-2
d-1
. Net primary production at MC1 was
significantly higher (40.8 mmol C m-2
d-1
) than at other sites in MC and RC, and in
BC, net primary production was significantly higher than all sites in MC and RC,
ranging from 130.9 to 248.5 mmol C m-2
d-1
.
Mean community respiration ranged from 50.4 to 519 mmol C m-2
d-1
(Fig. 3). Mean
community respiration rates were significantly higher at BC1, and MC1 and BC3
were also significantly higher than other sites in MC and RC (1-way ANOVA,
p<0.02532). Respiration exceeded production at all sites and the GPP:CR ratio was ≤1
at all sites with the lowest values (0.5-0.7) at sites in MC and RC, and higher values in
BC (0.9 – 1.0).
Benthic Respiration and Production
Mean dark DIC fluxes ranged from 58.8 to 390.8 mmol C m-2
d-1
and were
significantly higher in BC (1-way ANOVA, p<0.01, Fig. 2). Mean dark DO fluxes
varied from -40.0 to -90.5 mmol m-2
d-1
and there were no significant differences
21
between the six sites. There were no significant differences in DO or DIC fluxes
between sites or seasons in MC and RC (Table 4).
There was diurnal variation in DIC and DO fluxes, with reduced DIC efflux and DO
influx measured in all light chambers. However, the semi-diurnal, macrotidal regime
generates constant variations in light conditions at the sediment surface. Light
conditions varied both within and between sites and were not reproducible between
sites or sampling periods. Therefore, it was not possible to calculate light fluxes on a
mmol m-2
d-1
basis. The reduced DIC and increased O2 fluxes measured in the light
chambers suggest the presence of microbenthic algae (MBA) at all sites. This was
confirmed by measurable benthic primary productivity rates, indicating uptake of DIC
by MBA, with the exception of RC1 where primary productivity rates were below
detection limits. However, sediment chl a concentrations at this site were similar to
other sites in RC and MC (Table 3). Sediment primary production rates were all low
and similar in all three tidal creeks (< 8 mmol C m-2
d-1
, Fig. 3), despite higher
benthic algal biomass in BC. The P:R ratio of the sediments was very low at all sites
(<0.25).
Dissolved nutrient fluxes
Benthic nutrient fluxes were very high in BC compared to the other two creeks where
similar fluxes were measured (Fig. 2). At all sites, the sediments were a source of
inorganic nutrients for the overlying water with a net efflux of DIN, PO4 and SiO4.
There were no significant differences in nutrient fluxes between seasons in RC and
MC, except for SiO4 fluxes which were significantly higher in the dry season (2-way
ANOVA, p<0.05, Table 4).
22
In RC and MC, mean dark NH4+ fluxes ranged from 0.32 to 1.12 mmol N m
-2 d
-1,
accounting for > 65 % of the DIN flux. There were no significant differences between
seasons or sites (Table 4). In BC, mean dark NH4+ fluxes were significantly higher (1-
way ANOVA, p<0.02532, Fig. 2), ranging from 21.9 to 45.0 mmol N m-2
d-1
,
accounting for > 94% of the DIN flux in this creek. NOx fluxes were highly variable
with the standard deviation at each site typically exceeding the mean fluxes. NOx
fluxes were significantly higher at MC1 compared to other sites in MC and RC (2-
way ANOVA, p<0.01, Table 4). However, when comparing all six sites, there was no
significant difference in NOx fluxes (Fig. 2). Mean PO43-
fluxes in RC and MC ranged
from 0.06 to 0.21 mmol P m-2
d-1
and there were no significant differences in sites or
seasons. A significant interaction was found between season and site (2-way
ANOVA, p<0.05, Table 4), however the post hoc comparison (Tukey’s HSD test)
failed to identify where these interactions occurred. PO43-
fluxes were significantly
higher in BC compared to sites in RC and MC (1-way ANOVA, p<0.02532, Fig. 2),
ranging from 1.50 to 15.2 mmol P m-2
d-1
, and these two sites were also significantly
different from each other. Mean SiO4 fluxes ranged from 3.26 to 45.4 mmol Si m-2
d-1
and the flux at BC1 was significantly higher than at the other sites (p<0.05, ANOVA).
Denitrification (net N2 fluxes)
Measured N2 fluxes in RC and MC were consistently high ranging from 5.50 to 6.83
mmol N m-2
d-1
(Fig. 2). Variability was sometimes high among replicate chambers,
but in all cases N2 fluxes were greater than the DIN fluxes. No data was collected
from RC1.
There were difficulties calculating N2 fluxes in BC due to missing data and highly
variable rates in replicate chambers, with both positive and negative fluxes calculated.
23
However, overall mean N2 fluxes in BC were lower than the N2 fluxes in the other
two tidal creeks and fluxes at BC1 were significantly lower (p<0.02532, Fig. 2).
Denitrification removed a major portion of the N cycled through the sediments in RC
and MC. The mean denitrification efficiency ranged from 83 to 97% at sites in RC
and MC. In contrast, the majority of N flux to the water column in BC was in the form
of NH4+ and denitrification only removed a small proportion (DE < 10%) of the N
cycled through the sediments.
Principal Components Analysis
The first two PCA axes cumulatively explained 94.4% of the total variation in
biogeochemical data and the discussion will be limited to these main axes. PCA axis
1, which alone accounted for 81.4% of the variation, was highly correlated with
variables related to benthic remineralization (fDIC) and pelagic metabolism (Pmax).
Denitrification efficiency (DE), the degree of anaerobic respiration (fDIC/fO2) and
phosphorus retention (fDIC/fPO4) were strongly negative on this axis (Fig. 4a). PCA
axis 2, which accounted for only 13.0% of the variation, was determined by benthic
primary production (bPP) and phosphorus retention (fDIC/fPO4) to a lesser degree.
Sites in BC had high positive scores on axis 1 and there was a downstream gradient
with higher scores at BC1 than BC3 (Fig. 4b). All sites in MC and RC had similar
scores on axis 1 and were all slightly negative, except for MC1 in the dry season
which was close to zero on this axis. Sites in MC and RC were spread across axis 2
with no obvious trends between sites or seasons. The 3 sites with strongly negative
scores on this axis all had the highest benthic primary productivity values. Sites with
negative axis 1 scores and positive axis 2 scores typically had very low benthic
24
primary productivity rates and high fDIC/fPO4 ratios indicating strong phosphorus
retention in the sediments.
The position of the sites in the ordination space indicates the main similarities and
differences in biogeochemical variables between sites. Sites in BC were most
different from sites in the other two creeks, and were also different from each other.
This is consistent with the significant differences observed in benthic and pelagic
processes between sites in BC and the other two creeks (Fig. 2 and Fig. 3). Although
there were differences between sites in MC and RC along axis 2, this axis only
explains a small proportion (13.0%) of the variance and is therefore less important
that the differences observed along axis 1.
Discussion
Effect of nutrient loads on biogeochemical processes
Our results, which integrate multiple biogeochemical processes in three tropical tidal
creeks, indicate a substantial impact of sewage effluent on rates of benthic and water
column nutrient cycling in the hypereutrophic creek (BC), but effects on benthic
processes only in the oligotrophic-mesotrophic creek (MC) relative to the reference
site (RC). There was a downstream gradient in the creeks receiving sewage effluent,
with the greatest effects measured at BC1and MC1, closest to the sewage discharge
points.
The most affected processes in BC were benthic nutrient fluxes (fDIN, fDIP),
denitrification (fN2) and primary production (Pmax) which were one to two orders of
magnitude higher or lower than in RC (Fig. 5c & d). The combination of increased
DIN flux and decreased N2 flux subsequently affected the denitrification efficiency
25
which was up to three orders of magnitude lower in BC relative to RC (Fig. 5d).
Denitrification provides a sink in the nitrogen budget and thereby plays an important
role in controlling the degree of eutrophication in waters subjected to substantial
anthropogenic input of nutrients (Seitzinger 1988; Rysgaard et al. 1995). The low
denitrification efficiency in BC is consistent with studies in other estuarine systems
which have demonstrated that as nutrient loads increase, denitrification removes a
smaller proportion of the load (Sloth et al. 1995; Burford & Longmore 2001; Caffrey
et al. 2007). The effect of nutrient loading on denitrification efficiency has important
implications for the nutrient status of the system and has flow-on effects that alter the
structure of higher trophic levels such as fish and invertebrate communities (Kemp et
al. 2005).
Dissolved inorganic nutrient concentrations (DIN and PO4) and phytoplankton
biomass (chl a) were one to two orders of magnitude greater in BC than in RC (Fig.
5a). Depth-integrated primary production and respiration, sediment algal biomass and
benthic respiration were also higher in BC but to a lesser degree (Fig. 5). The
presence of a high phytoplankton biomass in BC limited light penetration, with the
euphotic depth several times lower than in the other two creeks. Additionally, the high
phytoplankton biomass, combined with high pelagic respiration rates, resulted in
substantial diel fluctuations in O2 concentrations. High benthic respiration rates in BC
also emphasize the potential importance of this pathway to contribute to O2 depletion
(Boynton & Kemp 1985). The low DO saturation in the early mornings indicates high
rates of night-time respiration and suggests BC experiences regular hypoxia. Overall,
DO saturation in BC was approximately half that found in RC (Fig. 5a). BC has
experienced periodic fish kills along the entire length of the creek and it is likely a
lack of oxygen is responsible.
26
In contrast, there was a relatively minor effect of increased, but smaller nutrient loads
in MC relative to RC and importantly, the impacts were observed only in the water
column at MC1, which is adjacent to the sewage discharge point. All variables at site
MC3 were similar to sites in RC. Dissolved inorganic nutrient concentrations were
most affected at MC1 and were approximately one order of magnitude greater than
RC (Fig. 5a). Pelagic primary production, respiration and phytoplankton biomass
were also affected to a lesser degree (Fig. 5a & b). There were minor differences in
sediment quality and benthic processes at MC1 with sediment chl a and TP
concentrations, 15
N and DIP fluxes slightly higher compared to other sites in MC and
RC. As such, small scale nutrient inputs appear to have a greater impact on pelagic
rather than benthic processes and parameters, but at larger scale nutrient inputs,
benthic processes are most affected (Fig. 5). This pattern is most likely due to
differences in both the magnitude of effluent inputs and the hydrodynamics in the two
creeks (see below).
Biogeochemical process rates measured in BC far exceeded any previously reported
values for Darwin Harbour and other tropical estuaries (Table 5). Based on our study,
BC is considered to be hypereutrophic (Nixon 1995). Pelagic metabolism and benthic
nutrient fluxes in BC were similar to that found in other tropical hypereutrophic
systems such as shrimp ponds (e.g. Alongi et al. 1999a; Burford & Longmore 2001).
The high benthic nutrient fluxes and low denitrification efficiency in BC indicate the
sediments were a major source of dissolved inorganic nutrients to the water column
and, combined with the sewage effluent, contribute to increased algal biomass and
poor water quality. The similarity between benthic primary productivity in all creeks,
despite the higher benthic algal biomass in BC, suggests high TSS and phytoplankton
biomass decreased light availability at the sediment surface. Additionally, in BC the
27
dense algal mat, as demonstrated by the high chl a concentrations, is likely to cause
self-shading.
In MC, the impact of increased nutrient loads was restricted to the water column
adjacent to the sewage discharge point, consistent with a locally mesotrophic system
(Nixon 1995). The treated sewage effluent had a high proportion of ammonium,
nitrate and phosphate relative to the typical creek water but lower relative
concentrations of phytoplankton which is consistent with other studies (e.g. Jones et
al. 2001). Therefore, while there may not be direct input of phytoplankton biomass
with the sewage effluent, the additional nutrients stimulated in situ primary
production in the creek water. The elevated TP concentrations and δ15
N signature of
sediments at MC1 suggest sewage-derived material is deposited at this site, however,
there was no increase in benthic metabolism and nutrient fluxes at this site, indicating
the sewage-derived nutrients and associated primary production were not being
recycled through the sediments in MC.
Depth-integrated pelagic primary production rates in RC and MC were lower than
values reported for the shallow margins of Darwin Harbour (Burford et al. 2008) as
well as tropical coastal waters in Australia and around the world (Table 5). These tidal
creeks are considered to be oligotrophic and are net heterotrophic (P:R ratios in the
water column were ≤1). This is in contrast to the main body of the harbour which is
autotrophic (Burford et al. 2008). The higher turbidity in the tidal creeks results in a
shallower euphotic zone and therefore pelagic primary production is likely to be light
limited relative to the main body of the harbour (McKinnon et al. 2006). The rates of
benthic remineralization in RC and MC were similar to rates reported for other
tropical mangrove environments including Darwin Harbour (Table 5). Denitrification
28
rates in these creeks were high but comparable to the range of estimates for other
estuarine and coastal marine sediments (Seitzinger 1988).
In comparison to the sewage-derived nutrient inputs, the seasonal input of nutrients
associated with freshwater runoff during the wet season has no effect on
biogeochemical processes in the tidal creeks. This is in accordance with the limited
seasonal change in key parameters such as temperature and organic matter supply
from mangroves. The seasonal variations in water column nutrient concentrations in
MC and RC were minor compared to variations observed at sites affected by sewage
effluent.
Controls on Biogeochemical Processes
Pelagic primary production was strongly associated with benthic remineralization in
the PCA, suggesting benthic-pelagic coupling. The higher pelagic primary production,
a P:R ratio close to 1 and low C:N and C:P ratios in BC all reflect a significant algal
contribution and suggest phytoplankton detritus was an important source of organic
matter to the sediments in this creek. Therefore, the increased benthic
remineralization in BC was a response to the stimulated primary production in the
water column. Additionally, primary production in the water column was stimulated
by benthic nutrient fluxes. Benthic nutrient regeneration in BC was far greater than
phytoplankton demand for net growth, which was limited by light availability below
the surface. This results in the accumulation of DIN and PO43-
in the water column.
Overall, there was strong coupling between benthic and pelagic processes in BC.
In RC and MC, depth-integrated primary production rates were much lower than the
benthic remineralization rates, indicating phytoplankton production contributes only a
29
small proportion of the overall organic matter pool in the sediment surface. Sediment
organic matter was driving benthic metabolism rather than phytoplankton detritus in
these two tidal creeks. In addition, benthic regenerated nutrients were not sufficient to
supply all the nutrients required for phytoplankton growth in these creeks. The
remaining nutrient requirements by phytoplankton are likely supplied by oceanic or
terrestrial inputs (Burford et al. 2008; Ferrón et al. 2009). The high denitrification
rates in RC and MC indicate this is the main process controlling nitrogen release to
the water column in the tidal creeks and support the suggestion that nitrogen is
limiting phytoplankton growth in Darwin Harbour (Burford et al. 2008). NO3- levels
in the water column were low and only infrequently was there NO3- influx, indicating
denitrification was controlled by coupled nitrification-denitrification, as is commonly
found in coastal marine systems (Seitzinger 1988).
Denitrification efficiency and phosphorus retention were strongly associated with the
degree of anaerobic degradation in the PCA, suggesting sediment oxygen
consumption was important in controlling nitrogen and phosphorus release. In the
tidal creeks, the community respiratory quotient (CRQ = DIC/O2) was -2 in the
oligotrophic creeks and -4 in the hypereutrophic creek, indicating a shift to dominance
of anaerobic mineralization processes with the increased nutrient loading in BC. This
shift from aerobic to anaerobic metabolism occurs during hypoxic events, caused by
excess nutrient inputs, and involves profound changes in the biogeochemical cycles of
phosphorus and nitrogen (Conley et al. 2009; Soetaert & Middelburg 2009).
One of the most prominent effects of hypoxia is the increased P flux from sediments
(Conley et al. 2009). Phosphate fluxes are controlled by release from degradation of
organic matter and by the buffering mechanism involving iron oxides at the sediment
30
surface (Froelich 1988). The low oxygen conditions and dominance of anaerobic
metabolism pathways in BC contributed to the large benthic PO43-
flux. The ratio of
DIC to PO43-
fluxes was low in BC indicating little or no phosphorus retention in the
sediment. Under small or no increased nutrient loads in MC and RC, the ratio of DIC
to PO43-
fluxes was high, indicating strong phosphate retention by the sediments. The
low efflux of remineralized phosphate is likely controlled in the surface oxidized layer
by sorption with iron oxyhydroxides (Patrick & Khalid 1974).
Hypoxia also affects nitrogen release to the water column which is strongly controlled
by denitrification. Denitrification appears to be inhibited in BC and there are several
possible mechanisms. It is likely the low oxygen conditions cause a breakdown in the
nitrification-denitrification coupling by inhibiting nitrification. Nowicki (1994) found
that highly reduced conditions in enriched sediments near sewage outfalls restricted
O2 penetration and limited nitrification. Additionally, sulfate reduction, the
predominant pathway of anaerobic metabolism, produces sulfide which inhibits
nitrification (Seitzinger 1988). Therefore, in BC where anaerobic metabolism
dominates, denitrification rates could be indirectly affected by sulfide if nitrification is
suppressed. This is supported by the large proportion of N present as NH4+.
Processes affected by hypoxia, such as denitrification and phosphorus retention,
display threshold-like behavior (Webster & Harris 2004; Conley et al. 2009; Eyre &
Ferguson 2009). Regime shifts, involving an abrupt change in ecosystem processes,
can occur once specific thresholds of nutrient inputs are exceeded and this can cause
changes in biological variables that propagate through several trophic levels (Conley
et al. 2009). The breakdown of coupled nitrification-denitrification and subsequent
low denitrification efficiency, as well as the large flux of PO43-
from the sediments to
31
the water column, suggests that thresholds have been exceeded in BC. This is
consistent with the theory that an ecosystem has reached a threshold when the system
switches to one dominated by anaerobic processes (Conley et al. 2009) as was found
in BC. The nutrient loads entering MC are sufficiently small to have not impacted
these key biogeochemical processes, with PO43-
fluxes and denitrification efficiencies
similar to those observed in the comparatively pristine tidal creek. While there is
some evidence of sewage-derived material being deposited at MC1, the assimilation
capacity of the sediments has not yet been exceeded.
The processes occurring in BC follow the generally accepted conceptual models of
eutrophication (e.g. Nixon 1995; Cloern 2001) whereby an increase in the input of
nutrients (in this case from sewage effluent) has stimulated primary production in the
water column, leading to enhanced sedimentation of algal-derived organic matter,
stimulation of microbial decomposition and oxygen consumption and depletion of
water column oxygen. There has been a shift in dominance from aerobic to anaerobic
metabolism and as a result, coupled nitrification-denitrification is inhibited and oxide-
bound phosphorus released. Thus more nutrients are recycled back into the water
column, further stimulating primary production (Kemp et al. 1990; Eyre & Ferguson
2002). Nutrient-generated increases in algal biomass fuel respiration and lead to light
limitation of the phytoplankton and benthos, further generating hypoxic conditions.
Ultimately, there is a positive feedback accelerating eutrophication through internal
loading of nutrients (McGlathery et al. 2004).
Influence of physical processes
The effluent loads are similar between BC and MC but the response of many
biogeochemical processes was far greater in BC (Fig. 5). This suggests that nutrient
32
load alone was not responsible for the observed effects on biogeochemical processes
in BC, and there must be consideration of additional processes or factors. The
susceptibility of estuaries to eutrophication varies and it is now well recognized that
physical attributes, including tidal mixing and associated residence times and optical
properties, act as a filter to modulate the response to nutrient loading (Cloern 2001).
The estimated residence times in the three tidal creeks vary both spatially and
temporally and are controlled by the tidal regime and geomorphology (Wolanski et al.
1992; Wolanski et al. 2000). The lower reaches of the tidal creeks are flushed
efficiently by tidal action while significant trapping can occur in the upper reaches of
BC, particularly during neap tides when tidal flushing is limited. This is typical of
tropical mangrove-lined tidal creeks, for example, Wolanski et al. (2000) reported that
water may reside in the upper reaches of tidal creeks for between 5–15 days, and
flushing is rapid near the mouth. Longer residence times reduce export of nutrients
(Nixon et al. 1996) and favour local degradation of phytoplankton detritus (Koné &
Borges 2008), leading to low dissolved oxygen concentrations and nutrient
enrichment (Boto & Bunt 1981; Trott & Alongi 1999) and enable benthic processes to
have a greater impact on the system. Therefore, the impact on biogeochemical
processes from excess nutrients is most severe in systems where tidal flushing is
limited (Jickells 1998; Herbert 1999), as is the case in BC, and physical processes
play a key role in reducing the risk of algal blooms, hypoxic events and subsequent
changes in dominant biogeochemical processes in the tidal creeks.
Other physical processes may also influence biogeochemical processes, particularly
sediment resuspension (Ståhlberg et al. 2006). Potential effects of resuspension
include increased benthic mineralization, a decline in pelagic O2 concentration,
33
release of porewater nutrients to the water column, desorption of compounds from
suspended sediment particles, decreased light availability and physical disturbance
leading to a decrease of benthic primary production (Hopkinson 1985; Sloth et al.
1996; Wainright & Hopkinson 1997; Ståhlberg et al. 2006; Almroth et al. 2009). In
the shallow tidal creeks of Darwin Harbour, more or less continuous resuspension
caused by the semi-diurnal tides can be found, resulting in a system which is in a
constant state of flux. It is therefore likely that the biogeochemical process rates
reflect the mean environmental conditions in a continuously changing system.
Implications for tropical estuaries
Ecosystem alteration due to anthropogenic nutrient loading of coastal zones is
occurring at a rapid rate in the tropics (Downing et al. 1999). The impact on the
ecological functioning of coastal ecosystems varies in intensity and spatial
distribution, both locally and globally. This study found that the effect of increased
nutrient loads on biogeochemical processes can vary over small spatial scales (i.e.
individual tidal creeks), and this is confounded by physical processes, principally
residence time. These findings are relevant over larger spatial scales. For example, the
importance of denitrification can be assessed on an estuary-wide scale. A whole-of-
harbour nitrogen budget for Darwin Harbour found a net import of N to the harbour
from the ocean of approximately 15,000 t N yr-1
(Burford et al. 2008), however,
denitrification was not included in this budget but it was suggested it may be an
important process. Although the dataset from this study is limited, our calculations
confirm that there could be an approximate equivalent export of N from Darwin
Harbour as a result of denitrification. Therefore, denitrification represents an
important process controlling the amount of N in the harbour as a whole. This is

34
consistent with what has been found throughout the tropics, where microbial
denitrification removes biologically available forms of nitrogen from the water
column producing substantial deficits relative to other nutrients (Beman et al. 2005).
A decrease in denitrification efficiency, as has been observed in BC, can increase the
availability of N in the water column and stimulate primary production which has
important implications on the health and functioning of the whole ecosystem. Further
research is needed to determine the actual contribution of denitrification to the
nitrogen budget for Darwin Harbour.
Overall, the impacts of increased nutrient loads from sewage effluent are relatively
localized and Darwin Harbour, as with most estuaries in tropical northern Australia, is
considered to be relatively pristine. Forecasted increases in population and
urbanization of Darwin will increase the nitrogen and phosphorus loads entering the
harbour as catchment runoff and STP discharge increase. This will pose mounting
pressure on estuarine health on a larger scale. This study has provided measurements
of key biogeochemical processes in Darwin Harbour to inform predictive models used
by estuarine managers. Additionally, the study of biogeochemical processes in
disturbed and relatively pristine tidal creek systems provides important information
which will enable comparison with other, more adversely affected tropical estuaries,
such as those in southeast Asia.
Conclusions
This study has provided a comparison of rates of multiple biogeochemical processes
across three scales of sewage nutrient loading in tropical tidal creeks to identify which
processes are most sensitive to increased loading, thereby providing a broad
perspective of the links between nutrient loads and biogeochemical processes. We
35
have shown that both benthic and pelagic biogeochemical processes are significantly
affected by increased nutrient loads, particularly under the combined influence of
poor tidal flushing. Denitrification, benthic nutrient fluxes and pelagic primary
production were identified as the biogeochemical processes most affected by nutrient
loading in these tidal creek systems. High levels of oxygen consumption, caused by
stimulated primary production and respiration, lead to intermittent hypoxia. This
causes an alteration in the key processes controlling nutrient release, resulting in
hypereutrophic conditions. The integrated approach used in this study provides
relevant information for other tropical estuaries subject to anthropogenic nutrient
loading around the world.
Acknowledgements
We wish to thank the staff from the Aquatic Health Unit at the Northern Territory
Department of Natural Resources, Environment, The Arts and Sport for assistance
with boats and logistics, Emily Saeck, Dominic Valdez, Matt Carey and Craig Smith
for assistance with field work and laboratory analysis, Janice Trafford (GA) for
MIMS analysis, Ed Czobik (NSW DECC) and Frank Krikowa (UC) for nutrient
analysis, Liz Webber (GA) for XRF analysis, Rene Diocares (GU) and Rebecca
Esmay (CMAR) for isotope analysis, Lesley Clemenston (CMAR) for chlorophyll
analysis and Eric Valentine (CDU) for relevant information. We thank Rhys Leeming
(CMAR), Alix Post (GA) and 2 anonymous reviewers whose useful comments
substantially improved earlier versions of this manuscript.
This project was conducted as part of the Tropical Rivers and Coastal Knowledge
(TRaCK) program. TRaCK receives major funding for its research through the
Australian Government’s Commonwealth Environment Research Facilities initiative;
the Australian Government’s Raising National Water Standards Program; Land and
Water Australia; the Fisheries Research and Development Corporation and the
Queensland Government’s Smart State Innovation Fund.
This publication has received permission from the CEO of Geoscience Australia.
References
Almroth E, Tengberg A, Andersson JH, Pakhomova S, Hall POJ (2009) Effects of
resuspension on benthic fluxes of oxygen, nutrients, dissolved inorganic
36
carbon, iron and manganese in the Gulf of Finland, Baltic Sea. Continental
Shelf Res 29: 807-818
Alongi DM, Dixon P, Johnston DJ, Van Tien D, Thanh Xuan T (1999a) Pelagic
processes in extensive shrimp ponds of the Mekong delta, Vietnam.
Aquaculture 175: 121-141
Alongi DM, Sasekumar A, Chong VC, Pfitzner J, Trott LA, Tirendi F, Dixon P,
Brunskill GJ (2004) Sediment accumulation and organic material flux in a
managed mangrove ecosystem: estimates of land-ocean-atmosphere exchange
in peninsular Malaysia. Mar Geol 208: 383-402
Alongi DM, Tirendi F, Dixon P, Trott LA, Brunskill GJ (1999b) Mineralization of
Organic Matter in Intertidal Sediments of a Tropical Semi-enclosed Delta.
Estuar Coast Shelf Sci 48: 451-467
Alongi DM, Wattayakorn G, Pfitzner J, Tirendi F, Zagorskis I, Brunskill GJ,
Davidson A, Clough BF (2001) Organic carbon accumulation and metabolic
pathways in sediments of mangrove forests in southern Thailand. Mar Geol
179: 85-103
Beman JM, Arrigo KR, Matson PA (2005) Agricultural runoff fuels large
phytoplankton blooms in vulnerable areas of the ocean. Nature 434: 211-214
Bianchi TS (2007) Biogeochemistry of Estuaries. Oxford University Press, New York
Boto KG, Bunt JS (1981) Dissolved oxygen and pH relationships in northern
Australian mangrove waterways Limnol Oceanogr 26: 1176-1178
37
Bouillon S, Connolly RM (2009) Carbon Exchange Among Tropical Coastal
Ecosystems. In: Nagelkerken I (Ed) Ecological Connectivity among Tropical
Coastal Ecosystems (pp 45-70). Springer, Dordrecht
Boynton W, Hagy J, Cornwell J, Kemp W, Greene S, Owens M, Baker J, Larsen R
(2008) Nutrient Budgets and Management Actions in the Patuxent River
Estuary, Maryland. Estuaries and Coasts 31: 623-651
Boynton WR, Kemp WM (1985) Nutrient regeneration and oxygen consumption by
sediments along an estuarine salinity gradient. Mar Ecol Prog Ser 23: 45-55
Burford MA, Alongi DM, McKinnon AD, Trott LA (2008) Primary production and
nutrients in a tropical macrotidal estuary, Darwin Harbour, Australia. Estuar
Coast Shelf Sci 79: 440-448
Burford MA, Longmore AR (2001) High ammonium production from sediments in
hypereutrophic shrimp ponds. Mar Ecol Prog Ser 224: 187-195
Caffrey J, Murrell M, Wigand C, McKinney R (2007) Effect of nutrient loading on
biogeochemical and microbial processes in a New England salt marsh.
Biogeochemistry 82: 251-264
Clarke AL, Weckström K, Conley DJ, Anderson NJ, Adser F, Andrén E, de Jonge
VN, Ellegaard M, Juggins S, Kauppila P, Korhola A, Reuss N, Telford RJ,
Vaalgamaa S (2006) Long-term trends in eutrophication and nutrients in the
coastal zone. Limnol Oceanogr 51: 385-397
Cloern JE (2001) Our evolving conceptual model of the coastal eutrophication
problem. Mar Ecol Prog Ser 210: 233-253
38
Conley D, Carstensen J, Vaquer-Sunyer R, Duarte C (2009) Ecosystem thresholds
with hypoxia. Hydrobiologia 629: 21-29
Cook PLM, Revill AT, Clementson LA, Volkman JK (2004) Carbon and nitrogen
cycling on intertidal mudflats of a temperate Australian estuary. III. Sources of
organic matter. Mar Ecol Prog Ser 280: 55-72
Diaz RJ, Rosenberg R (2008) Spreading Dead Zones and Consequences for Marine
Ecosystems. Science 321: 926-929
Dittmar T, Hertkom N, Kattner G, Lara RJ (2006) Mangroves, a major source of
dissolved organic carbon to the oceans. Global Biogeochemical Cycles 20:
GB1012
Downing JA, McClain M, Twilley R, Melack JM, Elser J, Rabalais NN, Lewis WM,
Turner RE, Corredor J, Soto D, Yanez-Arancibia A, Kopaska JA, Howarth
RW (1999) The impact of accelerating land-use change on the N-Cycle of
tropical aquatic ecosystems: Current conditions and projected changes.
Biogeochemistry 46: 109-148
Eyre BD, Ferguson AJP (2002) Comparison of carbon production and decomposition,
benthic nutrient fluxes and denitrification in seagrass, phytoplankton, benthic
microalgae- and macroalgae- dominated warm-temperate Australian lagoons.
Mar Ecol Prog Ser 229: 43-59
Eyre BD, Ferguson AJP (2009) Denitrification efficiency for defining critical loads of
carbon in shallow coastal ecosystems. Hydrobiologia 629: 137-146
39
Ferrón S, Alonso-Pérez F, Anfuso E, Murillo FJ, Ortega T, Castro CG, Forja JM
(2009) Benthic nutrient recycling on the northeastern shelf of the Gulf of
Cádiz (SW Iberian Peninsula). Mar Ecol Prog Ser 390: 79-95
Froelich PN (1988) Kinetic control of dissolved phosphate in natural rivers and
estuaries: A primer on the phosphate buffer mechanism. Limnol Oceanogr 33:
649-668
Haese RR, Murray EJ, Smith CS, Smith J, Clementson L, Heggie DT (2007) Diatoms
control nutrient cycles in a temperate, wave-dominated estuary (southeast
Australia). Limnol Oceanogr 52: 2686-2711
Halpern BS, Walbridge S, Selkoe KA, Kappel CV, Micheli F, D'Agrosa C, Bruno JF,
Casey KS, Ebert C, Fox HE, Fujita R, Heinemann D, Lenihan HS, Madin
EMP, Perry MT, Selig ER, Spalding M, Steneck R, Watson R (2008) A
Global Map of Human Impact on Marine Ecosystems. Science 319: 948-952
Herbert RA (1999) Nitrogen cycling in coastal marine ecosystems. FEMS
Microbiology Reviews 23: 563-590
Hopkinson CS, Jr (1985) Shallow-water benthic and pelagic metabolism. Mar Biol
87: 19-32
Howarth R, Sharpley A, Walker D (2002) Sources of nutrient pollution to coastal
waters in the United States: Implications for achieving coastal water quality
goals. Estuaries and Coasts 25: 656-676
Jennerjahn TC, Ittekkot V, Klopper S, Adi S, Purwo Nugroho S, Sudiana N, Yusmal
A, Prihartanto, Gaye-Haake B (2004) Biogeochemistry of a tropical river
40
affected by human activities in its catchment: Brantas River estuary and
coastal waters of Madura Strait, Java, Indonesia. Estuar Coast Shelf Sci 60:
503-514
Jickells TD (1998) Nutrient biogeochemistry in the coastal zone. Science 281: 217-
222
Jones AB, O'Donohue MJ, Udy J, Dennison WC (2001) Assessing Ecological
Impacts of Shrimp and Sewage Effluent: Biological Indicators with Standard
Water Quality Analyses. Estuar Coast Shelf Sci 52: 91-109
Kana TM, Darkangelo C, Hunt MD, Oldham JB, Bennett GE, Cornwell JC (1994)
Membrane Inlet Mass Spectrometer for Rapid High-Precision Determination
of N2, O2, and Ar in Environmental Water Samples. Analytical Chemistry 66:
4166-4170
Kemp WM, Boynton WR, Adolf JE, Boesch DF, Boicourt WC, Brush G, Cornwell
JC, Fisher TR, Glibert PM, Hagy JD, Harding LW, Houde ED, Kimmel DG,
Miller WD, Newell RIE, Roman MR, Smith EM, Stevenson JC (2005)
Eutrophication of Chesapeake Bay: historical trends and ecological
interactions. Mar Ecol Prog Ser 303: 1-29
Kemp WM, Sampou P, Caffrey J, Mayer M, Henriksen K, Boynton WR (1990)
Ammonium recycling versus denitrification in Chesapeake Bay sediments.
Limnol Oceanogr 35: 1545-1563
41
Koné YJ-M, Borges AV (2008) Dissolved inorganic carbon dynamics in the waters
surrounding forested mangroves of the Ca Mau Province (Vietnam). Estuar
Coast Shelf Sci 77: 409-421
Kristensen E, Andersen FØ, Holmboe N, Holmer M, Thongtham N (2000) Carbon
and nitrogen mineralization in sediments of the Bangrong mangrove area,
Phuket, Thailand. Aquatic Microbial Ecology 22: 199-213
Kristensen E, Flindt MR, Ulomi S, Borges AV, Abril G, Bouillon S (2008) Emission
of CO2 and CH4 to the atmosphere by sediments and open waters in two
Tanzanian mangrove forests. Mar Ecol Prog Ser 370: 53-67
Mackenzie FT, Ver LM, Lerman A (2002) Century-scale nitrogen and phosphorus
controls of the carbon cycle. Chem Geol 190: 13-32
McGlathery KJ, Sundbäck K, Anderson IC (2004) The importance of primary
producers for benthic nitrogen and phosphorus cycling. In: Nielsen SL, Banta
GT & Pedersen MF (Eds) Estuarine Nutrient Cycling: The Influence of
Primary Producers (pp 231-261). Kluwer Academic Publishers, Dordrecht,
The Netherlands
McKinnon AD, Carleton JH, Duggan S (2007) Pelagic production and respiration in
the Gulf of Papua during May 2004. Continental Shelf Res 27: 1643-1655
McKinnon AD, Smit N, Townsend S, Duggan S (2006) Darwin Harbour: Water
quality and ecosystem structure in a tropical harbour in the early stages of
urban development. In: Wolanski E (Ed) The Environment in Asia Pacific
Harbours (pp 433-459). Springer, The Netherlands
42
McKinnon AD, Trott LA, Brinkman R, Duggan S, Castine S, O'Leary RA, Alongi
DM (2010) Seacage aquaculture in a World Heritage Area: The environmental
footprint of a Barramundi farm in tropical Australia. Mar Poll Bull 60: 1489-
1501
Nixon S, Ammerman J, Atkinson L, Berounsky V, Billen G, Boicourt W, Boynton W,
Church T, Ditoro D, Elmgren R, Garber J, Giblin A, Jahnke R, Owens N,
Pilson M, Seitzinger S (1996) The fate of nitrogen and phosphorus at the land-
sea margin of the North Atlantic Ocean. Biogeochemistry 35: 141-180
Nixon SW (1995) Coastal marine eutrophication: a definition, social causes, and
future concerns. Ophelia 41: 199-219
Norrish K, Hutton JT (1969) An accurate X-ray spectrographic method for the
analysis of a wide range of geological samples. Geochim Cosmochim Acta 33:
431-453
Nowicki BL (1994) The Effect of Temperature, Oxygen, Salinity, and Nutrient
Enrichment on Estuarine Denitrification Rates Measured with a Modified
Nitrogen Gas Flux Technique. Estuar Coast Shelf Sci 38: 137-156
Patrick WH, Jr., Khalid RA (1974) Phosphate Release and Sorption by Soils and
Sediments: Effect of Aerobic and Anaerobic Conditions. Science 186: 53-55
Pratihary AK, Naqvi SWA, Naik H, Thorat BR, Narvenkar G, Manjunatha BR, Rao
VP (2009) Benthic fluxes in a tropical Estuary and their role in the ecosystem.
Estuar Coast Shelf Sci 85: 387-398
43
Ram ASP, Nair S, Chandramohan D (2003) Seasonal shift in net ecosystem
production in a tropical estuary Limnol Oceanogr 48: 1601-1607
Richardson K, Jørgensen BB (1996) Eutrophication: Definition, History and Effects.
In: Jørgensen BB & Richardson K (Eds) Eutrophication in Coastal Marine
Systems (pp 1-19). American Geophysical Union, Washington, DC
Rivera-Monroy V, Madden C, Day J, Twilley R, Vera-Herrera F, Alvarez-Guillén H
(1998) Seasonal coupling of a tropical mangrove forest and an estuarine water
column: enhancement of aquatic primary productivity. Hydrobiologia 379: 41-
53
Robertson AI, Daniel PA, Dixon P, Alongi DM (1993) Pelagic biological processes
along a salinity gradient in the Fly delta and adjacent river plume (Papua New
Guinea). Continental Shelf Res 13: 205-224
Rysgaard S, Christensen PB, Nielsen LP (1995) Seasonal variation in nitrification and
denitrification in estuarine sediment colonized by benthic microalgae and
bioturbating infauna. Mar Ecol Prog Ser 126: 111-121
Sarma VVSS, Gupta SNM, Babu PVR, Acharya T, Harikrishnachari N,
Vishnuvardhan K, Rao NS, Reddy NPC, Sarma VV, Sadhuram Y, Murty
TVR, Kumar MD (2009) Influence of river discharge on plankton metabolic
rates in the tropical monsoon driven Godavari estuary, India. Estuar Coast
Shelf Sci 85: 515-524
Seabergh WC (2006) Hydrodynamics of tidal inlets. In: Vincent L & Demirbilek Z
(Eds) Coastal Engineering Manual, Part II, Coastal Hydrodynamics, Chapter
44
6, Engineer Manual 1110-2-110. U.S. Army Corps of Engineers, Washington,
DC
Seitzinger SP (1988) Denitrification in freshwater and coastal marine ecosystems:
ecological and geochemical significance. Limnol Oceanogr 33: 702-724
Sloth NP, Blackburn H, Hansen LS, Risgaard-Petersen N, Lomstein BA (1995)
Nitrogen cycling in sediments with different organic loading. Mar Ecol Prog
Ser 116: 163-170
Sloth NP, Riemann B, Nielsen LP, Blackburn T (1996) Resilience of Pelagic and
Benthic Microbial Communities to Sediment Resuspension in a Coastal
Ecosystem, Knebel Vig, Denmark. Estuar Coast Shelf Sci 42: 405-415
Soetaert K, Middelburg J (2009) Modeling eutrophication and oligotrophication of
shallow-water marine systems: the importance of sediments under stratified
and well-mixed conditions. Hydrobiologia 629: 239-254
Sokal RR, Rohlf FJ (1995) Biometry, 3rd ed. WH Freeman and Company, New York
Ståhlberg C, Bastviken D, Svensson BH, Rahm L (2006) Mineralisation of organic
matter in coastal sediments at different frequency and duration of
resuspension. Estuar Coast Shelf Sci 70: 317-325
Trott LA, Alongi DM (1999) Variability in surface water chemistry and
phytoplankton biomass in two tropical, tidally dominated mangrove creeks.
Mar Freshwater Res 50: 451-457
45
Trott LA, McKinnon AD, Alongi DM, Davidson A, Burford MA (2004) Carbon and
nitrogen processes in a mangrove creek receiving shrimp farm effluent. Estuar
Coast Shelf Sci 59: 197-207
Wainright SC, Hopkinson CS (1997) Effects of sediment resuspension on organic
matter processing in coastal environments: A simulation model. Journal of
Marine Systems 11: 353-368
Webster IT, Harris GP (2004) Anthropogenic impacts on the ecosystems of coastal
lagoons: modelling fundamental biogeochemical processes and management
implications. Mar Freshwater Res 55: 67-78
Williams D, Wolanski E, Spagnol S (2006) Hydrodynamics of Darwin Harbour. In:
Wolanski E (Ed) The Environment in Asia Pacific Harbours (pp 461-476).
Springer, The Netherlands
Wolanski E, Jones M, Bunt JS (1980) Hydrodynamics of a tidal creek-mangrove
swamp system. Mar Freshwater Res 31: 431-450
Wolanski E, Mazda Y, Ridd P (1992) Mangrove hydrodynamics. In: Robertson AI &
Alongi DM (Eds) Tropical Mangrove Ecosystems (pp 43-62). American
Geophysical Union, Washington, D.C.
Wolanski E, Spagnol S, Thomas S, Moore K, Alongi DM, Trott L, Davidson A
(2000) Modelling and Visualizing the Fate of Shrimp Pond Effluent in a
Mangrove-fringed Tidal Creek. Estuar Coast Shelf Sci 50: 85-97

46
Woodroffe CD, Bardsley KN, Ward PJ, Hanley JR (1988) Production of mangrove
litter in a macrotidal embayment, Darwin Harbour, N.T., Australia. Estuar
Coast Shelf Sci 26: 581-598
Zar JH (1999) Biostatistical Analysis, 4th edn. Prentice Hall, NJ.
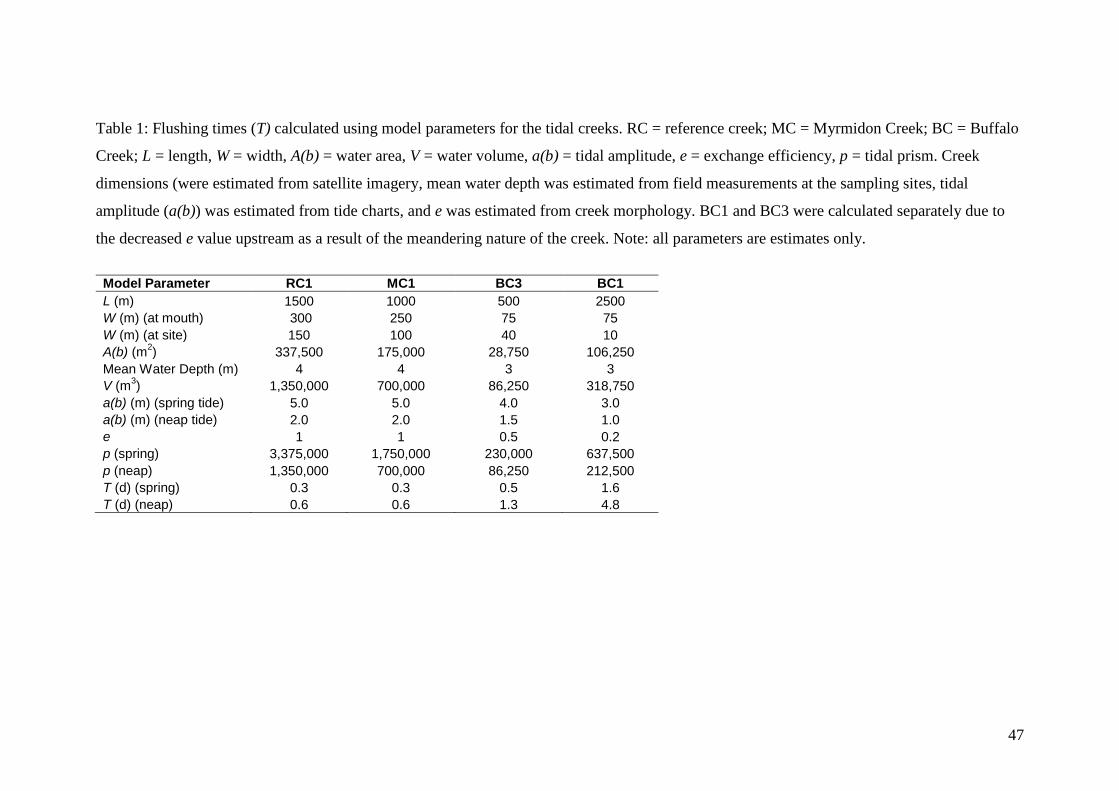
47
Table 1: Flushing times (T) calculated using model parameters for the tidal creeks. RC = reference creek; MC = Myrmidon Creek; BC = Buffalo
Creek; L = length, W = width, A(b) = water area, V = water volume, a(b) = tidal amplitude, e = exchange efficiency, p = tidal prism. Creek
dimensions (were estimated from satellite imagery, mean water depth was estimated from field measurements at the sampling sites, tidal
amplitude (a(b)) was estimated from tide charts, and e was estimated from creek morphology. BC1 and BC3 were calculated separately due to
the decreased e value upstream as a result of the meandering nature of the creek. Note: all parameters are estimates only.
Model Parameter RC1 MC1 BC3 BC1
L (m) 1500 1000 500 2500
W (m) (at mouth) 300 250 75 75
W (m) (at site) 150 100 40 10
A(b) (m2) 337,500 175,000 28,750 106,250
Mean Water Depth (m) 4 4 3 3
V (m3) 1,350,000 700,000 86,250 318,750
a(b) (m) (spring tide) 5.0 5.0 4.0 3.0
a(b) (m) (neap tide) 2.0 2.0 1.5 1.0
e 1 1 0.5 0.2
p (spring) 3,375,000 1,750,000 230,000 637,500
p (neap) 1,350,000 700,000 86,250 212,500
T (d) (spring) 0.3 0.3 0.5 1.6
T (d) (neap) 0.6 0.6 1.3 4.8
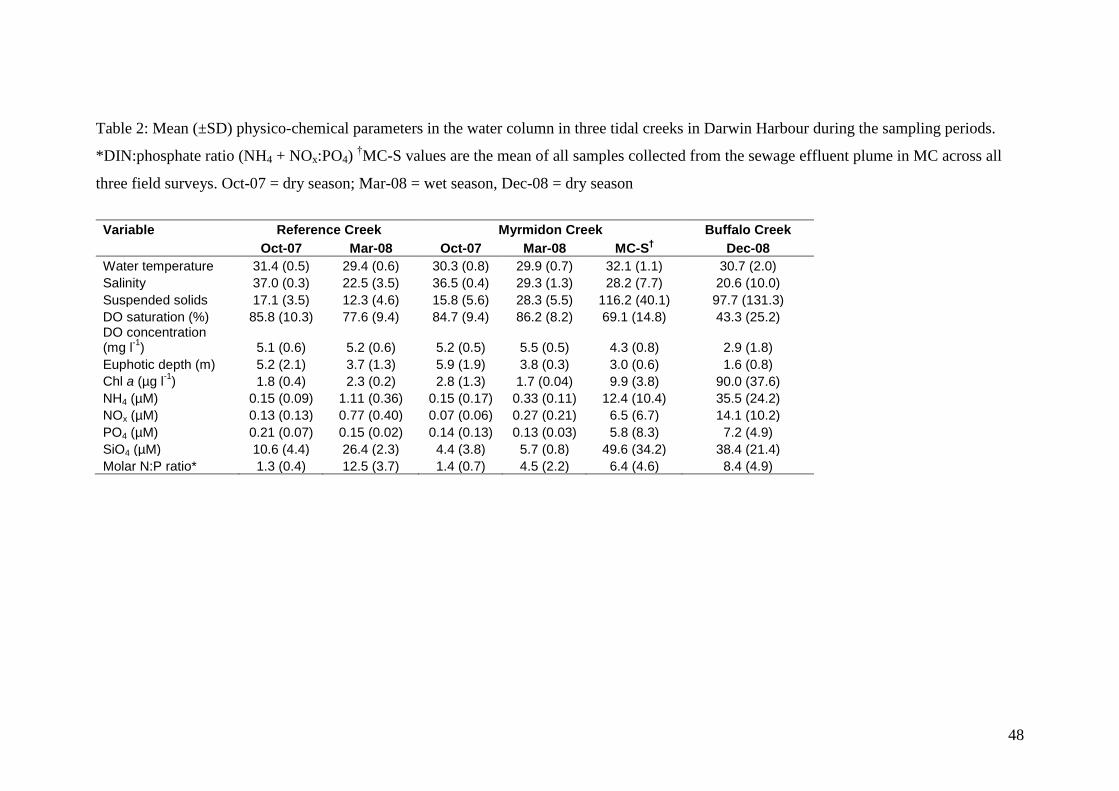
48
Table 2: Mean (±SD) physico-chemical parameters in the water column in three tidal creeks in Darwin Harbour during the sampling periods.
*DIN:phosphate ratio (NH4 + NOx:PO4) †MC-S values are the mean of all samples collected from the sewage effluent plume in MC across all
three field surveys. Oct-07 = dry season; Mar-08 = wet season, Dec-08 = dry season
Variable Reference Creek Myrmidon Creek Buffalo Creek
Oct-07 Mar-08 Oct-07 Mar-08 MC-S† Dec-08
Water temperature 31.4 (0.5) 29.4 (0.6) 30.3 (0.8) 29.9 (0.7) 32.1 (1.1) 30.7 (2.0)
Salinity 37.0 (0.3) 22.5 (3.5) 36.5 (0.4) 29.3 (1.3) 28.2 (7.7) 20.6 (10.0)
Suspended solids 17.1 (3.5) 12.3 (4.6) 15.8 (5.6) 28.3 (5.5) 116.2 (40.1) 97.7 (131.3)
DO saturation (%) 85.8 (10.3) 77.6 (9.4) 84.7 (9.4) 86.2 (8.2) 69.1 (14.8) 43.3 (25.2) DO concentration (mg l
-1) 5.1 (0.6) 5.2 (0.6) 5.2 (0.5) 5.5 (0.5) 4.3 (0.8) 2.9 (1.8)
Euphotic depth (m) 5.2 (2.1) 3.7 (1.3) 5.9 (1.9) 3.8 (0.3) 3.0 (0.6) 1.6 (0.8)
Chl a (µg l-1
) 1.8 (0.4) 2.3 (0.2) 2.8 (1.3) 1.7 (0.04) 9.9 (3.8) 90.0 (37.6)
NH4 (µM) 0.15 (0.09) 1.11 (0.36) 0.15 (0.17) 0.33 (0.11) 12.4 (10.4) 35.5 (24.2)
NOx (µM) 0.13 (0.13) 0.77 (0.40) 0.07 (0.06) 0.27 (0.21) 6.5 (6.7) 14.1 (10.2)
PO4 (µM) 0.21 (0.07) 0.15 (0.02) 0.14 (0.13) 0.13 (0.03) 5.8 (8.3) 7.2 (4.9)
SiO4 (µM) 10.6 (4.4) 26.4 (2.3) 4.4 (3.8) 5.7 (0.8) 49.6 (34.2) 38.4 (21.4)
Molar N:P ratio*
1.3 (0.4) 12.5 (3.7) 1.4 (0.7) 4.5 (2.2) 6.4 (4.6) 8.4 (4.9)
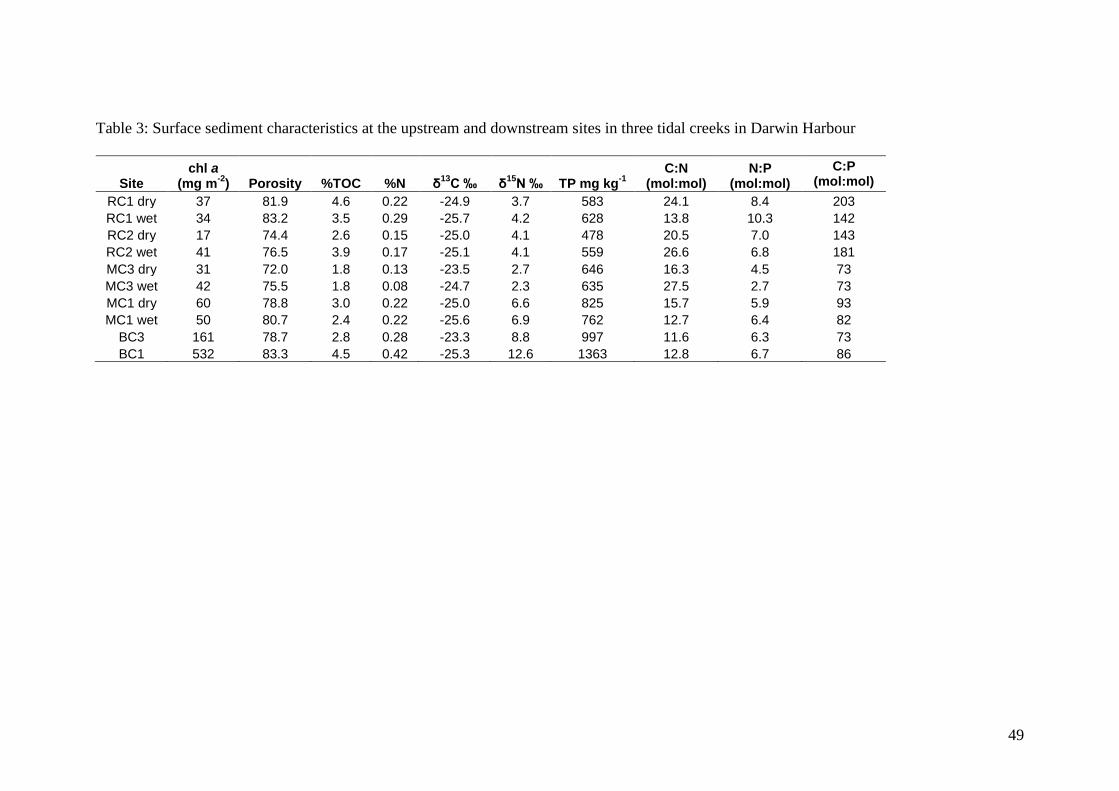
49
Table 3: Surface sediment characteristics at the upstream and downstream sites in three tidal creeks in Darwin Harbour
Site chl a
(mg m-2
) Porosity %TOC %N δ13
C ‰ δ15
N ‰ TP mg kg-1
C:N (mol:mol)
N:P (mol:mol)
C:P (mol:mol)
RC1 dry 37 81.9 4.6 0.22 -24.9 3.7 583 24.1 8.4 203
RC1 wet 34 83.2 3.5 0.29 -25.7 4.2 628 13.8 10.3 142
RC2 dry 17 74.4 2.6 0.15 -25.0 4.1 478 20.5 7.0 143
RC2 wet 41 76.5 3.9 0.17 -25.1 4.1 559 26.6 6.8 181
MC3 dry 31 72.0 1.8 0.13 -23.5 2.7 646 16.3 4.5 73
MC3 wet 42 75.5 1.8 0.08 -24.7 2.3 635 27.5 2.7 73
MC1 dry 60 78.8 3.0 0.22 -25.0 6.6 825 15.7 5.9 93
MC1 wet 50 80.7 2.4 0.22 -25.6 6.9 762 12.7 6.4 82
BC3 161 78.7 2.8 0.28 -23.3 8.8 997 11.6 6.3 73
BC1 532 83.3 4.5 0.42 -25.3 12.6 1363 12.8 6.7 86
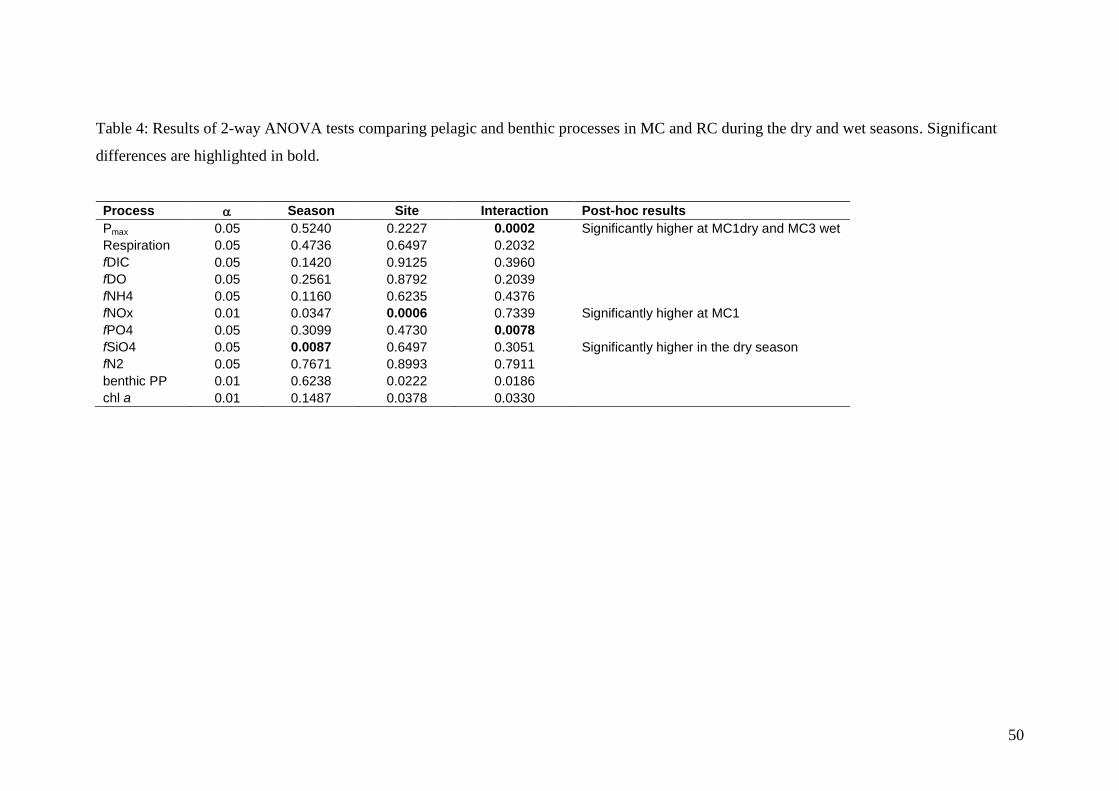
50
Table 4: Results of 2-way ANOVA tests comparing pelagic and benthic processes in MC and RC during the dry and wet seasons. Significant
differences are highlighted in bold.
Process Season Site Interaction Post-hoc results
Pmax 0.05 0.5240 0.2227 0.0002 Significantly higher at MC1dry and MC3 wet
Respiration 0.05 0.4736 0.6497 0.2032
fDIC 0.05 0.1420 0.9125 0.3960
fDO 0.05 0.2561 0.8792 0.2039
fNH4 0.05 0.1160 0.6235 0.4376
fNOx 0.01 0.0347 0.0006 0.7339 Significantly higher at MC1
fPO4 0.05 0.3099 0.4730 0.0078
fSiO4 0.05 0.0087 0.6497 0.3051 Significantly higher in the dry season
fN2 0.05 0.7671 0.8993 0.7911
benthic PP 0.01 0.6238 0.0222 0.0186
chl a 0.01 0.1487 0.0378 0.0330
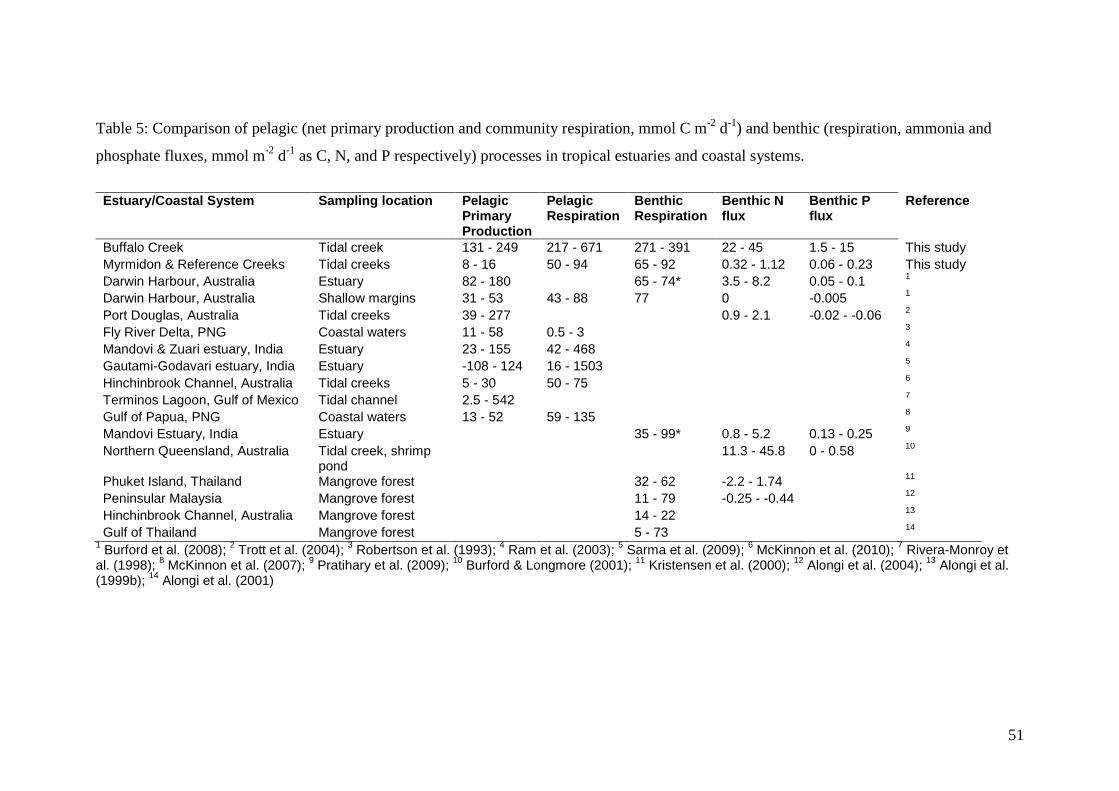
51
Table 5: Comparison of pelagic (net primary production and community respiration, mmol C m-2
d-1
) and benthic (respiration, ammonia and
phosphate fluxes, mmol m-2
d-1
as C, N, and P respectively) processes in tropical estuaries and coastal systems.
Estuary/Coastal System Sampling location Pelagic
Primary Production
Pelagic Respiration
Benthic Respiration
Benthic N flux
Benthic P flux
Reference
Buffalo Creek Tidal creek 131 - 249 217 - 671 271 - 391 22 - 45 1.5 - 15 This study
Myrmidon & Reference Creeks Tidal creeks 8 - 16 50 - 94 65 - 92 0.32 - 1.12 0.06 - 0.23 This study
Darwin Harbour, Australia Estuary 82 - 180 65 - 74* 3.5 - 8.2 0.05 - 0.1 1
Darwin Harbour, Australia Shallow margins 31 - 53 43 - 88 77 0 -0.005 1
Port Douglas, Australia Tidal creeks 39 - 277 0.9 - 2.1 -0.02 - -0.06 2
Fly River Delta, PNG Coastal waters 11 - 58 0.5 - 3 3
Mandovi & Zuari estuary, India Estuary 23 - 155 42 - 468 4
Gautami-Godavari estuary, India Estuary -108 - 124 16 - 1503 5
Hinchinbrook Channel, Australia Tidal creeks 5 - 30 50 - 75 6
Terminos Lagoon, Gulf of Mexico Tidal channel 2.5 - 542 7
Gulf of Papua, PNG Coastal waters 13 - 52 59 - 135 8
Mandovi Estuary, India Estuary 35 - 99* 0.8 - 5.2 0.13 - 0.25 9
Northern Queensland, Australia Tidal creek, shrimp pond
11.3 - 45.8 0 - 0.58
10
Phuket Island, Thailand Mangrove forest 32 - 62 -2.2 - 1.74 11
Peninsular Malaysia Mangrove forest 11 - 79 -0.25 - -0.44 12
Hinchinbrook Channel, Australia Mangrove forest 14 - 22 13
Gulf of Thailand Mangrove forest 5 - 73 14
1 Burford et al. (2008);
2 Trott et al. (2004);
3 Robertson et al. (1993);
4 Ram et al. (2003);
5 Sarma et al. (2009);
6 McKinnon et al. (2010);
7 Rivera-Monroy et
al. (1998); 8 McKinnon et al. (2007);
9 Pratihary et al. (2009);
10 Burford & Longmore (2001);
11 Kristensen et al. (2000);
12 Alongi et al. (2004);
13 Alongi et al.
(1999b); 14
Alongi et al. (2001)
52
Figure Captions
Fig. 1: Map of Darwin Harbour, Australia showing the three tidal creeks and sampling
sites in: a) Reference Creek, b) Myrmidon Creek and c) Buffalo Creek
Fig. 2: Mean dry season benthic fluxes (mmol m-2
d-1
), denitrification efficiency (%),
water column primary production (Pmax) and respiration (mmol m-3
h-1
) in RC, MC
and BC. Error bars = SE of replicate samples. n.d. = no data.1-way ANOVA results
are shown (p-values) with significant differences highlighted in bold (adjusted =
0.02532, unless otherwise stated). Sites which are significantly different (as identified
in post hoc comparisons) indicated as sd.
Fig. 3: Mean benthic and pelagic respiration and primary productivity. Error bars =
SE of replicate samples. 1-way ANOVA results are shown (p-values) with significant
differences highlighted in bold (adjusted also shown). Sites which are significantly
different (as identified in post hoc comparisons) indicated as sd.
Fig. 4: Vector diagram (A) indicating he loadings on PCA1 and PC2 and biplot of
sites (B). Closed symbols = dry season; open symbols = wet season
Fig. 5: Plot showing the relative impact on a) water quality parameters, b) pelagic
processes, c) sediment parameters and d) benthic processes at each site compared to
RC. Values for each site were calculated by dividing the mean rates and
concentrations of each variable by the mean rates and concentrations measured in RC.
Data from the dry and wet season were averaged for these calculations. Note the
different y-axis scale in d).
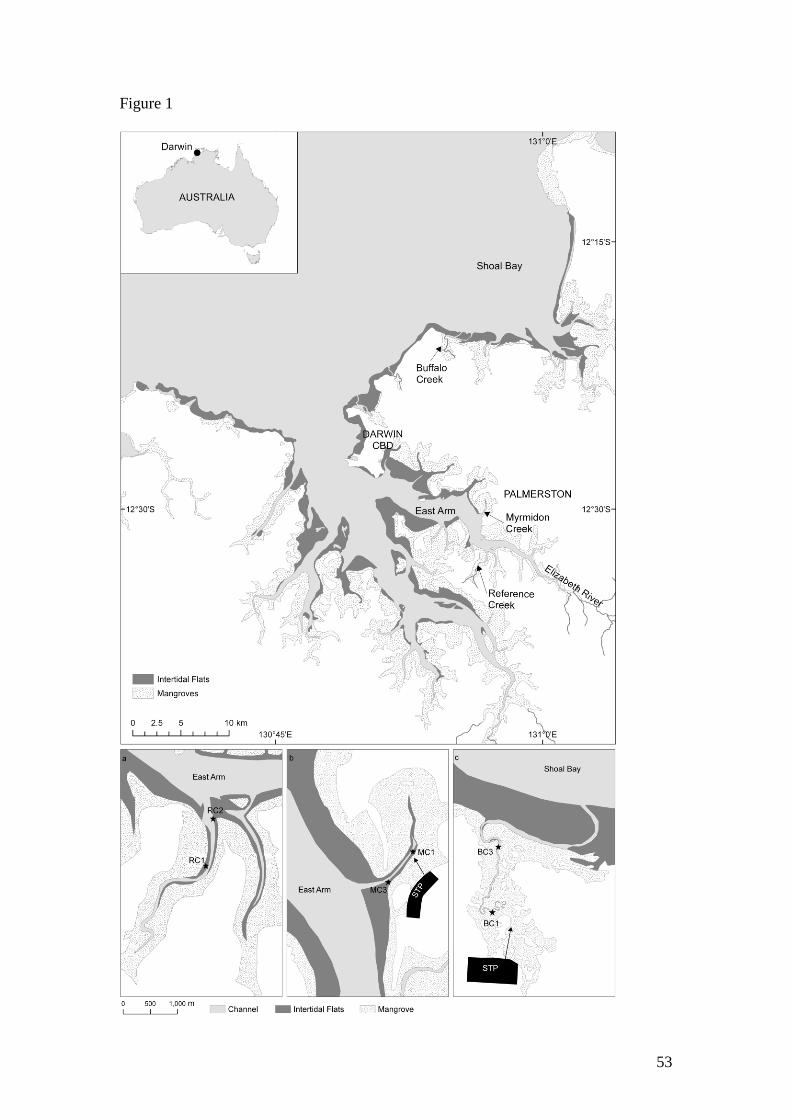
53
Figure 1
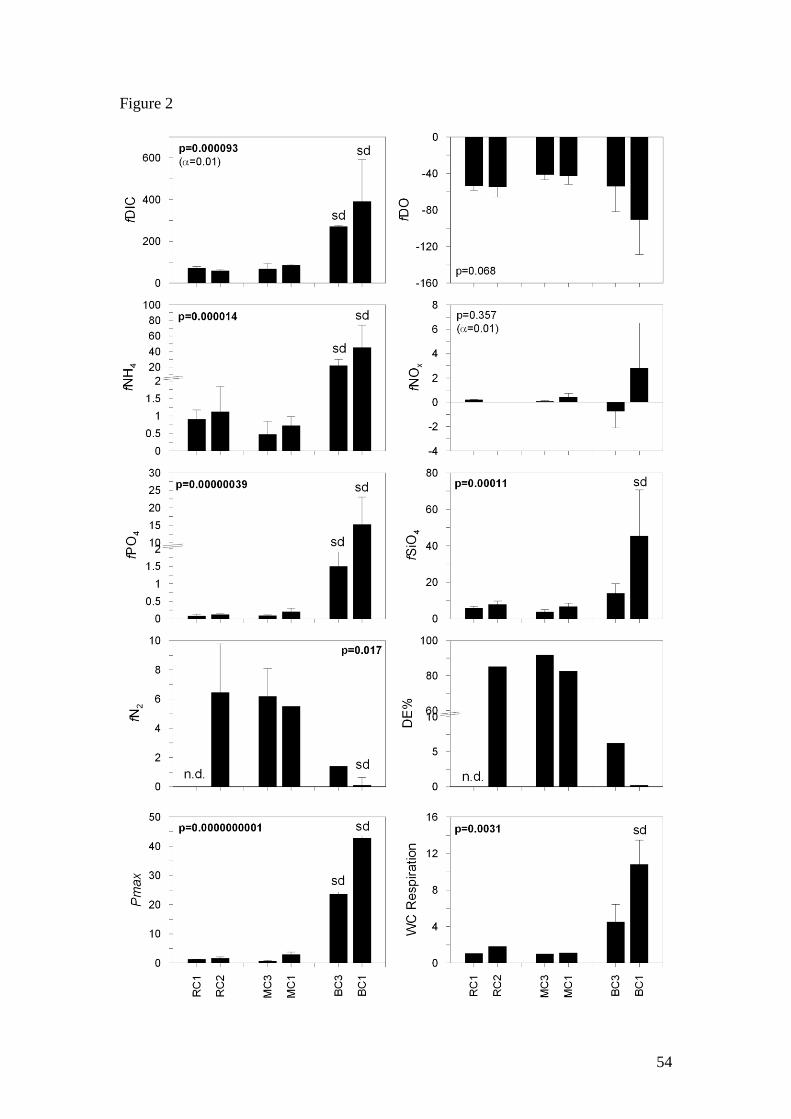
54
Figure 2
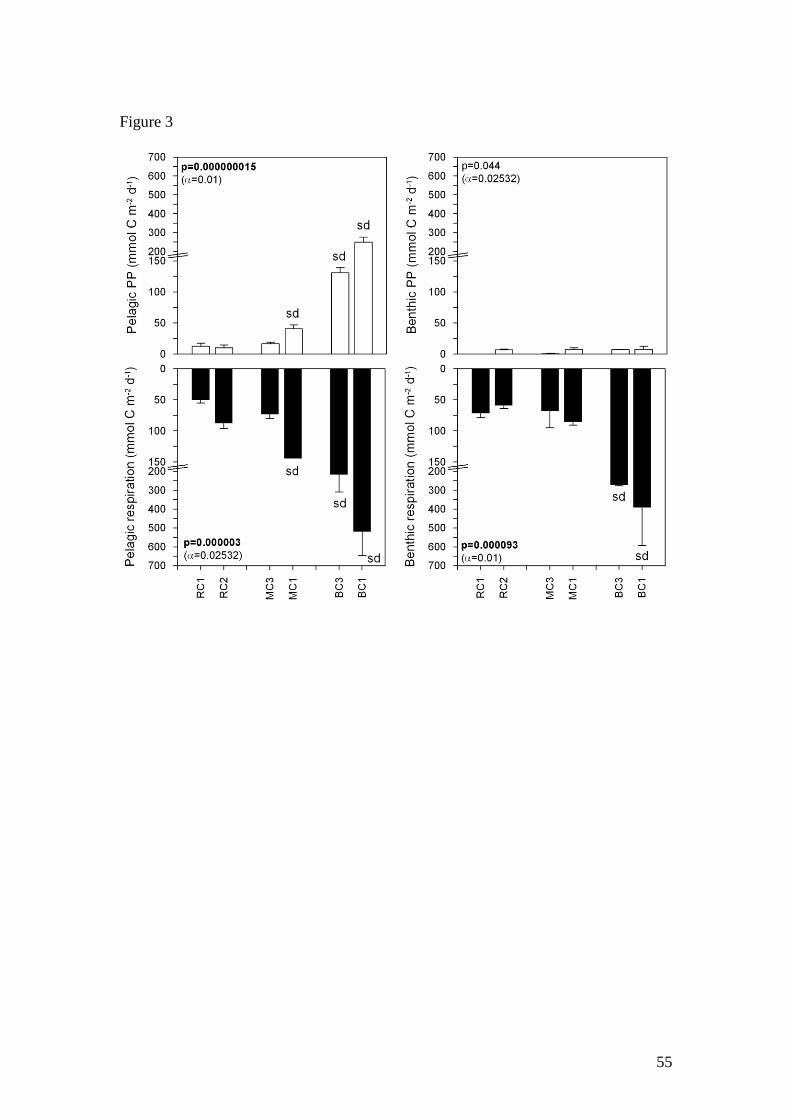
55
Figure 3
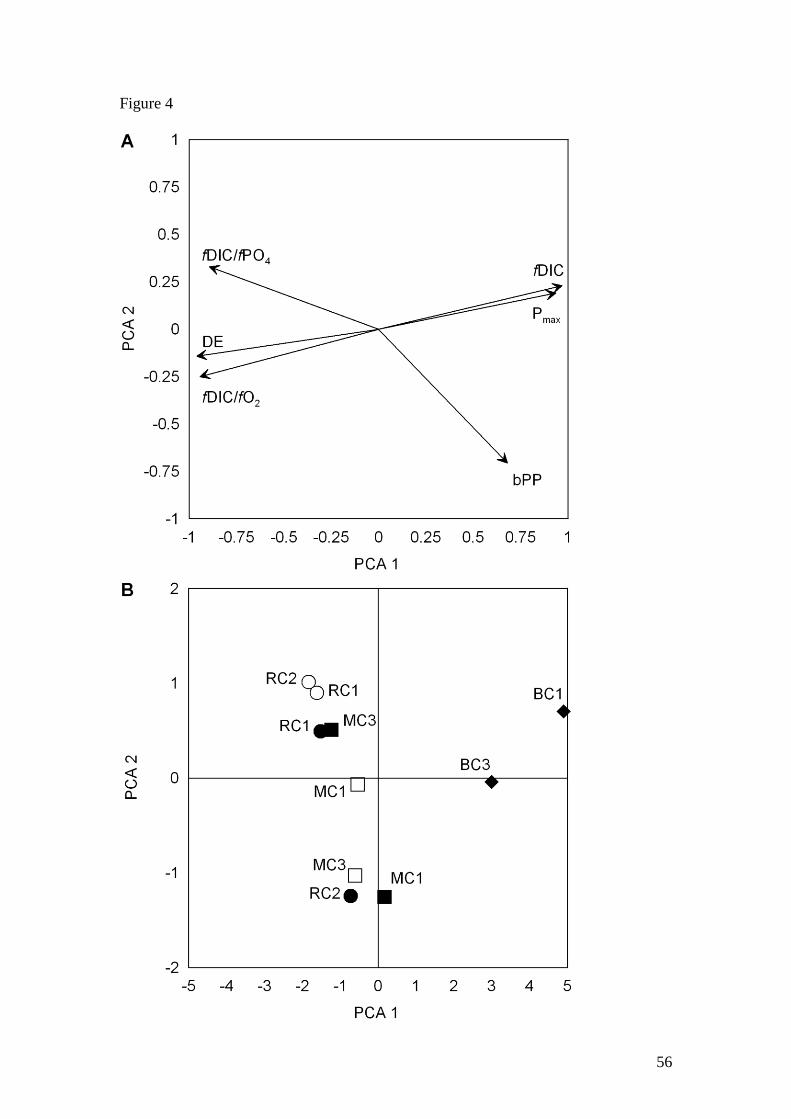
56
Figure 4
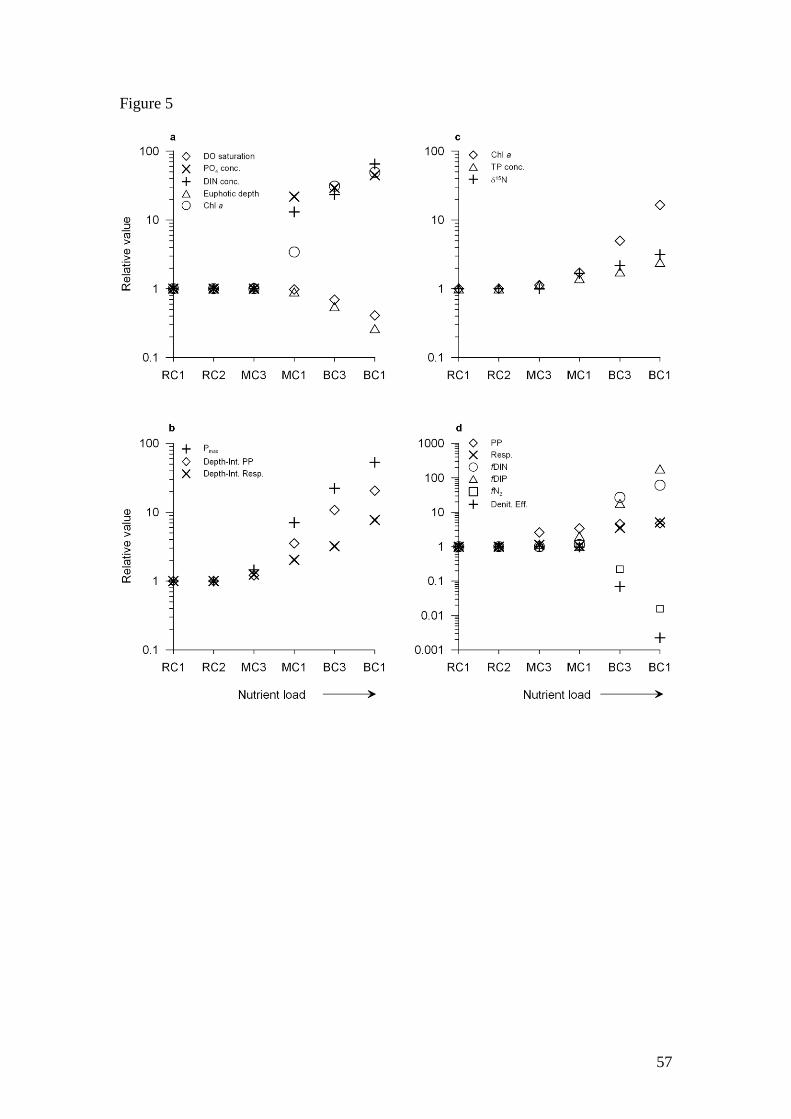
57
Figure 5
Related Documents