Effect of nanoconfinement on liquid-crystal polymer chains Davide Micheletti, Luca Muccioli, Roberto Berardi, Matteo Ricci, and Claudio Zannoni a Dipartimento di Chimica Fisica e Inorganica and Consorzio Interuniversitario Nazionale per la Scienza e Tecnologia dei Materiali (INSTM), Università di Bologna, Viale Risorgimento 4, 40136 Bologna, Italy Received 29 July 2005; accepted 26 September 2005; published online 12 December 2005 We apply a Monte Carlo polymerization model for Gay-Berne J. Chem. Phys. 74, 3316 1981 monomers that we have recently introduced J. Chem. Phys. 121, 9123 2004 to investigate with computer simulations the effects of nanoconfinement and anchoring type on the structure of the main-chain liquid-crystal polymers formed in thin films, in the presence of several types of surface alignment: parallel to the interface random and uniform or perpendicular to it homeotropic. We perform first a study of the confined monomers and then we examine the features of the polymer chains obtained from an isotropic or nematic sample. We find a significant effect of the anchoring conditions on the characteristics of the chains and particularly striking differences between planar and homeotropic boundaries. Furthermore, our results indicate that the choice of different anchorings could be used to tune the linearity and degree of polymerization of the chains. © 2005 American Institute of Physics. DOI: 10.1063/1.2125707 I. INTRODUCTION Thin films of nematic liquid crystals LCs play a very important role in technological applications. 1 First and fore- most is their use in displays and electro-optical devices, 2 but more recently a number of other applications, particularly as biosensors, 3 smart elastomeric materials, 4,5 and nanoscale devices 6 are emerging. Many of these applications rely on the fact that, close to the film boundaries, the ordering of the LC is affected by the physical or chemical inhomogeneities of the surfaces, with the nematic LC acting as an amplifier of these interfacial perturbations 3 creating various types of local molecular organizations. 7 The influence of surface effects on the nematic properties propagates to distances up to tens of microns, 3 but it becomes even more interesting when the LC phase thickness reduces to a few molecular layers, 8 giving raise to molecular organizations with novel properties with respect to the bulk case. This could also be the case of nan- othin film separating two micron-sized colloidal particles where the much larger diameter gives an effectively flat interface. 9 Apart from the technological interest, the influ- ence of confinement on the phase behavior of LC is of high fundamental interest, and has been widely studied in a vari- ety of environments ranging from simple suspended thin films to micrometric pores and nanosized systems. 10 In par- ticular, the confinement is found to induce capillary conden- sation of a nematic due to the aligning action of the confining surface on an otherwise massive isotropic fluid. In that case, the short-range liquid-crystal-wall interaction creates a weak nematic ordering, which decays into the isotropic bulk. Vari- ous surface treatments have been developed, particularly in display technology, to induce and control some specifically tailored organizations of LC materials. 2 For instance, the alignment perpendicular to the surface homeotropic can be obtained by coating, e.g., with lecithin 8 or certain polyimides, 11 while alignment in the cell plane can be ob- tained by mechanically rubbing a polymer-deposited film, 12 with SiO 2 sublimation, 12 or with suitable gold deposition. 3 On the other hand, untreated hydrophilic mica causes an ori- entation of the director of nematic LC parallel to the surface. 8 In nondisplay applications an increasingly impor- tant technique for consolidating the specific LC molecular organizations obtained is that of polymerizing suitably cho- sen prepolymer-monomer LC mixtures. 13 This strategy for controlling surface interactions offers in principle the possi- bility of creating thin films of polymer with well-defined molecular organization and optical or mechanical properties. 14 Until now, there have been various theoretical studies of low molar mass LCs in restricted geometries with the help of Monte Carlo MC coarse-grained rodlike 15–21 or disklike, 22 and lattice simulations 17 but many aspects still remain to be clarified, in particular, those linked to specific surface- orienting effects rather than just confinement. Regarding the properties of confined polymer solutions and polymer thin films, 14 they have been the subject of ex- tensive studies due to the interest in many applications such as lubrication, colloidal dispersion, and chromatographic separations. The properties of the confined solutions depend on many factors such as the nature of the confining surface, the geometry of the confining object, and chain flexibility. Therefore, despite a large number of computer simulations that have been reported in literature ranging from lattice MC, 23–26 lattice-Boltzmann, 27,28 bead and spring MC, 29–31 and atomistic molecular dynamics, 32 there is still a keen in- terest in understanding the behavior and properties of such systems. For instance, very little is available on the effects of various boundary conditions on phase organization of pre- polymers and on the resulting polymer chain organization after the reaction has taken place. a Electronic mail: [email protected] THE JOURNAL OF CHEMICAL PHYSICS 123, 224705 2005 0021-9606/2005/12322/224705/10/$22.50 © 2005 American Institute of Physics 123, 224705-1 Downloaded 19 Dec 2005 to 137.204.192.37. Redistribution subject to AIP license or copyright, see http://jcp.aip.org/jcp/copyright.jsp

Welcome message from author
This document is posted to help you gain knowledge. Please leave a comment to let me know what you think about it! Share it to your friends and learn new things together.
Transcript

THE JOURNAL OF CHEMICAL PHYSICS 123, 224705 �2005�
Effect of nanoconfinement on liquid-crystal polymer chainsDavide Micheletti, Luca Muccioli, Roberto Berardi, Matteo Ricci, and Claudio Zannonia�
Dipartimento di Chimica Fisica e Inorganica and Consorzio Interuniversitario Nazionale per la Scienzae Tecnologia dei Materiali (INSTM), Università di Bologna, Viale Risorgimento 4,40136 Bologna, Italy
�Received 29 July 2005; accepted 26 September 2005; published online 12 December 2005�
We apply a Monte Carlo polymerization model for Gay-Berne �J. Chem. Phys. 74, 3316 �1981��monomers that we have recently introduced �J. Chem. Phys. 121, 9123 �2004�� to investigate withcomputer simulations the effects of nanoconfinement and anchoring type on the structure of themain-chain liquid-crystal polymers formed in thin films, in the presence of several types of surfacealignment: parallel to the interface �random and uniform� or perpendicular to it �homeotropic�. Weperform first a study of the confined monomers and then we examine the features of the polymerchains obtained from an isotropic or nematic sample. We find a significant effect of the anchoringconditions on the characteristics of the chains and particularly striking differences between planarand homeotropic boundaries. Furthermore, our results indicate that the choice of differentanchorings could be used to tune the linearity and degree of polymerization of the chains. © 2005American Institute of Physics. �DOI: 10.1063/1.2125707�
I. INTRODUCTION
Thin films of nematic liquid crystals �LCs� play a veryimportant role in technological applications.1 First and fore-most is their use in displays and electro-optical devices,2 butmore recently a number of other applications, particularly asbiosensors,3 smart elastomeric materials,4,5 and nanoscaledevices6 are emerging. Many of these applications rely onthe fact that, close to the film boundaries, the ordering of theLC is affected by the physical or chemical inhomogeneitiesof the surfaces, with the nematic LC acting as an amplifier ofthese interfacial perturbations3 creating various types of localmolecular organizations.7 The influence of surface effects onthe nematic properties propagates to distances up to tens ofmicrons,3 but it becomes even more interesting when the LCphase thickness reduces to a few molecular layers,8 givingraise to molecular organizations with novel properties withrespect to the bulk case. This could also be the case of nan-othin film separating two micron-sized colloidal particleswhere the much larger diameter gives an effectively flatinterface.9 Apart from the technological interest, the influ-ence of confinement on the phase behavior of LC is of highfundamental interest, and has been widely studied in a vari-ety of environments ranging from simple suspended thinfilms to micrometric pores and nanosized systems.10 In par-ticular, the confinement is found to induce capillary conden-sation of a nematic due to the aligning action of the confiningsurface on an otherwise massive isotropic fluid. In that case,the short-range liquid-crystal-wall interaction creates a weaknematic ordering, which decays into the isotropic bulk. Vari-ous surface treatments have been developed, particularly indisplay technology, to induce and control some specificallytailored organizations of LC materials.2 For instance, thealignment perpendicular to the surface �homeotropic� can be
a�
Electronic mail: [email protected]0021-9606/2005/123�22�/224705/10/$22.50 123, 2247
Downloaded 19 Dec 2005 to 137.204.192.37. Redistribution subject to
obtained by coating, e.g., with lecithin8 or certainpolyimides,11 while alignment in the cell plane can be ob-tained by mechanically rubbing a polymer-deposited film,12
with SiO2 sublimation,12 or with suitable gold deposition.3
On the other hand, untreated hydrophilic mica causes an ori-entation of the director of nematic LC parallel to thesurface.8 In nondisplay applications an increasingly impor-tant technique for consolidating the specific LC molecularorganizations obtained is that of polymerizing suitably cho-sen prepolymer-monomer LC mixtures.13 This strategy forcontrolling surface interactions offers in principle the possi-bility of creating thin films of polymer with well-definedmolecular organization and optical or mechanicalproperties.14
Until now, there have been various theoretical studies oflow molar mass LCs in restricted geometries with the help ofMonte Carlo �MC� coarse-grained rodlike15–21 or disklike,22
and lattice simulations17 but many aspects still remain to beclarified, in particular, those linked to specific surface-orienting effects rather than just confinement.
Regarding the properties of confined polymer solutionsand polymer thin films,14 they have been the subject of ex-tensive studies due to the interest in many applications suchas lubrication, colloidal dispersion, and chromatographicseparations. The properties of the confined solutions dependon many factors such as the nature of the confining surface,the geometry of the confining object, and chain flexibility.Therefore, despite a large number of computer simulationsthat have been reported in literature ranging from latticeMC,23–26 lattice-Boltzmann,27,28 bead and spring MC,29–31
and atomistic molecular dynamics,32 there is still a keen in-terest in understanding the behavior and properties of suchsystems. For instance, very little is available on the effects ofvarious boundary conditions on phase organization of pre-polymers and on the resulting polymer chain organization
after the reaction has taken place.© 2005 American Institute of Physics05-1
AIP license or copyright, see http://jcp.aip.org/jcp/copyright.jsp
224705-2 Micheletti et al. J. Chem. Phys. 123, 224705 �2005�
In this paper we are interested in modeling the effect ofconfinement and polymerization on the main-chain liquid-crystal polymers33 grown in a nanoconfined environment, byusing a recently proposed coarse grained polymerizationmodel for Gay-Berne �GB� monomers.34 We shall also inves-tigate the effects of walls confinement at nanometric scale onthe ordering of monomers, focusing on five different surfaceanchorings: homeotropic weak �HOw�, homeotropic strong�HOs�, random planar �RP�, uniform alignment �UA�, andpurely repulsive confining walls �RW�.
II. MODEL
The systems under study are constituted by a liquidphase of either LC monomers or oligomers, confined be-tween two parallel smooth surfaces at nanometric separation,whose properties are governed by molecule-molecule andmolecule-surface interactions. The transformation betweenthe monomeric and the polymeric phases is accomplished bya series of irreversible reactions steps, which allows the for-mation of bonds between the growing chain and unreactedmonomer particles.
The total energy per particle of the system consists ofboth nonbonded and bonded intrachain terms. Normalizingto the number N of initial monomers in the sample, we canwrite the total dimensionless energy per particle U* as
U* = U/�0 = UGB* + Ubond
* + Uw* , �1�
where UGB* and Ubond
* are the monomer-monomer nonbondedand bonded interactions, Uw
* is the wall-monomer interaction,and �0 is an unit for the energy scale to be introduced later.
We describe the interaction between monomeric liquid-crystalline units with an attractive-repulsive Gay-Berne pairpotential35 that has been shown to yield smectic and nematicLC phases �for a review see Ref. 36�. The total nonbondedinteraction term UGB is calculated over all pairs as
UGB* =
1
N�i�j
�1 − bij�UGB* �ui,u j,rij� , �2�
with �i�j =�i=1N−1� j=i+1
N , and bij =1 if i and j are bonded andzero otherwise. The GB interaction energy between two par-ticles i and j consists of an anisotropic and shifted form ofthe 12-6 Lennard-Jones �LJ� potential:35,37
UGB* �ui,u j,rij� = 4���,���ui,u j, rij�
� �� �s
rij − ��ui,u j, rij� + �s�12
− � �s
rij − ��ui,u j, rij� + �s�6 . �3�
The analytical expressions for the interaction strength func-tion ��ui , u j , rij� and for the range function ��ui , u j , rij�, aswell as the specific parameters used here, are the same intro-duced in Refs. 36 and 37.
Regarding the modeling of the bonded interactions, ev-ery molecule carries either one or two reaction sites �whichallow it to act, respectively, as a radical initiator or as amonomer� that can become links upon reaction. In that case
the GB interaction between a linked pair of monomers isDownloaded 19 Dec 2005 to 137.204.192.37. Redistribution subject to
replaced by a sum of stretching and bending finitely extend-able nonlinear elastic38 �FENE� potential contributions, sothat the bonded energy per particle term is
Ubond* =
1
N�i�j
bij�Us*�sij� + U�
*��ij� + U0*� , �4�
where sij and �ij are the bond length and bending angle. TheFENE pair interaction stretching Us
*�sij� and angular U�*��ij�
energies between two reaction sites i and j can be written ingeneral terms as:38
U�*��ij� = − K� ln�1 − �ij − �eq
Q� − �eq�2� , �5�
where �ij =sij for the stretching, and �ij =�ij for the bendingenergy. Here �eq is either the equilibrium bond length seq orbend angle �eq, and K�=��Q�−�eq�2 /2, where � is a stiff-ness parameter, and �Q�−�eq� is the maximum displacementfrom the equilibrium value. If the distance or the angle areequal to seq or �eq, respectively, then the pair bonding energyis equal to the U0
* value.
A. Surface-monomer interaction
The specific anisotropic surface-monomer interactionhas been taken into account by embedding two sphericalsites, labeled A and B, within each GB ellipsoid �see Fig. 1�.The interaction energy between the sites of particle i and the
*
FIG. 1. A sketch of the MC simulation cell setup, consisting of two confin-ing planar surfaces perpendicular to the laboratory x axis. The periodicboundary conditions have been applied along y and z directions. We alsoshow a monomer GB particle with two embedded surface interaction sites Aand B, and a vector parallel to the surface n, and the angle between themonomer axis and n.
smooth wall, Uw�i�, is given by a shifted �n ,m� potential
AIP license or copyright, see http://jcp.aip.org/jcp/copyright.jsp
224705-3 Effect of nanoconfinement on liquid-crystal polymer chains J. Chem. Phys. 123, 224705 �2005�
Uw* �i� = f�ui�Kw �
site=A,B� �w
rwisite + �w
�n
− �isite �w
rwisite + �w
�m� , �6�
where Kw is the interaction strength term, f�ui� is an aniso-tropic angular term which influences particles’ alignmentwith respect to an in-plane surface axis, �i
A and �iB are site
specific coefficients, and rwiA and rwi
B are the sites distancesfrom the wall �see Fig. 1�. The �w parameter has been chosenequal to �s, i.e., the short axis of a GB monomer. As for thechoice of the exponents, we recall that by integrating thedispersion interaction between a LJ particle and an infiniteslab formed by LJ centers, an overall particle-surface poten-tial governed by a �9,3� law is obtained. In the literature, theparticle-surface energy is usually modeled with a variety ofrepulsive and attractive exponents, like the �10,4� exponentsimplemented by Steuer et al.,18 and the �9,3� used by Quin-tana et al.21 and by Caprion and Ryckaert22 Considering thatthe most common materials mentioned in the Introductionare far from being completely smooth8 and also the existenceof electrostatic interactions1 between surfaces and molecules,we have arbitrarily set the repulsive coefficient n to a softervalue of 6 to allow for some surface penetration, while keep-ing m=3.
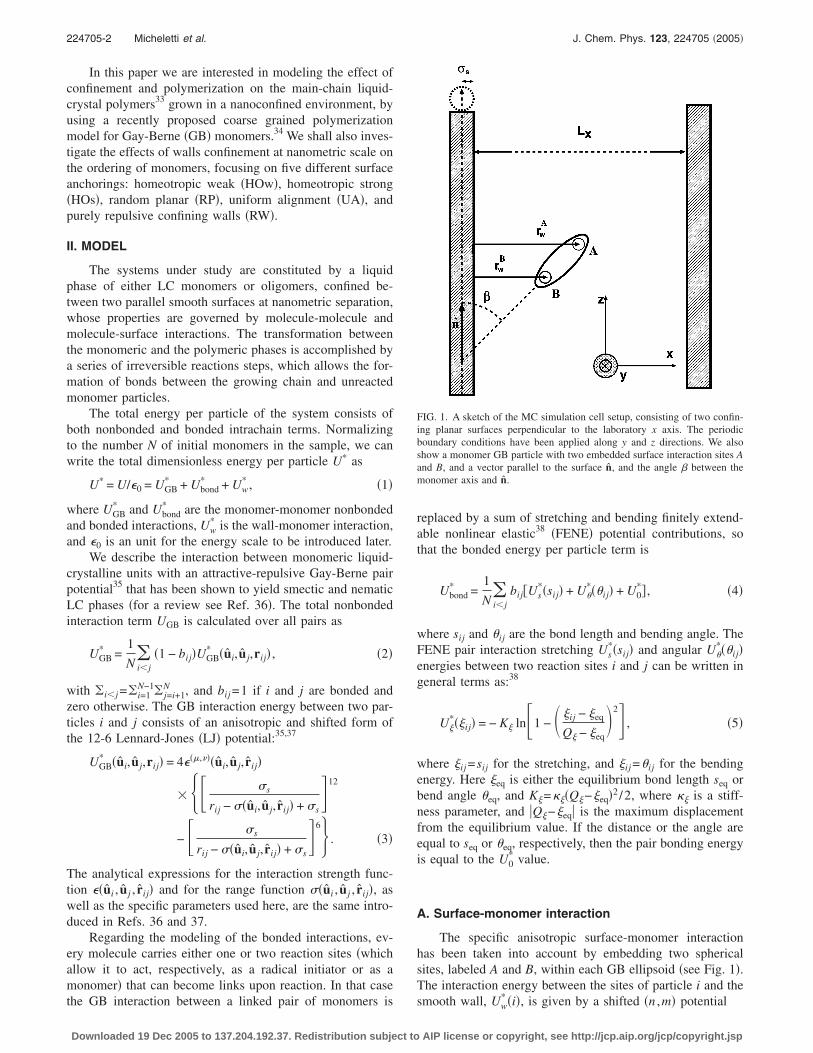
In Table I we list the coefficients used to parametrize thevarious anchoring presented in the Introduction.
In the RW case with f�ui�=1, �iA=1, and �i
B=1, there isno preferential orientation for molecules at the surface andthe surface interactions cutoff is equal to 1, in order to havea purely repulsive confinement.
The RP parametrization is the same as RW, except forthe the surface interaction cutoff, which has been set to thedistance between the two surfaces Lx; this choice has alsobeen adopted for all other anchoring models.
By setting f�ui�= �ui · n�2, �iA=1, and �i
B=1 we favor in-stead an uniform alignment anchoring �UA� to the surfacealong the n z direction of the laboratory frame.
Homeotropic anchoring is finally obtained choosingf�ui�=1, and �i
B=0. In this case the B site does not interactwith the surface and the combination of a preferential inter-action of only one of the molecular ends and a close surfacepacking tends to align particles perpendicularly. This param-etrization specializes in strong �HOs� and weak �HOw� ho-meotropic anchorings, when we further specify �i
A=2 or 1.
TABLE I. Parametrizations of the particle-surface potential Uw* �see Eq. �5�
for description of the coefficients� for the anchoring conditions studied inthis work: RW=repulsive wall, RP=random planar, UA=uniform align-ment, HOw=weak homeotropic, and HOs=homeotropic strong.
Boundary RW RP UA HOw HOs
f�ui� 1 1 �ui · n�2 1 1�i
A 1 1 1 1 1�i
B 1 1 1 0 0Kw 9 9 9 18 36
cutoff 1 Lx Lx Lx Lx
The particle-wall interaction strength value has been set
Downloaded 19 Dec 2005 to 137.204.192.37. Redistribution subject to
to Kw=9 in order to have the maximum wall-site Uw* energy
equal to the strongest UGB* side-by-side interaction. In the
case of homeotropic anchoring instead, we have counterbal-anced the lacking B site interaction with a stronger constantKw=18 for HOw, and Kw=36 for HOs. This latter parametri-zation results in a maximum interaction twice the UGB
* side-by-side energy.36,37 In other words, the HOs parametrizationensures “strong anchoring” conditions, i.e., that thesurface-LC interaction is stronger than the interaction be-tween the first LC layer and the LC bulk.
III. CONFINED MONOMER SIMULATIONS
As a preliminary stage we have studied the ordering ofthe confined monomeric system in presence of the five an-choring of Table I. These simulations have also provided thestarting configurations for the nanoconfined polymerizationdescribed in the next section.
We have simulated, using the MC technique under ca-nonical constant �NVT� conditions, systems of N=4096 GBmonomeric particles contained in a cubic box with periodicboundaries39 along the y and z axes and confined betweentwo planar slabs along the x direction. The sample dimen-sions employed were Lx=Ly =Lz=24�0, which correspond toa scaled number density �*=N�0
3 /V=0.3. The parametriza-tion chosen for the GB interactions is that of Ref. 37 with�=1, �=3, short axis �s=1�0, long axis �e=3�0, and welldepths �s=1�0, �e=0.2�0, giving isotropic, nematic andsmectic phases. In particular, the bulk phase of this systempresents a nematic-isotropic phase transition at scaled tem-perature TNI
* �3.55.37 The parameters �0 and �0 are the unitsof length and energy: if one GB ellipsoid is considered as atypical calamitic mesogen with TNI�355K, they can be es-timated as �0�5 Å and �0=kBTNI/TNI
* �1 kcal/mol. Withthis parametrization, the thickness of the confined sample�which is eight particles lengths� is approximately 12 nm.
For every confinement case we have performed a se-quence of cooling MC runs starting from an equilibratedisotropic sample at T*=3.8, while higher-temperaturesamples have been obtained by heating. For every state pointwe have performed equilibrations at least 200 MC kcycleslong �1 cycle being equal to N attempted MC moves�, fol-lowed by a production run of the same length.
We have characterized these systems by considering thetemperature dependence of the average total energy �U*�,and the second-rank orientational order-parameter �P2
�d��, cal-
culated with respect to the LC phase director d,40 and com-pared them with the bulk GB system of Ref. 37
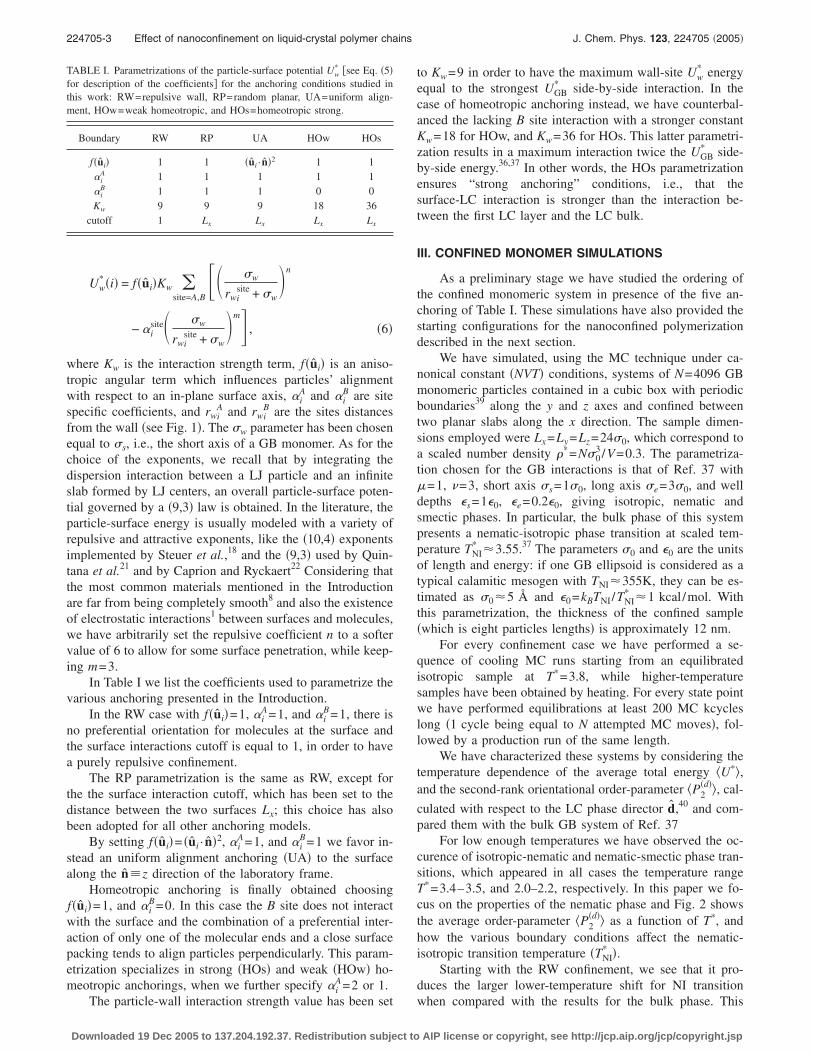
For low enough temperatures we have observed the oc-curence of isotropic-nematic and nematic-smectic phase tran-sitions, which appeared in all cases the temperature rangeT*=3.4–3.5, and 2.0–2.2, respectively. In this paper we fo-cus on the properties of the nematic phase and Fig. 2 showsthe average order-parameter �P2
�d�� as a function of T*, andhow the various boundary conditions affect the nematic-isotropic transition temperature �TNI
* �.Starting with the RW confinement, we see that it pro-
duces the larger lower-temperature shift for NI transition
when compared with the results for the bulk phase. ThisAIP license or copyright, see http://jcp.aip.org/jcp/copyright.jsp

224705-4 Micheletti et al. J. Chem. Phys. 123, 224705 �2005�
result can be ascribed to the combination of two phenomena,whose separate contributions are hard to disentangle: the re-placement of a part of the bulk intermolecular energy withthe particle-walls interactions with no surface anisotropicalignment, and the slight variation of the sample densitygiven by the repulsive softness of the walls. While for con-tainers at least of micrometric scale, the sample volume canbe considered constant and walls softness can be neglected,when going to the nanometric scale the effective volumeavailaible to the molecules between soft surfaces is not ageometrical quantity and has to be measured, and further-more it depends on temperature. For our samples we haveestimated as a lower bound of the effective density �*
=0.285; this 5% density variation is sufficient to change no-ticeably the phase GB diagram and the direct comparisonwith the bulk results for �*=0.3 is more difficult. Nonethe-less, all anchoring potentials studied share the same repulsiveterm and consequently can be consistently compared withthe RW results, which we choose as reference confined sys-tem; moving back to the �P2
�d�� plot of Fig. 2, we can observea relatively sharp NI transition for the bulk, RW, and RPcases. The HOw case shows instead a much weaker transi-tion temperature, and gives samples with a partial residualorientational ordering immediately above TNI
* �paranematic�.The UA and HOs anchorings produce an almost continuous�P2
�d�� transition and show a net residual order also at thehighest-temperature studied. The strong orienting effect ofthe boundaries is not uniform across the sample and pro-duces well-defined and ordered molecular layers near to the
FIG. 2. Average order parameter �P2�d�� �plot �a��, and average energy per
particle �U*� �plot �b�� for the nanoconfined GB monomers samples as func-tion of the temperature T*. The bulk energy profile in plot �b� has been takenfrom Ref. 37.
confining surfaces �see sample snapshots in Fig. 3�.
Downloaded 19 Dec 2005 to 137.204.192.37. Redistribution subject to
In Fig. 2 we also report the average �U*� values as afunction of T* and we observe again how the RW and RPinternal energy curves are similar in shape to the bulk casebut shifted in temperature. Furthermore, the �U*� at the NItransition for the RP sample is close to that for the RWanchoring: the isotropic attractive surface-monomer interac-tion does not affect significantly the NI transition. For theHOs, and UA boundaries the energy profiles show only mod-est changes in slope around TNI
* , confirming again that thenanoconfinement promotes NI transition of a second-order
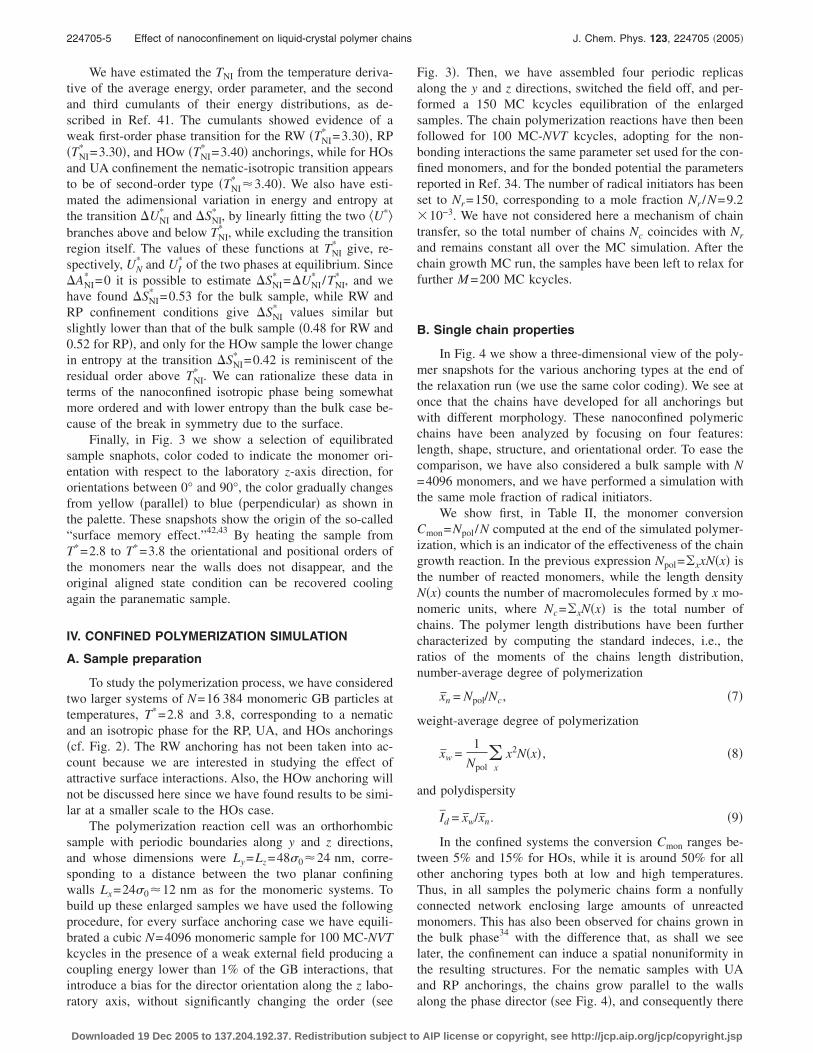
FIG. 3. Correlation function gw�x*� at T*=2.8 �nematic phase, plot �a�� andT*=3.8 �isotropic phase, plot �b�� for nanoconfined GB monomers samples:we also show from the left to the right the nematic and isotropic snapshotsof the laboratory y-axis views for the RP ��P2
�d��=0.69 �a�, and 0.03 �b��, UA��P2
�d��=0.74, and 0.27 �b��, and HOs ��P2�d��=0.71, and 0.22 �b�� anchorings.
character.
AIP license or copyright, see http://jcp.aip.org/jcp/copyright.jsp
224705-5 Effect of nanoconfinement on liquid-crystal polymer chains J. Chem. Phys. 123, 224705 �2005�
We have estimated the TNI from the temperature deriva-tive of the average energy, order parameter, and the secondand third cumulants of their energy distributions, as de-scribed in Ref. 41. The cumulants showed evidence of aweak first-order phase transition for the RW �TNI
* =3.30�, RP�TNI
* =3.30�, and HOw �TNI* =3.40� anchorings, while for HOs
and UA confinement the nematic-isotropic transition appearsto be of second-order type �TNI
* �3.40�. We also have esti-mated the adimensional variation in energy and entropy atthe transition UNI
* and SNI* , by linearly fitting the two �U*�
branches above and below TNI* , while excluding the transition
region itself. The values of these functions at TNI* give, re-
spectively, UN* and UI
* of the two phases at equilibrium. Since ANI
* =0 it is possible to estimate SNI* = UNI
* /TNI* , and we
have found SNI* =0.53 for the bulk sample, while RW and
RP confinement conditions give SNI* values similar but
slightly lower than that of the bulk sample �0.48 for RW and0.52 for RP�, and only for the HOw sample the lower changein entropy at the transition SNI
* =0.42 is reminiscent of theresidual order above TNI
* . We can rationalize these data interms of the nanoconfined isotropic phase being somewhatmore ordered and with lower entropy than the bulk case be-cause of the break in symmetry due to the surface.
Finally, in Fig. 3 we show a selection of equilibratedsample snaphots, color coded to indicate the monomer ori-entation with respect to the laboratory z-axis direction, fororientations between 0° and 90°, the color gradually changesfrom yellow �parallel� to blue �perpendicular� as shown inthe palette. These snapshots show the origin of the so-called“surface memory effect.”42,43 By heating the sample fromT*=2.8 to T*=3.8 the orientational and positional orders ofthe monomers near the walls does not disappear, and theoriginal aligned state condition can be recovered coolingagain the paranematic sample.
IV. CONFINED POLYMERIZATION SIMULATION
A. Sample preparation
To study the polymerization process, we have consideredtwo larger systems of N=16 384 monomeric GB particles attemperatures, T*=2.8 and 3.8, corresponding to a nematicand an isotropic phase for the RP, UA, and HOs anchorings�cf. Fig. 2�. The RW anchoring has not been taken into ac-count because we are interested in studying the effect ofattractive surface interactions. Also, the HOw anchoring willnot be discussed here since we have found results to be simi-lar at a smaller scale to the HOs case.
The polymerization reaction cell was an orthorhombicsample with periodic boundaries along y and z directions,and whose dimensions were Ly =Lz=48�0�24 nm, corre-sponding to a distance between the two planar confiningwalls Lx=24�0�12 nm as for the monomeric systems. Tobuild up these enlarged samples we have used the followingprocedure, for every surface anchoring case we have equili-brated a cubic N=4096 monomeric sample for 100 MC-NVTkcycles in the presence of a weak external field producing acoupling energy lower than 1% of the GB interactions, thatintroduce a bias for the director orientation along the z labo-
ratory axis, without significantly changing the order �seeDownloaded 19 Dec 2005 to 137.204.192.37. Redistribution subject to
Fig. 3�. Then, we have assembled four periodic replicasalong the y and z directions, switched the field off, and per-formed a 150 MC kcycles equilibration of the enlargedsamples. The chain polymerization reactions have then beenfollowed for 100 MC-NVT kcycles, adopting for the non-bonding interactions the same parameter set used for the con-fined monomers, and for the bonded potential the parametersreported in Ref. 34. The number of radical initiators has beenset to Nr=150, corresponding to a mole fraction Nr /N=9.2�10−3. We have not considered here a mechanism of chaintransfer, so the total number of chains Nc coincides with Nr
and remains constant all over the MC simulation. After thechain growth MC run, the samples have been left to relax forfurther M =200 MC kcycles.
B. Single chain properties
In Fig. 4 we show a three-dimensional view of the poly-mer snapshots for the various anchoring types at the end ofthe relaxation run �we use the same color coding�. We see atonce that the chains have developed for all anchorings butwith different morphology. These nanoconfined polymericchains have been analyzed by focusing on four features:length, shape, structure, and orientational order. To ease thecomparison, we have also considered a bulk sample with N=4096 monomers, and we have performed a simulation withthe same mole fraction of radical initiators.
We show first, in Table II, the monomer conversionCmon=Npol /N computed at the end of the simulated polymer-ization, which is an indicator of the effectiveness of the chaingrowth reaction. In the previous expression Npol=�xxN�x� isthe number of reacted monomers, while the length densityN�x� counts the number of macromolecules formed by x mo-nomeric units, where Nc=�xN�x� is the total number ofchains. The polymer length distributions have been furthercharacterized by computing the standard indeces, i.e., theratios of the moments of the chains length distribution,number-average degree of polymerization
xn = Npol/Nc, �7�
weight-average degree of polymerization
xw =1
Npol�
x
x2N�x� , �8�
and polydispersity
Id = xw/xn. �9�
In the confined systems the conversion Cmon ranges be-tween 5% and 15% for HOs, while it is around 50% for allother anchoring types both at low and high temperatures.Thus, in all samples the polymeric chains form a nonfullyconnected network enclosing large amounts of unreactedmonomers. This has also been observed for chains grown inthe bulk phase34 with the difference that, as shall we seelater, the confinement can induce a spatial nonuniformity inthe resulting structures. For the nematic samples with UAand RP anchorings, the chains grow parallel to the walls
along the phase director �see Fig. 4�, and consequently thereAIP license or copyright, see http://jcp.aip.org/jcp/copyright.jsp

224705-6 Micheletti et al. J. Chem. Phys. 123, 224705 �2005�
are no geometrical constraints to the radical propagation. Thepolymerization degree xn increases as temperature decreaseswhile order increases, and all indeces are similar to the bulkvalues, only with a tendency for the UA sample to giveslightly higher values. This behavior is consistent with ahigher probability of successful MC reactive moves in thelow-temperature systems, where the synergic effects of con-
TABLE II. Standard average chain growth indeces:polymerization, and polydispersity index Id obtainednanoconfinements and temperatures described in the
Boundary RP UA
T* 2.8 3.8 2.8Cmon 0.48 0.44 0.52
xn 52.9 48.0 56.4xw 56.4 49.3 60.0
Id1.1 1.0 1.1
Downloaded 19 Dec 2005 to 137.204.192.37. Redistribution subject to
finement and orientational order favors the polymerization.In the nematic with homeotropic confinement instead, radi-cals close to the surfaces have reduced positional and orien-tational mobilities due to the strong anisotropic aligning po-tential, and chains grow preferentially straight andperpendicular to the walls �see Fig. 4�. In this case, the av-erage degree of polymerization xn has an upper bound im-
FIG. 4. Three-dimensional views of the equilibratedconfined polymeric samples for the RP plot �a�, UA plot�b�, and HOs plot �c� anchorings at temperature T*
=2.8 �nematic phase, left column�, and at T*=3.8 �iso-tropic phase, right column�. The reference frame is alsoshown, while the monomeric particles and the confiningsurfaces have been omitted.
ersion Cmon, numeral xn and weight xw degrees ofthe MC simulated polymerization for the different
HOs bulk
2.8 3.8 2.8 3.80.05 0.15 0.49 0.485.7 16.8 53.1 51.56.8 24.3 56.3 52.81.2 1.5 1.1 1.0
convfrom
text.
3.80.47
51.853.8
1.0
AIP license or copyright, see http://jcp.aip.org/jcp/copyright.jsp
¯
224705-7 Effect of nanoconfinement on liquid-crystal polymer chains J. Chem. Phys. 123, 224705 �2005�
posed by the ratio between walls separation and monomerlength, which is Lx /�e�8, and the resulting conversion isonly few units percent �see Table II�.
In the isotropic samples the additional effect on proper-ties due to the confinement with respect to the bulk polymeris not very relevant for the UA case. For the RP boundariesinstead, xn and xw are smaller than in the bulk, hinting to asurface effect which partially unfavors the chain growth. The
Id index is not influenced in both the RP and UA cases. Forthe HOs sample the presence of an isotropic fluid in thesample center weakens the geometrical constrains on themaximum attainable conversion measured for the nematic
sample and Cmon triplicates while Id slightly increases. No-tice that, since the radicals initiators have been created atrandom positions, and since the homeotropic confinementinvariably terminates the growth of every chain whosepropagating radical reaches a surface, the HOs confinement
determines a higher value of Id with respect to the UA andRP cases, that are characterized by a narrow distribution ofchain lengths. These simulation results suggest the appealingpossibility of dimensioning a nanoconfined nematic reactioncell with HOs anchoring to tailor a desired maximum degreeof polymerization.
We have also calculated �and reported in Table III� otherspecific chain length observables as the average square end-to-end distance defined as
�ree2 � =
1
MNc�m=1
M
�k=1
Nc
re,e�m,k�2
, �10�
where ree�m,k� is the distance between the terminal tips of the
first and last monomeric units for the kth chain in the mthMC configuration, and the average square gyration radius
�rgyr2 � =
1
MNc�m=1
M
�k=1
Nc 1
xk�i=1
xk
ri,cm�m,k�2
, �11�
where ri,cm�m,k� is the distance between the ith monomer position
and the center of mass for the kth chain of the mth configu-ration. During the MC relaxation run, these distances haveshowed only small variations �of the order of 1%� from thevalues attained at the end of the chain growth run. This be-havior suggests that after the polymerization reaction isstopped, in spite of being the conversions not higher than
TABLE III. Average second-rank order parameter, eused to characterize chains length and shape of the b
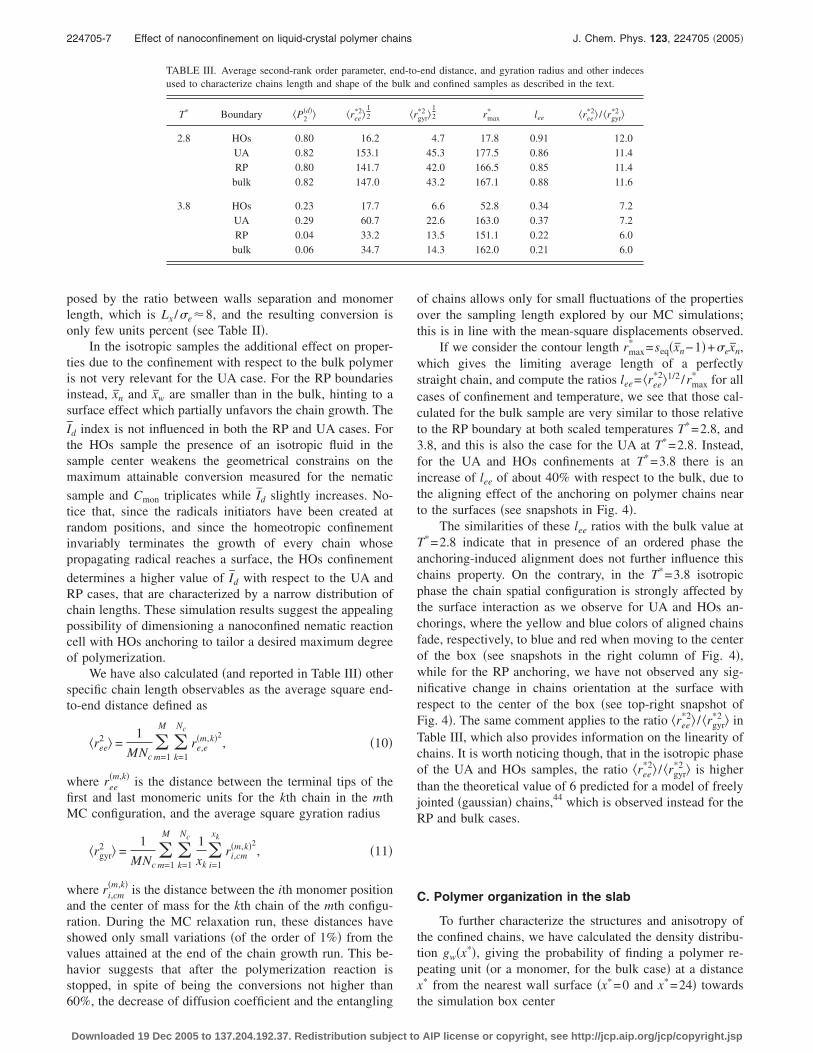
T* Boundary �P2�d�� �ree
*2�12
2.8 HOs 0.80 16.2UA 0.82 153.1RP 0.80 141.7
bulk 0.82 147.0
3.8 HOs 0.23 17.7UA 0.29 60.7RP 0.04 33.2
bulk 0.06 34.7
60%, the decrease of diffusion coefficient and the entangling
Downloaded 19 Dec 2005 to 137.204.192.37. Redistribution subject to
of chains allows only for small fluctuations of the propertiesover the sampling length explored by our MC simulations;this is in line with the mean-square displacements observed.
If we consider the contour length rmax* =seq�xn−1�+�exn,
which gives the limiting average length of a perfectlystraight chain, and compute the ratios lee= �ree
*2�1/2 /rmax* for all
cases of confinement and temperature, we see that those cal-culated for the bulk sample are very similar to those relativeto the RP boundary at both scaled temperatures T*=2.8, and3.8, and this is also the case for the UA at T*=2.8. Instead,for the UA and HOs confinements at T*=3.8 there is anincrease of lee of about 40% with respect to the bulk, due tothe aligning effect of the anchoring on polymer chains nearto the surfaces �see snapshots in Fig. 4�.
The similarities of these lee ratios with the bulk value atT*=2.8 indicate that in presence of an ordered phase theanchoring-induced alignment does not further influence thischains property. On the contrary, in the T*=3.8 isotropicphase the chain spatial configuration is strongly affected bythe surface interaction as we observe for UA and HOs an-chorings, where the yellow and blue colors of aligned chainsfade, respectively, to blue and red when moving to the centerof the box �see snapshots in the right column of Fig. 4�,while for the RP anchoring, we have not observed any sig-nificative change in chains orientation at the surface withrespect to the center of the box �see top-right snapshot ofFig. 4�. The same comment applies to the ratio �ree
*2� / �rgyr*2 � in
Table III, which also provides information on the linearity ofchains. It is worth noticing though, that in the isotropic phaseof the UA and HOs samples, the ratio �ree
*2� / �rgyr*2 � is higher
than the theoretical value of 6 predicted for a model of freelyjointed �gaussian� chains,44 which is observed instead for theRP and bulk cases.
C. Polymer organization in the slab
To further characterize the structures and anisotropy ofthe confined chains, we have calculated the density distribu-tion gw�x*�, giving the probability of finding a polymer re-peating unit �or a monomer, for the bulk case� at a distancex* from the nearest wall surface �x*=0 and x*=24� towards
-end distance, and gyration radius and other indecesnd confined samples as described in the text.
gyr*2 �
12 rmax
* lee �ree*2� / �rgyr
*2 �
4.7 17.8 0.91 12.045.3 177.5 0.86 11.442.0 166.5 0.85 11.443.2 167.1 0.88 11.6
6.6 52.8 0.34 7.222.6 163.0 0.37 7.213.5 151.1 0.22 6.014.3 162.0 0.21 6.0
nd-toulk a
�r
the simulation box center
AIP license or copyright, see http://jcp.aip.org/jcp/copyright.jsp
224705-8 Micheletti et al. J. Chem. Phys. 123, 224705 �2005�
gw�x*� =�0
2
LzLy�*Cmon
���x* − xi*��i, �12�
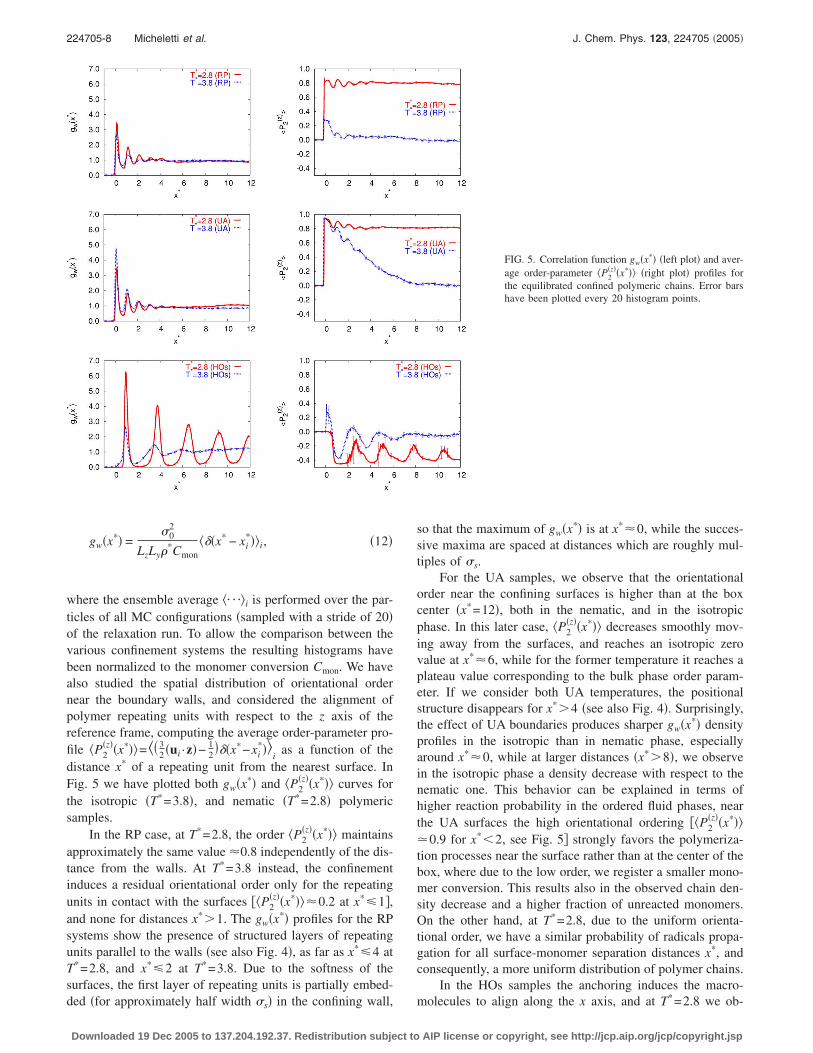
where the ensemble average �¯�i is performed over the par-ticles of all MC configurations �sampled with a stride of 20�of the relaxation run. To allow the comparison between thevarious confinement systems the resulting histograms havebeen normalized to the monomer conversion Cmon. We havealso studied the spatial distribution of orientational ordernear the boundary walls, and considered the alignment ofpolymer repeating units with respect to the z axis of thereference frame, computing the average order-parameter pro-file �P2
�z��x*��=�� 32 �ui ·z�− 1
2���x*−xi
*��i
as a function of thedistance x* of a repeating unit from the nearest surface. InFig. 5 we have plotted both gw�x*� and �P2
�z��x*�� curves forthe isotropic �T*=3.8�, and nematic �T*=2.8� polymericsamples.
In the RP case, at T*=2.8, the order �P2�z��x*�� maintains
approximately the same value �0.8 independently of the dis-tance from the walls. At T*=3.8 instead, the confinementinduces a residual orientational order only for the repeatingunits in contact with the surfaces ��P2
�z��x*���0.2 at x*�1�,and none for distances x*�1. The gw�x*� profiles for the RPsystems show the presence of structured layers of repeatingunits parallel to the walls �see also Fig. 4�, as far as x*�4 atT*=2.8, and x*�2 at T*=3.8. Due to the softness of thesurfaces, the first layer of repeating units is partially embed-
ded �for approximately half width �s� in the confining wall,Downloaded 19 Dec 2005 to 137.204.192.37. Redistribution subject to
so that the maximum of gw�x*� is at x*�0, while the succes-sive maxima are spaced at distances which are roughly mul-tiples of �s.
For the UA samples, we observe that the orientationalorder near the confining surfaces is higher than at the boxcenter �x*=12�, both in the nematic, and in the isotropicphase. In this later case, �P2
�z��x*�� decreases smoothly mov-ing away from the surfaces, and reaches an isotropic zerovalue at x*�6, while for the former temperature it reaches aplateau value corresponding to the bulk phase order param-eter. If we consider both UA temperatures, the positionalstructure disappears for x*�4 �see also Fig. 4�. Surprisingly,the effect of UA boundaries produces sharper gw�x*� densityprofiles in the isotropic than in nematic phase, especiallyaround x*�0, while at larger distances �x*�8�, we observein the isotropic phase a density decrease with respect to thenematic one. This behavior can be explained in terms ofhigher reaction probability in the ordered fluid phases, nearthe UA surfaces the high orientational ordering ��P2
�z��x*���0.9 for x*�2, see Fig. 5� strongly favors the polymeriza-tion processes near the surface rather than at the center of thebox, where due to the low order, we register a smaller mono-mer conversion. This results also in the observed chain den-sity decrease and a higher fraction of unreacted monomers.On the other hand, at T*=2.8, due to the uniform orienta-tional order, we have a similar probability of radicals propa-gation for all surface-monomer separation distances x*, andconsequently, a more uniform distribution of polymer chains.
In the HOs samples the anchoring induces the macro-*
FIG. 5. Correlation function gw�x*� �left plot� and aver-age order-parameter �P2
�z��x*�� �right plot� profiles forthe equilibrated confined polymeric chains. Error barshave been plotted every 20 histogram points.
molecules to align along the x axis, and at T =2.8 we ob-
AIP license or copyright, see http://jcp.aip.org/jcp/copyright.jsp
224705-9 Effect of nanoconfinement on liquid-crystal polymer chains J. Chem. Phys. 123, 224705 �2005�
serve five homeotropic layers of repeating units �withminima of �P2
�z��x*���−0.4, see also Fig. 4�, with smecticlikeordering induced by the presence of bonds. In contrast withthe confined monomeric sample �see Fig. 3�, where the effectis absent, and there is no propagation to the bulk of thesurface-ordering effect. On the other hand, if we consider thepolymeric sample at T*=3.8 only three layers can be de-tected, and the chains orientational and positional order inthe box center is negligible. In the boundary region at T*
=2.8 only few repeating units with x*�1 have been ob-served, and since the very close molecules cannot retain anhomeotropic alignment, these particles exhibit a positive or-der parameter ��P2
�z��x*���0.35� with large error bars. Athigher temperature T*=3.8 we do not observe this behavior,and �P2
�z��x*���0 for x*�1. The HOs anchoring also deter-mines remarkable differences in the gw�x*� profiles: at T*
=2.8, due to the linear chains that transverse the sample fromone surface to another, we-observe well-defined maximaover the entire range of x*. In the isotropic phase these fea-tures are smeared out for x*�4, since the chains wagglearound rather than adopting a linear conformation.
To conclude, the aligning effect of HOs and UA anchor-ings, allow us to control the chain structure and although wecannot prove it directly from our MC simulation, this sug-gests the possibility of lowering the melt viscosity in thenanoconfined sample with respect to the bulk case.
V. CONCLUSIONS
In this paper we have presented Monte Carlo simulationresults for a nanoconfined fluid of Gay-Berne liquid-crystalmonomers and of main-chain liquid-crystal polymers.
The confinement was enforced by restricting a LC filmbetween two infinite flat walls, while the monomer or thepolymer-surface interactions have been modeled by using a6-3 attractive-repulsive potential. This choice of a repulsivesoft term determines a small temperature variation of theaccessible sample volume but does not significantly affectthe phenomenological properties.
For the preliminar study of confined GB monomers wehave found for our boundaries conditions results similar tothose of other low-mass confined systems.15–22 We have ob-served the presence of a residual orientational order in theisotropic phase and a second-order nematic-isotropic �strictlyparanematic� transition for uniform alignment �UA� and ho-meotropic strong �HOs� anchorings. We find that LC mono-mers close to the surfaces are endowed of orientational andpositional order both in the nematic and the isotropic phase,hinting at the origin of the so-called “surface memoryeffect.”42,43
Concerning the main-chain liquid-crystal polymerssamples, we have found that starting polymerization in thedisordered phase, the various surface anchorings stronglyand characteristically affect chain structures. In the randomplanar �RP� boundary there are no evidences of residual ori-entational order, and this has been confirmed by computingthe scaled end-to-end distances lee= �ree
*2�1/2 /rmax* and gyration
radii �ree*2� / �rgyr
*2 � which do not crucially differ from those
calculated for the bulk sample.Downloaded 19 Dec 2005 to 137.204.192.37. Redistribution subject to
Differently, UA and HOs nanoconfinement induce anorientational ordering of the chains at the surfaces, and weobserve the elongated chains with an increase of lee
* ratio ofabout 40%, and the highest �ree
*2� / �rgyr*2 � ratio.
On the other hand, in presence of a nematic �-ordered�phase the simulated polymerization process is not consider-ably influenced by the confinement and this results in theformation of linear chains for all kind of planar boundaries.In the case of HOs anchoring, the growth of chains, whoselength roughly corresponds to the distance between the twoconfining walls has been observed.
The result suggest that it could be possible to tune a LCpolymer chain length by choosing reaction cells with homeo-tropic nanoconfined geometries �channels� of selected thick-ness. In view of the interest for nanoconfined polymericfilms we believe these findings will stimulate experimentalinvestigations and possibly help in the preparation of mate-rials based on tuning the film anchoring conditions.
ACKNOWLEDGMENT
We thank University of Bologna, and EU �NAIMO In-tegrated Project NMP4-CT-2004-500355�, and TMR FULCEFunctional Liquid Crystalline Elastomers �Contract No.HPRN-CT-2002-00169� for financial support. One of the au-thors �D.M.� thanks Professor D. Frenkel and SARA Com-puting Center �Amsterdam� for hospitality during a EU-HPCEuropa supported visit.
1 Liquid Crystal Applications and Uses, edited by B. Bahadur �World Sci-entific, Singapore, 1990�.
2 M. Schadt, Annu. Rev. Mater. Sci. 27, 305 �1997�, and referencestherein.
3 V. K. Gupta, J. J. Skaife, T. B. Dubrovsky, and N. L. Abbott, Science279, 2077 �1998�.
4 Y. L. Yu, M. Nakano, and T. Ikeda, Nature �London� 425, 145 �2003�.5 H. Finkelmann, E. Nishikawa, G. G. Pereira, and M. Warner, Phys. Rev.Lett. 87, 015501 �2001�.
6 I. W. Hamley, Angew. Chem., Int. Ed. 42, 1692 �2003�.7 V. K. Gupta and N. L. Abbott, Science 276, 1533 �1997�.8 M. Ruths, S. Steinberg, and J. N. Israelachvili, Langmuir 12, 6637�1996�.
9 J. N. Israelachvili, Intermolecular and Surface Forces: with Applicationsto Colloidal and Biological Systems �Academic, San Diego, 1992�.
10 Liquid Crystals in Complex Geometries, edited by G. P. Crawford and S.Žumer �Taylor and Francis, London, 1996�.
11 M. Oh-e and H. Yokoyama, Phys. Rev. E 69, 051705 �2004�.12 T. Uchida and H. Seki, in Liquid Crystal Applications and Uses, edited
by B. Bahadur �World Scientific, Singapore, 1990�, Vol. III, p. 1.13 M. Ibn-Elhaj and M. Schadt, Nature �London� 410, 796 �2001�.14 S. Granick, S. K. Kumar, E. J. Amis et al., J. Polym. Sci., Part B: Polym.
Phys. 41, 2755 �2003�.15 T. Gruhn and M. Schoen, Phys. Rev. E 55, 2861 �1997�.16 T. Gruhn and M. Schoen, J. Chem. Phys. 108, 9124 �1998�.17 Advances in the Computer Simulations of Liquid Crystals, edited by P.
Pasini and C. Zannoni �Kluwer, Dordrecht, 2000�.18 H. Steuer, S. Hess, and M. Schoen, Phys. Rev. E 69, 031708 �2004�.19 D. L. Cheung and F. Schmid, J. Chem. Phys. 122, 074902 �2005�.20 F. Barmes and D. Cleaver, Phys. Rev. E 69, 061705 �2004�.21 J. Quintana, E. C. Poire, H. Dominguez, and J. Alejandre, Mol. Phys.
100, 2597 �2002�.22 D. Caprion and J. P. Ryckaert, J. Chem. Phys. 121, 4874 �2004�.23 M. Muller, J. Chem. Phys. 22, 9930 �2002�.24 H. P. Hsu and P. Grassberger, J. Chem. Phys. 4, 2034 �2004�.25 Y. Wang, J. Chem. Phys. 8, 3898 �2004�.26 G. F. Hermsen, B. A. de Geteer, N. F. A. van der Vegt, and M. Wessling,
Macromolecules 35, 5267 �2002�.
AIP license or copyright, see http://jcp.aip.org/jcp/copyright.jsp
224705-10 Micheletti et al. J. Chem. Phys. 123, 224705 �2005�
27 O. B. Usta, A. J. C. Ladd, and J. E. Butler, J. Chem. Phys. 122, 094902�2005�.
28 Y. Son, N. S. Martys, J. G. Hagedorn, and K. B. Migler, Macromolecules36, 5825 �2003�.
29 K. V. Workum and J. J. de Pablo, Nano Lett. 3, 1405 �2003�.30 A. Milchev, W. Paul, and K. Binder, Macromol. Theory Simul. 3, 305
�1994�.31 J. J. Cerdá, T. Sintes, and A. Chakrabarti, Macromolecules 38, 1469
�2005�.32 V. Kuppa and E. Manias, J. Chem. Phys. 7, 3421 �2003�.33 A. A. Collyer, Mater. Sci. Technol. 5, 309 �1989�.34 R. Berardi, D. Micheletti, L. Muccioli, M. Ricci, and C. Zannoni, J.
Chem. Phys. 121, 9123 �2004�.35 J. G. Gay and B. J. Berne, J. Chem. Phys. 74, 3316 �1981�.36
C. Zannoni, J. Mater. Chem. 11, 2637 �2001�.Downloaded 19 Dec 2005 to 137.204.192.37. Redistribution subject to
37 R. Berardi, A. P. J. Emerson, and C. Zannoni, J. Chem. Soc., FaradayTrans. 89, 4069 �1993�.
38 R. B. Bird, R. C. Armstrong, and D. Hassager, Dynamics of PolymericLiquids �Wiley, New York, 1971�.
39 D. Frenkel and B. Smit, Understanding Molecular Simulations: FromAlgorithms to Applications �Academic, San Diego, 1996�.
40 C. Zannoni, in The Molecular Physics of Liquid Crystals, edited by G. R.Luckhurst and G. W. Gray �Academic, London, 1979�, Chap. 3, pp. 51–83.
41 U. Fabbri and C. Zannoni, Mol. Phys. 58, 763 �1986�.42 N. A. Clark, Phys. Rev. Lett. 55, 292 �1985�.43 Y. Ouchi, M. B. Feller, T. Moses, and Y. R. Shen, Phys. Rev. Lett. 68,
3040 �1992�.44 P. J. Flory, Principles of Polymer Chemistry �Cornell University Press,
Ithaca, 1953�.
AIP license or copyright, see http://jcp.aip.org/jcp/copyright.jsp
Related Documents