University of Warwick institutional repository: http://go.warwick.ac.uk/wrap This paper is made available online in accordance with publisher policies. Please scroll down to view the document itself. Please refer to the repository record for this item and our policy information available from the repository home page for further information. To see the final version of this paper please visit the publisher’s website. Access to the published version may require a subscription. Author(s): J.D. Reader, M.J. Green, J. Kaler, S.A. Mason, L.E. Green Article Title: Effect of mobility score on milk yield and activity in dairy cattle Year of publication: 2011 Link to published article: http;//dx.doi.org/10.3168/jds.2011-4415 Publisher statement: NOTICE: this is the author’s version of a work that was accepted for publication in Journal of Dairy Science. Changes resulting from the publishing process, such as peer review, editing, corrections, structural formatting, and other quality control mechanisms may not be reflected in this document. Changes may have been made to this work since it was submitted for publication. A definitive version was subsequently published in Journal of Dairy Science, Vol. 94, Issue 10, October 2011, DOI: 10.3168/jds.2011-4415

Welcome message from author
This document is posted to help you gain knowledge. Please leave a comment to let me know what you think about it! Share it to your friends and learn new things together.
Transcript
University of Warwick institutional repository: http://go.warwick.ac.uk/wrap
This paper is made available online in accordance with publisher policies. Please scroll down to view the document itself. Please refer to the repository record for this item and our policy information available from the repository home page for further information.
To see the final version of this paper please visit the publisher’s website. Access to the published version may require a subscription.
Author(s): J.D. Reader, M.J. Green, J. Kaler, S.A. Mason, L.E. Green
Article Title: Effect of mobility score on milk yield and activity in dairy cattle Year of publication: 2011 Link to published article: http;//dx.doi.org/10.3168/jds.2011-4415 Publisher statement: NOTICE: this is the author’s version of a work that was accepted for publication in Journal of Dairy Science. Changes resulting from the publishing process, such as peer review, editing, corrections, structural formatting, and other quality control mechanisms may not be reflected in this document. Changes may have been made to this work since it was submitted for publication. A definitive version was subsequently published in Journal of Dairy Science, Vol. 94, Issue 10, October 2011, DOI: 10.3168/jds.2011-4415
Interpretive summary: Impact of mobility score on milk yield and activity. Reader 1
The hypothesis tested was that delay in treatment of lame cows explains the reduction 2
in milk yield before treatment. Delay in treatment was one likely explanation for a reduction 3
in milk yield. Reduced yield occurred before cows were visibly lame; one explanation is that 4
mobility scoring in less than 100% sensitive. An alternative hypothesis is that reduced body 5
condition caused both reduced milk yield and lameness as the digital cushion became thin. 6
LAMENESS AND MILK YIELD 7
8
Impact of mobility score on milk yield and activity in dairy cattle 9
10
J. D. Reader*, M. J. Green†, J. Kaler† S. A. Mason‡ and L. E. Green‡1 11
* Synergy Farm Health, West Hill Barns, Evershot, Dorset, England. DT2 0LD 12
† The School of Veterinary Medicine and Science, University of Nottingham, Sutton 13
Bonington Campus, Sutton Bonington, Leicestershire England, LE12 5RD 14
‡ School of Life Sciences, University of Warwick, Coventry, England. CV4 7AL. 15
1 Corresponding author: [email protected] 16
17
18
2
ABSTRACT 19
Previous studies have indicated that lame cows have a reduced milk yield both before 20
and after they are treated. One explanation for the reduction in yield before treatment is that 21
there is a delay to treatment, that is, cows have impaired mobility for some time before they 22
are treated. The aim of this study was to test this hypothesis by investigating temporal 23
associations between change in milk yield and change in mobility score. Mobility score (MS, 24
on a scale 0 to 3), milk yield, treatments for lameness and cow activity were recorded on 312 25
cows in a dairy herd in Somerset, UK for 1 yr. The MS was scored every 2 wk and 26
compared with the daily yield and activity (steps/h) averaged over the previous 16 d. 27
Approximately 44 % of MS changed within 14 d, usually by 1 score. Overall, milk yields of 28
cows with MS 1 were higher than those of cows with other scores. Cows with MS 2 and 3 29
produced 0.7 (0.35 - 0.97) kg and 1.6 (0.98 – 2.23) kg less milk / d, respectively, compared 30
with cows with MS 1. In addition, cows with MS 1 were slightly but significantly more 31
active than cows with MS 0, 2 or 3. Cows with MS 2 and 3 were 0.0.02 (0.01 – 0.03) and 32
0.03 (0.01 – 0.05) mean log steps less active than cows with MS 1. 33
There was a reduction in yield from 6 - 8 wk before becoming MS 2 0.5 (0.12 – 0.47) 34
or 3 0.9 (0.16 – 1.65) to 4 wk after recovering from MS 2 0.42 (0.09 – 0.75) and non- 35
significantly, score 3. The activity of cows was significantly less but quantitatively small 36
(mean log steps 0.01) with increasing MS; the associations between activity and parity 37
(mean 0.03 – 0.11) and month of lactation (mean 0.03 – 0.36) were quantitatively larger. 38
Results from a multistate model indicated that once cows were lame they remained lame or 39
become lame again despite treatment. We conclude that cows started to reduce milk 40
production before their mobility is visibly impaired. One explanation for this is that MS is not 41
100% sensitive. An alternative hypothesis, using evidence from other studies, is that reduction 42
in milk yield and development of lameness are on a common causal pathway most likely 43
3
linked to loss in body condition and reduced digital cushion thickness as a result of the 44
demands from producing high milk yields. 45
46
Key words Dairy cow, Milk yield, Lameness, Treatment, Multistate model 47
INTRODUCTION 48
The prevalence and incidence of lameness in dairy cows in intensive systems is 49
unacceptably high with estimates of prevalence in the UK ranging from 21 % (Clarkson et al., 50
1996) to 36 % (Leach et al., 2010). Lame cows are in pain and their welfare is compromised 51
(Whay et al., 1997). 52
Lameness is associated with a reduction in milk yield (Juarez et al., 2003; Archer et 53
al., 2010). This reduced milk yield is present before and after a treatment event, but varies by 54
the type of lesion (Green et al., 2002; Amory et al., 2008; Bicalho et al., 2008). The reduction 55
in yield detected before a treatment event with non infectious horn lesions (Amory et al., 2008; 56
Green et al., 2010) might occur because of a long pathogenesis in disease before cows become 57
lame or because of delayed treatment. There is less evidence that infectious claw conditions 58
are associated with reduced milk yield before cows are observed lame, although Warnick et al. 59
(2001) reported that interdigital phlegmon was associated with reduced yield before treatment, 60
possibly because the time to lameness from infection is rapid. For both types of disorders, 61
delay in treatment would probably lead to reduced milk yield because of the increased 62
metabolic demands from pain and reduced feed intake. The treatment of lame cows depends 63
on the ability of farmers to recognize a lame cow and to treat affected cows promptly and 64
appropriately. Most dairy cow farmers underestimate the prevalence of lameness on their 65
farms (Whay et al., 2003) and do so inconsistently compared with a trained researcher 66
(Leach et al., 2010), suggesting that most dairy cow herdsmen do not have a logical way 67
of detecting lameness, in contrast to sheep farmers (King and Green, in press). 68
4
Mobility scoring has been developed to help farmers improve detection of mild 69
lameness and stimulate treatment and prevention as part of a herd health program. The 70
currently accepted system used in the UK is a 4 point mobility scoring (MS, on a scale 0 to 71
3) system (Whay et al., 2003). This system is used by many researchers and veterinary 72
practitioners, but has not been evaluated for repeatability. Some authors have reported that 73
daily activity levels are lower in cows with reduced mobility (O’Callaghan et al., 2003; 74
Mazrier et al., 2006; Walker et al., 2008). 75
The current study was designed to test the hypothesis that the reduction in milk yield 76
that occurs before lame cows are treated is as a result of delayed treatment. This was tested 77
by investigating the temporal association between change in milk yield and change in 78
locomotion and time to treatment. The MS, milk yield, and activity in cattle from 1 farm 79
was observed every 2 wk for 1 yr to estimate precise relationships between MS and changes in 80
MS, milk yield, and cow activity. 81
MATERIALS AND METHODS 82
A dairy herd that calved all year round, located in Somerset UK, with a milking herd of 83
200 Holstein cows, producing approximately 9,000 kg milk/cow per year was used for the 84
study. The study started on October 24, 2007 and finished on November 5, 2008. Calving was 85
all yr around; The numbers of cows in milk ranged from 168 (November 5, 2008) to 217 86
(April 23, 2008) with a mean of 197 and median of 200. The herd was divided into 2 groups of 87
about equal size based on milk yield, both housed in 1 building with a floor of concrete and 230 88
free stalls fitted with mattresses and bedded with sawdust. Milking cows had access to pasture 89
in summer with high yielding cows only on pasture for a limited period each day. Non-90
lactating cows were kept in a separate building and their locomotion was not scored. The 91
herd was milked twice daily through an 18/36 Westfalia herringbone parlor. Milking cows 92
walked through a 5% formalin footbath as they exited the parlor once each week. 93
5
Cows were selected for foot trimming by the herdsman. Approximately 35 cows 94
were trimmed per month; foot trimming was carried out by a paraprofessional foot trimmer 95
from Kingfisher Veterinary Practice (Synergy Farm Health, West Hill Barns, Evershot, 96
Dorset, England. DT2 0LD). The selection criteria for foot trimming were cows that were 97
clinically lame (MS 2 or 3) or cows that were due to be dried off. The farmer intended to 98
trim feet of each cow at least once each year, but this was not cross checked. Lesions were 99
defined using the definitions in the EU Lamecow Project (Barker et al., 2007) and all foot 100
trimming and lameness were recorded on lameness scoring sheets designed by the EU 101
Lamecow project. Cases of lameness treated by the herdsman or veterinarian (who treated 102
severe cases) were recorded in the same way. 103
All cows were individually identified and fitted with pedometers (Westfalia Dairy 104
Plan C21 (GEA Farm Technologies Australia Pty. Ltd. PO Box 39816 Trade Park Drive 105
Tullamarine VIC 3043). Activity readings for each cow were automatically downloaded to 106
the farm computer in the parlor twice daily and onto a lap top once weekly. The mobility of 107
lactating cows was scored (Table 1) every 2 wk after evening milking by JDR using the 108
system described by Whay et al., (2003). The identity of each cow was recorded as she 109
entered the parlor and mobility was scored and recorded on standardized sheets as the cow 110
exited the parlor. The MS was transferred to an Excel 2003 spreadsheet (Microsoft Corp., 111
Redmond, WA). Milk yield, activity (mean steps/hr), health records, lameness records, and 112
group were downloaded from the farm computer into the spreadsheet. 113
Data analysis 114
The mean proportion of cows with each MS by stage of lactation (1 to 90 d, 91 to 180 d, 115
>180 d), mean milk yield, and mean activity over 16 d previously were calculated. The 116
probability of transition between MS from time t to time t + 1, 14 d later, was estimated. 117
Two multilevel statistical models were constructed, using conventional methods (Goldstein, 118
6
1995). In the first model the outcome variable was mean milk yield in the 16 d before a MS and 119
the impact of MS before and after this outcome was investigated. In the second model log10
120
mean activity score for the previous 16 d was the outcome and the impact of MS on activity 121
was investigated. 122
The models took the form: 123
Yij = α + β1Xij + β2Xj + vj + eij vj ~ N(0,a2
v) 124
eij ~ N(0,a2 e) 125
where the subscripts i, and j denote the ith
observation of the jth
cow, respectively; α is the 126
regression intercept; Xij is the vector of covariates associated with each observation; β1 the 127
coefficients for covariates Xij; Xj the vector of covariates associated with each cow; β2 the 128
coefficients for covariates Xj,; vj a random effect to reflect residual variation between cows 129
which is normally distributed with mean = 0 and variance = σ2; and eij a random effect to 130
reflect residual variation between MS which is normally distributed with mean = 0 and 131
variance = σ2. The analysis was carried out using MLwiN 2.02 with penalized quasi-132
likelihood for parameter estimation (Rasbash et al., 2005). Covariates were left in the model 133
when the significance probability was P < 0.05 based on the Wald Test. When mean milk 134
yield was the outcome, DIM, the exponential DIM 0.05
(Wilmink, 1987) and parity 1, 2, 3, and > 135
3, and first or second lactation in the study were forced into the model. Then the discrete 136
variable MS (0, 1, 2, and 3) at time t was added. The impact of MS at time t - 1, t - 2,.., t - 5 137
and t + 1, t + 2, .., t + 5, where each time interval i was 14 d, was tested in the model. When 138
log mean activity was the outcome, parity 1, 2, 3, and > 3, second lactation in the study and 139
month in milk were forced into the model and then the mobility score at times t, t - 1, .., t - 5 140
and t + 1, .., t + 5, where each time interval t was 14 d, were tested in the model. Missing 141
observations were random and so were fitted in the model as discrete variables to minimize 142
loss of data. The model fit was checked. 143
7
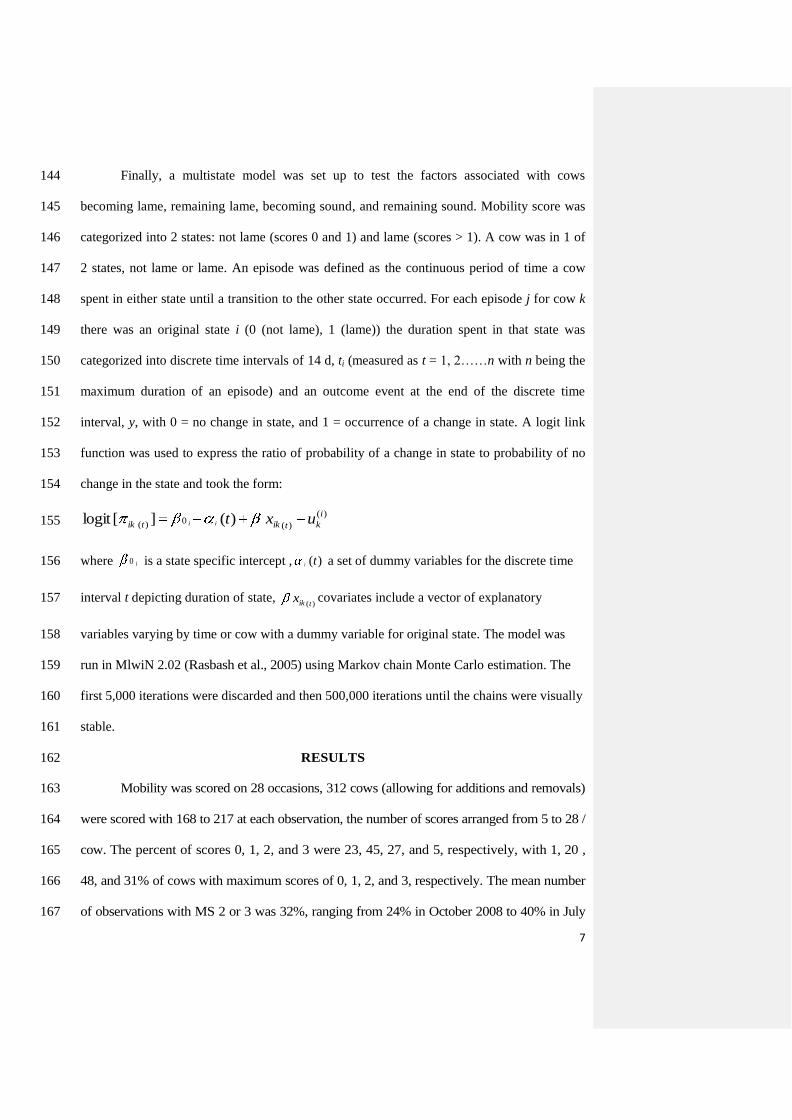
Finally, a multistate model was set up to test the factors associated with cows 144
becoming lame, remaining lame, becoming sound, and remaining sound. Mobility score was 145
categorized into 2 states: not lame (scores 0 and 1) and lame (scores > 1). A cow was in 1 of 146
2 states, not lame or lame. An episode was defined as the continuous period of time a cow 147
spent in either state until a transition to the other state occurred. For each episode j for cow k 148
there was an original state i (0 (not lame), 1 (lame)) the duration spent in that state was 149
categorized into discrete time intervals of 14 d, ti (measured as t = 1, 2……n with n being the 150
maximum duration of an episode) and an outcome event at the end of the discrete time 151
interval, y, with 0 = no change in state, and 1 = occurrence of a change in state. A logit link 152
function was used to express the ratio of probability of a change in state to probability of no 153
change in the state and took the form: 154
)(
)(0)( )(][logit i
ktiktik uxtii 155
where i0 is a state specific intercept , )(ti a set of dummy variables for the discrete time 156
interval t depicting duration of state, )(tikx covariates include a vector of explanatory 157
variables varying by time or cow with a dummy variable for original state. The model was 158
run in MlwiN 2.02 (Rasbash et al., 2005) using Markov chain Monte Carlo estimation. The 159
first 5,000 iterations were discarded and then 500,000 iterations until the chains were visually 160
stable. 161
RESULTS 162
Mobility was scored on 28 occasions, 312 cows (allowing for additions and removals) 163
were scored with 168 to 217 at each observation, the number of scores arranged from 5 to 28 / 164
cow. The percent of scores 0, 1, 2, and 3 were 23, 45, 27, and 5, respectively, with 1, 20 , 165
48, and 31% of cows with maximum scores of 0, 1, 2, and 3, respectively. The mean number 166
of observations with MS 2 or 3 was 32%, ranging from 24% in October 2008 to 40% in July 167

8
2008. The mean duration of lameness was 5.5 [s.e. 3] wk (median 4 wk, interquartile range 2 168
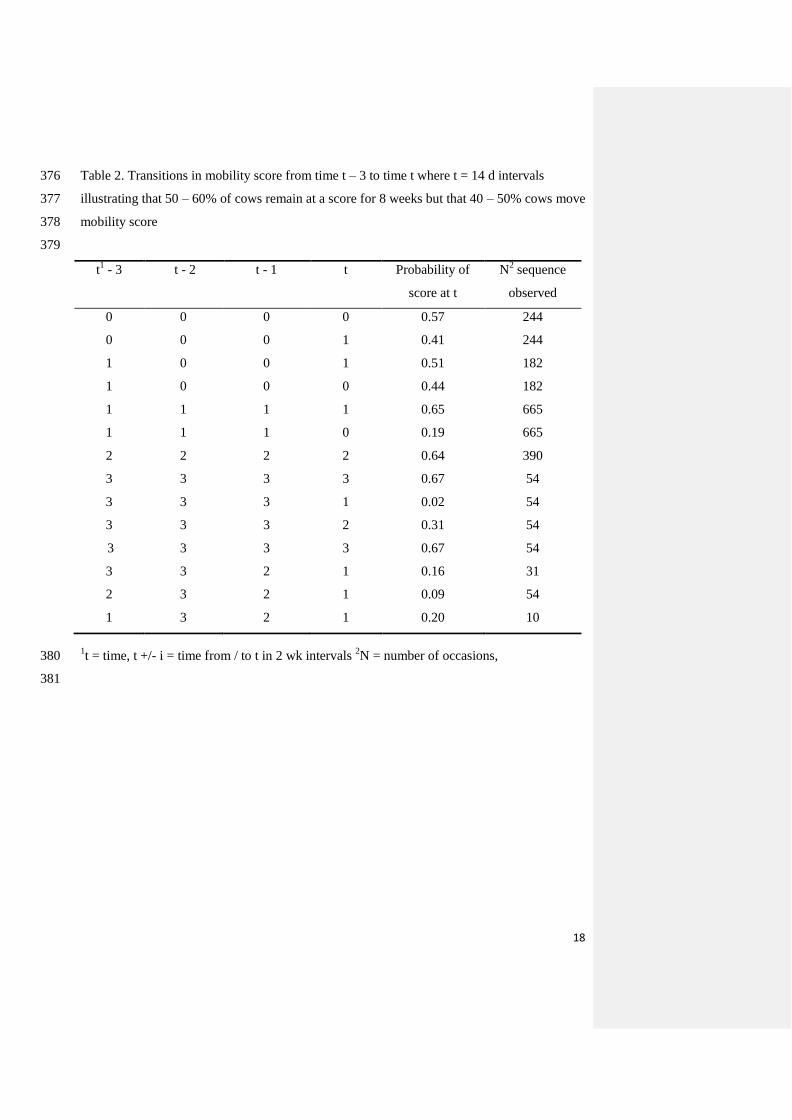
to 7 wk). Only 48% of scores remained unchanged from 1 score to the next, but cows were 169
unlikely to move more than 1 score in a 2-wk period. Once cows were a certain MS for 2 170
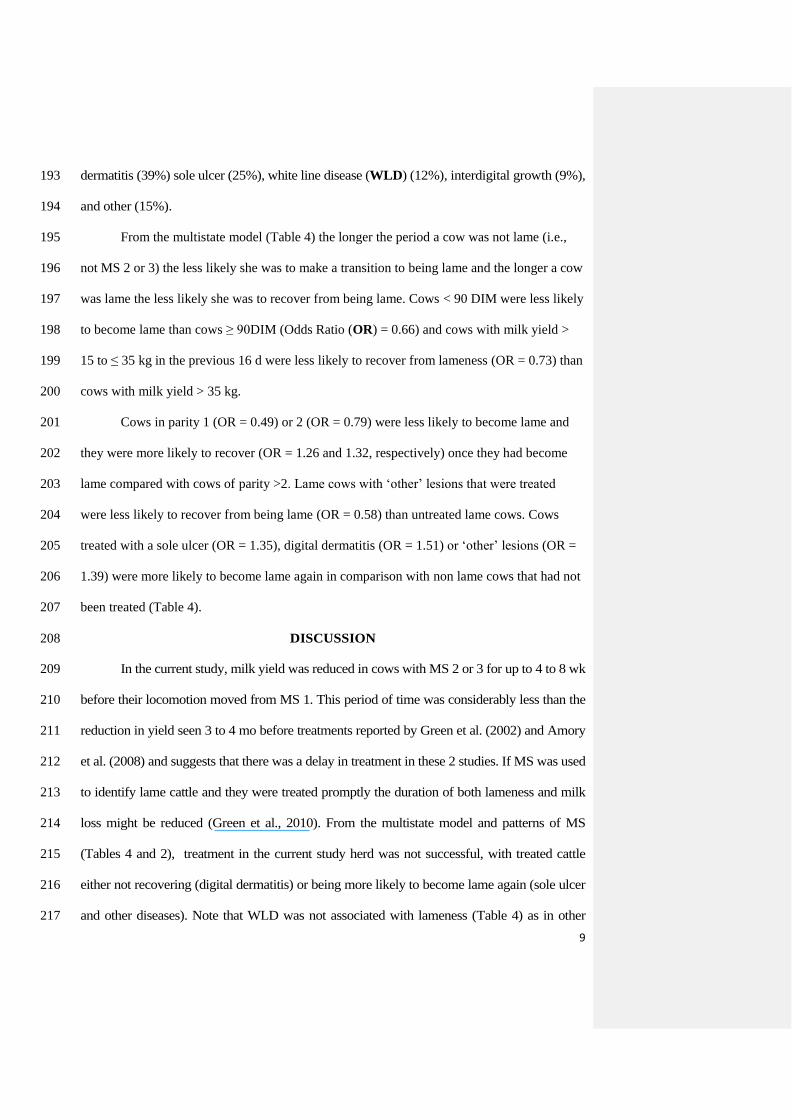
observations they were more likely to remain at that MS than change score. Patterns of scores 171
are in Table 2. 172
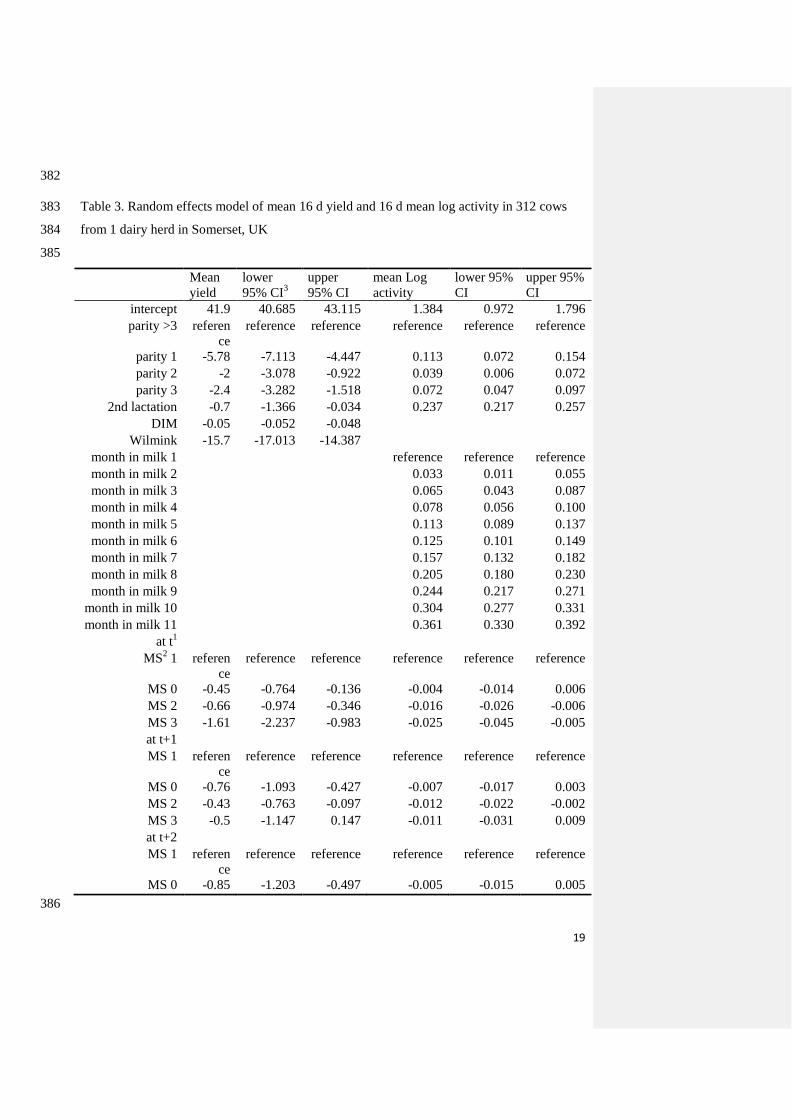
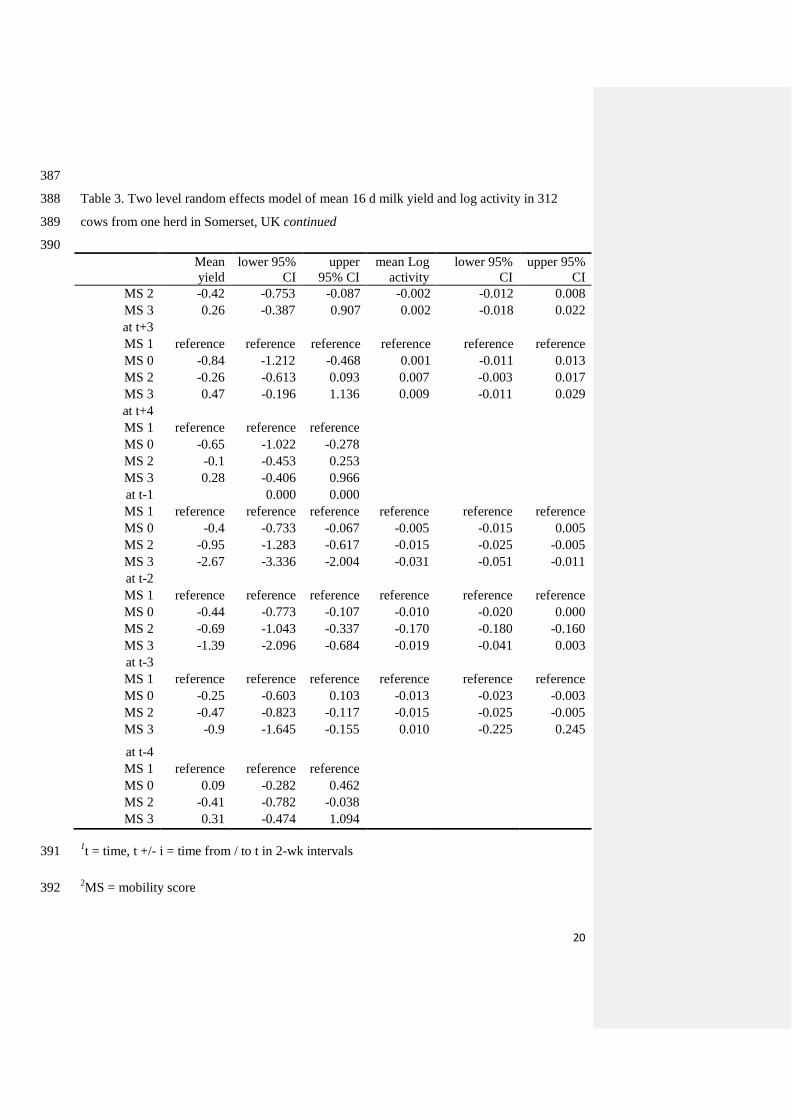
The milk yield was highest in cows with MS 1 (Table 3). Cows produced 0.7 kg/d and 173
1.6 kg/d less milk when MS 2 or 3, respectively, compared with cows with MS 1 (P < 174
0.05). There was a reduction in yield from t – 3 before becoming MS 2 (0.47 CI (0.11 – 0.82) 175
or MS 3 (0.9 (0.15 – 1.65) and t + 2 after recovering from MS 2 (0.85 CI 0.5 – 1.2). 176
First, second and third lactation cows were 58, 48, and 19%, respectively, less active 177
(took fewer steps) than cows parity >3 (P < 0.05; Table 3). Cows were less active in early 178
lactation (mean log 1.38 steps/hr in month 1) and became more active as lactation progressed 179
(mean log 1.74 steps/hr in month 10), e.g., cows that were 9 months into lactation were 42% 180
more active than those in the first month of lactation (P < 0.05). Cows with MS 0 were 1% 181
less active than a cow with MS 1 (P < 0.05). Cows with MS 2 and 3 were 3 and 5 % less 182
active than a cow with MS 1 (P < 0.05). Cows had a decreased activity for 42 d before being 183
MS 2 (mean 0.02 (CI 0.01 – 0.03)): they were 3% less active 2 wk before and 2% less active 184
4 wk before they became MS 2 compared with a cow with MS 1 (P < 0.05). Cows with MS 185
3 were less active from 28 d before they developed MS 3 (-0.02 CI (0.00 – 0.04)). Similarly, 186
cows that were MS 2 were less active by 3 to 4 % for the following 5 recordings and cows 187
that had MS 3 were less active by 3 to 6 % for the following recordings (P < 0.05). 188
A total 444 lesions (185/100 cows per yr) with 385 primary lesions on 258 feet were 189
recorded by the herdsman, veterinarian, and foot trimmer. Over the 12 mo study period 178 190
cows (74%) were treated for at least 1 lesion; 72 (30%) cows had more than 1 foot with a 191
lesion and 81 (31%) feet were treated more than once. The lesions recorded were digital 192
9
dermatitis (39%) sole ulcer (25%), white line disease (WLD) (12%), interdigital growth (9%), 193
and other (15%). 194
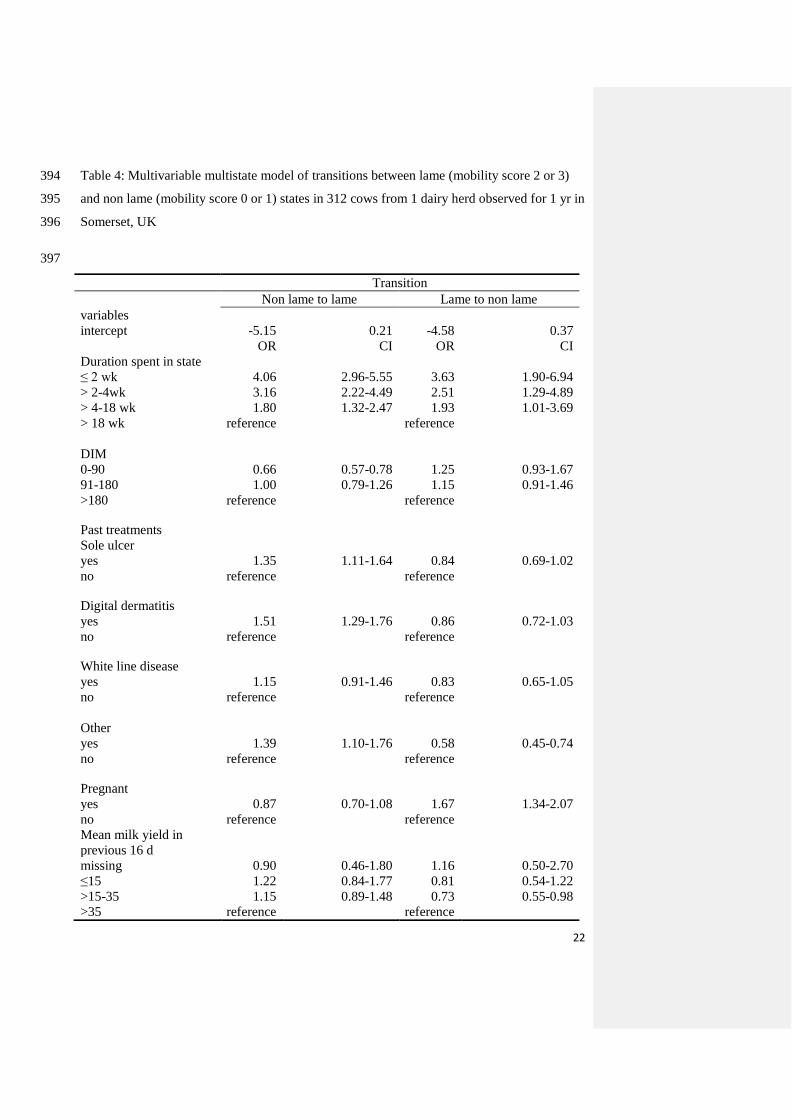
From the multistate model (Table 4) the longer the period a cow was not lame (i.e., 195
not MS 2 or 3) the less likely she was to make a transition to being lame and the longer a cow 196
was lame the less likely she was to recover from being lame. Cows < 90 DIM were less likely 197
to become lame than cows ≥ 90DIM (Odds Ratio (OR) = 0.66) and cows with milk yield > 198
15 to ≤ 35 kg in the previous 16 d were less likely to recover from lameness (OR = 0.73) than 199
cows with milk yield > 35 kg. 200
Cows in parity 1 (OR = 0.49) or 2 (OR = 0.79) were less likely to become lame and 201
they were more likely to recover (OR = 1.26 and 1.32, respectively) once they had become 202
lame compared with cows of parity >2. Lame cows with ‘other’ lesions that were treated 203
were less likely to recover from being lame (OR = 0.58) than untreated lame cows. Cows 204
treated with a sole ulcer (OR = 1.35), digital dermatitis (OR = 1.51) or ‘other’ lesions (OR = 205
1.39) were more likely to become lame again in comparison with non lame cows that had not 206
been treated (Table 4). 207
DISCUSSION 208
In the current study, milk yield was reduced in cows with MS 2 or 3 for up to 4 to 8 wk 209
before their locomotion moved from MS 1. This period of time was considerably less than the 210
reduction in yield seen 3 to 4 mo before treatments reported by Green et al. (2002) and Amory 211
et al. (2008) and suggests that there was a delay in treatment in these 2 studies. If MS was used 212
to identify lame cattle and they were treated promptly the duration of both lameness and milk 213
loss might be reduced (Green et al., 2010). From the multistate model and patterns of MS 214
(Tables 4 and 2), treatment in the current study herd was not successful, with treated cattle 215
either not recovering (digital dermatitis) or being more likely to become lame again (sole ulcer 216
and other diseases). Note that WLD was not associated with lameness (Table 4) as in other 217
10
studies (Tadich et al., 2010). Repeated occurrences of lameness might indicate meager 218
treatment strategy or efficacy, but might also indicate that treatment cannot address intrinsic 219
factors such as a thin digital cushion. Treatment was added to the milk yield model; however, 220
it did not alter the associations between yield and MS and so was excluded. 221
That cows with MS 1 had a lower milk yield for 4 to 8 wk before there was a change in 222
mobility score from MS 1 to MS 2 or 3 suggests that the reduction in yield occurred before 223
lameness was detectable. One possible explanation for the reduction in yield before MS 224
changed is that MS was not sufficiently sensitive to detect the initial stages of disease. In 225
other studies of dairy cow lameness authors have reported lesions on sound cows (Manske et 226
al., 2002; Tadich et al., 2010; Bicalho et al., 2008). One hypothesis, drawing evidence from 227
Bicalho et al. (2009), is that lameness and foot lesions are positively associated with a thin 228
digital cushion which is associated with low body condition, this might cause sub clinical 229
disease that is not detectable externally or by MS, but is sufficiently painful to reduce food 230
intake, increase metabolic rate and so reduce milk yield. Low body condition per se could 231
also lead to reduced milk yield. It is unfortunate that we did not score the body condition of 232
the cattle in the current study but one could speculate that the cattle that moved from MS 1 to 233
MS 2 or 3 lost body condition before the transition whilst those that remained at MS 1 did not. 234
The fact that high yielding cattle at greater risk of lameness (Green et al., 2002; 235
Amory et al., 2008; Green et al., 2010) might help explain why cows with MS 1 produced 236
more milk than cows with scores 0, 2 or 3. These cows are producing high yields and their 237
locomotion is impaired (they are marginally lame). Over time, a proportion remain at MS 1 238
(Tables 2 and 5) and continue to produce high yields (Table 3) but some move to MS 2 or 3 239
and the pattern of lower yield and higher mobility score ensues. Once a cow is lame, she 240
might continue to have a further reduction in yield because extra energy is required to cope 241
with the pain of the foot lesion and energy is directed to this rather than milk production. 242
11
Depending on farm layout, lame cows might also feed less frequently and so reduce feed 243
intake, exacerbating the disease process. If this was so, then successful treatment might 244
increase mobility and stabilize milk yield, as seen in Green et al. (2010). 245
A large numbers of transitions in MS were seen between fortnightly scores for 246
individual cows in our study. In the UK farmers often MS their cattle annually or biannually 247
to comply with assurance scheme standards e.g. Tesco scheme, the current results suggest that 248
infrequent MS would give a snap shot of prevalence, but have little value in management of 249
lameness. Cows that had a MS of 2 or 3 had a high probability of remaining a 2 or a 3 (Table 250
2) and becoming lame again (Tables 2 and 4). The effects of this may be seen in terms of milk 251
production, but the effects on cow welfare are not so easy to quantify, although these cows did 252
have lower activity.. This suggests that prevalence, incidence, and repeat cases should be standard 253
recordings. 254
The results demonstrate that it is not only the MS on the day of recording that is 255
important, but that the length of time that a cow has been at a particular MS is highly 256
relevant. Our examples demonstrate that a cow that had been MS 2 for 6 wk lost 4.5 kg of 257
milk per d while at MS 3 lost 6 kg/d of milk . These results support Juarez et al. (2003) who 258
demonstrated a drop in milk yield of 4 kg/d for a lame cow. Extrapolating these results to a 259
cow that is lame for 12 wk equates to 610 kg milk lost, supporting Amory et al. (2008). 260
Results from this herd suggest that activity data may not play a useful role in early 261
identification of lameness because the absolute changes were so small: parity and stage 262
of lactation had a much greater effect on activity than MS (Table 3). Cows became steadily 263
more active as lactation progressed and with increasing parity, contrary to the findings of 264
O’Callaghan et al. (2003) who reported a decreased level of activity as lactation progressed. 265
The average change in activity associated with mobility score was less than 1%/d in our study, 266
while they reported that cows that were lame were 24% less active than non lame cows. 267 Comment [FCG1]: Over what period of time?
12
There might be large variations in activity between herds, this might depend on the farm 268
layout, and this might be very important when considering the necessary and unnecessary 269
activity of cows. 270
The results suggest that a decrease in milk yield could have a role as an early indicator of 271
lameness, while change in activity is a less sensitive measure. In order to be practically 272
applied on farms, algorithms for milk yield, correcting for parity and stage of lactation, would 273
need to be incorporated into on-farm software alongside daily milk recording. In conjunction 274
with fortnightly MS this could alert the farmer that cows need early intervention. Before this 275
could be achieved, research needs to be repeated across many farms and systems to validate 276
the findings. In addition, unexpected reduction in milk yield might indicate that a cow is not 277
metabolically stable (Bicalho et al., 2009) and lameness is only one of the risks for such 278
cattle. 279
The advantage of this study was the large amount of detailed data that were collected. 280
This farm was chosen because it was similar to many farms in the UK with Holsteins 281
producing large quantities of milk under intensive conditions; the patterns within cow are 282
useful additions to our understanding of the associations between milk yield, MS, activity, and 283
lameness. A disadvantage of this study was that the data were from only 1 farm. It is not 284
possible to generalize prevalence, incidence, and transitions between MS. Whatever the 285
factors initiating lameness it appears that changing external management (Barker et al., 286
2007, 2009) is likely to be only part of the story to prevent lameness in dairy cows, possibly 287
explaining part of the limited success of intervention studies (Bell et al., 2007; Barker 2007). 288
Further work is required to elucidate when biochemical and pathological changes occur in 289
the development of lameness. If these changes can be identified, then we can move forward 290
in preventing lameness in dairy cows. 291
CONCLUSIONS 292
13
A reduction in mobility occurred 4 to 8 wk after cows had started to reduce milk 293
yield and an increase in milk yield occurred approximately 6 wk after a cow returned to 294
MS 0 or 1, suggesting that either mobility scoring is insufficiently sensitive to detect 295
lameness, that cattle mask lameness despite being diseased, or that a lameness and 296
reduction in yield are linked by a common intrinsic event. Once lame, cows were likely 297
to remain lame or become lame again, suggesting that either treatment was unsuccessful 298
or that the internal origin of lameness overrode treatment. Further work investigating 299
body condition, biochemical profiles, mobility, and lameness longitudinally could have a 300
huge impact on our understanding of the etiology of lameness. 301
ACKNOWLEDGMENTS 302
We thank the RCVS Trust for supporting this research and John Hembrow and 303
Chris Kiddle for their assistance with data collection. 304
REFERENCES 305
Amory, J. R., Barker, Z. E., Wright, J. L., Mason, S. A., Blowey, R. W., and Green, L. E. 306
2008. Associations between sole ulcer, white line disease and digital dermatitis and 307
the milk of 1824 dairy cows on 30 dairy cow farms in England and Wales. Prev. 308
Vet. Med. 83:381- 391. 309
Archer, S. C., Green, M. J., and Huxley, J. N. 2010. Association between milk yield and 310
serial locomotion score assessments in UK dairy cows. J. Dairy Sci. 93:4045-4053 311
Barker, Z. E. (2007) Epidemiology of Lameness in Dairy cows. PhD thesis. University of 312
Warwick. 313
Barker, Z. E., Amory, J. R., Wright, J. L., Mason, S. A., Blowey, R. W., and Green, L. E. 2007. 314
Management factors associated with impaired locomotion in dairy cows in England 315
and Wales. J. Dairy Sci. 90:3270–3277. 316
Barker Z. E., Amory J. R., Wright J. L., Mason S. A., Blowey R. W., and Green L. E. 2009. 317
14
Risk factors for increased rates of sole ulcers white line disease and digital dermatitis 318
in dairy cattle from twenty-seven farms in England and Wales. J. Dairy Sci. 92:1971-319
1978. 320
Bell N. J., Bell M. J., Knowles T. G., Whay H. R., Main D. C. J., and Webster A. J. F. 2009. 321
The development implementation and testing of a lameness control programme based 322
on HACCP principles and designed for heifers on dairy farms. Vet. J. 180:178-188. 323
Bicalho, R. C., Warnick, L. D., and Guard, C. L. 2008. Strategies to analyze milk losses 324
caused by diseases with potential incidence throughout the lactation: a lameness example. 325
J. Dairy Sci. 91:2653-61 326
Bicalho, R. C., Machado, V. S., and Caixeta, L. S. 2009. Lameness in dairy cattle: A 327
debilitating disease or a disease of debilitated cattle? A cross-sectional study of 328
lameness prevalence and thickness of the digital cushion J. Dairy Sci. 92:3175–3184 329
Clarkson, M. J., Downham, D. Y., Faull, W. B., Hughes, J. W., Manson, F. J., Merritt, J.B., 330
Murray, R. D., Russell, W. B., Sutherst, J. E., and Ward, W. R. 199 . Incidence and 331
prevalence of lameness in dairy cattle. Vet. Rec. 138:563-567. 332
Goldstein, H., 1995. Multilevel Statistical Models Ed. , London, Edward Arnold. 333
Green, L. E., Hedges, V. J. Schukken, Y. H., Blowey, R. W., and Packington, A. J. 2002. 334
The impact of clinical lameness on the milk yield of dairy cows. J. Dairy Sci. 335
85:2250-2256. 336
Green, L, E., Borkert, J., Monti, G., and Tadich, N. 2010. Associations between lesion-337
specific lameness and the milk yield of 1635 dairy cows from seven herds in the Xth 338
region of Chile and implications for the management of dairy cows worldwide. Anim. 339
Welfare 19:419 – 427 340
Juarez, S. T., Robinson, P. H., DePeters, E. J., and Price, E. O. 2003. Impact of lameness on 341
behavior and productivity of lactating Holstein cows. Appl. Anim. Behav. Sci. 83:1-14. 342
15
King E. M., and Green, L. E. Assessment of farmer recognition and reporting of lameness in 343
lowland sheep flocks in England. Anim. Welfare in press 344
Leach, K. L., Whay, H. R., Maggs, C. M., Barker, Z. E., Paul, E. S., Bell, A. K., and Main D. 345
C. J. 2010. Working towards a reduction in cattle lameness: 1. Understanding barriers 346
to lameness control on dairy farms. Res. Vet. Sci. 89:311-317. 347
Manske, T., Hultgren, J., and Bergsten, C. 2002. Prevalence and interrelationships of hoof 348
lesions and lameness in Swedish dairy cows. Prev. Vet. Med. 54:247-263. 349
Mazrier, H., Tal, S., Aizinbud, E., and Bargai, U. 2006. A field investigation of the use of the 350
pedometer for the early detection of lameness in cattle. Can Vet. J. 47:883-886 351
O'Callaghan, K. A., Cripps, P. J., Downham, D. Y., and Murray, R. D. 2003. Subjective and 352
objective assessment of pain and discomfort due to lameness in dairy cattle. Anim. 353
Welfare. 12:605-610. 354
Rasbash J., Browne W. J., Healy M., Cameron B., and Charlton C. 2005. MLwiN Version 2.02. 355
Tadich, N., Flor, E., and Green, L. E. 2010 Associations between hoof lesions and 356
locomotion score in 1098 unsound dairy cows Vet.J., 184:60 – 65 357
Walker, S. L., Smith, R.F., Routly, J. E., Jones, D. N., Morris, M. J., and Dobson, H. 2008. 358
Lameness activity time budgets and estrus expression in dairy cattle. J. Dairy Sci. 359
91:4552- 4559 360
Warnick, L. D., Janssen, D., Guard, C. L., and Grohn, Y. T. 2001. The effect of lameness on 361
milk production in dairy cows. J. Dairy Sci. 84:1988-1997 362
Whay, H. R., Main, D. C., Green, L. E., and Webster, A. J. 2003. Assessment of the welfare 363
of dairy cattle using animal-based measurements: Direct observations and 364
investigation of farm records. Vet. Rec. 153:197-202. 365
Whay, H. R., Waterman, A. E., and Webster, A. J. 1997. Associations between locomotion, 366
claw lesions and nociceptive threshold in dairy heifers during the peri-partum period. 367

16
Vet. J. 154:155-161. 368
Wilmink, J. B. M. 1987. Adjustment of test-day milk, fat and protein yields. Livest. Prod. Sci.. 369
16:335-348. 370
371
372

17
Table 1. Definitions of mobility scores (Whay et al., 2003) 373
Mobility score Definition Description of cow mobility
0 Good mobility / sound Walks with even weight bearing and rhythm on all 4 feet
with a flat back. Long fluid strides possible.
1 Imperfect mobility Steps unevenly or shortened strides. Affected limbs not
immediately identifiable.
2 Impaired mobility Uneven weight bearing on limb immediately identifiable
and/or obviously shortened stride. Usually arched back.
3 Severely impaired
mobility
Unable to walk as fast as brisk human pace plus signs of
score 2.
374
375
18
Table 2. Transitions in mobility score from time t – 3 to time t where t = 14 d intervals 376
illustrating that 50 – 60% of cows remain at a score for 8 weeks but that 40 – 50% cows move 377
mobility score 378
379
t1 - 3 t - 2 t - 1 t Probability of
score at t
N2 sequence
observed
0 0 0 0 0.57 244
0 0 0 1 0.41 244
1 0 0 1 0.51 182
1 0 0 0 0.44 182
1 1 1 1 0.65 665
1 1 1 0 0.19 665
2 2 2 2 0.64 390
3 3 3 3 0.67 54
3 3 3 1 0.02 54
3 3 3 2 0.31 54
3 3 3 3 0.67 54
3 3 2 1 0.16 31
2 3 2 1 0.09 54
1 3 2 1 0.20 10
1t = time, t +/- i = time from / to t in 2 wk intervals
2N = number of occasions, 380
381
19
382
Table 3. Random effects model of mean 16 d yield and 16 d mean log activity in 312 cows 383
from 1 dairy herd in Somerset, UK 384
385
Mean
yield
lower
95% CI3
upper
95% CI
mean Log
activity
lower 95%
CI
upper 95%
CI
intercept 41.9 40.685 43.115 1.384 0.972 1.796
parity >3 referen
ce
reference reference reference reference reference
parity 1 -5.78 -7.113 -4.447 0.113 0.072 0.154
parity 2 -2 -3.078 -0.922 0.039 0.006 0.072
parity 3 -2.4 -3.282 -1.518 0.072 0.047 0.097
2nd lactation -0.7 -1.366 -0.034 0.237 0.217 0.257
DIM -0.05 -0.052 -0.048
Wilmink -15.7 -17.013 -14.387
month in milk 1 reference reference reference
month in milk 2 0.033 0.011 0.055
month in milk 3 0.065 0.043 0.087
month in milk 4 0.078 0.056 0.100
month in milk 5 0.113 0.089 0.137
month in milk 6 0.125 0.101 0.149
month in milk 7 0.157 0.132 0.182
month in milk 8 0.205 0.180 0.230
month in milk 9 0.244 0.217 0.271
month in milk 10 0.304 0.277 0.331
month in milk 11 0.361 0.330 0.392
at t1
MS2 1 referen
ce
reference reference reference reference reference
MS 0 -0.45 -0.764 -0.136 -0.004 -0.014 0.006
MS 2 -0.66 -0.974 -0.346 -0.016 -0.026 -0.006
MS 3 -1.61 -2.237 -0.983 -0.025 -0.045 -0.005
at t+1
MS 1 referen
ce
reference reference reference reference reference
MS 0 -0.76 -1.093 -0.427 -0.007 -0.017 0.003
MS 2 -0.43 -0.763 -0.097 -0.012 -0.022 -0.002
MS 3 -0.5 -1.147 0.147 -0.011 -0.031 0.009
at t+2
MS 1 referen
ce
reference reference reference reference reference
MS 0 -0.85 -1.203 -0.497 -0.005 -0.015 0.005
386
20
387
Table 3. Two level random effects model of mean 16 d milk yield and log activity in 312 388
cows from one herd in Somerset, UK continued 389
390
Mean
yield
lower 95%
CI
upper
95% CI
mean Log
activity
lower 95%
CI
upper 95%
CI
MS 2 -0.42 -0.753 -0.087 -0.002 -0.012 0.008
MS 3 0.26 -0.387 0.907 0.002 -0.018 0.022
at t+3
MS 1 reference reference reference reference reference reference
MS 0 -0.84 -1.212 -0.468 0.001 -0.011 0.013
MS 2 -0.26 -0.613 0.093 0.007 -0.003 0.017
MS 3 0.47 -0.196 1.136 0.009 -0.011 0.029
at t+4
MS 1 reference reference reference
MS 0 -0.65 -1.022 -0.278
MS 2 -0.1 -0.453 0.253
MS 3 0.28 -0.406 0.966
at t-1 0.000 0.000
MS 1 reference reference reference reference reference reference
MS 0 -0.4 -0.733 -0.067 -0.005 -0.015 0.005
MS 2 -0.95 -1.283 -0.617 -0.015 -0.025 -0.005
MS 3 -2.67 -3.336 -2.004 -0.031 -0.051 -0.011
at t-2
MS 1 reference reference reference reference reference reference
MS 0 -0.44 -0.773 -0.107 -0.010 -0.020 0.000
MS 2 -0.69 -1.043 -0.337 -0.170 -0.180 -0.160
MS 3 -1.39 -2.096 -0.684 -0.019 -0.041 0.003
at t-3
MS 1 reference reference reference reference reference reference
MS 0 -0.25 -0.603 0.103 -0.013 -0.023 -0.003
MS 2 -0.47 -0.823 -0.117 -0.015 -0.025 -0.005
MS 3 -0.9 -1.645 -0.155 0.010 -0.225 0.245
at t-4
MS 1 reference reference reference
MS 0 0.09 -0.282 0.462
MS 2 -0.41 -0.782 -0.038
MS 3 0.31 -0.474 1.094
1t = time, t +/- i = time from / to t in 2-wk intervals 391
2MS = mobility score 392

21
3CI = confidence interval393
22
Table 4: Multivariable multistate model of transitions between lame (mobility score 2 or 3) 394
and non lame (mobility score 0 or 1) states in 312 cows from 1 dairy herd observed for 1 yr in 395
Somerset, UK 396
397
Transition
Non lame to lame Lame to non lame
variables
intercept -5.15 0.21 -4.58 0.37
OR CI OR CI
Duration spent in state
≤ 2 wk 4.06 2.96-5.55 3.63 1.90-6.94
> 2-4wk 3.16 2.22-4.49 2.51 1.29-4.89
> 4-18 wk 1.80 1.32-2.47 1.93 1.01-3.69
> 18 wk reference reference
DIM
0-90 0.66 0.57-0.78 1.25 0.93-1.67
91-180 1.00 0.79-1.26 1.15 0.91-1.46
>180 reference reference
Past treatments
Sole ulcer
yes 1.35 1.11-1.64 0.84 0.69-1.02
no reference reference
Digital dermatitis
yes 1.51 1.29-1.76 0.86 0.72-1.03
no reference reference
White line disease
yes 1.15 0.91-1.46 0.83 0.65-1.05
no reference reference
Other
yes 1.39 1.10-1.76 0.58 0.45-0.74
no reference reference
Pregnant
yes 0.87 0.70-1.08 1.67 1.34-2.07
no reference reference
Mean milk yield in
previous 16 d
missing 0.90 0.46-1.80 1.16 0.50-2.70
≤15 1.22 0.84-1.77 0.81 0.54-1.22
>15-35 1.15 0.89-1.48 0.73 0.55-0.98
>35 reference reference
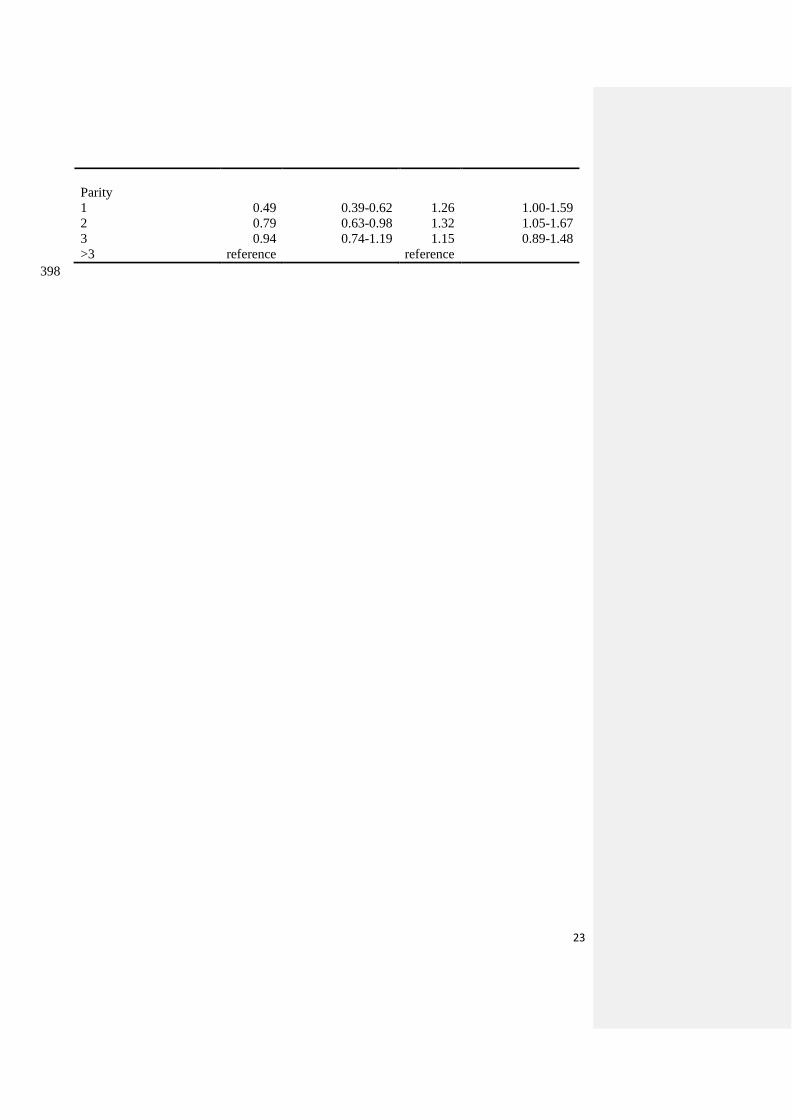
23
Parity
1 0.49 0.39-0.62 1.26 1.00-1.59
2 0.79 0.63-0.98 1.32 1.05-1.67
3 0.94 0.74-1.19 1.15 0.89-1.48
>3 reference reference
398
Related Documents