DOI 10.1515/polyeng-2013-0107 J Polym Eng 2013; aop Rizuan Mohd Rosnan and Agus Arsad* Effect of MMT concentrations as reinforcement on the properties of recycled PET/HDPE nanocomposites Abstract: The objective of this research is to investigate the effect of incorporating montmorillonite (MMT) on the mechanical, morphological, rheological, and thermal properties of recycled poly(ethylene terephthalate) (rPET) and high-density polyethylene (HDPE) nanocomposites. The MMT contents in 90:10 rPET/HDPE and 70:30 rPET/ HDPE ranged from 1 to 5 wt.%. rPET/HDPE nanocom- posites were prepared by using a single screw extruder, and injection molded to prepare mechanical test speci- mens. The samples underwent rheological tests by using a capillary rheometer, and the morphology of the nano- composites was investigated by scanning electron micro- scopy (SEM). The thermal stability of the nanocomposites was tested using thermogravimetric analysis (TGA). The results showed that MMT acts as compatibilizing agent and improves phase dispersion and interfacial adhesion in the nanocomposites. The maximum tensile strength was found at 3 and 1 wt.% of MMT for the 90:10 and 70:30 rPET/HDPE blends. However, the tensile modulus decreased significantly with the incorporation of MMT. The impact strength for both the 90:10 and 70:30 blends reached a maximum at 3 wt.% and started to decrease beyond 3 wt.%. The incorporation of MMT increased the shear viscosity of the 90:10 and 70:30 blends, which reached a maximum value at 3 and 1 wt.%. SEM micro- graphs showed a good interaction of MMT that improved the adhesion between the two phases of blends and led to an increase in the mechanical properties of rPET/HDPE nanocomposites. Keywords: nanocomposites; recycled PET; rheological; rPET/HDPE. *Corresponding author: Agus Arsad, Faculty of Chemical Engineering, Department of Polymer Engineering, Universiti Teknologi Malaysia, 81310 Skudai, Johor Bahru, Malaysia, e-mail: [email protected] Rizuan Mohd Rosnan: Faculty of Chemical Engineering, Department of Polymer Engineering, Universiti Teknologi Malaysia, 81310 Skudai, Johor Bahru, Malaysia 1 Introduction Polyethylene terephthalate (PET) is considered one of the most important technical plastics. The blends of PET with other polymers, in particular with polyolefins, may offer an attractive balance of mechanical and barrier properties and processability [1]. The amount of PET used in the plastics industry (especially for beverage bottles) has significantly increased. Hence, the problem of sufficient recycling has become more and more challenging. Recycling offers an alternative solution for handling plastic wastes. Moreover, recycling plastics can reduce manufacturing resources, conserve energy in production and shipping, and minimize the overall impact on the environment. Thus, recycled PET with high-density polyethylene (PET/HDPE) blends has attracted increasing interest. Studies on rPET/HDPE blends are mainly focused on improving the compatibility of rPET and HDPE, as they are inherently incompatible [2] owing to the great difference in solubility between them [3]. Most of the studies are based on the PET matrix with a minor portion of HDPE. It has been shown that PET/ HDPE blends are less brittle than PET, and are stiffer, faster to prepare for processing, better flowing, and faster cooling than HDPE [4, 5]. Satisfactory performance in immiscible blends is usually attained by minimizing the interfacial tension and improving the adhesion between the two phases. Therefore, the recycled blends must have reinforcement agents to achieve the desired properties. To date, various polymer/montmorillonite (MMT) blends have shown promising combinations that have brought about enhancements in PET/MMT nanocomposite development [6–8]. Nevertheless, being thermodynamically immiscible because of the coarse morphology, which corresponds to very poor mechanical properties, is one of the drawbacks of rPET and HDPE blends [9, 10]. Therefore, to overcome this situation, compatibilizers were introduced, such as polyethylene grafted with maleic anhydride (PE-g-MAH) [11]. In this study, an attempt was made to develop rPET/ HDPE nanocomposites compatibilized by HDPE-g-MAH. The effects of various MMT contents on the mechanical, Brought to you by | Universiti Teknologi Malaysia Authenticated | [email protected] author's copy Download Date | 8/26/13 10:19 PM

Welcome message from author
This document is posted to help you gain knowledge. Please leave a comment to let me know what you think about it! Share it to your friends and learn new things together.
Transcript
DOI 10.1515/polyeng-2013-0107 J Polym Eng 2013; aop
Rizuan Mohd Rosnan and Agus Arsad *
Effect of MMT concentrations as reinforcement on the properties of recycled PET/HDPE nanocomposites Abstract: The objective of this research is to investigate
the effect of incorporating montmorillonite (MMT) on the
mechanical, morphological, rheological, and thermal
properties of recycled poly(ethylene terephthalate) (rPET)
and high-density polyethylene (HDPE) nanocomposites.
The MMT contents in 90:10 rPET/HDPE and 70:30 rPET/
HDPE ranged from 1 to 5 wt.%. rPET/HDPE nanocom-
posites were prepared by using a single screw extruder,
and injection molded to prepare mechanical test speci-
mens. The samples underwent rheological tests by using
a capillary rheometer, and the morphology of the nano-
composites was investigated by scanning electron micro-
scopy (SEM). The thermal stability of the nanocomposites
was tested using thermogravimetric analysis (TGA). The
results showed that MMT acts as compatibilizing agent
and improves phase dispersion and interfacial adhesion
in the nanocomposites. The maximum tensile strength
was found at 3 and 1 wt.% of MMT for the 90:10 and
70:30 rPET/HDPE blends. However, the tensile modulus
decreased significantly with the incorporation of MMT.
The impact strength for both the 90:10 and 70:30 blends
reached a maximum at 3 wt.% and started to decrease
beyond 3 wt.%. The incorporation of MMT increased
the shear viscosity of the 90:10 and 70:30 blends, which
reached a maximum value at 3 and 1 wt.%. SEM micro-
graphs showed a good interaction of MMT that improved
the adhesion between the two phases of blends and led
to an increase in the mechanical properties of rPET/HDPE
nanocomposites.
Keywords: nanocomposites; recycled PET; rheological;
rPET/HDPE.
*Corresponding author: Agus Arsad, Faculty of Chemical
Engineering, Department of Polymer Engineering, Universiti
Teknologi Malaysia, 81310 Skudai, Johor Bahru, Malaysia,
e-mail: [email protected]
Rizuan Mohd Rosnan: Faculty of Chemical Engineering, Department
of Polymer Engineering, Universiti Teknologi Malaysia, 81310
Skudai, Johor Bahru, Malaysia
1 Introduction Polyethylene terephthalate (PET) is considered one of the
most important technical plastics. The blends of PET with
other polymers, in particular with polyolefins, may offer an
attractive balance of mechanical and barrier properties and
processability [1] . The amount of PET used in the plastics
industry (especially for beverage bottles) has significantly
increased. Hence, the problem of sufficient recycling has
become more and more challenging. Recycling offers an
alternative solution for handling plastic wastes. Moreover,
recycling plastics can reduce manufacturing resources,
conserve energy in production and shipping, and minimize
the overall impact on the environment. Thus, recycled PET
with high-density polyethylene (PET/HDPE) blends has
attracted increasing interest. Studies on rPET/HDPE blends
are mainly focused on improving the compatibility of rPET
and HDPE, as they are inherently incompatible [2] owing to
the great difference in solubility between them [3] .
Most of the studies are based on the PET matrix with
a minor portion of HDPE. It has been shown that PET/
HDPE blends are less brittle than PET, and are stiffer,
faster to prepare for processing, better flowing, and faster
cooling than HDPE [4, 5] . Satisfactory performance in
immiscible blends is usually attained by minimizing the
interfacial tension and improving the adhesion between
the two phases. Therefore, the recycled blends must have
reinforcement agents to achieve the desired properties. To
date, various polymer/montmorillonite (MMT) blends have
shown promising combinations that have brought about
enhancements in PET/MMT nanocomposite development
[6 – 8] .
Nevertheless, being thermodynamically immiscible
because of the coarse morphology, which corresponds to
very poor mechanical properties, is one of the drawbacks
of rPET and HDPE blends [9, 10] . Therefore, to overcome
this situation, compatibilizers were introduced, such as
polyethylene grafted with maleic anhydride (PE-g-MAH)
[11] . In this study, an attempt was made to develop rPET/
HDPE nanocomposites compatibilized by HDPE-g-MAH.
The effects of various MMT contents on the mechanical,
Brought to you by | Universiti Teknologi MalaysiaAuthenticated | [email protected] author's copy
Download Date | 8/26/13 10:19 PM
2 R. Mohd Rosnan and A. Arsad: Effect of MMT on rPET/HDPE nanocomposites
morphological, thermal, and rheological properties of
rPET/PE nanocomposites were investigated.
2 Experiments
2.1 Materials
There are four main components used in this research:
rPET, HDPE, PE-g-MAH, and MMT. rPET was collected
from excess material, rejected products, and leftovers
from the plastics industries [Texchem-Pack (Johor) Sdn
Bhd, Johor, Malaysia]. This material was bought directly
from the factory. The general-purpose HDPE resin Titanex
was manufactured by Titan Chemicals (Malaysia) Sdn
Bhd. MMT was obtained from Nanocor Inc., Arlington
Heights, IL, USA (Nanomer 1.28 E), organically modified
with quaternary amine with a mean dry particle size of
16 – 22 μ m. PE-g-MAH resin was bought from Sigma Aldrich
with a melt flow rate of 115 g/10 min (190 ° C/2.16 kg) and
0.6% maleic anhydrite.
2.2 Sample preparation
PET pellets were dried at 90 ° C for 24 h before com-
pounding. All constituents were compounded by a
single screw extruder (local custom made – Johor,
Malaysia) with an length/diameter (L/D) of 30. The
barrel temperature profile adopted during compound-
ing for formulations was from 200 ° C to 250 ° C at the die
head with a screw rotation speed of 30 rpm (0.02 g ). The
extruded materials were injection molded into standard
tensile, flexural, and Izod impact specimens by using a
JSW (Muroran, Japan) Model NIOOB II injection-molded
machine with a barrel temperature ranging from 220 ° C
to 260 ° C. All test specimens were kept under ambient
conditions in desiccators for at least 24 h before testing.
2.3 Characterization
2.3.1 Mechanical analysis
Tensile test was carried out according to ASTM D638 using
an Instron 5567 (Bucks, UK) machine under ambient
conditions with a crosshead speed of 50 mm/min. Izod
impact tests were carried out on notched impact speci-
mens according to ASTM 256, using a Toyoseiki (Tokyo,
Japan) impact testing machine under ambient conditions.
Five specimens of each formulation were tested and the
average values were calculated.
2.3.2 Rheological analysis
In this study, the extrusion flow tests were conducted
by using a capillary rheometer (Rheograph 2003; Gott-
fert, Germany) at Malaysian Rubber Board (LGM), Sungai
Buloh, Selangor at 230 ° C, and the apparent shear rate was
varied from 10 to 1700 s -1 to measure the melt flow curves
(relationship between shear stress and shear rate). All
data were Bagley corrected.
2.3.3 Morphological analysis
A scanning electron microscope (SEM) type JEOL JSM-6390
LV with an intensity of 9 × 10 -9 A, 25 kV, was employed to iden-
tify the distribution and phase separation of the nanocom-
posite. The sample was obtained from impact test samples
and cut to 1-mm thickness. These samples were then coated
with a thin layer of gold before conducting the test.
2.3.4 Thermal analysis
The nanocomposites then underwent thermal analysis
by using a thermogravimetric analyzer (TGA) to study the
degradation and stability of the organoclay and compat-
ibility between rPET and HDPE phases. The tests were
carried out using a Perkin Elmer Pyrist 6 TGA analyzer at
the Polymer Laboratory, Faculty of Chemical Engineering,
UTM Johor Bahru, Johor. The samples were scanned from
30 to 850 ° C at a heating rate of 20 ° C/min.
3 Results and discussion
3.1 Mechanical analysis
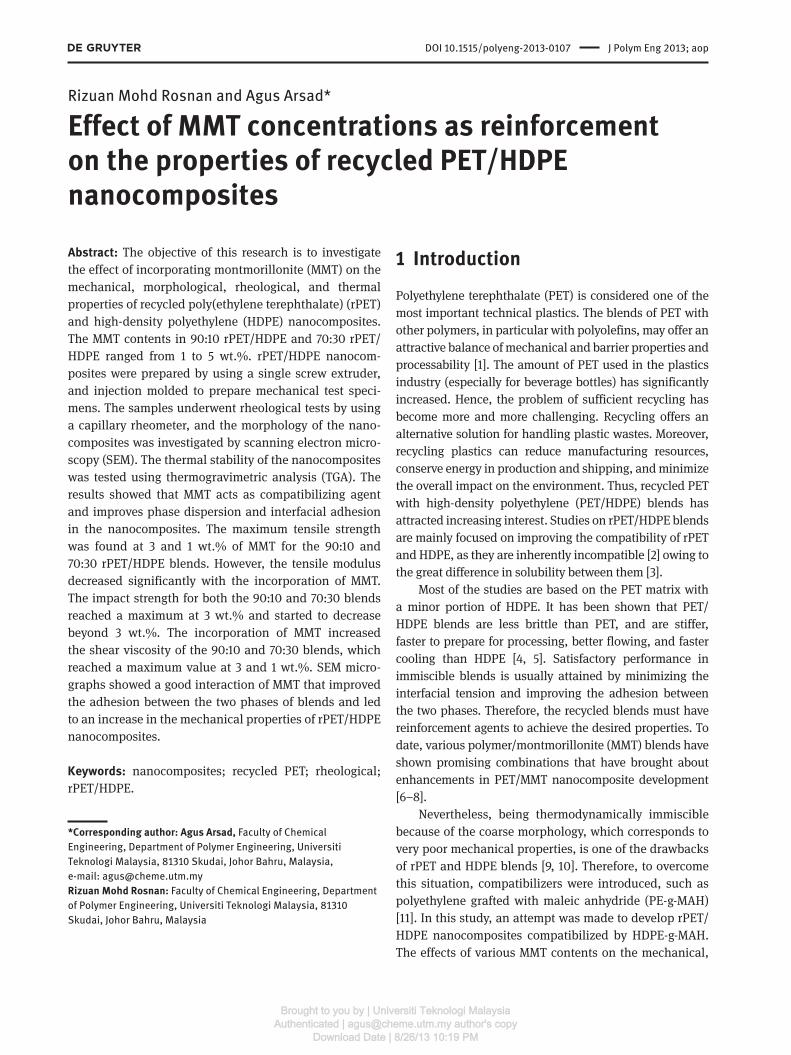
Figure 1 shows the reduction in tensile strength of the
blends by the introduction of HDPE content. In 70:30
rPET/HDPE nanocomposites, the tensile strength was
reduced as compared with 100% rPET, followed by the
90:10 ratio. The decrease of tensile strength is dependent
on lower PET and higher HDPE contents [12] , in which the
tensile strength of the blend increased proportionally with
PET concentration. Therefore, by increasing the HDPE
content in rPET, the tensile properties were decreased.
Brought to you by | Universiti Teknologi MalaysiaAuthenticated | [email protected] author's copy
Download Date | 8/26/13 10:19 PM
R. Mohd Rosnan and A. Arsad: Effect of MMT on rPET/HDPE nanocomposites 3
However, by incorporating MMT into the system,
it has shown a small improvement in tensile strength.
The tensile strength for the composition of 90:10 rPET/
HDPE showed an increment from 1 to 3 phr of MMT
with a maximum at 24.9 MPa. It was the highest peak of
tensile strength in the composition before the properties
were decreased when 5 phr of MMT loading was reached.
However, the tensile strength of 70:30 rPET/HDPE nano-
composites was maximum at 34.8 MPa with 1 phr of MMT.
It was the best tensile strength among these compositions.
The tensile strength was maintained at 32.1 MPa with
3 phr of MMT before being drastically reduced to 22.1 MPa
at 5 phr MMT loading, contributing to 30% reduction of
the properties.
This result has shown that addition of small
amounts of organoclay in the system can help increase
the mechanical properties of rPET. The tensile strength
decreased when the MMT loading was at 5 phr for the
70:30 ratio of rPET/HDPE nanocomposites. Thus, a higher
content of MMT did not give rise to further improvement.
This might be assumed to be because the agglomeration
of MMT layers occurred at higher MMT loading of > 3 phr
and caused a reduction of tensile and flexural strength,
elongation at break, and impact strength properties.
This result is in agreement with the study by Wang et al.
[13] . A similar effect was also shown by the 90:10 rPET/
HDPE nanocomposites. However, the introduction of 1
phr of MMT contributed to the drastic increase in tensile
strength, and no further increment was found beyond the
MMT addition of 1 phr. In conclusion, the result showed
that the optimal nanoclay concentration for the tensile
strength of either 70:30 or 90:10 rPET/HDPE nanocom-
posites was 3 phr.
Figure 1 Effect of MMT concentrations on tensile strength at
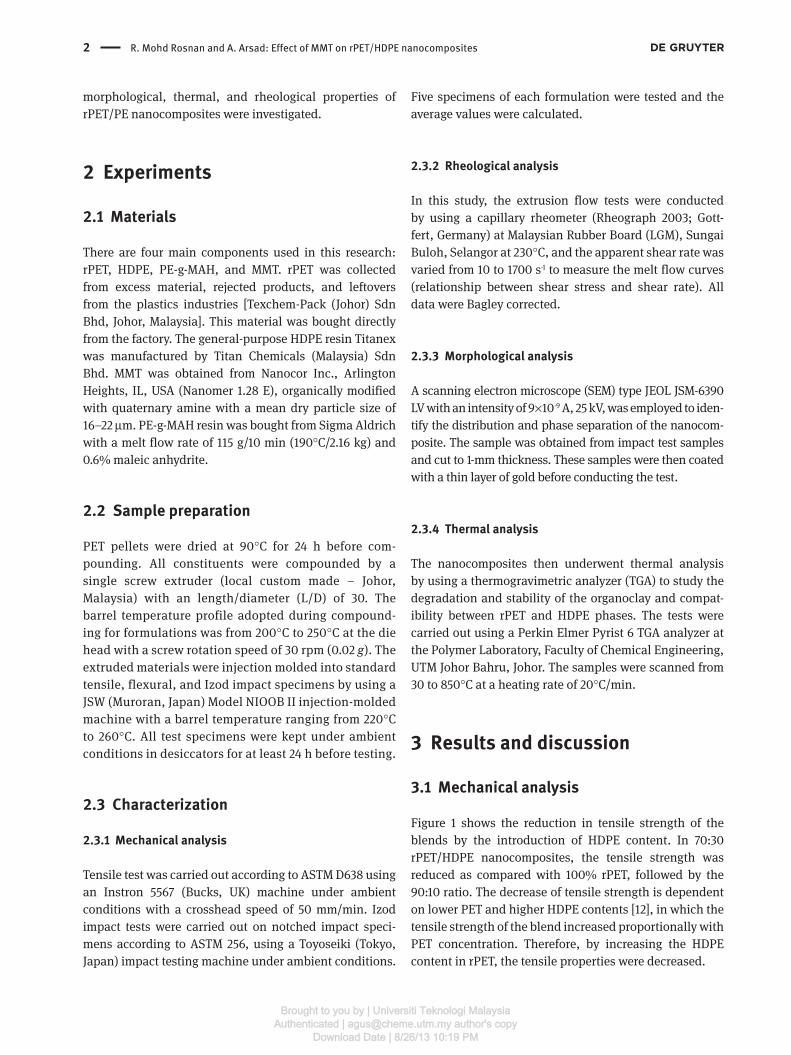
different ratios of rPET/HDPE. Figure 2 Effect of MMT concentrations on tensile modulus at
different ratios of rPET/HDPE.
Figure 2 shows the performances of the tensile
modulus of rPET/HDPE nanocomposites of different MMT
contents. From the figure, it can be seen that the tensile
modulus was decreased by increasing the HDPE content
of nanocomposites. It can be seen that the tensile modulus
for both formulation has resulted in a proportional reduc-
tion in properties when HDPE was added. The tensile
modulus for 100% rPET decreased from 2.40 to 2.18 GPa at
10% HDPE. The tensile modulus was further decreased to
1.83 GPa by the addition of 30% HDPE. This is an indica-
tion of increasing HDPE content in the rPET matrix, which
implies that the system obeys the rules of mixture [14] .
From the figure, it can be seen that the tensile modulus
decreased by the addition of MMT into the system. The
composition of 90:10 rPET/HDPE has shown a decrease in
stiffness at 1 phr of MMT addition. The stiffness was further
decreased by the addition of 5 phr MMT. This reduction
indicates that MMT had no significant effect in increas-
ing the tensile modulus due to composition dependence.
A similar trend has also been found for the 70:30 rPET/
HDPE ratio when the increment of MMT content up to
5 phr caused a reduction in the tensile modulus.
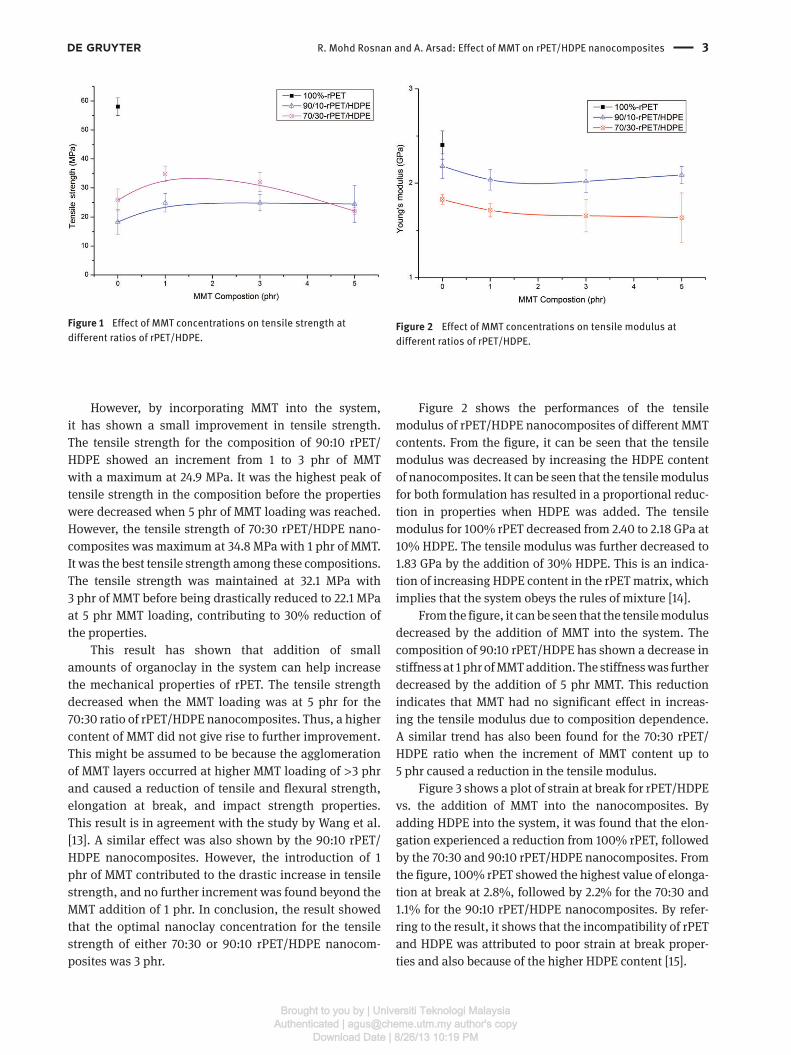
Figure 3 shows a plot of strain at break for rPET/HDPE
vs. the addition of MMT into the nanocomposites. By
adding HDPE into the system, it was found that the elon-
gation experienced a reduction from 100% rPET, followed
by the 70:30 and 90:10 rPET/HDPE nanocomposites. From
the figure, 100% rPET showed the highest value of elonga-
tion at break at 2.8%, followed by 2.2% for the 70:30 and
1.1% for the 90:10 rPET/HDPE nanocomposites. By refer-
ring to the result, it shows that the incompatibility of rPET
and HDPE was attributed to poor strain at break proper-
ties and also because of the higher HDPE content [15] .
Brought to you by | Universiti Teknologi MalaysiaAuthenticated | [email protected] author's copy
Download Date | 8/26/13 10:19 PM
4 R. Mohd Rosnan and A. Arsad: Effect of MMT on rPET/HDPE nanocomposites
The properties experienced an improvement for
the 90:10 rPET/HDPE nanocomposites when the MMT
was incorporated into the system. The properties were
slightly increased when MMT was loaded up to 3 phr.
It showed that the agreement of the statement of strain
at break has followed the trend of tensile strength
( Figure 1 ). The strain at break for 70:30 rPET/HDPE nano-
composites decreased with further addition of 3 phr of
MMT. This result contradicted with the finding reported
by Dimitrova et al. [16] , and they stated that the improve-
ment of strain at break might be due to a good dispersion
of MMT in the system that was able to promote a better
adhesion of the two phases and help enhance the prop-
erties. Unfortunately, the given reason was not applica-
ble for this study.
However, the properties of 70:30 rPET/HDPE nano-
composites achieved the ultimate improvement when the
highest percentage of elongation at break was observed.
Hence, it has shown the best performance compared with
100% rPET and has been the ideal composition among
others. The improvement would be due to the presence of
MMT in the composition that has contributed to the incre-
ment of the property by achieving a maximum percentage
at 3.6% of elongation at break up to 3 phr of MMT before
decreasing to 2.5% at 5 phr of MMT.
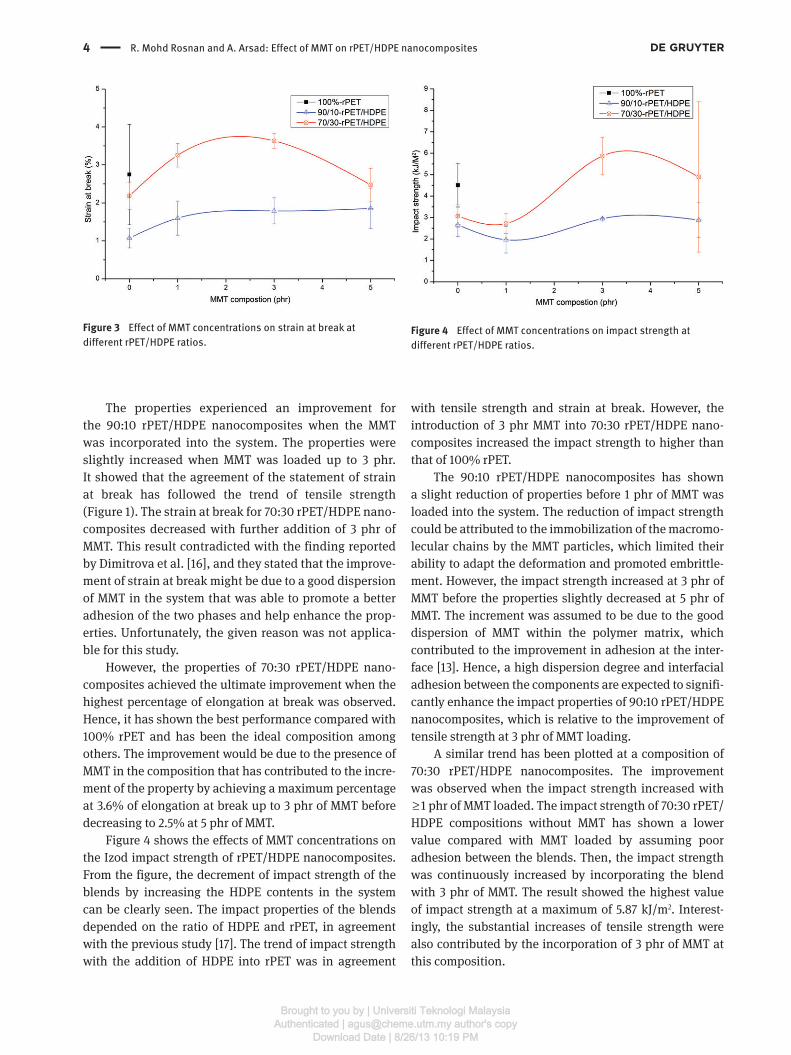
Figure 4 shows the effects of MMT concentrations on
the Izod impact strength of rPET/HDPE nanocomposites.
From the figure, the decrement of impact strength of the
blends by increasing the HDPE contents in the system
can be clearly seen. The impact properties of the blends
depended on the ratio of HDPE and rPET, in agreement
with the previous study [17] . The trend of impact strength
with the addition of HDPE into rPET was in agreement
with tensile strength and strain at break. However, the
introduction of 3 phr MMT into 70:30 rPET/HDPE nano-
composites increased the impact strength to higher than
that of 100% rPET.
The 90:10 rPET/HDPE nanocomposites has shown
a slight reduction of properties before 1 phr of MMT was
loaded into the system. The reduction of impact strength
could be attributed to the immobilization of the macromo-
lecular chains by the MMT particles, which limited their
ability to adapt the deformation and promoted embrittle-
ment. However, the impact strength increased at 3 phr of
MMT before the properties slightly decreased at 5 phr of
MMT. The increment was assumed to be due to the good
dispersion of MMT within the polymer matrix, which
contributed to the improvement in adhesion at the inter-
face [13] . Hence, a high dispersion degree and interfacial
adhesion between the components are expected to signifi-
cantly enhance the impact properties of 90:10 rPET/HDPE
nanocomposites, which is relative to the improvement of
tensile strength at 3 phr of MMT loading.
A similar trend has been plotted at a composition of
70:30 rPET/HDPE nanocomposites. The improvement
was observed when the impact strength increased with
≥ 1 phr of MMT loaded. The impact strength of 70:30 rPET/
HDPE compositions without MMT has shown a lower
value compared with MMT loaded by assuming poor
adhesion between the blends. Then, the impact strength
was continuously increased by incorporating the blend
with 3 phr of MMT. The result showed the highest value
of impact strength at a maximum of 5.87 kJ/m 2 . Interest-
ingly, the substantial increases of tensile strength were
also contributed by the incorporation of 3 phr of MMT at
this composition.
Figure 4 Effect of MMT concentrations on impact strength at
different rPET/HDPE ratios.
Figure 3 Effect of MMT concentrations on strain at break at
different rPET/HDPE ratios.
Brought to you by | Universiti Teknologi MalaysiaAuthenticated | [email protected] author's copy
Download Date | 8/26/13 10:19 PM
R. Mohd Rosnan and A. Arsad: Effect of MMT on rPET/HDPE nanocomposites 5
From the finding, it may be assumed to be due to the
good dispersion of MMT, which improved the adhesion
between the two phases of the components and led to an
increase in the mechanical properties. However, the prop-
erty was slightly decreased to 5.08 kJ/m 2 when 5 phr of
MMT was loaded into the 70:30 rPET/HDPE composition.
Agglomeration of organoclay at high loading may induce
local stress concentration in the composites [18] . In addi-
tion, in agreement with a previous study [13] , the MMT
dispersion is not ideal in higher loading and incomplete
intercalation will reduce the properties.
3.2 Rheological analysis
Shear viscosity, η , is the viscosity coefficient when the
applied stress is shear stress. Shear viscosity is the ratio of
the shear stress to the shear rate. In the current work, the
shear viscosity of samples were analyzed and discussed
to understand the effect of nanoclay composition on the
polymer blends. The effect of 0, 1, 3, and 5 phr of MMT
to those of rPET/HDPE compositions at 230 ° C at various
shear rates are shown in Figures 5 and 6 , respectively.
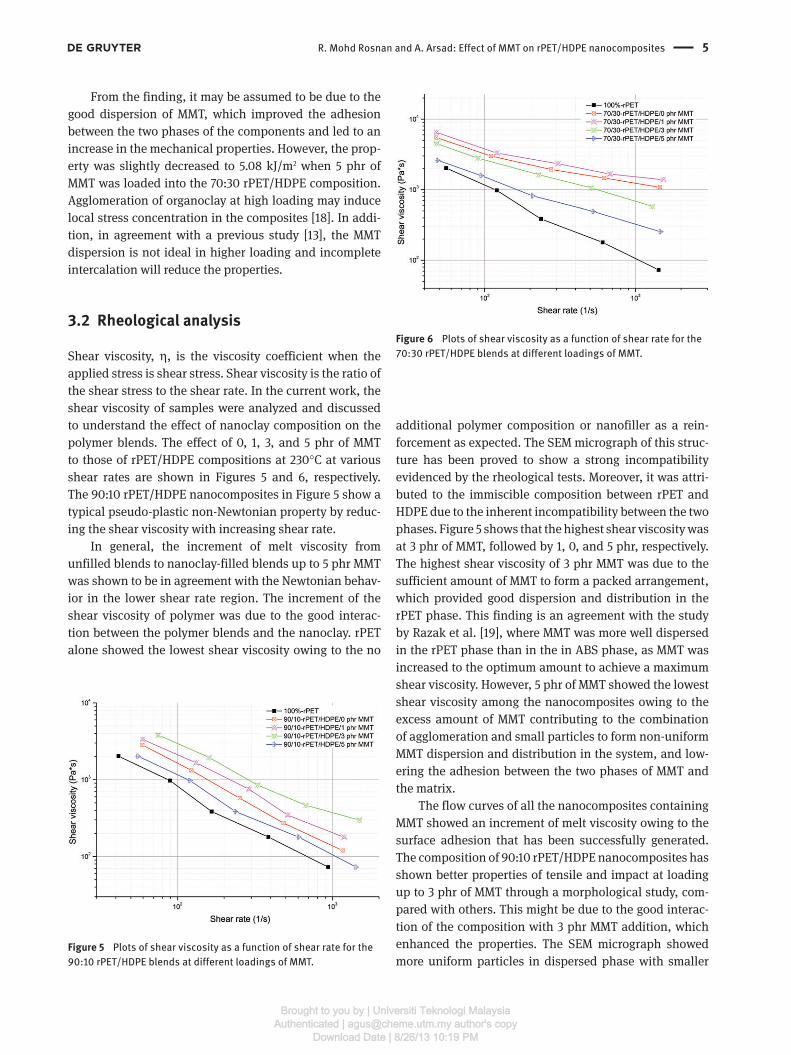
The 90:10 rPET/HDPE nanocomposites in Figure 5 show a
typical pseudo-plastic non-Newtonian property by reduc-
ing the shear viscosity with increasing shear rate.
In general, the increment of melt viscosity from
unfilled blends to nanoclay-filled blends up to 5 phr MMT
was shown to be in agreement with the Newtonian behav-
ior in the lower shear rate region. The increment of the
shear viscosity of polymer was due to the good interac-
tion between the polymer blends and the nanoclay. rPET
alone showed the lowest shear viscosity owing to the no
Figure 5 Plots of shear viscosity as a function of shear rate for the
90:10 rPET/HDPE blends at different loadings of MMT.
Figure 6 Plots of shear viscosity as a function of shear rate for the
70:30 rPET/HDPE blends at different loadings of MMT.
additional polymer composition or nanofiller as a rein-
forcement as expected. The SEM micrograph of this struc-
ture has been proved to show a strong incompatibility
evidenced by the rheological tests. Moreover, it was attri-
buted to the immiscible composition between rPET and
HDPE due to the inherent incompatibility between the two
phases. Figure 5 shows that the highest shear viscosity was
at 3 phr of MMT, followed by 1, 0, and 5 phr, respectively.
The highest shear viscosity of 3 phr MMT was due to the
sufficient amount of MMT to form a packed arrangement,
which provided good dispersion and distribution in the
rPET phase. This finding is an agreement with the study
by Razak et al. [19] , where MMT was more well dispersed
in the rPET phase than in the in ABS phase, as MMT was
increased to the optimum amount to achieve a maximum
shear viscosity. However, 5 phr of MMT showed the lowest
shear viscosity among the nanocomposites owing to the
excess amount of MMT contributing to the combination
of agglomeration and small particles to form non-uniform
MMT dispersion and distribution in the system, and low-
ering the adhesion between the two phases of MMT and
the matrix.
The flow curves of all the nanocomposites containing
MMT showed an increment of melt viscosity owing to the
surface adhesion that has been successfully generated.
The composition of 90:10 rPET/HDPE nanocomposites has
shown better properties of tensile and impact at loading
up to 3 phr of MMT through a morphological study, com-
pared with others. This might be due to the good interac-
tion of the composition with 3 phr MMT addition, which
enhanced the properties. The SEM micrograph showed
more uniform particles in dispersed phase with smaller
Brought to you by | Universiti Teknologi MalaysiaAuthenticated | [email protected] author's copy
Download Date | 8/26/13 10:19 PM
6 R. Mohd Rosnan and A. Arsad: Effect of MMT on rPET/HDPE nanocomposites
dimensions, resulting in better adhesion as compared
with the blend without MMT.
Figure 6 shows the rheological flow curves for the
70:30 rPET/HDPE nanocomposites. A similar trend has
been shown in 90:10 rPET/HDPE compositions when the
curves of unfilled blends were lower than those of the filled
blends. The composition of 70:30 rPET/HDPE nanocom-
posites has shown better properties of tensile and impact
at a loading of 1 phr of MMT. However, the nanocompos-
ites showed a different result with the incorporated blend
of 5 phr of MMT. The blend with 5 phr MMT showed the
lowest viscosity curve among the nanocomposites, and it
might be assumed that the higher content of HDPE and
MMT can be attributed to the inhomogeneous disper-
sion in the molten phase and reflected to the decrease of
mechanical properties. In this case, it was suggested that
the interfacial adhesion of the blends filled with 5 phr
MMT was poor owing to the high viscosity of HDPE that
potentially agglomerated, and attributed to the poor dis-
persion of MMT with the polymer matrix phase. The ten-
dency of MMT agglomeration influenced the organoclay
function to play its role in improving the properties.
From the research done, it was found that the 90:10
rPET/HDPE nanocomposites have a good reaction with the
incorporation of 3 phr of MMT, whereas 70:30 rPET/HDPE
was only effective with 1 phr of MMT loading. Therefore, the
conclusion that might be suggested is that by increasing
HDPE content, the effectiveness of MMT will be decreased.
This might be due to the hyperphobic behavior of HDPE
that affected the interaction of MMT with the system. Thus,
the percentages of effectiveness of MMT were decreased by
increasing the HDPE content of the system.
3.3 Morphological analysis
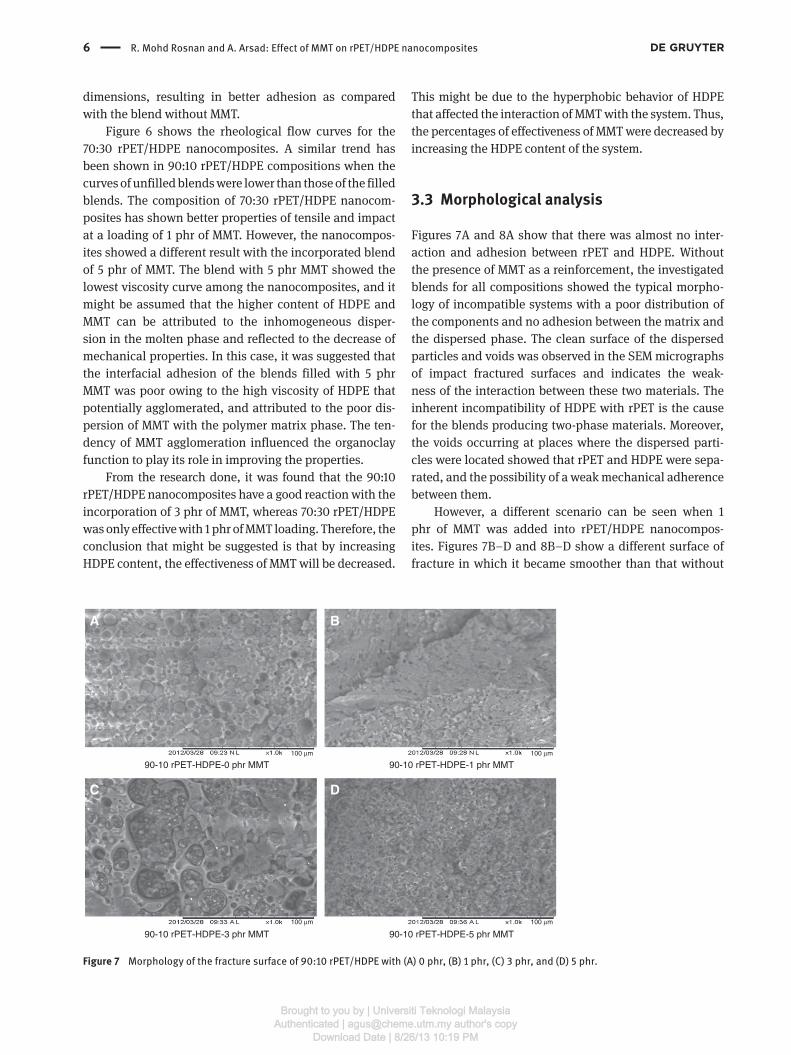
Figures 7 A and 8 A show that there was almost no inter-
action and adhesion between rPET and HDPE. Without
the presence of MMT as a reinforcement, the investigated
blends for all compositions showed the typical morpho-
logy of incompatible systems with a poor distribution of
the components and no adhesion between the matrix and
the dispersed phase. The clean surface of the dispersed
particles and voids was observed in the SEM micrographs
of impact fractured surfaces and indicates the weak-
ness of the interaction between these two materials. The
inherent incompatibility of HDPE with rPET is the cause
for the blends producing two-phase materials. Moreover,
the voids occurring at places where the dispersed parti-
cles were located showed that rPET and HDPE were sepa-
rated, and the possibility of a weak mechanical adherence
between them.
However, a different scenario can be seen when 1
phr of MMT was added into rPET/HDPE nanocompos-
ites. Figures 7 B – D and 8 B – D show a different surface of
fracture in which it became smoother than that without
A B
C D
90-10 rPET-HDPE-0 phr MMT100 μm 100 μm
100 μm 100 μm
90-10 rPET-HDPE-1 phr MMT
90-10 rPET-HDPE-3 phr MMT 90-10 rPET-HDPE-5 phr MMT
Figure 7 Morphology of the fracture surface of 90:10 rPET/HDPE with (A) 0 phr, (B) 1 phr, (C) 3 phr, and (D) 5 phr.
Brought to you by | Universiti Teknologi MalaysiaAuthenticated | [email protected] author's copy
Download Date | 8/26/13 10:19 PM
R. Mohd Rosnan and A. Arsad: Effect of MMT on rPET/HDPE nanocomposites 7
MMT in the matrix, indicating enhancement of interfacial
adhesion. The 90:30 rPET/HDPE blends without MMT in
Figure 7 A was characterized by domains clearly segre-
gated from the matrix and by wide voids in the domain
boundary. It is different in the other compositions with
MMT addition, as shown in Figures 7 B – D and 8 B – D, in
which the dispersed phase was strongly adhered to the
matrix and the fracture was propagated throughout both
phases. It is also evidenced that MMT could act as a com-
patibilizer that has the ability to attach or penetrate into
the rPET phase instead of the HDPE phase because of the
similarity in hydrophilic properties [19] . The formation of
voids in the uncompatibilized blends can be explained by
different volume shrinkages during the thermal transition
of polymers in fast cooling [20] .
Figures 7 and 8 show that HDPE appeared as an island
or in droplet form surrounded by the molten rPET phases.
This is because HDPE with a higher viscosity has the
opportunity to form agglomeration into an island form in
the molten rPET phase [21, 22] . The virgin HDPE with long
molecular chains was forced to agglomerate because of
limited mobility. This is also because of different melting
points that showed two phases of materials trying to attach
to each other to form a good combination in the presence
of MMT in order to be wet. This statement is true when the
melting range of PET (220 ° C – 260 ° C) is far higher than that
of HDPE, which solidified as a continuous phase [23] .
The HDPE phases have remained entrapped within
the rPET phase, which subsequently constituted the sub-
phase to become HDPE islands. In this case, PET is a recy-
cle-based material whose molecular structure has been
formed in short chains. Therefore, rPET has the potential
to flow very fast, owing to its short molecular chains with
lower viscosity, in order to distribute itself well and sur-
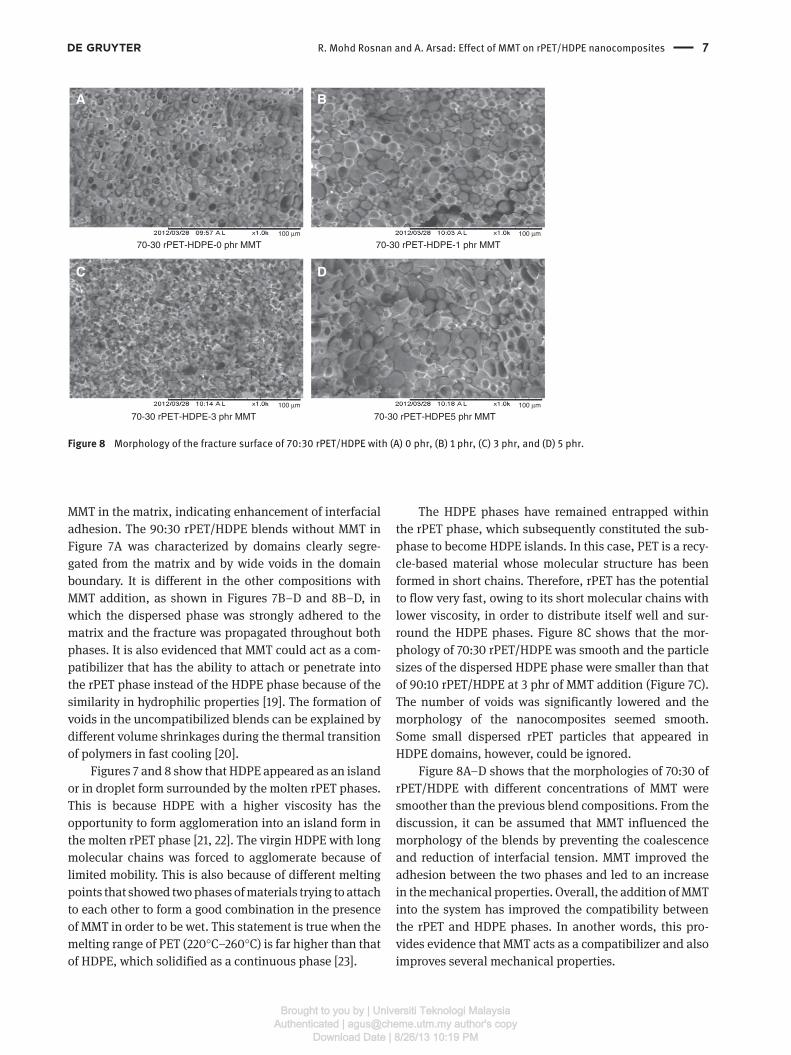
round the HDPE phases. Figure 8 C shows that the mor-
phology of 70:30 rPET/HDPE was smooth and the particle
sizes of the dispersed HDPE phase were smaller than that
of 90:10 rPET/HDPE at 3 phr of MMT addition ( Figure 7 C).
The number of voids was significantly lowered and the
morphology of the nanocomposites seemed smooth.
Some small dispersed rPET particles that appeared in
HDPE domains, however, could be ignored.
Figure 8 A – D shows that the morphologies of 70:30 of
rPET/HDPE with different concentrations of MMT were
smoother than the previous blend compositions. From the
discussion, it can be assumed that MMT influenced the
morphology of the blends by preventing the coalescence
and reduction of interfacial tension. MMT improved the
adhesion between the two phases and led to an increase
in the mechanical properties. Overall, the addition of MMT
into the system has improved the compatibility between
the rPET and HDPE phases. In another words, this pro-
vides evidence that MMT acts as a compatibilizer and also
improves several mechanical properties.
A B
C D
70-30 rPET-HDPE-0 phr MMT100 μm 100 μm
100 μm 100 μm
70-30 rPET-HDPE-1 phr MMT
70-30 rPET-HDPE-3 phr MMT 70-30 rPET-HDPE5 phr MMT
Figure 8 Morphology of the fracture surface of 70:30 rPET/HDPE with (A) 0 phr, (B) 1 phr, (C) 3 phr, and (D) 5 phr.
Brought to you by | Universiti Teknologi MalaysiaAuthenticated | [email protected] author's copy
Download Date | 8/26/13 10:19 PM
8 R. Mohd Rosnan and A. Arsad: Effect of MMT on rPET/HDPE nanocomposites
Figure 9 TGA curves of the 90:10 rPET/HDPE nanocomposites at
10 ° C/min in N 2 .
Figure 10 TGA curves of the 70:30 rPET/HDPE nanocomposites at
10 ° C/min in N 2 .
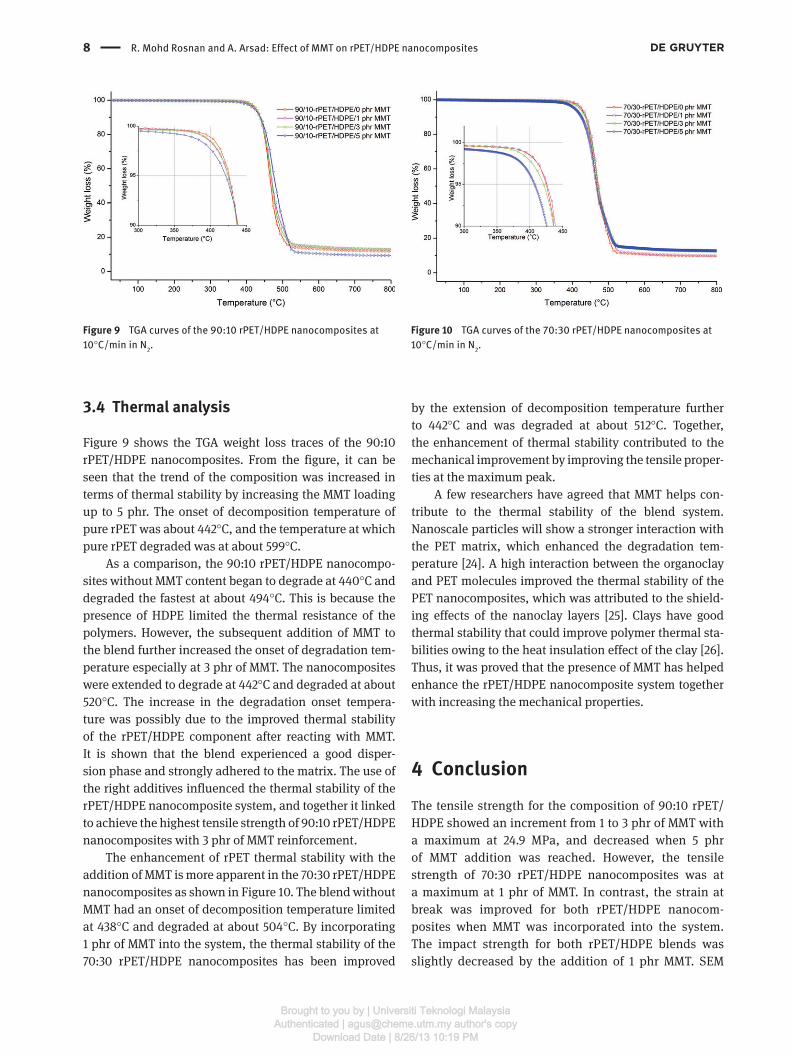
3.4 Thermal analysis
Figure 9 shows the TGA weight loss traces of the 90:10
rPET/HDPE nanocomposites. From the figure, it can be
seen that the trend of the composition was increased in
terms of thermal stability by increasing the MMT loading
up to 5 phr. The onset of decomposition temperature of
pure rPET was about 442 ° C, and the temperature at which
pure rPET degraded was at about 599 ° C.
As a comparison, the 90:10 rPET/HDPE nanocompo-
sites without MMT content began to degrade at 440 ° C and
degraded the fastest at about 494 ° C. This is because the
presence of HDPE limited the thermal resistance of the
polymers. However, the subsequent addition of MMT to
the blend further increased the onset of degradation tem-
perature especially at 3 phr of MMT. The nanocomposites
were extended to degrade at 442 ° C and degraded at about
520 ° C. The increase in the degradation onset tempera-
ture was possibly due to the improved thermal stability
of the rPET/HDPE component after reacting with MMT.
It is shown that the blend experienced a good disper-
sion phase and strongly adhered to the matrix. The use of
the right additives influenced the thermal stability of the
rPET/HDPE nanocomposite system, and together it linked
to achieve the highest tensile strength of 90:10 rPET/HDPE
nanocomposites with 3 phr of MMT reinforcement.
The enhancement of rPET thermal stability with the
addition of MMT is more apparent in the 70:30 rPET/HDPE
nanocomposites as shown in Figure 10 . The blend without
MMT had an onset of decomposition temperature limited
at 438 ° C and degraded at about 504 ° C. By incorporating
1 phr of MMT into the system, the thermal stability of the
70:30 rPET/HDPE nanocomposites has been improved
by the extension of decomposition temperature further
to 442 ° C and was degraded at about 512 ° C. Together,
the enhancement of thermal stability contributed to the
mechanical improvement by improving the tensile proper-
ties at the maximum peak.
A few researchers have agreed that MMT helps con-
tribute to the thermal stability of the blend system.
Nanoscale particles will show a stronger interaction with
the PET matrix, which enhanced the degradation tem-
perature [24] . A high interaction between the organoclay
and PET molecules improved the thermal stability of the
PET nanocomposites, which was attributed to the shield-
ing effects of the nanoclay layers [25] . Clays have good
thermal stability that could improve polymer thermal sta-
bilities owing to the heat insulation effect of the clay [26] .
Thus, it was proved that the presence of MMT has helped
enhance the rPET/HDPE nanocomposite system together
with increasing the mechanical properties.
4 Conclusion The tensile strength for the composition of 90:10 rPET/
HDPE showed an increment from 1 to 3 phr of MMT with
a maximum at 24.9 MPa, and decreased when 5 phr
of MMT addition was reached. However, the tensile
strength of 70:30 rPET/HDPE nanocomposites was at
a maximum at 1 phr of MMT. In contrast, the strain at
break was improved for both rPET/HDPE nanocom-
posites when MMT was incorporated into the system.
The impact strength for both rPET/HDPE blends was
slightly decreased by the addition of 1 phr MMT. SEM
Brought to you by | Universiti Teknologi MalaysiaAuthenticated | [email protected] author's copy
Download Date | 8/26/13 10:19 PM
R. Mohd Rosnan and A. Arsad: Effect of MMT on rPET/HDPE nanocomposites 9
micrographs showed more uniform dispersed particles
of smaller dimensions, with better adhesion compared
with the blend without MMT.
In rheological analysis, the increment of melt vis-
cosity from unfilled blends to nanoclay-filled blends for
both rPET/HDPE compositions was shown to be in agree-
ment with the Newtonian behavior in the lower shear rate
region. The thermal stability of 90:10 and 70:30 rPET/
HDPE nanocomposites were improved by incorporating
with MMT at 3 and 1 phr. The extension of degradation
onset temperature showed that the stable nanocompos-
ites experienced a good dispersion phase and strongly
adhered to the matrix of the rPET/HDPE nanocomposites.
Acknowledgments: This work was supported by the Uni-
versiti Teknologi Malaysia (research university grant).
Received May 1, 2013; accepted July 19, 2013
References [1] Benhamida A, Kaci M, Cimmino S, Silvestre C, Duraccio D.
Macromol. Mater. Eng. 2009, 2, 122 – 129.
[2] Tincer T, Demir T. J Appl. Polym. Sci. 2001, 79, 827 – 835.
[3] Hansen CM. Hansen Solubility Parameters: A User ’ s Handbook
[chapter 7], CRC Press: Boca Raton, FL, 2000.
[4] Lei Y, Wu Q, Zhang Q. Compos. Part A-Appl. S. 2009, 40,
904 – 912.
[5] Akovali G, Bernardo CA, Leidner J, Utracki LA, Xanthos M.
Frontiers in the Science and Technology of Polymer Recycling ,
Kluwer Academic Publisher: Norwell, 1998.
[6] Pegoretti A, Kolarik J, Peroni C, Migliaresi C. Polymer 2004, 45,
2751 – 2759.
[7] Kracalik M, Studenovsky M, Mikesova J, Kovarova J, Sikora A,
Thomann R, Friedrich C. J. Appl. Polym. Sci. 2007, 106,
2092 – 2100.
[8] Bizzaria M, Giraldi M, Carvalho CM, Velasco JI, Avila MA,
Mei LCI. J. Appl. Polym. Sci. 2007, 104, 1839 – 1844.
[9] Park HD, Park KO, Cho WJ, Ha SC, Kwon KS. Polym. Recycling
1996, 2, 283 – 289.
[10] Aglietto M, Coltelli MB, Savi S, Locchiatto F, Ciardelli F,
Gianni M. J. Mater. Cycles Waste Manag. 2004, 6, 13 – 19.
[11] Kameshwari DSH, Shashidhara GM, Ghosh AK. Compos. Interface 2010, 17, 217 – 222.
[12] Lei Y, Wu Q, Clemons CM, Guo W. J. Appl. Polym. Sci. 2009, 113,
1710 – 1719.
[13] Wang Y, Gao J, Ma Y, Argawal US. Compos. Part B-Eng. 2006, 6,
399 – 407.
[14] Coran AY, Patel R. J. Appl. Polym. Sci. 1976, 11, 20,
3005 – 3016.
[15] Navarro R, Ferrandiz S, Lopez J, Segui VJ. J. Mater. Process Tech. 2008, 195, 110 – 116.
[16] Dimitrova TL, Mantia FP, Pilati F, Toselli M, Valenza A, Visco A.
Polymer 2000, 41, 4817 – 4824.
[17] Jarukumjorn K, Chareunkvun S. J. Sci. Technol. 2007, 1, 1 – 8.
[18] Chow WS, Mohd Ishak ZA, Ishiaku US, Karger-Kocsis J,
Apostolov AA. J. Appl. Polym. Sci. 2003, 91, 175 – 189.
[19] Razak MZA, Arsad A, Razak AR, Hassan A. J. Polym. Eng. 2012,
32, 177 – 183.
[20] Felisberti MI, Lopez CMA, Goncalves MC. J. Appl. Polym. Sci. 2007, 4, 2524 – 2535.
[21] Mbarek S, Jaziri M, Chalamet Y, Carrot C. J. Appl. Polym. Sci. 2010, 117, 1683 – 1694.
[22] Xu H-S, Li Z-M, Yang SY, Pan J-L, Yang W, Yang M-B. Polym. Eng. Sci. 2005, 45, 1231 – 1238.
[23] Moet A, Carte TL. J. Appl. Polym. Sci. 1993, 48, 611 – 624.
[24] Ke YC, Long C, Qi Z. J. Appl. Polym. Sci. 1999, 71,
1139 – 1146.
[25] Katbab AA, Hamzehlou S. J. Appl. Polym. Sci. 2007, 2,
1375 – 1382.
[26] Chang JH, Kim SJ, Joo YL, Im S. Polymer 2004, 3, 919 – 926.
Brought to you by | Universiti Teknologi MalaysiaAuthenticated | [email protected] author's copy
Download Date | 8/26/13 10:19 PM
Related Documents


![Poly(epsilon caprolactone)/clay nanocomposites via host–guest …yoksis.bilkent.edu.tr/pdf/files/12088.pdf · An organo-modified clay, Cloisite 30B [MMT-(CH 2CH 2OH) 2] was](https://static.cupdf.com/doc/110x72/5fcc1326040c552894104f77/polyepsilon-caprolactoneclay-nanocomposites-via-hostaaoeguest-an-organo-modiied.jpg)