See discussions, stats, and author profiles for this publication at: http://www.researchgate.net/publication/267024658 EFFECT OF MINERAL AND BIO-FERTILIZATION ON NPK AVAILABILITY, UPTAKE, AND MAIZE YIELD ARTICLE · JANUARY 2009 DOWNLOADS 28 VIEWS 18 2 AUTHORS, INCLUDING: Elsayed Belal Kafrelsheikh University 77 PUBLICATIONS 125 CITATIONS SEE PROFILE Available from: Elsayed Belal Retrieved on: 16 June 2015

Welcome message from author
This document is posted to help you gain knowledge. Please leave a comment to let me know what you think about it! Share it to your friends and learn new things together.
Transcript
Seediscussions,stats,andauthorprofilesforthispublicationat:http://www.researchgate.net/publication/267024658
EFFECTOFMINERALANDBIO-FERTILIZATIONONNPKAVAILABILITY,UPTAKE,ANDMAIZEYIELD
ARTICLE·JANUARY2009
DOWNLOADS
28
VIEWS
18
2AUTHORS,INCLUDING:
ElsayedBelal
KafrelsheikhUniversity
77PUBLICATIONS125CITATIONS
SEEPROFILE
Availablefrom:ElsayedBelal
Retrievedon:16June2015

J. Agric. Sci. Mansoura Univ., 34 (5): 5795-5808., 2009.
EFFECT OF MINERAL AND BIO-FERTILIZATION ON NPK
AVAILABILITY, UPTAKE, AND MAIZE YIELD. El-Basuony, Asmaa A.*; E. B. A. Belal** and A. A. E. Atwa*
* Soils, Water and Environment Research Institute, Agric. Res. Center. ** Agricultural Botany Dept. , Fac. Of Agric., Kafr El-Sheikh Univ., Egypt
ABSTRACT Two field trails were conducted during the two successive seasons 2007-
2008 on maize plants at the experimental farm of Sakha Agric. Res. Station, Kafr El- Sheikh Governorate, Egypt. The aim of this study was to investigate the influence of maize grain treated with Azotobacter chroococcum and Bacillus megatherium and their combinations with NPK under three N-levels; 80, 100, and 120 kg N/fad for N1, N2, and N3 to increase yield, NPK uptake by maize plants and the availability of NPK in the soil. The experiments were conducted in split plot design, with three replicates. The observed results can be summarized as follows:
• The yield and components of maize, NPK uptake and the availability of NPK in the studied soil were affected significantly by biofertilizer treatments and N-levels.
• The maximum values of available N were obtained by the application of Azotobacter chroococcum and Bacillus magetherium with NPK under N3 treatment. The maximum values of available P were recoded by the application of Bacillus megatherium with NPK under N3 treatment.
• Combination of A.chroococcum, B.megatherium, and NPK fertilizers under N3 significantly increased grain yield (20.9 and 17.9%), straw yield (16.8 and 20.6%), 100-grain weight (9.9 and 13.3%), ear weight (21.0 and 18.0) and N, P, and K uptake by maize grain [(35.1 and 31.3%), (21.2 and 26.9%) and (18.1 and 31.1%)] over the control for N, P, and K, respectively, in 2007 and 2008 seasons. While shelling percentage did not significantly affected by different treatments. The application of these results should help in reducing environmental pollution.
Keywords: maize (Zea mays L), biofertilizer, Azotobacter chroococcum, Bacillus
megatherium, mineral fertilization.
INTRODUCTION
Maize (Zea mays L) among the crops is an important in arried and semiarid regions, because of increasing demand for food and livestock feed. In Egypt, the annually cultivated area with maize is about 1.5- 2.0 million faddan. Thus a great attention should be paid to raise its productivity per unite urea. For optimum plant growth, nutrients must be available in sufficient and balanced quantities. Nitrogen and phosphorus are essential nutrient for plant growth and development in maize (Wua, et al., 2005). Large quantities of chemical fertilizers are used to replenish soil N and P resulting in high costs and several environmental contaminations (Dai et al., 2004). Thus,
J. Agric. Sci. Mansoura Univ., 34 (5): 5795-5808., 2009.
increased attention is now being paid to develop and integrate plant nutrients system that maintains or enhances soil productivity through balanced use of all sources of nutrients, including chemical fertilizers and biofertilizers. Biofertilizers are products containing living cells of different types of microorganisms that have an ability to mobilize nutrients from insoluble form through biological processes and these groups of microorganisms may either fix atmospheric nitrogen or solubilizing the insoluble phosphorous making them available for crops (Prabhakar and Singh., 2008). The contribution of non-symbiotic nitrogen fixing microorganisms to the supply of fixed nitrogen in agricultural soils and natural ecosystems is well recognized. Microorganisms including Azotobacter as non-symbiotic nitrogen fixers as well as Bacillus megatherium a phosphate – solubilizing bacteria (PSB) are continuously being isolated from various ecosystems and their performance in the laboratory and field conditions are assessed. Many experiments in greenhouses and in field conditions have shown that several crops respond positively to microbial inoculation. Enhancement and maintenance of soil fertility through microorganisms will be an important issue in future agriculture. Hence, several beneficial microorganisms can effectively be used as a chemical fertilizer alternatively to minimize the application of inorganic fertilizers. Azotobacter chroococcum was used previously in increasing plant parameters (Ahmad et al., 2004 and Yasmin et al., 2007). Yazdani et al., 2009 reported that inoculation with rhizobacteria can be efficiently used to improve growth and grain yield of corn, reduce fertilizer costs and reduce leaching of NO3
- to ground water as well as reducing emission of the green house gas N2O. They concluded too that the application of N2-fixing and P- solubilizing bacteria could reduce P application by 50 % without any significant reduction of maize grain yield. However, this treatment could not compensate 50% of N application. Chandrasekar et al., 2005 found that both morphology and yield parameters produce a better results during the combination of biofertilizers and chemical fertilizers than using either method alone.
The aim of the present study was to evaluate the effect of maize grain treatment with Bacillus megatherium as Phosphorus Solubilizing Bacteria and Azotobacter chrococcum as non-symbiotic nitrogen fixer bacteria in presence of NPK soil fertilization under three N levels on yield and components, NPK uptake by maize plants and the availability of NPK in the soil.
MATERIALS AND METHODS
Series of laboratory and filed experiments were carried out at Faculty of Agriculture, Kafr El-Sheikh University and Sakha Agric. Res. Station, to study the relationship between the laboratory data and crop production. a-Laboratory experiments:
• Microorganisms isolation and identification:
J. Agric. Sci. Mansoura Univ., 34 (5): 5795-5808., 2009.
Azotobacter chroococcum as non-symbiotic nitrogen fixer bacteria was isolated and identified in previous study (Omar and Belal 2007). Phosphate – solubilizing bacteria (PSB) was isolated in this study from rhizosphere of maize plants according to Yasmin et al., (2007). Identification of grown isolated colonies based on morphological, biochemical and culturing characteristics were identified according to Parry et al., (1983).
• Effect of pH and temperature on Bacillus megatherium growth:
100ml Pikovskaia's liquid medium were used to determine the effect of temperature and pH on growth of Bacillus megatherium. This medium was inoculated by 1ml (108 cfu/ml) of culture of Bacillus megatherium isolate. The experiments were carried out at pH 6, 7 and 8 and the culture was incubated at 30oC and 150 rpm for 3 days. To determine the optimum temperature Pikovskaia's broth medium at pH7, cultures were incubated at 20, 30 and 40oC and 150 rpm for 3 days. The growth was determined as intracellular protein content (µg/ml) for bacterial isolates after 3days according to Lowry et al., (1951), where the bacterial cells were digested as described by Belal (2003).
• Application of grain treatments with Azotobacter chroococcum
and Bacillus megatherium Azotobacter chroococcum and Bacillus megatherium were applied at
the time of planting as grain treatment. Grains were immersed in each bacterial suspension (108cfu/ml) for 30min. and then air dried. Grains were then sown in the soil.
• Effect of different treatments on total microbial count in maize
rhizosphere plants The total microbial count in rhizosphere of untreated and treated soils
with Azotobacter chroococcum and Bacillus megatherium strains in combination of different chemical fertilizers was counted three times after 30, 60 and 90days during the growing season by using dilution series on standard-plate count agar.
b- Field experiments:
Two field experiments were conducted at the experimental farm of Sakha Agric. Res. Station during the two successive seasons of 2007 and 2008 using maize grain (Zea mays L) Giza 352. The experiments were conducted in split-plot design with three replicates. The main plots were to N- treatment ;80, 100, and 120 (the recommended dose) Kg N/ fad for N1, N2, and N3. These treatments were 66, 83, and 100% of the recommended doses, respectively as urea 46%N), the sub- plots were to bio fertilizers treatments (grain bacterial inoculated). The treatments were, without inoculation (T1), inoculated with Bacillus megatherium (T2), inoculated with azotobacter chrococcum (T3), and inoculated with Bacillus megatherium and
J. Agric. Sci. Mansoura Univ., 34 (5): 5795-5808., 2009.
Azotobacter chrococcum (T4). All experiment plots were treated with 30 Kg P2O5 / fad as superphosphates 15% P2O5 at sowing and 24 Kg K2O / fad as potassium sulphate (48% K2O) before 2nd irrigation. The maize plants were harvested at 20th 2007 and 25th 2008 of Sep, grain and straw yield were determined after maturity and weighed at 15% moisture content. Grain and straw samples were taken and dried in an oven at 70 C for 48 hours. Dry sample was digested by wet digesting (Jackson, 1967). N, P, and K were determined in the digested plant materials.
Soil surface samples (0- 15 cm) were collected from the treated plots after maize harvesting. The collected soil samples were air-dried and prepared for chemical analysis. Available nitrogen was extracted by K- sulphate and determined using the microkjeldahl method according to (Jackson, 1967). Available phosphorus was extracted by using NaHCO3 according to Olsen, (1954) and then determined spectrophtometrically according to Jackson, (1967). Available potassium was determined by using flam photometer in ammonium acetate extract, according to Jackson, (1967). The data were subjected to statistical analysis according to Snedocor and Cochrou, (1980).The soil characteristics of experiment location are presented in Table 1.
Table (1): Some chemicals and physical properties of the soil surface
layer (0-30 cm) before planting
Characteristics Values pH (1:2.5 soil : water suspension) 7.52 ECe dSm-1 3.20 OM% 1.92 Available nutrients, mg/ Kg soil: N 22 P 5.8 K 415 Particle size distribution%: Clay % 52.00 Silt % 23.9 Sand % 24.1 Texture class Clay
.
RESULTS AND DISCUSSION Isolation and identification of the organisms
An evaluation of different rhizosphere maize plants were used to isolate the phosphate – solubilzing bacteria (PSB) in Pikovskaia's medium (Yasmin et al., 2007). In the present work they were collected from different locations in Kafr El-Sheikh Governorate, Egypt, resulting in isolation of one bacterial isolate and tentatively was identified as Bacillus megatherium on the basis of morphological and physiological behavior as described in Parry et al., (1983).
J. Agric. Sci. Mansoura Univ., 34 (5): 5795-5808., 2009.
Effect of pH and temperature on growth of Bacillus megatherium.
A phosphate – solubilzing bacteria (PSB) depends on the prevailing environmental conditions such as pH value and temperature in the soil and biological components, including all root-colonizing plant-beneficial bacteria and fungi. Optimum pH value:
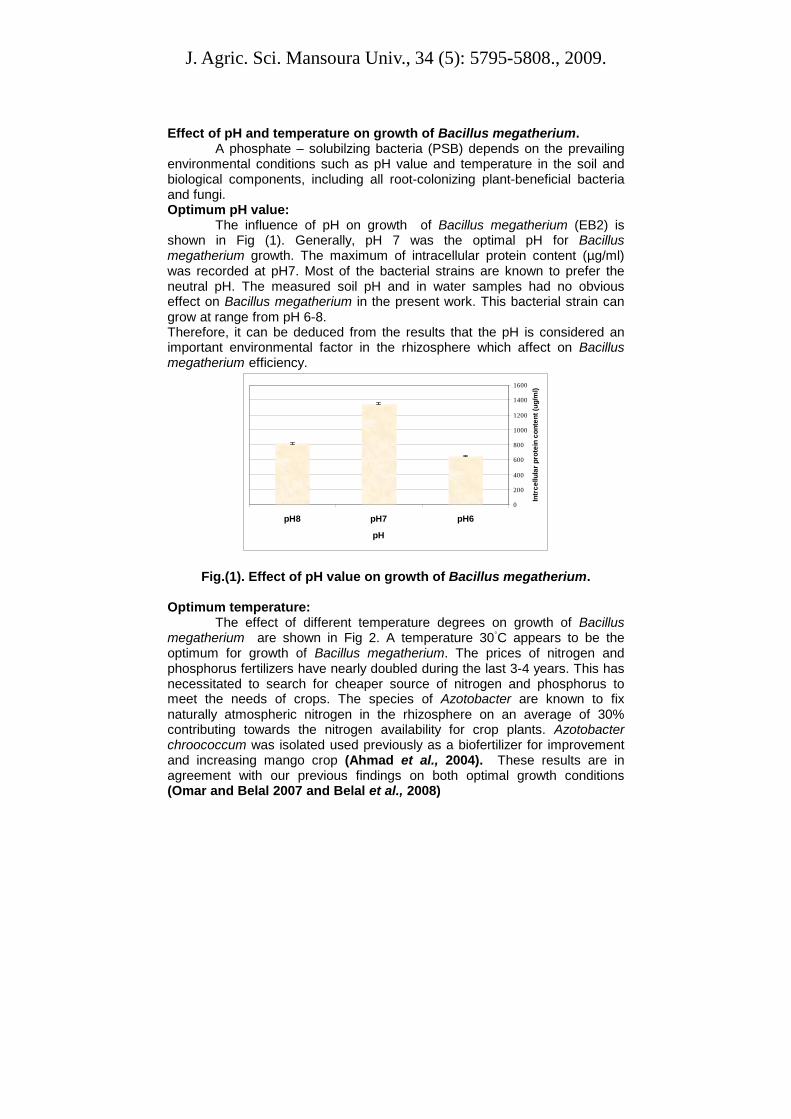
The influence of pH on growth of Bacillus megatherium (EB2) is shown in Fig (1). Generally, pH 7 was the optimal pH for Bacillus megatherium growth. The maximum of intracellular protein content (µg/ml) was recorded at pH7. Most of the bacterial strains are known to prefer the neutral pH. The measured soil pH and in water samples had no obvious effect on Bacillus megatherium in the present work. This bacterial strain can grow at range from pH 6-8. Therefore, it can be deduced from the results that the pH is considered an important environmental factor in the rhizosphere which affect on Bacillus megatherium efficiency.
0
200
400
600
800
1000
1200
1400
1600
pH6pH7pH8
pHIn
trce
llula
r pro
tein
con
tent
(ug/
ml)
Fig.(1). Effect of pH value on growth of Bacillus megatherium. Optimum temperature:
The effect of different temperature degrees on growth of Bacillus megatherium are shown in Fig 2. A temperature 30◦C appears to be the optimum for growth of Bacillus megatherium. The prices of nitrogen and phosphorus fertilizers have nearly doubled during the last 3-4 years. This has necessitated to search for cheaper source of nitrogen and phosphorus to meet the needs of crops. The species of Azotobacter are known to fix naturally atmospheric nitrogen in the rhizosphere on an average of 30% contributing towards the nitrogen availability for crop plants. Azotobacter chroococcum was isolated used previously as a biofertilizer for improvement and increasing mango crop (Ahmad et al., 2004). These results are in agreement with our previous findings on both optimal growth conditions (Omar and Belal 2007 and Belal et al., 2008)

J. Agric. Sci. Mansoura Univ., 34 (5): 5795-5808., 2009.
0
200
400
600
800
1000
1200
40°C30°C20°C
Temperature
Intra
cellu
lar p
rote
in c
onte
nt
(ug/
ml)
Fig.(2). Effect of temperature on growth Bacillus megatherium. Soil available of N, P, and K:
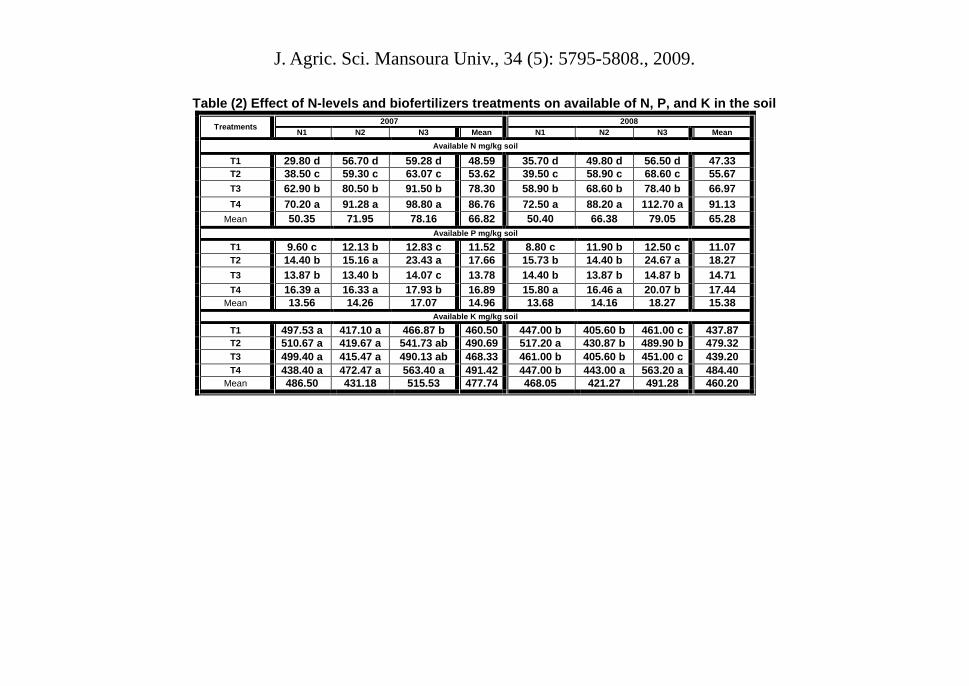
Data presented in Table (2) show that the application of biofertilizer treatments under N-levels significantly increased the availability of P and N in the soil compared with the control (NPK).
T1, T2, T3, and T4 gave the highest values of available N and P under N3 in the two seasons. Fig (3) show that available N in the soil as affected by biofertilizer treatments were in this order: T4>T3>T2>T1 in the two seasons. This trend was differed from that in available P which were in the order: T2>T4>T3>T1 (Fig 4).The maximum value of available N (98.8 and 112.7 mg N/kg soil in 2007 and 2008) were obtained by the application of T4 under N3 treatment followed by T3. The results reflect the pronounced effect of inoculating maize grains with Azotobacter chrococcum in fixing atmospheric nitrogen and make it available to plant. These results are in agreement with those obtained by Chen (2008). He reported that Azotobacter and Azospirillim are free living bacteria that fix atmospheric nitrogen in cereal crops without any symbiosis and they do not need a specific host plant, it can fix 15-20 kg N/ha per year. The maximum values of available P (23.4 and 24.67 ppm in 2007 and 2008) were obtained by the application of T2 under N3 followed by T4 under N3 treatment in the two seasons. These results are in agreement with those obtained by Chen (2008), and Yazdani et al.,(2009). They reported that phosphobacterins can make insoluble phosphorus available to the plant. The solubilization effect is generally due to the production of organic acid that lower the soil pH and bring about the dissolution of bond forms of phosphate.
Available K had no significant effect with biofertilizer treatments as well as N-level in the first season, while in the second season the values of available K was affected significantly with biofertilizers and N-level. The maximum values of available K (563.4 and 563.2mg/kg soil in 2007 and 2008 seasons) were obtained by applying T4under N3.
J. Agric. Sci. Mansoura Univ., 34 (5): 5795-5808., 2009.
Table (2) Effect of N-levels and biofertilizers treatments on available of N, P, and K in the soil Treatments 2007 2008
N1 N2 N3 Mean N1 N2 N3 Mean Available N mg/kg soil
T1 29.80 d 56.70 d 59.28 d 48.59 35.70 d 49.80 d 56.50 d 47.33 T2 38.50 c 59.30 c 63.07 c 53.62 39.50 c 58.90 c 68.60 c 55.67 T3 62.90 b 80.50 b 91.50 b 78.30 58.90 b 68.60 b 78.40 b 66.97 T4 70.20 a 91.28 a 98.80 a 86.76 72.50 a 88.20 a 112.70 a 91.13
Mean 50.35 71.95 78.16 66.82 50.40 66.38 79.05 65.28 Available P mg/kg soil
T1 9.60 c 12.13 b 12.83 c 11.52 8.80 c 11.90 b 12.50 c 11.07 T2 14.40 b 15.16 a 23.43 a 17.66 15.73 b 14.40 b 24.67 a 18.27 T3 13.87 b 13.40 b 14.07 c 13.78 14.40 b 13.87 b 14.87 b 14.71 T4 16.39 a 16.33 a 17.93 b 16.89 15.80 a 16.46 a 20.07 b 17.44
Mean 13.56 14.26 17.07 14.96 13.68 14.16 18.27 15.38 Available K mg/kg soil
T1 497.53 a 417.10 a 466.87 b 460.50 447.00 b 405.60 b 461.00 c 437.87 T2 510.67 a 419.67 a 541.73 ab 490.69 517.20 a 430.87 b 489.90 b 479.32 T3 499.40 a 415.47 a 490.13 ab 468.33 461.00 b 405.60 b 451.00 c 439.20 T4 438.40 a 472.47 a 563.40 a 491.42 447.00 b 443.00 a 563.20 a 484.40
Mean 486.50 431.18 515.53 477.74 468.05 421.27 491.28 460.20

J. Agric. Sci. Mansoura Univ., 34 (5): 5795-5808., 2009.
0
10
20
30
40
50
60
70
T1 T2 T3 T4
Treatment
N-up
take
(kg/
fad)
0102030405060708090100
N-av
aila
ble(
mg/
kg s
oil)
N-uptake N-available
Fig. 3.Effect of biofertilizers treatments on N-uptake of maize grain (kg/fad) and available N in the soil (mg/kg soil) (average of the two
seasons).
0
5
10
15
20
25
T1 T2 T3 T4
Treatment
P-u
ptak
e (k
g/fa
d)
0
5
10
15
20
avai
labl
e P
-(mg/
kg s
oil)
P-uptake P-available
Fig. 4. Effect of biofertilizer treatments on P-uptake of maize grain (kg/fad) and available P in the soil (mg/kg soil) (average of the two
seasons).
J. Agric. Sci. Mansoura Univ., 34 (5): 5795-5808., 2009.
Yield and yield components: Grain yield:
The results in Table (3) show that the grain yield of maize was affected significantly by different N-levels and biofertilizers treatments. T1, T2, T3, and T4 treatments gave the highest values of grain yield under N3 (the recommended dose) in the first season. On the other hand, in the second season T2 and T3 treatments gave the highest values under N1(66% of the recommended dose). Meanwhile, T1 and T4 treatments gave the highest values under N3 exhibit the same trend as in the previous season. The maximum values of grain yield; 4443 and 4429 kg/fad in 2007 and 2008 seasons, respectively were obtained by the application of T4 treatments under N3. The grain yields were positively increased by about 20.9 and 17.9% in 2007 and 2008, respectively due to the combination of biofertilizers and 120 kg N/fad. The obtained data by Prabhakar and singh (2008) and Anjum et al., (2007), supported these results. They reported that, the response of field crops to inoculating with Azotobacter and phosphobacteria together for release of hormones, increased crop yields by 10-20 percent, improved soil properties and sustained soil fertility over a longer period of time. On the other hand, indirect promotion of plant growth occurs when bacteria decreases or prevent of the deleterious effects of a phytopathogenic organism by one or more mechanisms.
Straw yield:
The results in Table (3) show that straw yield of maize was significantly affected significantly with different N-levels and biofertilizers treatments T1, T2, T3, and T4 which gave the highest values of straw yield under N3 in the two seasons except for T2 which gave the highest values under N1 in the second season. The maximum values of straw yield; 6604 and 6470 kg/fad in 2007 and 2008 seasons were obtained by the application of T4 under N3 treatment in the two seasons. The straw yields were increased by about 16.76 and 20.6% over the control (T1) in 2007 and 2008, respectively due to the combination of 120 kg N/fad and inoculating make grains with Azotobacter and phosphobacteria. These results are in agreement with those obtained by Chandrasekar et al., (2005). He revealed that the maximal plant height, number of leaves, leaf area, and leaf length were observed in the plots treated with azospirillum along with 100% urea followed by Azotobacter along with 100% urea. In general, it could be stated that T4 under N3 treatments gave the highest grain and straw yields of maize (Fig 5).
100-grain weight:
The results in Table (3) show that 100 grain weight of maize was affected significantly with different N-levels and biofertilizer treatments. The highest values of 100 grain weight; 37.00 and 33.09 gm in 2007 and 2008 were obtained by the application of T2 under N2 treatment in the first season and T4 under N1 treatment in the second season, respectively. The 100-grain
J. Agric. Sci. Mansoura Univ., 34 (5): 5795-5808., 2009.
weight was increased by about 9.9 and 13.3% over the control (T1) in 2007 and 2008 seasons, respectively due to the application of biofertilizer treatments with NPK under N3.
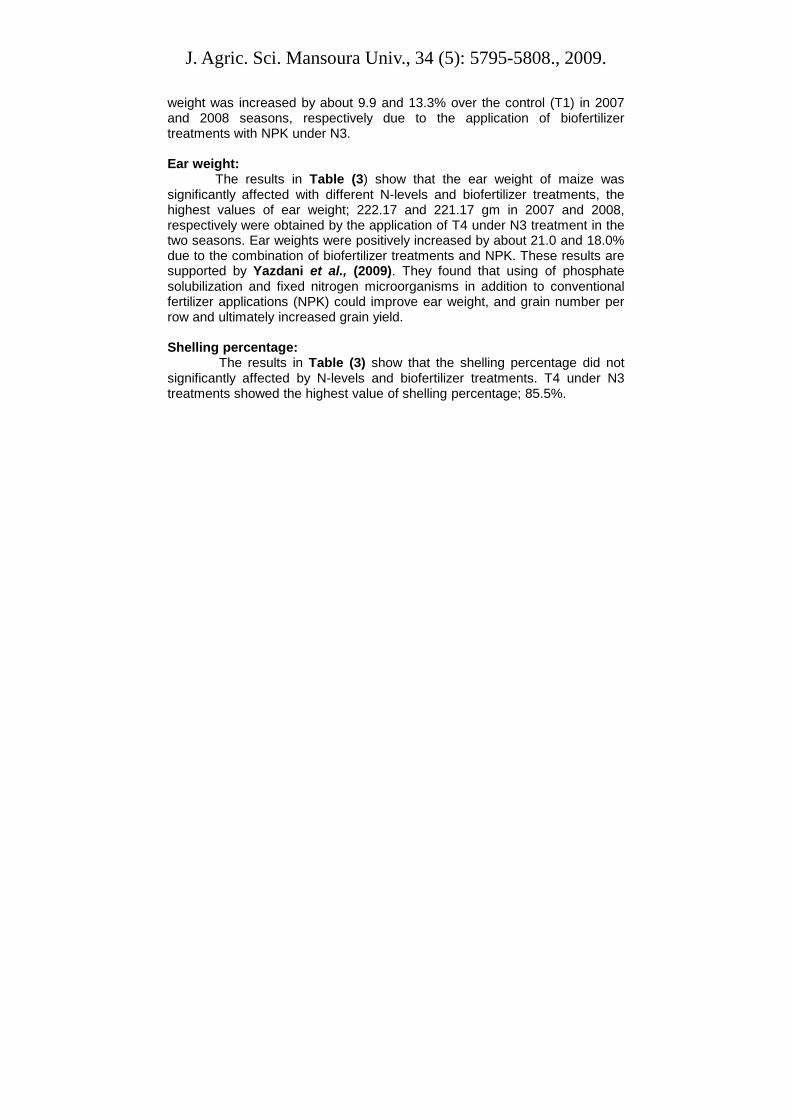
Ear weight:
The results in Table (3) show that the ear weight of maize was significantly affected with different N-levels and biofertilizer treatments, the highest values of ear weight; 222.17 and 221.17 gm in 2007 and 2008, respectively were obtained by the application of T4 under N3 treatment in the two seasons. Ear weights were positively increased by about 21.0 and 18.0% due to the combination of biofertilizer treatments and NPK. These results are supported by Yazdani et al., (2009). They found that using of phosphate solubilization and fixed nitrogen microorganisms in addition to conventional fertilizer applications (NPK) could improve ear weight, and grain number per row and ultimately increased grain yield. Shelling percentage:
The results in Table (3) show that the shelling percentage did not significantly affected by N-levels and biofertilizer treatments. T4 under N3 treatments showed the highest value of shelling percentage; 85.5%.

J. Agric. Sci. Mansoura Univ., 34 (5): 5795-5808., 2009.
Table (3) Effect of N-levels and biofertilizers treatments on grain and straw yields, 100-grain weight, ear weight, and shelling percentage in the two seasons
Treatments
2007 2008 N1 N2 N3 Mean N1 N2 N3 Mean
Grain yield, kg/fad T1 2927 d 3555 c 3665 b 3382.33 3155 b 3480 b 3887 b 3507.56 T2 3217 c 3621 bc 3758 b 3532.00 3918 a 3793 b 3669 b 3793.33 T3 3622 b 3778 b 3860 b 3753.33 3834 a 3636 b 3704 b 3724.89 T4 4000 a 4385 a 4443 a 4276 4132 a 4258 a 4429 a 4273.00
Mean 3441.5 3834.75 3931.5 3735.92 3759.92 3791.92 3922.25 3824.69
Straw yield, kg/fad T1 4390 c 5350 c 5497 c 5497 c 4624 c 5200 c 5200 c 5014.67 T2 4852 b 5020 d 5621 bc 5621 bc 5500 b 5100 c 5400 c 5333.38 T3 4758 b 5667 b 5790 b 5790 b 5375 b 5818 b 5866 b 5686.33 T4 5940 a 6470 a 6604 a 6604 a 6120 a 6360 a 6470 a 6316.67
Mean 4985.00 5626 5626.75 5878.00 5404.75 5624.50 5734.00 5587.75
100-grain weight (g) T1 28.76 b 30.19 b 35.20 a 31.38 27.36 c 26.03 c 30.19 b 27.86 T2 30.11 b 37.00 a 35.14 a 34.08 29.55 c 31.41 a 28.55 b 29.94 T3 31.23 ab 35.75 a 35.87 a 34.28 30.59 b 31.49 a 32.06 a 31.38
J. Agric. Sci. Mansoura Univ., 34 (5): 5795-5808., 2009.
T4 33.68 a 36.14 a 34.61 a 34.81 33.09 a 30.83 b 32.48 a 32.13
Mean 30.95 34.77 35.21 33.64 30.14 29.94 30.82 30.82
Ear weight(g) T1 146.33 d 177.77 b 183.27 b 169.12 157.8 c 174.00 c 194.37 b 175.39 T2 160.83 c 181.03 bc 187.90 b 179.59 195.90 ab 189.00 b 181.17 b 188.69 T3 181.10 b 188.90 b 193.00 b 187.67 191.70 b 198.50 b 184.50 b 191.57 T4 200.00 a 219 27 a 222.17 a 213.81 206.6 a 212.90 a 221.17 a 213.56
Mean 172.07 191.74 196.58 186.10 188.00 193.6 195.20 192.30
Shelling percentage T1 80.85 a 81.90 ab 84.53 a 82.23 80.22 a 82.30 a 85.23 a 82.58 T2 81.01 a 84.50 a 83.20 a 82.91 81.25 a 85.30 a 82.40 a 82.98 T3 82.50 a 80.80 b 84.50 a 82.60 81.24 a 79.98 a 83.22 a 81.48 T4 83.50 a 84.50 a 85.50 a 84.50 82.50 a 84.62 a 85.50 a 84.21
Mean 81.82 82.93 84.40 83.50 81.30 a 83.05 84.09 82.81
J. Agric. Sci. Mansoura Univ., 34 (5): 5795-5808., 2009.
0
1000
2000
3000
4000
5000
6000
7000
T1 T2 T3 T4Treatment
Gra
in a
nd s
traw
yie
ld (k
g/fa
d)
Grain yield Straw yield
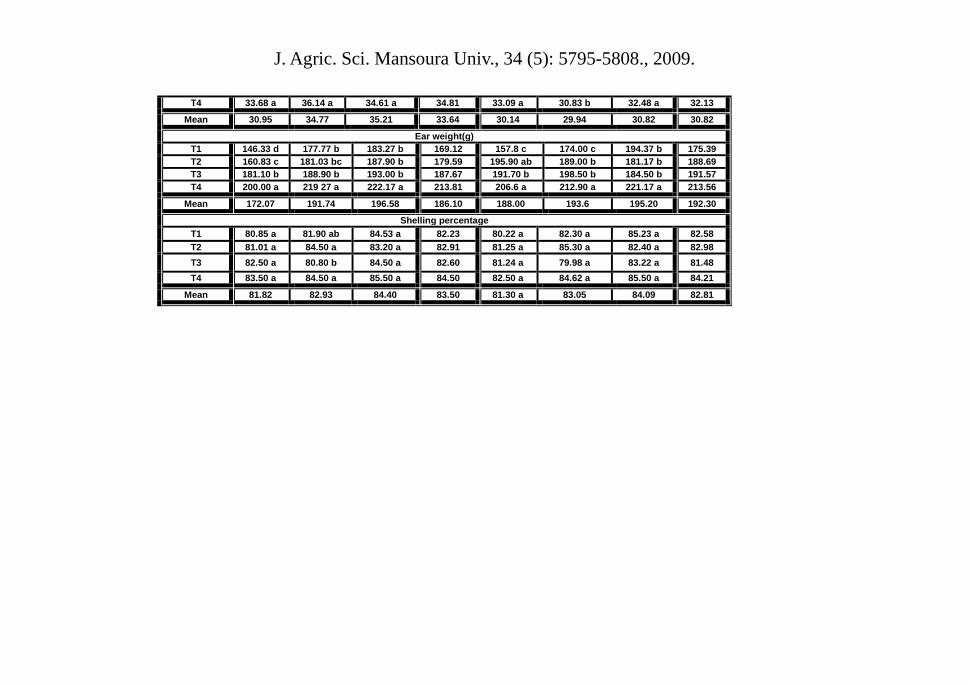
Fig. 5 Effect of biofertilizers treatments on grain and straw yield of maize
(average of two seasons). Relative effect of biofertilizer in maize grain
Table (4) Relative increase (∆%) of maize grains due to bio-fertilizer
inoculation
Treatment 2007 2008
N1 N2 N3 N1 N2 N3
T2 9.0% 2% 2% 20% 8% - T3 19% 6% 5% 18% 4% - T4 27% 19% 18% 24% 18% 12.2%
For example ∆ increase of maize grain as a result of Bacillus megatherium (T2 under N1 treatment) can be calculated as following:
(∆%) = x100
N1) under (T2 yieldGrainN1) under (T1 yieldGrain- N1) under (T2 yieldGrain = 9.0%
Data in Table (4) show that by the increasing of N-levels fertilizer, the
activity of soil bacteria decreased, consequently biofertilizer sharing percent on increasing the grain yield reduced. For example in (2007) the relative increase % of maize grain due to Bacillus megatherium inoculation under N1 was 9.0% then decreased to 2.0% under N3, the corresponding values for Azotobacter chroococcum were 19.0% under N1 and 5.0% under N3. Also these values for the combination of Bacillus megatherium and Azotobacter chroococcum were 27.0% under N1 and 18.0% under N3. These results were supported by Chen (2008). He reported that the application of chemical

J. Agric. Sci. Mansoura Univ., 34 (5): 5795-5808., 2009.
fertilizers can result in negative effects such as destruction of microorganisms and friendly insects.
In the comparison with T4 treatments at N1, N2, and N3, we can see that at N3 (the recommended dose) the maize grain yield increased only by 8.3 and 2.6% over that at N2 (66% of the recommended dose) and N1 (83% of the recommended dose), respectively (mean of two seasons). This saved 33 and 17% of nitrogen fertilizer, which consequently decreases environment pollution, health hazard, and fertilizer costs and benefits microflora in the rhizosphere. However much research is still needed.
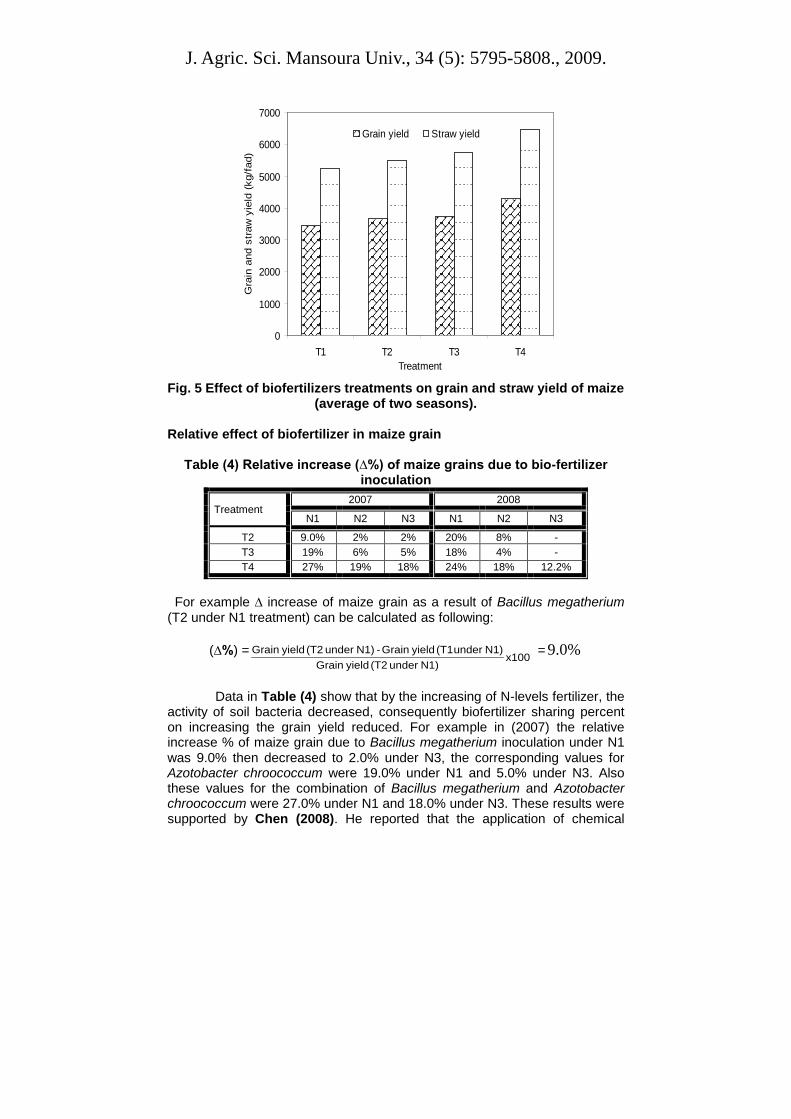
N, P, and K uptake:-
The results in Table (5) and (6) show that N, P, and K uptake of maize
grain and straw were affected significantly with different N-levels and biofertilizer treatment.
N uptake gave the highest values at T1, T2, and T4 under N3 ,and T3 under N2 in the two seasons.
P and K uptake gave the highest values at T1 and T4 in the two seasons and at T2 and T3 in the first season under T3. While in the second season the highest values at T2 and T3 were given under N1 and N2 respectivily. The maximum values of N, P, and K uptake of maize grain (66.64 and 60.68), (22.21 and 25.58), and (21.77 and 22.92) kg/fad for N, P, and K in 2007 and 2008, respectively were obtained by the application of T4 under N3 treatments. Significant higher (35.11 and 31.25%), (21.24 and 26.95%), and (18.07 and 31.05%) for N, P, and K uptake of maize grain respectively were recorded by the application of T4 (mean value of all T4) compared to the control in 2007 and 2008 seasons. These increments can be explained as follows, Azotobacter chrococcum and bacillus megatherium can fix the atmospheric free nitrogen or increase the availability of phosphorus in the soil, respectively and hence make the nitrogen and phosphorus in easier form for maize plant in rhizophere. These results were supported by the data obtained by Ghulam et al., (2007) and Davison (1988). They reported that biofertilizers producing a compound to the plant that is synthesized by bacterium or facilitating the uptake of nutrient from environment.
Fig(3 and 4) show that N and P uptake by maize grain were in line with available N and P in soil.
This trend in nutrients uptake by maize grain among the treatments was the same for nutrients uptake of maize straw (Table 6). The observed reduction in N uptake by maize straw could be explained by Chandrasekar (2005), who concluded that the developing grains utilize nitrogen from the vegetative parts for the synthesis of storage and non storage grain proteins. As a consequence, the nitrogen content of vegetative parts decreased after the formation of spikes.
J. Agric. Sci. Mansoura Univ., 34 (5): 5795-5808., 2009.
Table (5) Effect of N- level and biofertilizers on N, P, and K uptake by maize grain Treatments 2007 2008
N1 N2 N3 Mean N1 N2 N3 Mean
N-uptake, kg/fad T1 34.39 d 39.10 d 44.34 d 39.28 38.91 d 40.96 c 45.87 bc 39.24 T2 38.60 c 45.99 c 47.73 c 44.11 42.12 c 43.24 c 43.29 c 42.88 T3 47.44 b 51.76 b 50.57 b 49.92 46.31 b 48.43 b 47.04 b 47.26 T4 54.80 a 60.16 a 66.64 a 60.53 56.37 a 54.20 a 60.68 a 57.08
Mean 43.81 49.85 58.32 48.46 43.93 46.71 49.22 46.62 P-uptake, kg/fad
T1 14.64 d 16.35 c 19.42 b 16.80 15.62 c 18.44 c 21.38 bc 18.48 T2 17.69 a 19.91 a 19.92 b 19.17 23.31 a 21.24 b 20.18 c 21.57 T3 19.56 b 17.38 b 19.20 b 18.74 19.28 b 21.93 b 21.85 b 21.02 T4 21.60 a 20.17 a 22.21 a 21.33 24.79 a 25.55 a 25.58 a 25.30
Mean 18.37 18.45 20.21 19.01 20.75 21.79 22.25 21.60 K-uptake, kg/fad
T1 12.88 c 13.51 d 17.96 b 14.78 11.51 d 15.31 c 18.27 b 15.03 T2 14.77 b 14.85 c 15.03 c 14.88 20.37 b 18.09 b 17.24 bc 18.57 T3 16.66 a 16.25 b 17.75 b 16.89 16.49 c 20.25 a 16.30 c 17.68 T4 14.82 b 17.54 a 21.77 a 18.04 22.31 a 19.16 ab 22.92 a 21.80
Mean 14.78 15.54 18.13 16.15 17.67 18.20 18.93 18.27

J. Agric. Sci. Mansoura Univ., 34 (5): 5795-5808., 2009.
Table (6) Effect of N-levels and biofertilizers treatments on N, P, and K uptake by maize straw the two seasons.
Treatments 2007 2008 N1 N2 N3 Mean N1 N2 N3 Mean
N-uptake, kg/fad T1 17.21 c 26.75 c 31.88 c 25.28 18.12 c 29.23 c 29.12 d 25.49 T2 14.56 d 25.10 d 32.60 c 24.09 19.74 b 28.56 c 30.78 c 26.36 T3 18.56 b 34.24 b 39.37 b 30.64 21.07 b 34.45 b 35.20 b 30.24 T4 29.11 a 38.24 a 45.57 a 37.63 30.23 a 37.39 a 44.00 a 37.21
Mean 19.86 31.02 37.36 29.41 22.29 32.41 34.77 29.82 P-uptake, kg/fad
T1 16.32 a 12.19 d 18.96 a 15.83 10.68 d 11.37 d 13.00 c 11.68 T2 11.40 b 14.20 c 15.45 b 13.68 12.98 c 13.87 b 13.76 b 13.53 T3 10.56 c 15.69 b 13.03 c 13.09 14.24 b 12.90 c 13.20 bc 13.45 T4 16.15 a 18.76 a 15.43 b 16.78 18.36 a 19.47 a 14.56 a 17.46
Mean 13.61 15.21 15.72 14.85 14.06 14.40 13.63 14.03 K-uptake,kg/fad
T1 101.62 b 107.27 c 123.68 b 110.86 103.81 a 127.29 a 109.46 b 116.85 T2 100.92 b 106.58 c 115.79 c 107.76 138.08ab 107.46 b 109.89 b 118.48 T3 102.44 b 127.34 b 122.43 b 117.37 137.06 b 134.78 a 132.54 a 134.79 T4 128.48 a 150.95 a 142.00 a 140.48 144.13 a 134.01 a 110.99 b 129.71
Mean 108.37 123.03 125.96 119.12 130.77 128.38 115.72 124.96

J. Agric. Sci. Mansoura Univ., 34 (5): 5795-5808., 2009.
J. Agric. Sci. Mansoura Univ., 34 (5): 5795-5808., 2009.
17
Effect of different treatments on total microbial count in maize rhizosphere plants
The total microbial flora in the rhizosphere of soil treated with Azotobacter chroococcum and Bacillus megatherium increased gradually as the age of plant increased compared with non-treated soil (Table 7). Similar results were obtained by Badr El-Din and Sahab (1986) and El-Nady and Belal (2005). The total rhizosphere microorganisms were increased by inoculation with Azotobacter chroococcum and Bacillus megatherium. This can be explained on the fact that Azotobacter chroococcum and Bacillus megatherium can fix the atmospheric free nitrogen or increase availability of phosphorus in the soil, respectively and hence make the nitrogen and phosphorus in easier form for the maize plant and other microorganisms in the rhizosphere. Also, Azotobacter chroococcum produce growth promoting substances such as indole acetic acid which encourage microbial population in the rhizosphere (El-Mahrouk and Belal 2007). Grain inoculation with the used bacterial strains leads to increasing the total microbial counts and this may be due to the population of the both kind of bacteria which increased in the plant rhizosphere.
Table (7): Total microbial flora in the rhizosphere of maize plants
inoculated and non-inoculated with Azotobacter chroococcum and Bacillus megatherium during different growth periods.
Treatments Total microbial counts (cfu/gm dry soil) After 30 days After 60 days After 90 days
N1 + Az + B 1 X 10⁶ 3 X 10⁸ 6 X 10¹⁰ N1 + Az 8 X 10⁵ 3 X 10⁷ 6 X 10⁹ N1 + B 9 X 10⁴ 3 X 10⁶ 6 X 10⁸ N1 1 X 10³ 3 X 10⁴ 6 X 10⁵ N2 + Az + B 3 X 10⁵ 1 X 10⁸ 6 X 10⁹ N2 + Az 2 X 10⁵ 3 X 10⁶ 7 X 10⁷ N2 + B 5 X 10⁴ 1 X 10⁶ 9 X 10⁷ N2 1 X 10³ 3 X 10⁴ 1 X 10⁵ N3 + Az + B 5 X 10⁶ 8 X 10⁷ 6 X 10⁹ N3 + Az 2 X 10⁵ 1 X 10⁷ 2 X 10⁸ N3 + B 6 X 10⁴ 7 X 10⁵ 5 X 10⁷ N3 1 X 10³ 3 X 10⁴ 6 X 10⁵
N1 = 80 kg N/fad as urea (66%of the recommended dose) N2 = 100 kg N/fad as urea (83%of the recommended dose) N3 = 120 kg N/fad as urea (100%of the recommended dose) Az = Azotobacter chrococcum B = Bacillus megatherium
REFERENCES Ahmad, M. F., S. K., Saxena, R. R. Sharma, and S. K Singh,.(2004). Effect of
Azotobacter chroococcum on nutrient uptake in Amrapali mango under high density planting. Indian J. of Hortic., 61(4): 348.

J. Agric. Sci. Mansoura Univ., 34 (5): 5795-5808., 2009.
J. Agric. Sci. Mansoura Univ., 34 (5): 5795-5808., 2009.
18
Anjum, M. A., M. R. Sajjad, N. Akhtar, M. A. Qureshi, A. Iqbal, A. R. Jami, and Mahmud-ul-Hasan (2007). Response of cotton to plant growth promoting rizobacteria (PGPR) inoculation under different levels of nitrogen. J. Agric. Res., 45(2):135.
Badr El-din, S. M. and A. F. Sahab (1986) Biological control of Rhizoctonia solani using Trichoderma viride and its relation to symbiotic nitrogen fixation by faba bean. Egypt J. Microbiol., 21 (2):155-162.
Belal, E. B. A. (2003). Investigation on the biodegradation of polyesters by isolated mesophilic microbes. Dissertation, Technical University Braunschweig, Germany.
Belal, E.B.; N.A. Zidan; Hend A. Mahmoud; and F.I. Eissa. (2008). Bioremediation of pesticides – contaminated soils. J. Agric. Res., Kafrelsheikh Univ.., 34(3) 588 – 608.
Chandrasekar, B.R. , G. Ambrose, and N. Jayabalan (2005). Influence of biofertilizers and nitrogen source level on the growth and yield of Echinochloa frumentacea (Roxb.) Link. J. Agricultural Technology 1(2): 223.
Chen, J.-H. (2008).The combined use of chemical and organic fertilizers and/ or biofertilizer for crop growth and soil fertility ”http://www.agnet.org/library/tb/174/. printed at 6/2/2009.
Dai J., T. Becquer, J. Rouiller, H. Reversat, G. Bernhard, and F. Lavelle (2004). Influence of heavy metals on C and N mineralization and microbial biomass in Zn-, Pb-, Cu-, and Cd-contaminated soils. Applied Soil Ecology. 25: 99.
Davison, J. (1988). plant beneficial bacteria. Bio/Technology. 6:282-286. El-Mahrouk, M. E. and E. B. A. Belal.(2007). Production of Indole Acetic
Acid (bioauxin) from Azotobacter sp. isolate and effect it on Callus induction of Dieffenbachia maculata cv. Marianne. Acta Biologica Szegediensis 51(1):.53 - 59.
El-Nady, M. F. and E. B. A. Belal, (2005). Responses of Faba bean (Vicia faba L.) plants to root nodule bacteria under salinity conditions. J. Agric. Res. Tanta Univ., 31 (3) , 361 – 374.
J. Ghulam, A. Akram, M. Ali Raja, Y. Hafeez Fauzia , H. Shamsi Imran, N. Chaudhry Arshad, and Chaudhry Abid G. (2007). Enhancing crop growth, nutrients availability, economics and beneficial rhizosphere microflora through organic and biofertilizers. Annals of microbiology 57(2): 177.
Jackson M. L. (1967). “Soil Chemical Analysis”. Prentice Hall India part L td., New Delhi, India.
Lowry, O. H.; Rsebrough, N. J.; Farr, A. L. and Rundal, R. L. (1951). Protien mesuerments with the folin phenol reagent. J. Biol. Chem. 193:265
Olsen, S. R., C. V. Cole, F. S. Watanbe, and L. A. Dean (1954) Estimation of available phosphorus in soils by extraction with sodium bicarbonate." U. S. Dept. Agr. Cir. No 939.
Omar, A. Kh. and E. B. A. Belal. (2007). Effect of organic, inorganic and bio-fertilizer application on fruit yield and quality of mango trees ( Mangifera indica L. cv.“'Sukari”) in Balteem, Kafr El- Sheikh, Egypt. J. Agric. Res., Kafrelsheikh Univ., 33 (4) : 857- 872.
J. Agric. Sci. Mansoura Univ., 34 (5): 5795-5808., 2009.
J. Agric. Sci. Mansoura Univ., 34 (5): 5795-5808., 2009.
19
Parry, J. M., P. C. B. Turnbull,T. R.. Gibson (1983). A colour Atlas of Bacillus Species. Wolf Medical Books, London.
Prabhakar, K. and K. Anand Singh (2008). " Biofertilizers increase yield in field crops."http://www.thehindu.com/thehindu/seta/2004/04/29/stories /2004042900251700 .htm printed at 6/2/2009.
Wua B., S. C. Caob, Z. H. Lib Z. G. Cheunga and K. C. Wonga (2005).Effects of biofertilizer containing N-fixer, P and K solubilizers and AM fungi on maize growth. Geoderma. 125: 155.
Yasmin, S., M. A. Bakar, K. A. Malik and F. Y. Hafeez.(2007). Isolation, characterization and beneficial effects of rice associated plant growth promoting bacteria from Zanzibar soils. J. Basic Microbiol., 29(7) : 473 – 476.
Yazdani, M. M. A. Bahmanyar, H. Pirdashti, and M A. Esmaili (2009). "Effect of Phosphate Solubilization Microorganisms (PSM) and Plant Growth Promoting Rhizobacteria (PGPR) on Yield and Yield Components of Corn (Zea mays L.). International Journal of Biological and Life Sciences 1(2): 90.
Related Documents