EFFECT OF MICROWAVE HEAT-MOISTURE AND ANNEALING TREATMENTS ON BUCKWHEAT STARCH CHARACTERISTICS By Meredith Dara Zondag A Research Paper Submitted in Partial Fulfillment of the Requirements for the Master of Science Degree With a Major in Food and Nutritional Sciences Approved: 2 Semester Credits Investigation Advisor The Graduate School University of Wisconsin, Stout May, 2003

Welcome message from author
This document is posted to help you gain knowledge. Please leave a comment to let me know what you think about it! Share it to your friends and learn new things together.
Transcript
EFFECT OF MICROWAVE HEAT-MOISTURE AND ANNEALING
TREATMENTS ON BUCKWHEAT STARCH CHARACTERISTICS
By
Meredith Dara Zondag
A Research Paper
Submitted in Partial Fulfillment of the Requirements for the
Master of Science Degree With a Major in
Food and Nutritional Sciences
Approved: 2 Semester Credits
Investigation Advisor
The Graduate School University of Wisconsin, Stout
May, 2003

ii
The Graduate School
University of Wisconsin-Stout Menomonie, WI 54751
ABSTRACT
Zondag Meredith D. __________________________________________________________________ (Writer) (Last name) (First) (Middle Initial) Effect of Microwave Heat-Moisture and Annealing Treatments on Buckwheat __________________________________________________________________ Starch Characteristics __________________________________________________________________ (Title) Food and Nutritional Sciences Dr. Martin Ondrus 5/2003 73 __________________________________________________________________ (Graduate Major) (Research Advisor) (Month/Year) (No. of Pages)
American Psychological Association (APA) __________________________________________________________________
(Name of Style Manual Use in this Study)
ABSTRACT
Buckwheat is a non-glutinous pseudo-cereal that has a long and traditional
history as a food source in Asia, Europe, and the United States and has many
beneficial health aspects but has suffered from declining production within the
past years. In order to prevent further decline of buckwheat production new
products will need to be developed for the consumer market and more research
will need to be conducted to study the effect of different processing parameters on

iii
buckwheat characteristics. This study focused on the effect of microwave heat-
moisture and annealing processes on buckwheat starch that had been dried to
three moisture levels: 32.3%, 40.0%, and 44.4%. Starch samples were analyzed
using a differential scanning calorimeter, a colorimetric amylose leaching tests,
and an x-ray diffractometer. Additional moisture levels starch treatment groups,
13.2% and 26.8%, were produced for the x-ray diffraction test. Differential
scanning calorimetry (DSC) and colorimeter amylose leaching tests were
analyzed on SPSS 11.0 for Windows. DSC data indicated that moisture level had
a significant effect on onset melting temperature (p < 0.01), peak melting
temperature (p < 0.01), and enthalpy of fusion (p < 0.05). In addition, heat
treatment (p < 0.01) and interaction of moisture with heat treatment (p < 0.05)
both had a significant effect on amylose leaching results. Significant differences
within each test were found mainly at the 44.4% moisture level. X-ray diffraction
readings showed a stable d-space placement for all treatment groups. Intensity
visibly increased with decreased moisture level and with heat treatment for the
40.0% and 44.4% moisture level starches. Resistance to amylose leaching and
melting at higher temperatures for higher moisture level buckwheat starch was
attributed to increased networking among amylose and amylopectin components
in the buckwheat starch.

iv
ACKNOWLEDGEMENTS I would like to dedicate this paper to Dr. Martin Ondrus who guided me
through the long days and nights of experimentation that were required for this
project, to Dr. Mary Orfield, Dr. Richard Morrison, Dr. Mark Larchez, and Mr.
Ryan Poeschel, who introduced me to x-ray diffraction and helped run my
samples, and to my parents and God who have guided and continue to guide me
through the high and low points in my life.
v
TABLE OF CONTENTS
PAGES ABSTRACT ii ACKNOWLEDGEMENTS iv TABLE OF CONTENTS v LIST OF TABLES vii LIST OF FIGURES viii
INTRODUCTION 1 Introduction 1
Hypothesis 2 Problem Statement 3 Objectives 4 Use of Findings 5
REVIEW OF LITERATURE 6 Buckwheat: From Pseudocereal Food Source 6 To Neutraceutical The Nature of Starch 15 Microwave Technology 23
METHODOLOGY 29
Buckwheat Starch Isolation 29 Microwave Heat-Moisture and Annealing 32 Treatments of Buckwheat Starch X-ray Diffraction Evaluation of Starch Crystalline 33 Structure Differential Scanning Calorimeter Evaluation of 34 Buckwheat Starch Amylose Leaching Colorimetric Measurement 35
Statistical Analysis Procedure 37 RESULTS 39
Buckwheat Starch Percent Moisture Level Results 39 X-ray Diffraction Results 39 Differential Scanning Calorimeter Results 44 Amylose Leaching Results 50

vi
DISCUSSION 54
CONCLUSION 59 Recommendations for Further Study 60
REFERENCES 61

vii
LIST OF TABLES 1. Buckwheat Production (Acreage) Records 1997-2002 2. X-ray Diffraction Results for Heated and Unheated Buckwheat Starch at Various Moisture Levels 3. Differential Scanning Calorimeter Results 4. Amylose Leaching Results

viii
LIST OF FIGURES 1. Diagram of a Buckwheat Groat/Achene 2. Starch Structure and Amylose and Amylopectin Formations 3. X-ray Diffraction Reading for Unheated Buckwheat Starch 4. X-ray Diffraction Reading for Heated Buckwheat Starch 5. X-ray Diffraction Reading for Unheated and Heated 13.2% Moisture Level Buckwheat Starch 6. X-ray Diffraction Reading for Unheated and Heated 26.8% Moisture Level Buckwheat Starch 7. X-ray Diffraction Reading for Unheated and Heated 32.3% Moisture Level Buckwheat Starch 8. X-ray Diffraction Reading for Unheated and Heated 40.0% Moisture Level Buckwheat Starch 9. X-ray Diffraction Reading for Unheated and Heated 44.4% Moisture Level Buckwheat Starch 10. Representative DSC Scan of 32.3% Moisture Level Buckwheat Starch 11. Representative DSC Scan of 40.0% Moisture Level Buckwheat Starch 12. Representative DSC Scan of 44.4% Moisture Level Buckwheat Starch 13. Standard Amylose Leaching Curve
1
CHAPTER I
INTRODUCTION
Introduction
Buckwheat (Fagopyrum esculentum Moench) is a non-glutinous pseudo-
cereal that is consumed mainly in China, Japan, and Eastern Europe, but could be
profitable in the United States if new uses were found for buckwheat products
(Edwardson, 1996). It has a starch composition similar to cereals, but has higher
amounts of amino acids lysine, methionine, and cystine which is more typical of
legumes (Qian, Rayas-Duarte, & Grant, 1998; Zheng, Sosulski, & Tyler, 1998).
In order to learn more about processing buckwheat into consumer products, it is
important to find out how its major components such as starch react to different
processing techniques. Most processing techniques involve the use of heat and
moisture. The effects of several heat and/or moisture processing techniques, such
as boiling, baking in bread, and dry-heat, on buckwheat starch composition and
characteristics have been studied (Skrabanja, Elmståhl, Kreft, & Björck, 2001;
Skrabanja, Laerke, & Kreft, 1998). One area that has yet to be studied is the
effect of microwave annealing and heat-moisture treatments on buckwheat starch
properties.
Annealing is a heat moisture process that uses treatment of starch at
intermediate or excess moisture (40% moisture content and above) at a
temperature below the gelatinization temperature (Jacobs & Delcour, 1998). The
theory behind annealing is that it could cause changes in the molecular structures
within the starch, creating structures that are more resistant to gelatinization (Stute,

2
1992). In a study by Hoover and Vasanthan (1994b) it was found that annealing
led to greater resistance to gelatinization in that amylose leaching decreased and
gelatinization temperature increased, especially for starches high in amylose.
Since buckwheat is high in amylose content (Qian, Rayas-Duarte, & Grant, 1998)
annealing could prove useful in making the starch more resistant to gelatinization.
Heat moisture treatment is a process that uses treatment of starch at low moisture
(35% or below) at a temperature below the gelatinization temperature (Jacobs &
Delcour, 1998). The theory behind heat-moisture treatment is that it changes the
crystalline structure of the starch, creating crystalline forms more resistant to
gelatinization (Stute, 1992). In a study by Hoover and Vasanthan (1994a) it was
found that heat-moisture treatment led to an increased gelatinization temperature
and decreased amylose leaching.
Some studies have been conducted using annealing and heat moisture
treatments that lasted up to 72 and 95 hours (Hoover & Vasanthan, 1994b; Stute,
1992). Since today’s processing techniques require faster modes of treatment, a
microwave with a probe was used to process the starch. The effects of the
annealing and heat-moisture treatments were studied using a differential scanning
calorimeter, an x-ray diffractometer, and an amylose leaching colorimetric
method.
Hypothesis
The hypothesis for this study was that microwave annealing and heat-
moisture treatments would manipulate buckwheat starch granules so as to make
3
them more resistant to breaking apart under the influence of additional heat and
moisture. This hypothesis was tested using a differential scanning calorimeter
(DSC), an x-ray diffractometer, and an amylose leaching colorimetric method.
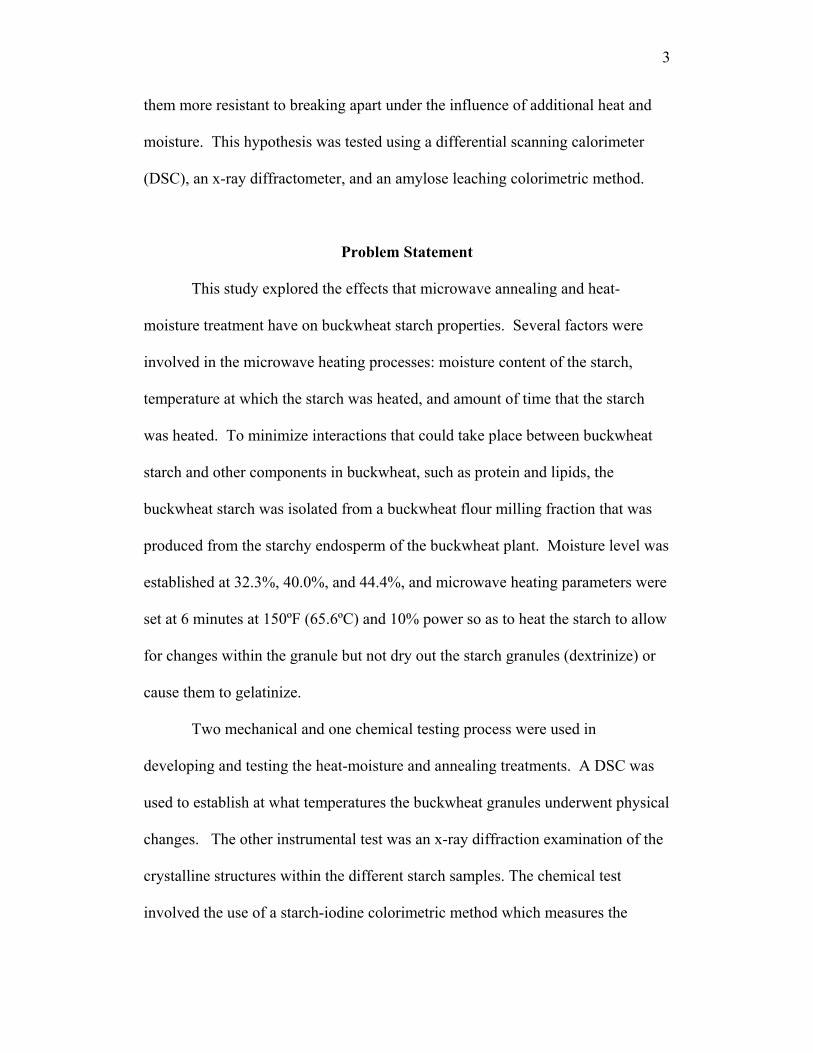
Problem Statement
This study explored the effects that microwave annealing and heat-
moisture treatment have on buckwheat starch properties. Several factors were
involved in the microwave heating processes: moisture content of the starch,
temperature at which the starch was heated, and amount of time that the starch
was heated. To minimize interactions that could take place between buckwheat
starch and other components in buckwheat, such as protein and lipids, the
buckwheat starch was isolated from a buckwheat flour milling fraction that was
produced from the starchy endosperm of the buckwheat plant. Moisture level was
established at 32.3%, 40.0%, and 44.4%, and microwave heating parameters were
set at 6 minutes at 150ºF (65.6ºC) and 10% power so as to heat the starch to allow
for changes within the granule but not dry out the starch granules (dextrinize) or
cause them to gelatinize.
Two mechanical and one chemical testing process were used in
developing and testing the heat-moisture and annealing treatments. A DSC was
used to establish at what temperatures the buckwheat granules underwent physical
changes. The other instrumental test was an x-ray diffraction examination of the
crystalline structures within the different starch samples. The chemical test
involved the use of a starch-iodine colorimetric method which measures the

4
amount of amylose that has leached out of a granule after excess heat and
moisture have been supplied.
Two-way analysis of variance was used to determine the influence that
microwave heat-moisture and annealing treatments had on starch crystalline
pattern, starch granule melting characteristics, and amylose leaching. Tests were
repeated to enhance statistical significance. Data was analyzed using an SPSS
11.0 for Windows statistical analysis program.
Objectives
1. The first objective was to isolate buckwheat starch from
buckwheat fancy flour (Minn-Dak Growers Ltd., Fargo, ND)
and dry it to different moisture contents.
2. The second objective was to determine the temperature at which
to heat the buckwheat in the microwave using a differential
scanning calorimeter.
3. The third objective was to construct and conduct heat-moisture
and annealing heating regimens in the microwave using the
resources obtained from objectives one and two.
4. The fourth objective was to study the heat-moisture treated and
annealed starch using the differential scanning calorimeter, the
X-ray diffractometer, and an amylose leaching colorimetric
method in order to determine whether starches resistant to

5
further heat and moisture were formed with annealing and heat-
moisture treatment.
Use of Findings
Annealing and heat-moisture treatment are hydrothermal (heat and water)
treatments that could have significant effects on the properties of the buckwheat
starch. Microwave technology allows for faster heating of food items, decreasing
the amount of time needed to process the food. The results of this experiment
could help to:
1. Build knowledge of buckwheat starch behavior and its
interaction with different heat/moisture processes
2. Establish new procedures for using microwave dielectric
technology for annealing and heat-moisture treatments to create
modified starches.
3. Encourage further study into the development of new products
from buckwheat starch using the findings of this study.
6
CHAPTER II
REVIEW OF LITERATURE
Buckwheat: From Pseudocereal Food Source to Neutraceutical
Buckwheat (Fagopryum esculentum) is derived from the Anglo-Saxon boc
(beech) and whoet (wheat) because it resembles the beech nut (Edwardson, 1996).
However, buckwheat is neither a nut nor a cereal like wheat, but rather a
pseudocereal whose history dates back over 1000 years. Cereals at their most
basic structure are “one-seeded” fruits containing a small embryonic germ and a
larger, starchy endosperm surrounded by an outer aleurone layer and a hull
(Hoseney, 1994). Like cereals, the seed of the buckwheat plant contains a germ,
endosperm, aleurone layer, and a hull. However, buckwheat is not a part of the
cereal or grain family (Gramineae) but rather comes from the same family as
rhubarb (Polygonaceae) (Hoseney, 1994; Saeger & Dyck, 2001). Buckwheat can
grow to be anywhere from two to five feet and produces white or pink blossoms
with five petals (Saeger & Dyck, 2001). Buckwheat can be divided into groups of
species: annual and multiennal (Li & Zhang, 2001). The buckwheat used for this
experiment is of the annual species – Fagopyrum esculentum Moench.
Although it contains the same tissue components as cereals, buckwheat
has different tissue features. Buckwheat is a dicotyledon as are peas and beans,
while grains like wheat and corn are monocots (Starr, 2000). These different
features are visible for monocots and dicots in the actual appearance of the plants
as well as the way in which they grow after germination. Dicotyledons contain
7
two cotyledons or “seed leaves” which store and absorb food for the plant during
germination and primary growth. Monocotyledons contain only a single
cotyledon. The foliage of dicotyledons contains netlike vascularization whereas
the foliage of a monocot contains parallel veining. The vascular structures of
dicotyledons are organized in a ring-like structure in the stem whereas the
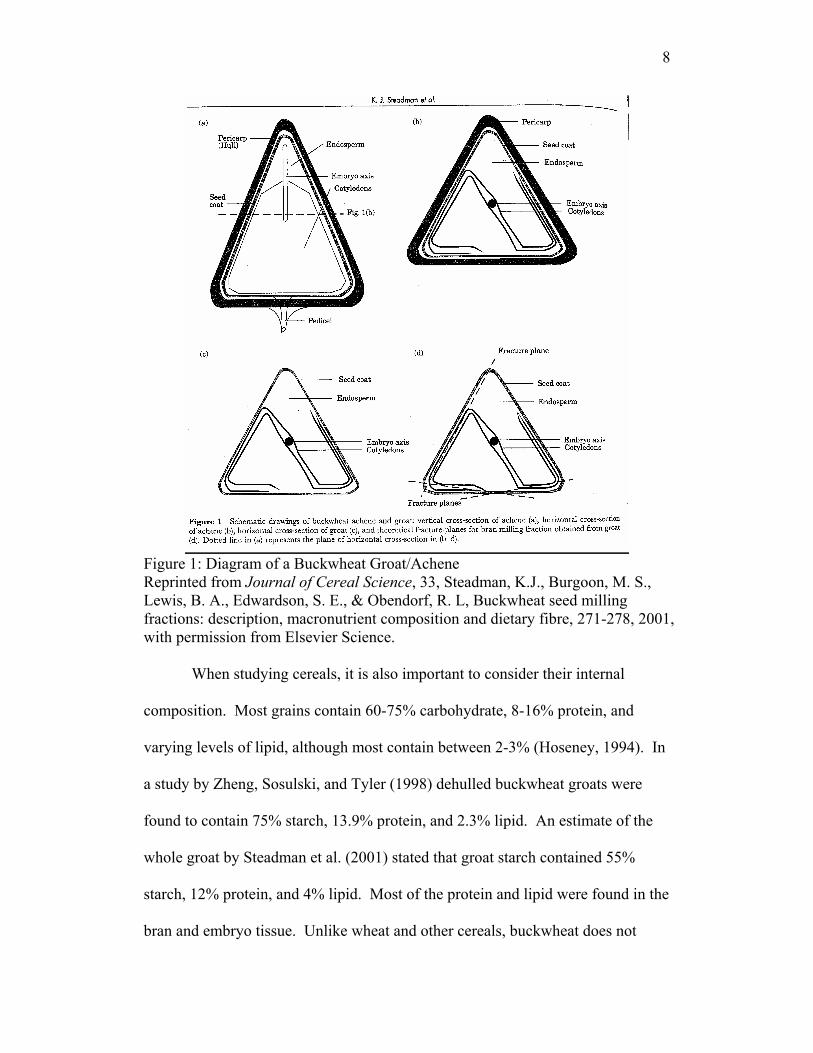
vascular structures of a monocot are dispersed in the stem. The buckwheat grain
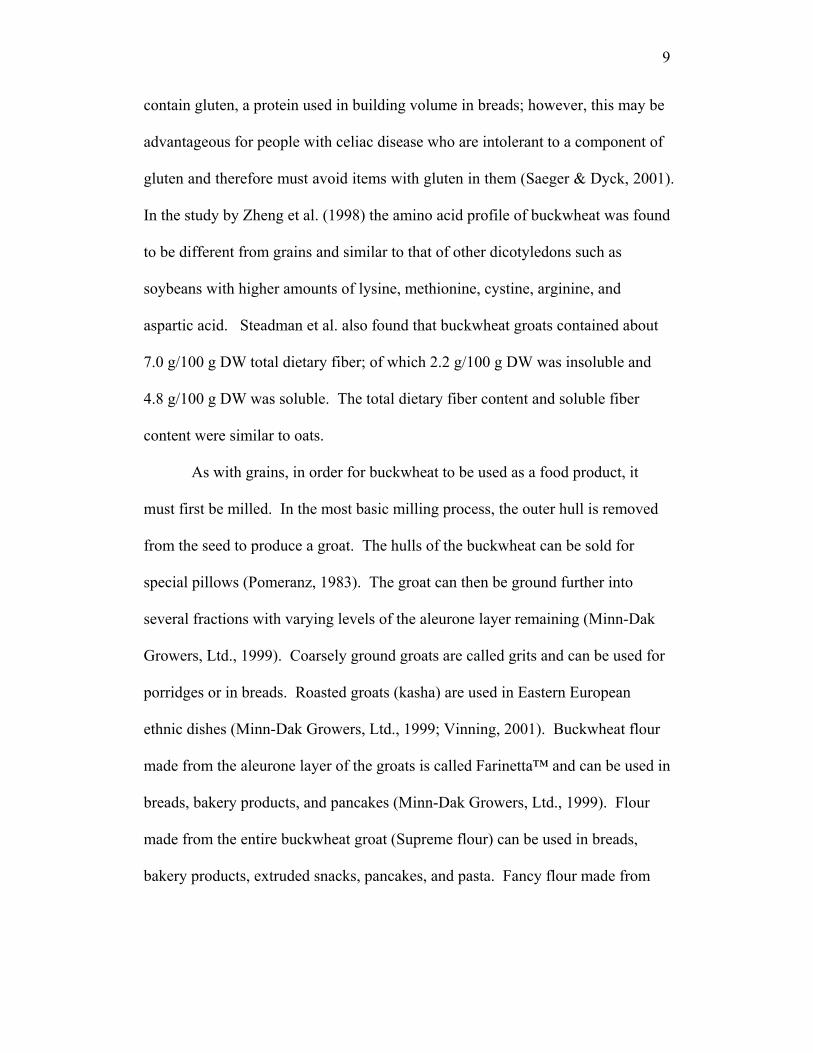
consists of a triangular seed with two cotyledons running through the endosperm
and surrounding it - see Figure 1 (Steadman, Burgoon, Lewis, Edwardson, &
Obendorf, 2001).
8
Figure 1: Diagram of a Buckwheat Groat/Achene Reprinted from Journal of Cereal Science, 33, Steadman, K.J., Burgoon, M. S., Lewis, B. A., Edwardson, S. E., & Obendorf, R. L, Buckwheat seed milling fractions: description, macronutrient composition and dietary fibre, 271-278, 2001, with permission from Elsevier Science. When studying cereals, it is also important to consider their internal
composition. Most grains contain 60-75% carbohydrate, 8-16% protein, and
varying levels of lipid, although most contain between 2-3% (Hoseney, 1994). In
a study by Zheng, Sosulski, and Tyler (1998) dehulled buckwheat groats were
found to contain 75% starch, 13.9% protein, and 2.3% lipid. An estimate of the
whole groat by Steadman et al. (2001) stated that groat starch contained 55%
starch, 12% protein, and 4% lipid. Most of the protein and lipid were found in the
bran and embryo tissue. Unlike wheat and other cereals, buckwheat does not
9
contain gluten, a protein used in building volume in breads; however, this may be
advantageous for people with celiac disease who are intolerant to a component of
gluten and therefore must avoid items with gluten in them (Saeger & Dyck, 2001).
In the study by Zheng et al. (1998) the amino acid profile of buckwheat was found
to be different from grains and similar to that of other dicotyledons such as
soybeans with higher amounts of lysine, methionine, cystine, arginine, and
aspartic acid. Steadman et al. also found that buckwheat groats contained about
7.0 g/100 g DW total dietary fiber; of which 2.2 g/100 g DW was insoluble and
4.8 g/100 g DW was soluble. The total dietary fiber content and soluble fiber
content were similar to oats.
As with grains, in order for buckwheat to be used as a food product, it
must first be milled. In the most basic milling process, the outer hull is removed
from the seed to produce a groat. The hulls of the buckwheat can be sold for
special pillows (Pomeranz, 1983). The groat can then be ground further into
several fractions with varying levels of the aleurone layer remaining (Minn-Dak
Growers, Ltd., 1999). Coarsely ground groats are called grits and can be used for
porridges or in breads. Roasted groats (kasha) are used in Eastern European
ethnic dishes (Minn-Dak Growers, Ltd., 1999; Vinning, 2001). Buckwheat flour
made from the aleurone layer of the groats is called Farinetta™ and can be used in
breads, bakery products, and pancakes (Minn-Dak Growers, Ltd., 1999). Flour
made from the entire buckwheat groat (Supreme flour) can be used in breads,
bakery products, extruded snacks, pancakes, and pasta. Fancy flour made from
10
the whiter endosperm portion contains high amounts of starch and can be used in
many starchy food products including soba noodles – a Japanese staple.
In addition to being used as a direct food source, buckwheat blossoms also
provide nectar for honey bees (Saeger & Dyck, 2001). Buckwheat is ideal in that
its blooms last up to a month later in the year than other honey-producing crops,
providing a later harvest for beekeepers. The honey from buckwheat nectar tends
to be darker and taste stronger than other honeys.
Buckwheat can also be used as a feed source for livestock and wildlife
(Saeger & Dyck, 2001). Buckwheat grains can be ground and mixed with grains
to use as feed. Inedible buckwheat hulls can be used for poultry litter.
Aside from its food potential, buckwheat crops are also useful for ground
maintenance. Due to its size buckwheat is useful as a “smother crop.” (Saeger &
Dyck, 2001). A “smother crop” is a crop used to eradicate weeds. Buckwheat is
especially potent against sowthistle, Canada thistle, quackgrass, creeping Jenny,
Russian knapweed, leafy spurge, and perennial peppergrass. Buckwheat takes
little time to grow (10-12 weeks) which makes it ideal as an emergency crop for
crops that fail. In addition to a short life cycle, buckwheat also helps to revitalize
soil by aerating the soil with its shallow and fibrous root system, by acidifying the
soil, and by adding calcium and phosphorus back to the soil if the buckwheat crop
is mulched into the soil as green manure.
Buckwheat production has experienced peaks and troughs, especially in
the western hemisphere. Buckwheat is an ancient plant whose origins lie in China
where it was believed to have been first cultivated around 900 AD (Pomeranz,
11
1983). About 500 years later it was introduced in Europe and brought over to the
Americas during the early colonial period (Saeger & Dyck, 2001). Today
buckwheat is grown in several areas throughout the world including India, Tibet,
Bhutan, China, Japan, Russia, Australia, Canada, the United States, Germany,
Poland, Slovenia, Italy, and the Ukraine with Russia being the highest producer
followed by China (Edwardson, 1996; Li & Zhang, 2001).
Despite its past history as a food, feed, and ground enhancement product,
buckwheat production has seen a decline within the United States over the last
100 years. Once grown extensively in the Northeast and North central states
where production peaked at more than 100 million acres in 1866, production
diminished to about 25,300 acres by 1997 (Saeger & Dyck, 2001; National
Agricultural Statistics Service, 1997). More recent records on buckwheat
production in the United States are hard to find aside from some individual state
records (see Table 1). Most buckwheat production now takes place in Minnesota,
Montana, New York, North Dakota, Pennsylvania, South Dakota, and
Washington, and it is usually grown under contract (Edwardson, 1996; Vinning,
2001).

12
Table 1: Buckwheat Production (Acreage) Records 1997-2002
Source/State 1997a 2002b National 25 299 46 636.5
Illinois 393 294.6 Iowa n/a 542.3
Maryland 166 1.6 Michigan 351 592.4
Minnesota 6 719 5 805.5 Montana 367 75.7
New Hampshire 3 n/a New York 2 423 1 838.7
North Dakota 5 857 29 469.6 Ohio 345 878.7
Oregon 420 379.5 Pennsylvania 1 587 1 581.7 South Dakota 3 507 1 110.6
Washington 2 557 2 882.5 West Virginia 46 13.0
Wisconsin 341 361.1 All other states n/a 809
a Obtained from National Agricultural Statistics Service, 1997 Census of Agriculture. b Obtained from Rice, Tom. Food Grains Analysis Group. EPAS/FSA. (February 6, 2003). Email Correspondence.
Several factors account for the decline of production in buckwheat in the
United States. One factor is the lack of financial support such as crop insurance
and a government supported loan program (Vinning, 2001). In a loan program
growers are assured of at least a floor price return for their crops. Another factor
is the variability in production. Edwardson (1996) in his review of current
research stated that production varies unpredictably from cultivar to cultivar and
from plant to plant. Even though the plants blossom profusely, only 10-20%
produce seed. Buckwheat plants may produce anywhere from 10 to over 200
seeds. Buckwheat seed also does not ripen evenly (Saeger & Dyck, 2001). This

13
creates a variety of yields from only 200 kg/ha to over 3,000 kg/ha (Edwardson,
1996). Research into breeding more reliable varieties has been slow in the
western hemisphere, although newer breeds from Canadian programs have shown
improvement over older varieties and Russian and Chinese production have
benefited from research efforts (Saeger & Dyck, 2001; Li & Zhang, 2001).
In addition to financial support and production problems, domestic
markets for buckwheat products have declined over the years. Although
buckwheat can still be used as a nutritional source of food for humans and
animals, as well as a nutritive crop for fields, growers have switched to more
profitable crops such as flax and canola oil (Vinning, 2001; Edwardson, 1996).
After one year of storage buckwheat is considered to be of inferior quality (Saeger
& Dyck, 2001). Products made from buckwheat tend to be darker in color and
have a more “full-bodied taste” which some consumers find disagreeable.
Livestock feed made from buckwheat does have a lower quality than that of other
feed cereals. Buckwheat may also elicit some allergic reactions in both humans
and animals if consumed in large quantities.
Despite its domestic decline as a staple food and feed source, recent
research into the neutraceutical aspects of buckwheat is providing a new
perspective for future buckwheat products. Buckwheat has been found to contain
several natural components that make it advantageous for use with diabetes and
cardiovascular disease patients. One component that buckwheat groats have been
found to contain are phytochemicals such as flavonoids which may have
antioxidant properties. Dietrych-Szostak and Oleszek (1999) found that whole
14
buckwheat contained six known flavonoids – rutin, orientin, vitexin, quercentin,
isovitexin, and isoorientin - with most being concentrated in the hull and only
rutin and isovitexin being found in dehulled buckwheat seeds. Oomah and Mazza
(1996) in their study of Canadian buckwheat found that flavonoid content varied
with cultivar and environment and that buckwheat also contained components
other than flavonoids which gave it antioxidant properties.
Another group of phytochemicals associated with buckwheat are
fagopyritols. Steadman, Burgoon, Schuster, Lewis, Edwardson, and Obendorf
(2000) defined fagopyritols as “galactosyl derivatives of D-chiro-inositol” which
have potential use for glycemic control in type II diabetics. The researchers found
that fagopyritols were located in aleurone tissue which makes up the outer
endosperm, as well as in the embryo. The highest content of fagopyritols was
found in bran milling from groats, with lesser amounts found in supreme and
fancy flour millings.
Buckwheat protein has also been found to be beneficial. In a study by
Kayashita, Shimaoka, Nakajoh, Yamazaki, and Kato (1997) rats fed whole
buckwheat protein products had lower plasma cholesterol levels than rats fed
casein. These results were attributed to higher neutral sterol excretion and lower
buckwheat digestibility compared to casein. Tomotake, Shimaoka, Kayashita,
Yokoyama, Nakajoh, and Kato (2000) also conducted a study comparing the
effect that buckwheat protein, casein, and soy protein had on gallbladder
excretions and plasma cholesterol in hamsters. They found that consumption of
15
buckwheat protein elicited higher sterol secretion, lower plasma and liver
cholesterol levels, and fewer instances of gallstones than soy protein or casein.
Increases in buckwheat usage as a food source because it not only
provides nutrition but also neutraceutical advantages may result in an increase in
its production in the western hemisphere as well as throughout the world.
However, to process buckwheat on a large scale it is important to consider the
way that its components interact with common processing factors such as heat and
moisture. Knowledge of the effect of different processing techniques on
buckwheat starch will aid in the conversion of starch into consumer products that
retain nutritional quality while providing satisfactory sensory qualities.
The Nature of Starch
Starch is a component that exists in cereals, legumes, and tubers. Starch at
its most basic configuration consists of small granules which contain two
molecules – amylose and amylopectin (Hoseney, 1994). Granules come in
several shapes including round, elliptical, polyhedral, and polygonal. The shape
depends on the plant source and the part of the plant that is being examined. The
two components of starch granules, amylose and amylopectin, are chains of
glucose, a basic sugar, bonded together. Amylose is composed of α 1 4 linkages
of glucose with minor branching. It forms random coils or semi-helical
configurations. Due to its less structured configuration, amylose molecules are
easily leached out of granules and broken down by amylase enzymes.
Amylopectin is a molecule with α 1 4 linkages and α 1 6 linkages which
16
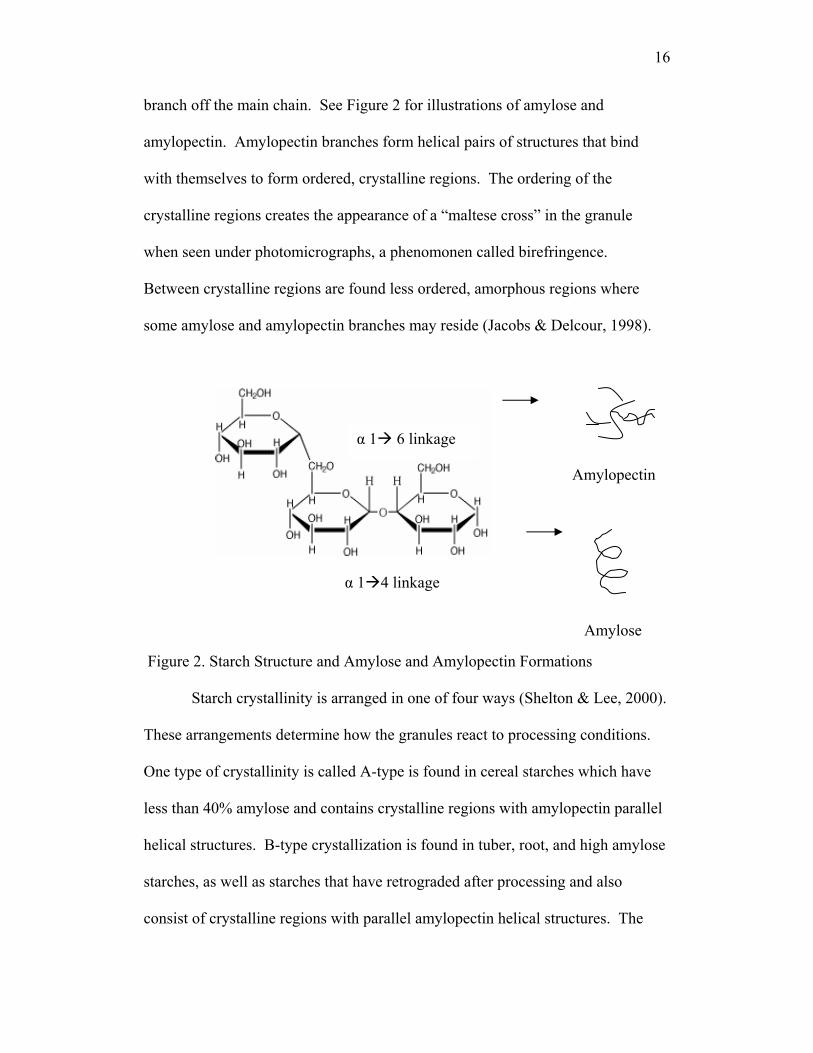
branch off the main chain. See Figure 2 for illustrations of amylose and
amylopectin. Amylopectin branches form helical pairs of structures that bind
with themselves to form ordered, crystalline regions. The ordering of the
crystalline regions creates the appearance of a “maltese cross” in the granule
when seen under photomicrographs, a phenomonen called birefringence.
Between crystalline regions are found less ordered, amorphous regions where
some amylose and amylopectin branches may reside (Jacobs & Delcour, 1998).
Figure 2. Starch Structure and Amylose and Amylopectin Formations
α 1 6 linkage
Amylopectin
α 1 4 linkage
Amylose
Starch crystallinity is arranged in one of four ways (Shelton & Lee, 2000).
These arrangements determine how the granules react to processing conditions.
One type of crystallinity is called A-type is found in cereal starches which have
less than 40% amylose and contains crystalline regions with amylopectin parallel
helical structures. B-type crystallization is found in tuber, root, and high amylose
starches, as well as starches that have retrograded after processing and also
consist of crystalline regions with parallel amylopectin helical structures. The

17
main difference between A- and B-types lies in the increased water content in B-
type starches (8 vs. 36 water molecules) (Stute, 1992). C-type crystallinity is
considered a mixture of A- and B-type crystallinity. V-type crystallinity is found
in granules containing high amounts of amylose complexed with lipids (Jacobs &
Delcour, 1998).
Crystallinity can be examined using X-ray diffraction methods. X-ray
diffraction involves the use of x-ray technology (Pomeranz and Meloan, 2000).
X-rays are produced when an anode target is subjected to 5,000-10,000 volts. The
resulting X-rays are applied to a sample. If the sample contains a crystalline
structure, such as starch, the X-rays may be diffracted. The defracted X-rays are
measured on a detector and the spacing between the different diffractions used to
characterize the crystalline structures. The X-rays are read as a series of peaks
relating to relative intensity over diffraction angles. Peak intensity relates to
amount of crystalline region in the granule (Cullity, 1978; Stute, 1992). Several
studies have been conducted using X-ray diffraction to characterize the crystalline
structures of starch (Hoover & Vasanthan, 1994a; Hoover & Vasanthan, 1994b;
Stute, 1992). Stute (1992) found that heat-moisture treatment of potato starch
granules resulted in a shift from B-type to A-type and C-type crystalline structures.
Hoover and Vasanthan (1994a) found that heat-moisture treatment also resulted in
a B-type to an A-type and B-type mixture shift for non-cereal starches, while
cereal starch X-ray patterns remained unchanged except for an increase in
diffraction intensities. In another study, Hoover and Vasanthan (1994b) also
found that annealing different starches did not cause changes in X-ray patterns but
18
did cause an increase in X-ray intensities for some starches, particularly cereals
and higher amylose content legume starches.
A study by Qian, Rayas-Duarte, and Grant (1998) examined the
composition of buckwheat starch and compared it to corn and wheat starch. The
researchers found that buckwheat starch was round and polygonal with some
holes and pits on the surface, and was 1.6 to 2.4 times smaller than wheat or corn.
They also found that buckwheat starch contained a higher amount of apparent
amylose (46.6%) compared to corn (28.5%) and wheat (27.5%). Zheng, Sosulski,
and Tyler (1998) also examined the buckwheat starch and compared it to rice and
corn starch. The researchers found buckwheat to have A-type crystalline behavior
like rice and corn, but with a higher degree of crystallinity than either cereal.
When starch granules are subjected to a certain amount of heat and water,
they undergo a change called gelatinization (Hoseney, 1994). During
gelatinization, amylose escapes from the starch granule and binds with water
molecules forming a gel. The amylopectin regions also solubilize and lose their
ordered effect, thus losing birefringence. The process begins when energy in the
form of heat is supplied to the starch molecules, giving them energy to become
more mobile (Fennema, 1996). The molecules most affected by this initial energy
are those in the amorphous region. When the molecules reach the glass transition
temperature (Tg) they become less rigid or “glass-like” and become more like
rubber. As more energy is supplied the molecules gain even more movement
until they reach the melting temperature (Tm) where the molecules become “fluid-
like” and leach out of the granules. Depending on the amount and distribution of
19
water, starch granules will tend to break apart in stages (Donovan, 1979). In the
discussion of his experimentation on starch-water systems, Donovan explained
that in intermediate and excess water systems (moisture greater than 45%), water
interacts with amylose molecules in some parts of the amorphous regions, causing
the granules to swell and surface crystal structures to be stripped off the granules
in regions with high swelling at lower temperatures. As moisture content
decreased and water was more evenly distributed, the result was lower overall
swelling and higher energy needed to break the crystals apart.
Transitions in starch crystallinity brought on by the addition of heat can be
studied through thermal analysis on a differential scanning calorimeter (DSC)
(Schenz & Davis, 1998). The breaking of the starch crystal is considered an
endothermic reaction since energy is absorbed to break the bonds between the
molecules. This change in heat can be detected by comparing the heat absorbed
by a starch sample to that of a blank reference. A differential scanning
calorimeter consists of a two separate heating units on which are placed sample
pans containing a reference (usually water, buffer, or an empty pan) and an
experimental sample. Each unit also contains a sensor which is used to ensure a
controlled rate of heat application and to record how much energy it would take to
keep both reference and experimental sample at the same temperature. These
readings translate into endothermic peaks which show at what temperatures starch
crystalline regions break apart, when they are at their peak, when the process ends,
and how much energy it took to cause this transition. Sample amounts are small,
usually 6 to 12 milligrams. Aluminum, hermetically sealed pans are used to
20
prevent error due to evaporation of water from the samples. DSC’s can be
programmed to heat the samples from 1 to 10 degrees per minute. Both heating
rate and sample size have a direct effect on the length of the crystalline transition
period. Keeping both of these items constant would help to reduce variability in
DSC readings
According to a study by Qian, Rayas-Duarte, and Grant (1998) buckwheat
starch’s primary gelatinization peak was at 68.4ºC, between wheat starch (61.2ºC)
and corn starch (69.9ºC). Buckwheat starch was found to have a higher water
binding capacity compared to the other starches, but a lower degree of swelling,
lower amylose leaching, retrogradation, and syneresis. The higher water binding
capacity was attributed to the smaller granule size. The lower degree of swelling,
retrogradation, and syneresis were attributed to amylose-lipid complexes within
the starch and strong micellar networks inside the granules.
Two other studies which examined buckwheat starch found similar
gelatinization temperatures for buckwheat starch, one which also examined water
binding characteristics found them to be similar to those stated in Qian et al.
(1998), but observed higher syneresis rates (Li, Lin, & Corke, 1997; Zheng,
Sosulski, & Tyler, 1998).
Another method to test the resistance of starch to gelatinization is to
conduct an amylose leaching test. A colorimetric test involving the use of iodine
and an ultraviolet-visible spectrophotometer was developed by Chrastil (1987).
Chrastil found that by heating a starch and water mixture in a 95ºC water bath for
thirty minutes, then adding an iodine-potassium iodide solution to the mixture, a
21
colorimetric reaction would occur that could be used to detect how susceptible the
starch was to amylose leaching. Iodine is able to complex with the amylose on
the inside of the helical structure which causes a blue color to form. The starch is
defatted in order to prevent complexation of the iodine solution with lipid chains
which would result is an inaccurately high reading.
Ultraviolet – visible spectrophotometry was used to read and quantify
colorimetric reactions through comparison of transmission/absorption of light
through sample holders (Penner, 1998). The machine used in this experiment was
a double-beam spectrophotometer. Using narrow window slits, concave mirrors
which split visible light into different wavelengths, and gratings which diffract
different wavelengths at different angles, a specific wavelength of light may be
chosen to shine through the sample. In this experiment a wavelength of 620 nm
was chosen because it is the λmax for the starch-iodine complex. In a double-
beam spectrophotometer an additional rotating mirror is used along with a sample
holder containing a blank sample (distilled water) (Harris, 2003). The rotating
mirror constantly switches between the two samples so that the light that is
absorbed in the sample can be constantly compared to the light that is absorbed in
the blank sample. Absorbance of light is measured as the logarithm of the light
entering the sample to that exiting the sample. In order to determine the amount
of amylose that leached out of the granules a calibration curve was found by
preparing and reading samples containing 0-100% amylose that had been mixed
with amylopectin (Chrastil, 1987). Amylopectin does not react with iodine.
22
Several studies have used amylose leaching to determine the stability of
starches that have been heat and moisture treated. In two studies Hoover and
Vasanthan (1994a; 1994b) used a modified method of Chrastil (1987) to
determine the extent of amylose leaching of cereal, legume, and tuber starches
which had been heat-moisture treated and annealed. They found that annealing
starches caused a marked decrease in amylose leaching, particularly in starches
with high amounts of amylose such as lentils and oats. They also found that heat-
moisture treatment caused a marked decrease in amylose leaching but more so in
tuber and legume starches than cereal starches.
Other components of a cereal/legume/tuber also interact with starch,
affecting the susceptibility of the granule to gelatinization. These interactions are
visible on DSC endotherms (readings). In a study by Szczodrak and Pomeranz
(1992) starch-lipid interaction in high-amylose (43-49%) barley caused an
increase in initial DSC readings from 58-85ºC to 89-110ºC. Complexation of
amylose starch with lipids was also found to prevent amylose-amylose interaction.
Liu, Arntfield, Holley, and Aime (1997) found similar findings with pea starch.
Lipids are able to complex with amylose by hiding within the helical complexes
formed by amylose.
Starch granules are also known to interact with proteins. In a study by
Eliasson and Tjerneld (1990) wheat proteins were found to adsorb unto wheat
starch granules, potato starch, and maize starch. Adsorption increased with
initial increased starch temperature due possibly to formation of starch gels or
changes in the nature of the granule surface. Fardet, Abecassis, Hoebler, Baldwin,

23
Buléon, Bérot, and Barry (1999) in their study of protein and starch interactions in
pasta products found that starch became entrapped in protein “networks” which
rendered them less accessible to water.
Fornal, Smietana, Soral-Smietana, Fornal, and Szpendowski (1985) in
their research of buckwheat starch granule interaction with proteins and lipids in
an extrusion process with milk proteins found that the protein and lipids did
interact with the starch. Addition of milk protein and extrusion temperature
increased the degree of gelatinization and decreased the swelling power of the
starch granule. Starch-lipid formations did take place but were greatest at lower
extrusion temperatures (100ºC).
In order to fully understand a starch, it is important to study its interaction
with common processing factors such as heat and moisture. Heat and moisture
treatments can have effects on characteristics that relate to digestion and stability
under adverse storage conditions. It is also important to look at the manner in
which heat and moisture treatments are elicited as more efficient processes, such
as microwave technology, are being used to process foods in less time than
conventional oven heating methods.
Microwave Technology
Unlike ovens which rely on conduction (transfer of energy from metal or
food molecule to food molecule) and convection methods (transfer of energy from
liquid or air to food molecule) to heat food, microwaves heat food using dielectric
energy (Fellows, 2000). Dielectric energy affects food components that contain
24
positive and negative poles (dipoles), particularly water, and a common
component of food. Microwaves are able to create an environment where a
moving electrical field is created, which causes the dipolar molecules to
continually turn back and forth, creating frictional heat. Heating depends on
distribution of water and other dipolar molecules such as salt. Unlike with
conduction and convection methods the surface of the food is less warm than
within the food due to evaporative loss of water. The temperature just below the
surface, however, is much warmer and from there heat is conducted to the center
of the food (Buffler, 1992).
Microwave ovens use a magnetron which produces electrons that are sent
through a waveguide and scattered in the heating chamber where they contact
food items (Fellows, 2000). Magnetrons provide bursts of energy at variable
powers (load) for variable lengths of time (time base) and create fields that move
from top to bottom, side to side, and front to back in the heating compartment
(Buffler, 1992). To prevent microwaves from concentrating in only a few areas of
the food, creating hot or cold spots, most microwave systems are equipped with
stirrers or turntables to produce an even exposure of the food item to the
microwaves. Sensors are also used, though they may be inaccurate up to ±8ºF
(3ºC). Microwaves are best used for thawing, tempering, dehydrating, and baking,
but not blanching or pasteurization (Fellows, 2000).
Microwave ovens, like any other heating equipment, work on the concept
of power, “rate at which work is done” or, in other words, “the rate at which
energy is expended or utilized” (Buffler, 1992). Many factors may affect the

25
power supplied to the food including the load and time base. These factors are
influenced by the temperature and the power level at which the microwave is set.
The shape of the food may also have an effect on the power supplied to it as items
that are flat or square experience more corner heating than oval or circular foods.
Individual food dielectric constants also play a part in the amount of power
absorbed by the food (Miller, Gordon, & Davis, 1991). Dielectric constants look
at the interaction between the material being heated and the microwave energy
(K'), as well as its ability to dissipate energy as heat (K''). These constants are
affected by the charge of the components of the food, the environment in which it
is in, and the presence of water in the food.
Several researchers have investigated the effect of microwave energy on
starch properties. Khan, Johnson, and Robinson (1979) studied the effect of water
content and heating time in a microwave oven on the degradation of wheat starch
flour. They found that water had a direct relationship with sugar production in
that sugar production increased with increased starch hydration. Heating time
also had a direct effect up to a point with total soluble sugar increasing except at
high water and heating time where total soluble sugar was reduced due to sugar
destruction. Glucose concentrations also increased with increased amounts of
water and heating time. Sumnu, Ndife, & Bayindirli (1999) studied the effect of
water, sugar, and protein on starch gelatinization in wheat starch that was
microwaved. They found that wheat starch gelatinized even before applying heat
at a 2:1 (w/w, water:starch) concentration. Of the three components, sugar had
26
the most significant effect on starch gelatinization and significantly interacted
with protein and water to prohibit gelatinization.
Zylema, Grider, Gordon, and Davis (1985) compared the effect of
microwave dielectric heating and conduction/convection heating in an oil bath on
heating rate (up to 65ºC and 85ºC), microstructure, and swelling of wheat starch
systems with 1:2 to 1:8 starch-to-water ratios. They found that heating time did
not vary between the two types of heating but microwave heating did result in
more uniform gelatinization at both the 65ºC and 85ºC temperatures in 1:2, 1:4,
and 1:8 starch systems. In microwave 1:1 and oil bath 1:1-1:4 systems chalky
regions were formed where the granules were not as swollen as in the gelled
regions. In microwave 1:4 and 1:8 and oil bath 1:8 starch systems watery regions
also formed in which granules swelled similar to those found in the gelled regions.
Water concentration was found to play a great role in helping to distribute heat
transfer by increasing microwave coupling with the starch and helping to conduct
heat throughout the starch.
The effect of convection and microwave heat methods on wheat granule
swelling was also studied by Goebel, Grider, Davis, & Gordon (1984). Varying
levels of water:starch concentrations from 1:1 (w/w) starch:water to 5:95 were
heated to 75ºC using the 177ºF convection and low/medium microwave mode of a
convection/microwave oven. The researchers found that heating in both
applications was uneven, forming distinct regions that were described as gel,
chalky, watery gel, chalky gel, soft gel, paste, watery paste, and chalky paste.
Studying the different regions under a scanning electron microscope and

27
light/polarized light microscope the researchers found that with increased water
ratios there was higher swelling, and, looking at both convection and microwave
modes, starch from chalky regions of samples heated using the convection mode
had higher starch swelling than those heated using the microwave mode. Except
for the 1:4 water: starch ratio level, little difference was noted between samples
heated at low and medium microwave mode. Differences between convection
and microwave mode heated samples decreased as water:starch ratio increased.
The researchers stated that the advanced swelling in higher water:starch ratio
samples was probably due to the longer heating period that these samples had as
noted by the longer periods of time it took higher water:starch ratio samples to
heat to 75ºC.
Yiu, Weisz, and Wood (1991) compared microwave heating of regular
and quick-cooking oats to that of conventional boiled oats. Both samples were
hydrated to a 1:8 starch-to-water ratio and were kept at temperatures between 90-
95ºC for 1 minute and 20 minutes. The researchers found, when studying the
starch samples from the different cooking techniques that oat starch granules
remained intact even after 20 minutes heating while those of boiled oatmeal
fragmented. However, this was attributed to the boiled oatmeal being stirred
more.
Although microwave technology usage with heat and moisture treatment
of some types of starch had been explored, the effect of microwave heat/moisture
treatment had yet to be studied with buckwheat starch. Buckwheat starch with its

28
high amylose content was an excellent candidate for starch manipulation using
microwave heat moisture and annealing processes.
29
CHAPTER III
METHODOLOGY
Buckwheat Starch Isolation
In order to obtain an accurate evaluation of the effect that microwave heat
moisture treatment and annealing treatment had on buckwheat starch, the starch
first had to be isolated from the buckwheat fancy flour. According to Minn-Dak
Growers, Ltd. (1999), the fancy flour milling fraction used in this experiment
contained 72.0% carbohydrate, 9.3% protein, 1.9% fat, 2.2% fiber, and 1.2% ash.
The non-starch components were removed to avoid interactions between the
starch and other components (lipid, protein) such as were recorded in experiments
described in the literature review.
The first step in starch isolation involved the defatting of the flour. This
was performed using petroleum ether. A total of 800 grams of buckwheat fancy
flour (Minn-Dak Growers, Ltd., Fargo, ND) was mixed with 4 liters (1:5 w/v) of
petroleum ether (ACROS Organic, Fischer Scientific, Chicago, IL). Petroleum
ether is one of several chemicals that can be used for fat extraction. It is
especially effective with extracting hydrophobic lipids and is safer and less
expensive than other fat extractors such as ethyl ether (Min & Steenson, 1998).
Due to the large amount of flour that was defatted, the flour was divided into four
1,500-mL Pyrex beakers each filled with 200 grams of flour and 1,000 mL of
petroleum ether. In order to continually disperse the flour in the petroleum ether
each beaker contained a large stir bar and was placed on an electronic stirrer
(Corning Hot Plate Stirrers PC-351, PC-320, Pelco International, Redding, CA)
30
set from medium to high speed for the two-hour duration. This was done to
prevent the buckwheat flour from settling and thereby preventing the petroleum
ether from contacting and extracting the lipid from the flour. After two hours of
stirring, each beaker was filtered using several large plastic filters fitted with
Whatman® 24.0 cm filter paper placed over 1,000 or 1,500 mL Pyrex beakers.
Liquid was poured off first until little remained except the flour which was dried
in Pyrex evaporation dishes number 3180 overnight under the chemical hood.
Evaporation dishes were weighed previous to use in order to help quantify the
amount of defatted flour obtained from the defatting process.
The protein was removed using a centrifugation technique similar to Qian,
Rayas-Duarte, & Grant (1998). Due to the limited amount of the sample that
could be centrifuged at one time the starch isolation was performed in several
batches. Defatted buckwheat flour (~ 30 g) was steeped in 0.2% NaOH (1:6 w/v)
in 250-mL Erlenmeyer flasks and placed in a 45ºC water bath (VWR Scientific
Product, Chicago, IL) for 90 minutes. Each flask was stirred with a glass stirring
rod in order to suspend the starch in the NaOH prior to placing it in the water bath.
The flour/NaOH mixture was then blended in an Osterizer blender (Milwaukee,
WI) for 2 minutes and sieved through US no 70 (0.208 mm, 65 inch) mesh to
remove larger particles. The flour mixture was weighed into counterbalancing
centrifuge bottles and run at 3,000 rpm (~1464 x g) for 15 minutes on a Dupont
Sorvall® RC 285 with GSA rotor (Kendro Laboratory Products, Newtown, CT) at
25-35ºC. The supernatant was discarded and the top brown-yellow protein layer
removed with a metal spatula and water from a distilled water bottle. The white
31
starch layer was resuspended in distilled water, centrifuged, decanted, and cleaned
of the top brown-yellow protein layer. This was repeated until there was no
longer any visible protein present (usually two to three times). The starch was
then resuspended in distilled water and adjusted to within a pH range of 6.5-7.0
using 1 M HCl and a calibrated Sargent-Welch pH 6050 meter (Skokie, IL). The
starch was then washed two to three times with distilled water and dried at
ambient temperature under a fume hood for specified lengths of time. Each time
the protein isolation was performed, one-third of the starch was immediately
placed in a Qorpak container (VWR International, West Chester, PA), capped,
and sealed with parafilm wax (American Can Company, Greenwich, CT) and
refrigerated at 4ºC. A second-third was capped and refrigerated after 12 hours
drying at ambient temperature under a fume hood. The last portion was capped
and refrigerated after 24 hours drying at ambient temperature under a fume hood.
At the end of the starch isolation process, the starch moisture samples from the
different isolation batches were combined using a KitchenAid food processor
(model #KFPM65OWH, St. Joseph, MI).
Percent moisture content of the different samples was determined by a
two-hour drying method. Five two-gram samples from each type of moisture
were weighed into recorded and tared aluminum weigh boats and placed in a
105ºC mechanical oven (Lindberg Blue M, M014505A-1, Ashville, NC) for two
hours. The boats were cooled in a Pyrex dessicator and then weighed again.
Percent moisture was determined for starch samples using the following
calculation.

32
Weight of original sample (g) – Weight of sample post drying (g) x 100
Weight of original sample
Microwave Heat-Moisture and Annealing Treatments of Buckwheat Starch
Preliminary tests were run to determine the gelatinization temperature
(using the differential scanning calorimeter) and amount of time to appropriately
microwave the isolated buckwheat starch. Since the purpose of heat-moisture
treatment and annealing treatment is to heat the starch below the gelatinization
temperature with less than 35% and at least 40% moisture content respectively,
the microwave temperature had to be such to allow for changes to occur within
the starch granule without allowing the starch granule to break and amylose to
leach out.
Microwave tests were performed in triplicate in a 900 Watt (IEC 705-1988
method) SHARP Carousel II Convection Microwave Oven (R-9H83, Mahwah,
NJ). Approximately 10 grams of each sample was placed in 50-mL centrifuge
tubes placed in 50-mL Pyrex containers (for stability) and microwaved at 10%
power at 65.6ºC (150ºF) for six minutes. The temperature for heat treating the
starch was determined per literature research (Qian, Rayas-Duarte, & Grant, 1998)
and preliminary testing. A temperature probe attachment was placed in the center
of the sample with no parts of the probe touching the sides of the container. The
probe was used to monitor the internal temperature of the sample and ensure that
it did not increase over the desired temperature while heating. Once the sample
reached the desired internal temperature it was held for the specified length of
33
time. After the microwaving was completed, samples were immediately capped,
wrapped with parafilm wax to prevent moisture loss or gain, and placed in a 25ºC
water bath to prevent further heating. Once cooled, granules were separated by
applying a mortar and pestle to the contents of the centrifuge tubes. Visible
gelatinized starch granules were removed.
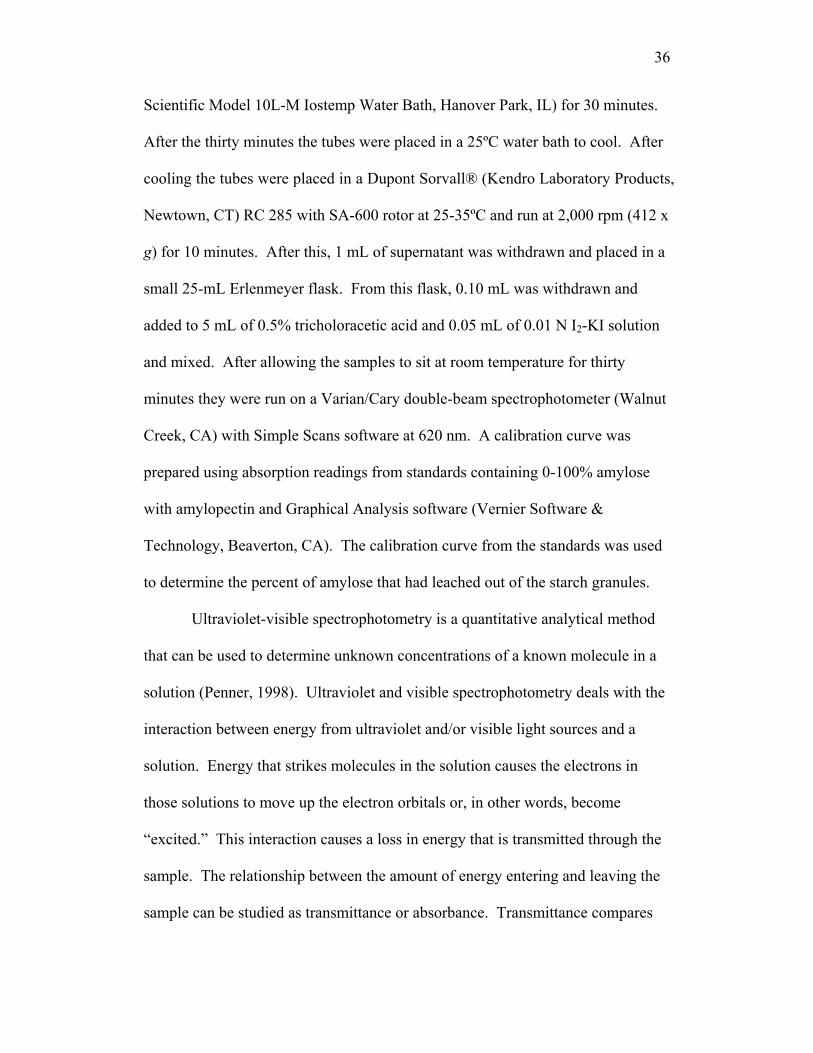
X-ray Diffraction Evaluation of Starch Crystalline Structure
X-ray diffraction is a method used to characterize the crystalline structure
of a material (Pomeranz and Meloan, 2000). X-rays consist of high energy waves
created when a high concentration of electrons hits a heavy target, causing the
electrons to penetrate the atoms of the target and give off high energy waves.
These waves then penetrate a sample such as a starch granule where they are
diffracted by crystalline layers. The spacing of the crystalline layers may be
examined by the distance (d) between the wavelengths that are diffracted. The
intensity of the d-spacing peaks relates to the concentration of the crystalline
phase within the starch granule (Cullity, 1978).
X-ray diffraction was performed on a Scintag PAD-X Advanced
Diffraction System X1 (Thermo ARL, Waltham, MA). A small amount of
buckwheat starch powder was placed in a plastic x-ray sample holder and
flattened with a piece of glass in order to entirely fill the holder and to make the
sample level with the edges of the holder to reduce scanning errors. The
buckwheat was scanned through the 2θ range of 0-40º using MDI Data Scan 3.2
software (Livermore, CA). The angles used were similar to those described in
34
Hoover and Vasanthan (1994a) and are typical for x-ray diffraction starch
analyses. D-spacing and intensities were examined for the samples using MDI
Jade 6.5 software (Livermore, CA) which contained a manual cursor function that
gave d-spacing and intensity data at selected points.
For this procedure a starch sample with 13.247 ± 0.041% moisture and a
sample with 26.809 ± 0.331% moisture were created in order to have a more
complete view of the effect of moisture level and heat treatment on x-ray
diffraction analyses of buckwheat starch. Preparations were similar to previous
air temperature drying with 30 grams of buckwheat starch from the lowest and
highest moisture level starches placed in evaporation dishes at ambient
temperature for approximately 24 hours. New moisture levels were determined as
previously described.
Differential Scanning Calorimeter Evaluation of Buckwheat Starch
During each test session, three samples of the heated buckwheat starch at
the three moisture levels and one sample of the unheated starch at the three
moisture levels were run through a differential scanning calorimeter (model Q10-
0088, TA Instruments, New Castle, DE) that had TA-Instruments Q-Series and
TA Instruments Universal Analysis 2000 programs. The DSC was set to 25
mL/min N2 flow and programmed to heat and record from 40-200 ºC with a ramp
of 10ºC per minute. Between 7.5-8.0 mg samples were weighed into hermetic
aluminum pans and sealed with a TA Instruments Blue Sample Press. An empty,

35
hermetically sealed aluminum pan was used for a reference because no additional
water was added to the samples.
DSC was used to observe and measure the temperature ranges at which the
starch underwent melting as well as the amount of energy (enthalpy, J/g) required
in the melting process. Onset temperature (To) was determined by extrapolation.
This is the preferred measurement by some researchers and corrects for
interpretation of primary deviation from the baseline, although it was difficult to
determine the baseline on some readings (Schenz & Davis, 1998). The peak
temperature (Tp) was determined as the temperature at which the DSC reading
had reached maximum endothermic transition. Enthalpy of fusion was
determined by the software as the area of the transition peak from selected onset
temperature to conclusion temperature of transition. The mean of the onset of the
melting transition, the peak, and the enthalpy of fusion were calculated for each
treatment group. The DSC was used to determine the effect that moisture level
and heat treatment had on starch melting characteristics.
Amylose Leaching Colorimetric Measurement
Amylose leaching was carried out in a similar manner to a procedure
described by Hoover and Vasanthan (1994b). The method was a modified
version of the procedure described by Chrastil (1987). Approximately 20 mg of
heat and moisture treated starch was placed in centrifuge test tubes. Then 6 mL of
water was added and the tubes weighed for centrifuge counterweighing purposes.
The tubes were placed with caps slightly ajar in a 95ºC water bath (Fisher
36
Scientific Model 10L-M Iostemp Water Bath, Hanover Park, IL) for 30 minutes.
After the thirty minutes the tubes were placed in a 25ºC water bath to cool. After
cooling the tubes were placed in a Dupont Sorvall® (Kendro Laboratory Products,
Newtown, CT) RC 285 with SA-600 rotor at 25-35ºC and run at 2,000 rpm (412 x
g) for 10 minutes. After this, 1 mL of supernatant was withdrawn and placed in a
small 25-mL Erlenmeyer flask. From this flask, 0.10 mL was withdrawn and
added to 5 mL of 0.5% tricholoracetic acid and 0.05 mL of 0.01 N I2-KI solution
and mixed. After allowing the samples to sit at room temperature for thirty
minutes they were run on a Varian/Cary double-beam spectrophotometer (Walnut
Creek, CA) with Simple Scans software at 620 nm. A calibration curve was
prepared using absorption readings from standards containing 0-100% amylose
with amylopectin and Graphical Analysis software (Vernier Software &
Technology, Beaverton, CA). The calibration curve from the standards was used
to determine the percent of amylose that had leached out of the starch granules.
Ultraviolet-visible spectrophotometry is a quantitative analytical method
that can be used to determine unknown concentrations of a known molecule in a
solution (Penner, 1998). Ultraviolet and visible spectrophotometry deals with the
interaction between energy from ultraviolet and/or visible light sources and a
solution. Energy that strikes molecules in the solution causes the electrons in
those solutions to move up the electron orbitals or, in other words, become
“excited.” This interaction causes a loss in energy that is transmitted through the
sample. The relationship between the amount of energy entering and leaving the
sample can be studied as transmittance or absorbance. Transmittance compares

37
the light entering and exiting the sample. Absorbance is the negative log of
transmittance and measures the amount of energy that remains in the sample. In
double-beam spectrophotometry two samples are read alternatively, a reference
sample containing distilled water and the sample solution being studied (Harris,
2003). This method corrects for errors due to light beam intensity and detector
response.
Statistical Analysis Procedure
Experiments for differential scanning calorimeter and amylose leaching
testing were performed three times (test sessions) with three samples from each of
the three heat treatment groups for a total of nine samples overall. Control
samples of buckwheat starch from each of the moisture levels were also tested for
comparison. For the differential scanning calorimeter only one control sample
from each moisture level was taken each time a test session was conducted as
previous scans had been made repeatedly on the unheated starch samples. This
resulted in having less control samples for the 40.0% moisture level starch since
fewer previous scans had been taken of this starch. For the x-ray diffraction
procedure heated and unheated samples with different percent moisture levels
were examined. Some treatment groups were examined several times, while most
were examined once.
In order to determine the effect of heat and moisture treatment on amylose
leaching and the melting temperature parameters of the starch the results were
analyzed using two-way analysis of variance (ANOVA) set at an alpha level of

38
0.05 on SPSS 11.0 for Windows (SPSS Inc., Chicago, IL). Independent sample t-
tests and least significant difference (LSD) was also used to differentiate samples.
39
CHAPTER IV
RESULTS
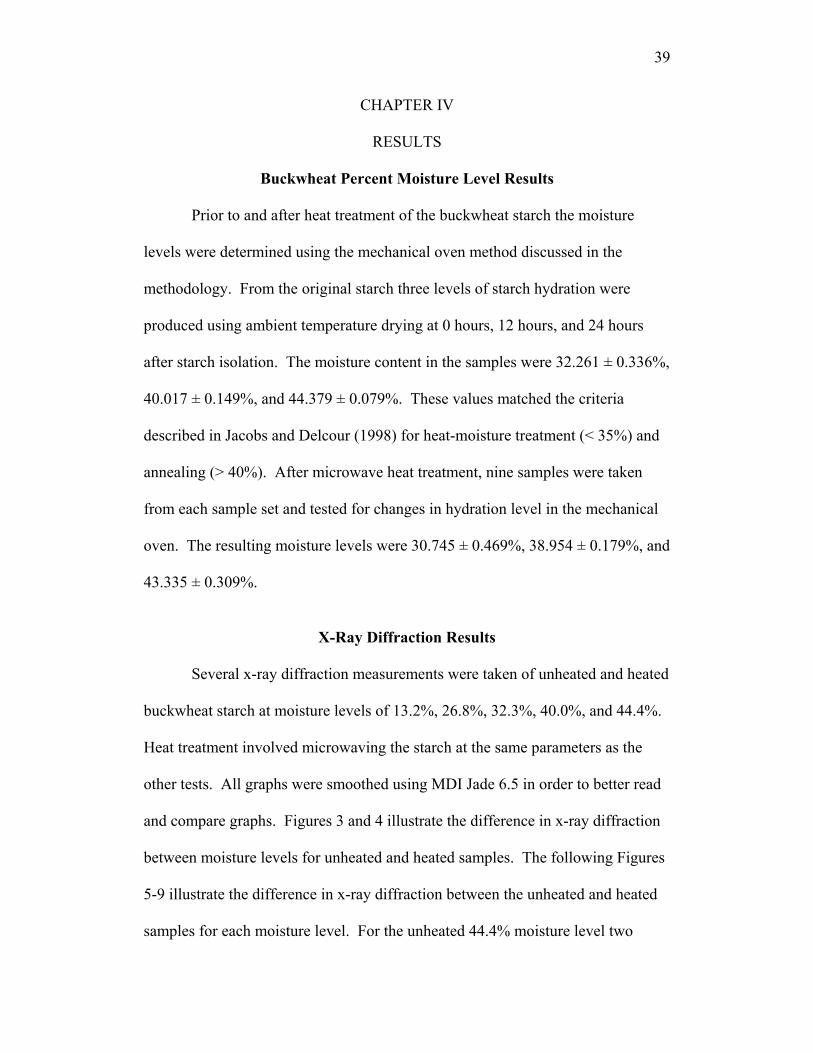
Buckwheat Percent Moisture Level Results Prior to and after heat treatment of the buckwheat starch the moisture
levels were determined using the mechanical oven method discussed in the
methodology. From the original starch three levels of starch hydration were
produced using ambient temperature drying at 0 hours, 12 hours, and 24 hours
after starch isolation. The moisture content in the samples were 32.261 ± 0.336%,
40.017 ± 0.149%, and 44.379 ± 0.079%. These values matched the criteria
described in Jacobs and Delcour (1998) for heat-moisture treatment (< 35%) and
annealing (> 40%). After microwave heat treatment, nine samples were taken
from each sample set and tested for changes in hydration level in the mechanical
oven. The resulting moisture levels were 30.745 ± 0.469%, 38.954 ± 0.179%, and
43.335 ± 0.309%.
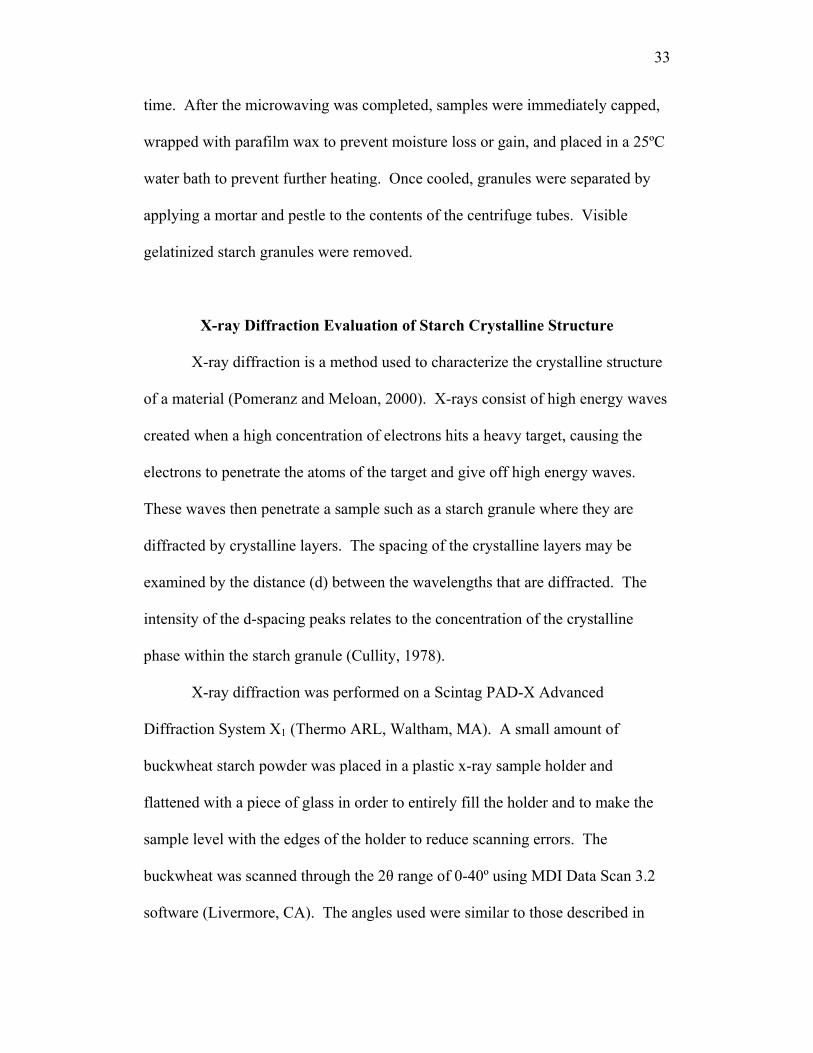
X-Ray Diffraction Results
Several x-ray diffraction measurements were taken of unheated and heated
buckwheat starch at moisture levels of 13.2%, 26.8%, 32.3%, 40.0%, and 44.4%.
Heat treatment involved microwaving the starch at the same parameters as the
other tests. All graphs were smoothed using MDI Jade 6.5 in order to better read
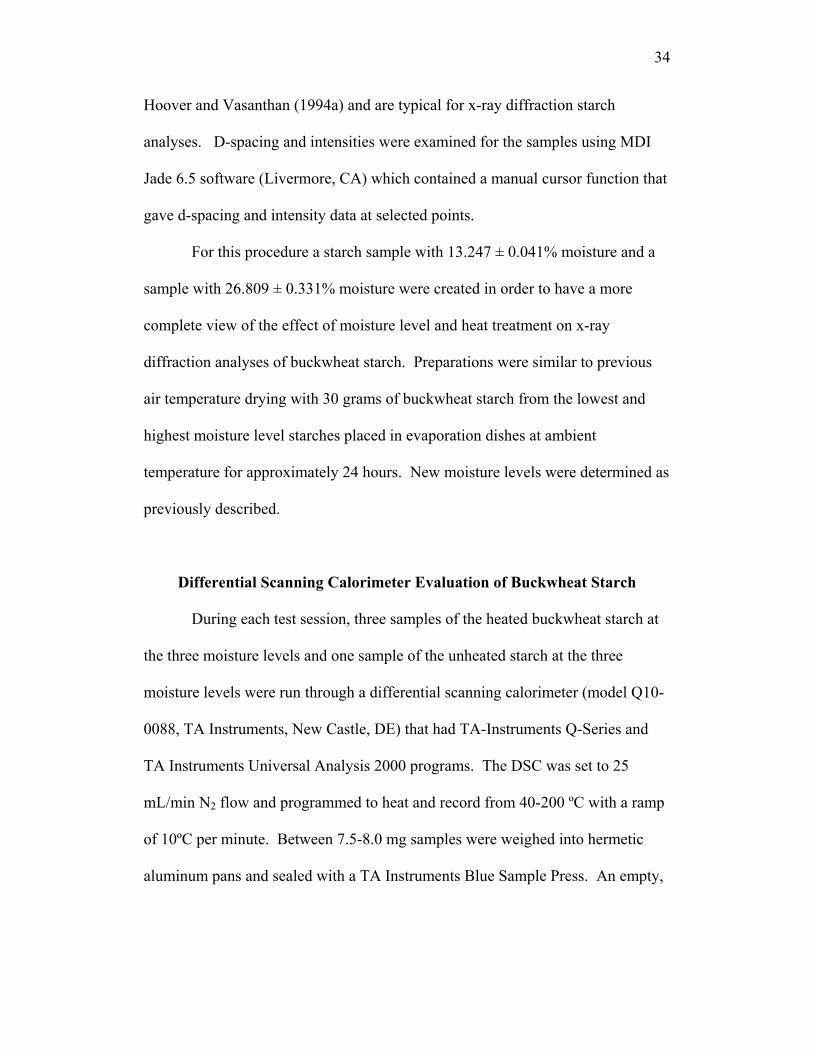
and compare graphs. Figures 3 and 4 illustrate the difference in x-ray diffraction
between moisture levels for unheated and heated samples. The following Figures
5-9 illustrate the difference in x-ray diffraction between the unheated and heated
samples for each moisture level. For the unheated 44.4% moisture level two
40
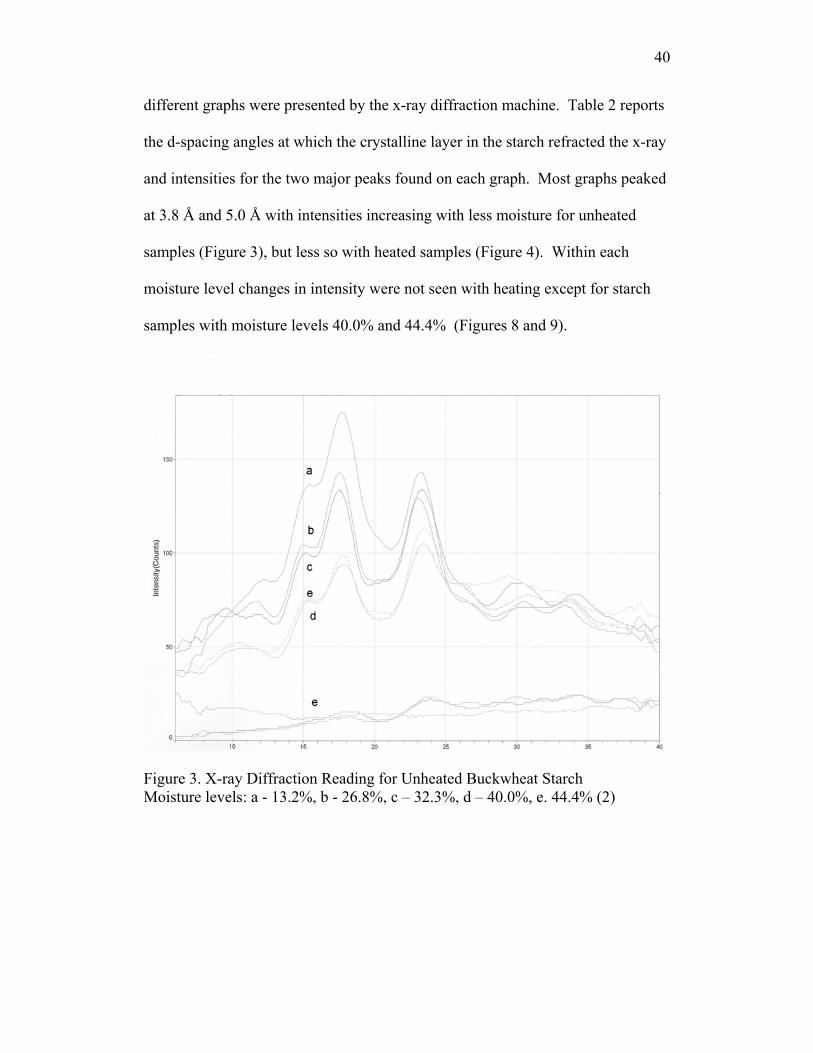
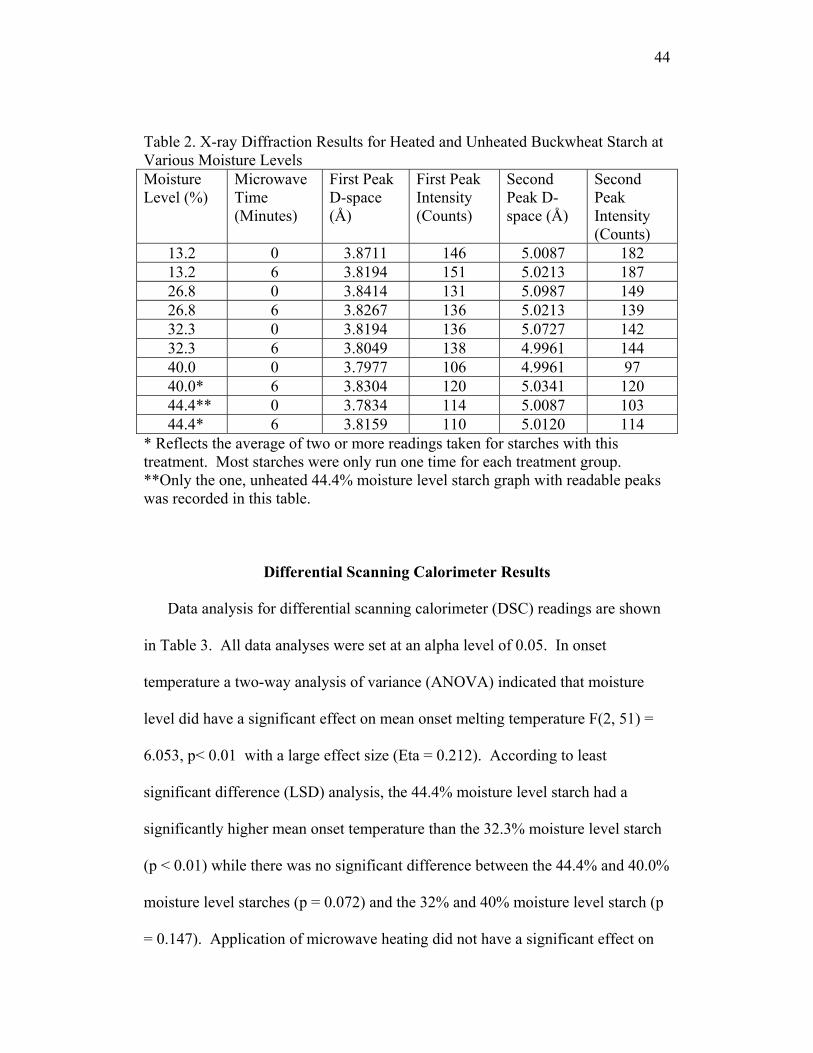
different graphs were presented by the x-ray diffraction machine. Table 2 reports
the d-spacing angles at which the crystalline layer in the starch refracted the x-ray
and intensities for the two major peaks found on each graph. Most graphs peaked
at 3.8 Å and 5.0 Å with intensities increasing with less moisture for unheated
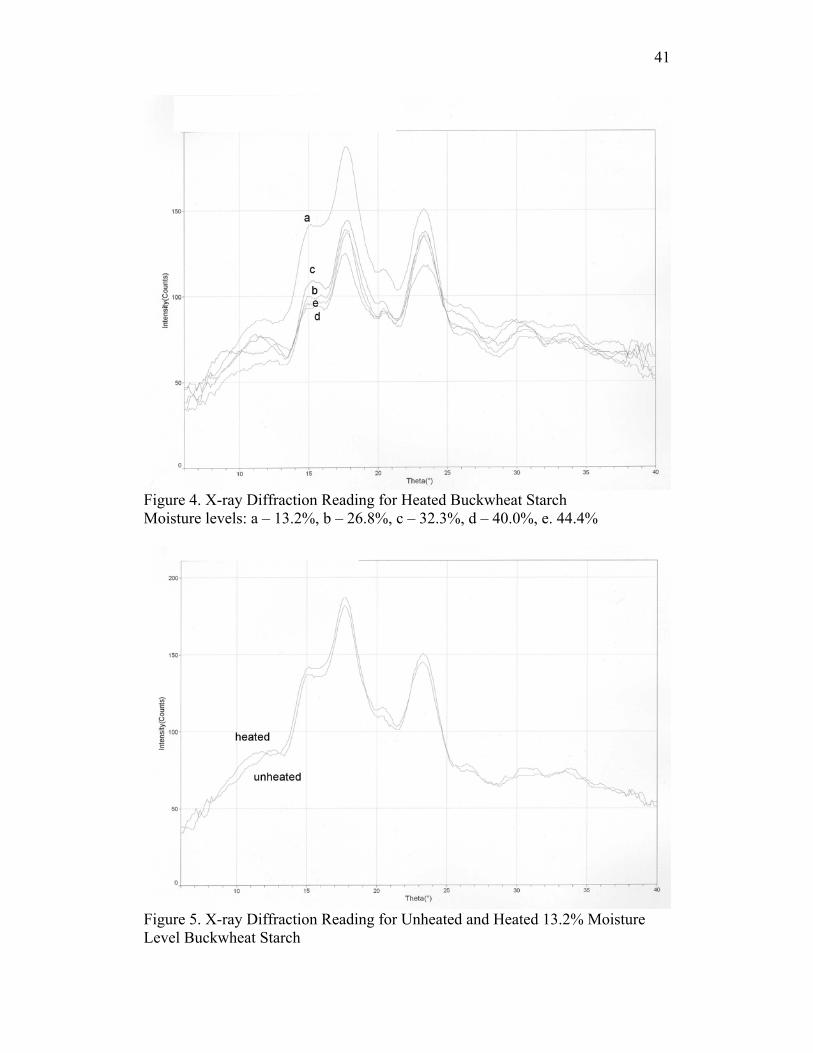
samples (Figure 3), but less so with heated samples (Figure 4). Within each
moisture level changes in intensity were not seen with heating except for starch
samples with moisture levels 40.0% and 44.4% (Figures 8 and 9).
Figure 3. X-ray Diffraction Reading for Unheated Buckwheat Starch Moisture levels: a - 13.2%, b - 26.8%, c – 32.3%, d – 40.0%, e. 44.4% (2)
41
Figure 4. X-ray Diffraction Reading for Heated Buckwheat Starch Moisture levels: a – 13.2%, b – 26.8%, c – 32.3%, d – 40.0%, e. 44.4%
Figure 5. X-ray Diffraction Reading for Unheated and Heated 13.2% Moisture Level Buckwheat Starch
42
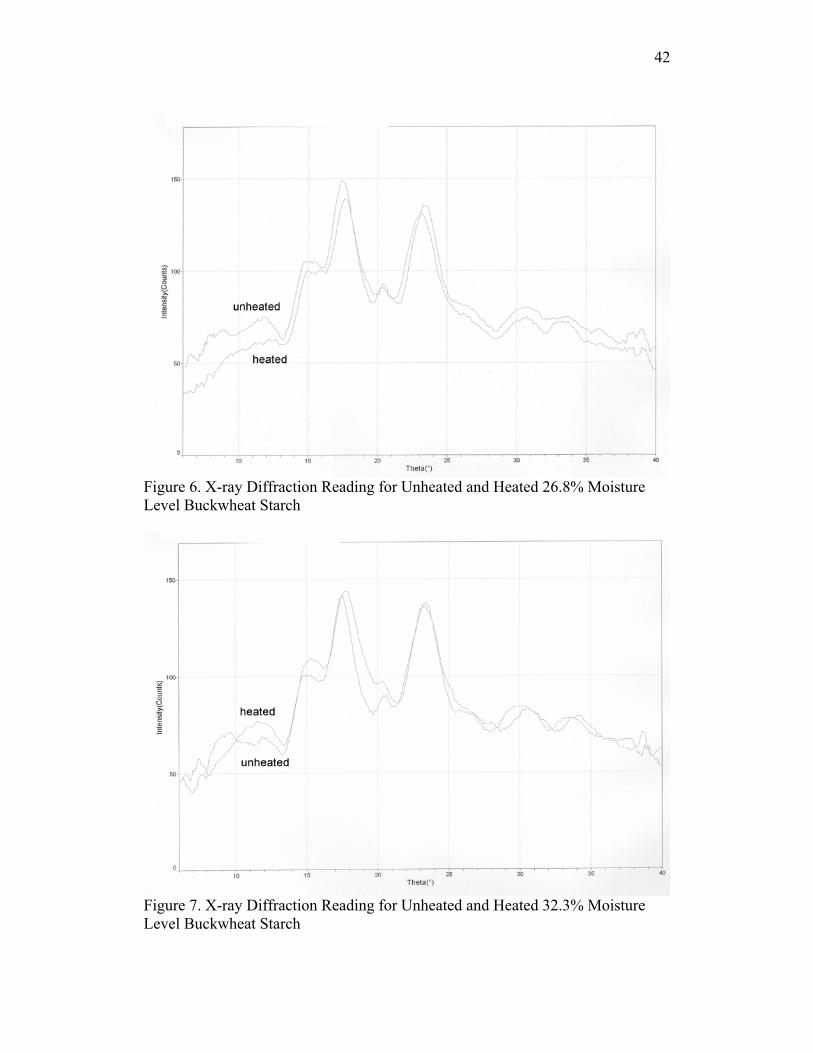
Figure 6. X-ray Diffraction Reading for Unheated and Heated 26.8% Moisture Level Buckwheat Starch
Figure 7. X-ray Diffraction Reading for Unheated and Heated 32.3% Moisture Level Buckwheat Starch

43
Figure 8. X-ray Diffraction Reading for Unheated and Heated 40.0% Moisture Level Buckwheat Starch
Figure 9. X-ray Diffraction Reading for Unheated and Heated 44.4% Moisture Level Buckwheat Starch
44
Table 2. X-ray Diffraction Results for Heated and Unheated Buckwheat Starch at Various Moisture Levels Moisture Level (%)
Microwave Time (Minutes)
First Peak D-space (Å)
First Peak Intensity (Counts)
Second Peak D-space (Å)
Second Peak Intensity (Counts)
13.2 0 3.8711 146 5.0087 182 13.2 6 3.8194 151 5.0213 187 26.8 0 3.8414 131 5.0987 149 26.8 6 3.8267 136 5.0213 139 32.3 0 3.8194 136 5.0727 142 32.3 6 3.8049 138 4.9961 144 40.0 0 3.7977 106 4.9961 97
40.0* 6 3.8304 120 5.0341 120 44.4** 0 3.7834 114 5.0087 103 44.4* 6 3.8159 110 5.0120 114
* Reflects the average of two or more readings taken for starches with this treatment. Most starches were only run one time for each treatment group. **Only the one, unheated 44.4% moisture level starch graph with readable peaks was recorded in this table.
Differential Scanning Calorimeter Results
Data analysis for differential scanning calorimeter (DSC) readings are shown
in Table 3. All data analyses were set at an alpha level of 0.05. In onset
temperature a two-way analysis of variance (ANOVA) indicated that moisture
level did have a significant effect on mean onset melting temperature F(2, 51) =
6.053, p< 0.01 with a large effect size (Eta = 0.212). According to least
significant difference (LSD) analysis, the 44.4% moisture level starch had a
significantly higher mean onset temperature than the 32.3% moisture level starch
(p < 0.01) while there was no significant difference between the 44.4% and 40.0%
moisture level starches (p = 0.072) and the 32% and 40% moisture level starch (p
= 0.147). Application of microwave heating did not have a significant effect on
45
mean onset melting temperature F(1, 51) = 0.255, p = 0.616 with a small effect
size of (Eta = 0.006). The combined effect of moisture and microwave heat also
did not have a significant effect on mean onset temperature F(2, 51) = 1.289, p =
0.285 with a moderate effect size (Eta = 0.054). According to Levene’s test of
equality of error variances there was no significant error variance among variables
F(5, 45) = 1.726, p = 0.148 meaning that the variance was the same for each
treatment group. Overall, moisture level did cause the 44.4% starch to have
significantly higher onset melting temperature readings than the 32.3% starch but
not the 40.0% starch. The application of heat did not have an influence on or
interact with moisture level to have an influence on onset melting temperatures.
Two-way ANOVA data analysis of peak melting temperature also found
moisture level to have a significant effect on mean peak melting temperature F(2,
51) = 7.710, p < 0.01 with a large effect size (Eta = 0.255). According to LSD
analysis, the 44.4% moisture level had a significantly higher mean peak
temperature than the 40.0% moisture level starch (p < 0.05) and the 32.3%
moisture level starch (p < 0.001). There was no significant difference between
the 32.3% and 40.0% moisture level starch (p = 0.127). Application of
microwave heating did not have a significant effect on the mean peak melting
temperature F(1, 51) = 0.767 , p = 0.386 with a small effect size (Eta = 0.017).
The combined effect of moisture and microwave heat also did not have a
significant effect on mean peak melting temperature F(2, 51) = 0.515, p = 0.601
with a small effect size (Eta = 0.022). According to Levene’s test of equality of
error variances there was a significant error variance among variables F(5, 45) =
46
3.203, p < 0.05. This means that there was significant difference in variances
across the different treatment groups and as such this could have an effect on
mean peak melting temperature readings. As with onset melting temperatures,
peak melting temperatures were influenced by moisture but not heating and had
higher variances in readings which could have affected the two-way ANOVA
analysis.
For two-way ANOVA of DSC enthalpy of fusion, two different analyses
were run, one with the entire data set including samples that were suspected of
being partially melted (had melting endotherm peaks with enthalpy < 100 J/g) and
one without these samples. Suspected partially melted samples were found in
every treatment group except for 32.3% moisture level starch, 0 minutes
microwave heat treatment. The most suspected partially melted samples were
found in treatment group 44.4%, 6 minutes microwave treatment with 3 samples.
In the two-way ANOVA of mean DSC enthalpy of the entire set of starches at
different moisture levels was found to have a significant effect on mean DSC
enthalpy F(2, 51) = 4.220, p < 0.05 with a large effect size (Eta = 0.158) whereas
heating was not found to have a significant effect F(1, 51) = 1.044, p = 0.371 with
small effect size (Eta = 0.018). Interaction between moisture level and
microwave heating also did not have a significant effect on DSC enthalpy F (2, 51)
= 1.044, p = 0.360 with a moderate effect size (Eta = 0.044). In an LSD analysis
of the moisture levels, 44.4% moisture level starch was found to have a
significantly higher mean DSC enthalpy than 32.3% moisture level starch (p <
0.01). However, 44.4% moisture level buckwheat starch did have a significantly

47
higher mean DSC enthalpy than 40.0% moisture level starch (p = 0.252) and
40.0% moisture level starch did not have a significantly higher level mean DSC
enthalpy than 32.3% moisture level starch (p = 0.116). Levene’s test of equality
of error variances did find that the error variance was not equal across groups (p <
0.01) which means that the variances could have had an effect on the mean DSC
readings.
When the suspected partially melted sample data was eliminated moisture
level was found to have a significant effect on mean DSC enthalpy F(2, 44) =
83.072, p < 0.001 with a large effect size (Eta = 0.814) while microwave heating
did not have a significant effect on mean DSC enthalpy F(1, 44) = 0.002, p =
0.964 with a small effect size (Eta = 0.00) and interaction between moisture level
and microwave heating also did not have a significant effect on mean DSC
enthalpy F(2, 44) = 0.387, p = 0.681 with a small effect size (Eta = 0.020). In an
LSD analysis of the moisture levels the 44.4% moisture level starch was found to
have a significantly higher mean DSC enthalpy than the 40.0% and 32.3%
moisture level starches (p < 0.001) and the 40.0% moisture level starch was found
to be significantly higher than the 32.3% moisture level starch (p < 0.001).
Levene’s test of equality of error variances found that the error variance was not
significantly different across groups (p = 0.951). Overall the removal of the
suspected partially melted starch samples helped to reduce error due to variance
and indicated a greater significant difference between the different moisture level
starches.

48
Table 3. Differential Scanning Calorimeter Results Moisture Level (%)
Microwave Time
(Minutes)
Onset Melting Temperature
(ºC)
Peak Melting Temperature
(ºC)
Enthalpy of Melting (J/g)*
32.3 0 95.06 ± 9.66a 113.80 ± 2.42a 318.60 ± 62.76a
(318.60 ± 62.76)a 32.3 6 93.15 ± 9.84a 118.36 ± 12.91a 300.46 ± 110.55a
(333.04 ± 55.23)a
40.0 0 101.46 ± 10.09a 123.46 ± 12.65a 403.46 ± 187.49a
(475.26 ± 72.67)b
40.0 6 99.32 ± 9.30a 121.54 ± 11.65a 431.11 ± 175.89a
(484.22 ± 79.58)b
44.4 0 103.20 ± 11.85b 128.08 ± 9.12b 580.74 ± 222.84b
(652.95 ± 55.86)c
44.4 6 112.31 ± 17.35b 133.96 ± 15.67b 419.62 ± 316.82b
(626.70 ± 78.89)c
Data corrected for gelatinized samples are indicated with parentheses. All data is given as mean and standard deviation. Subscripts within the same column denote significant difference among data of at least p < 0.05. For onset and peak n = 9 except for 40.0% at 0 minutes where n = 6. *For corrected enthalpy 32.3%, 0 minute n = 9, 32.3% 6 minutes, 40.0% 6 minutes, and 44.4% 0 minutes n = 8, 40.0% 0 minute n = 5, 44.4% 6 minutes n = 6.
Figures 10-12 are representative DSC of buckwheat starches at the
different moisture levels. As percent moisture increased, the DSC endotherm
peaks widened (increasing enthalpy) and shifted toward higher temperatures
(increasing onset and peak melting temperature).

49
Figure 10. Representative DSC Scan of 32.3% Moisture Level Buckwheat Starch
Figure 11. Representative DSC Scan of 40.0% Moisture Level Buckwheat Starch

50
Figure 12. Representative DSC Scan of 44.4% Moisture Level Buckwheat Starch
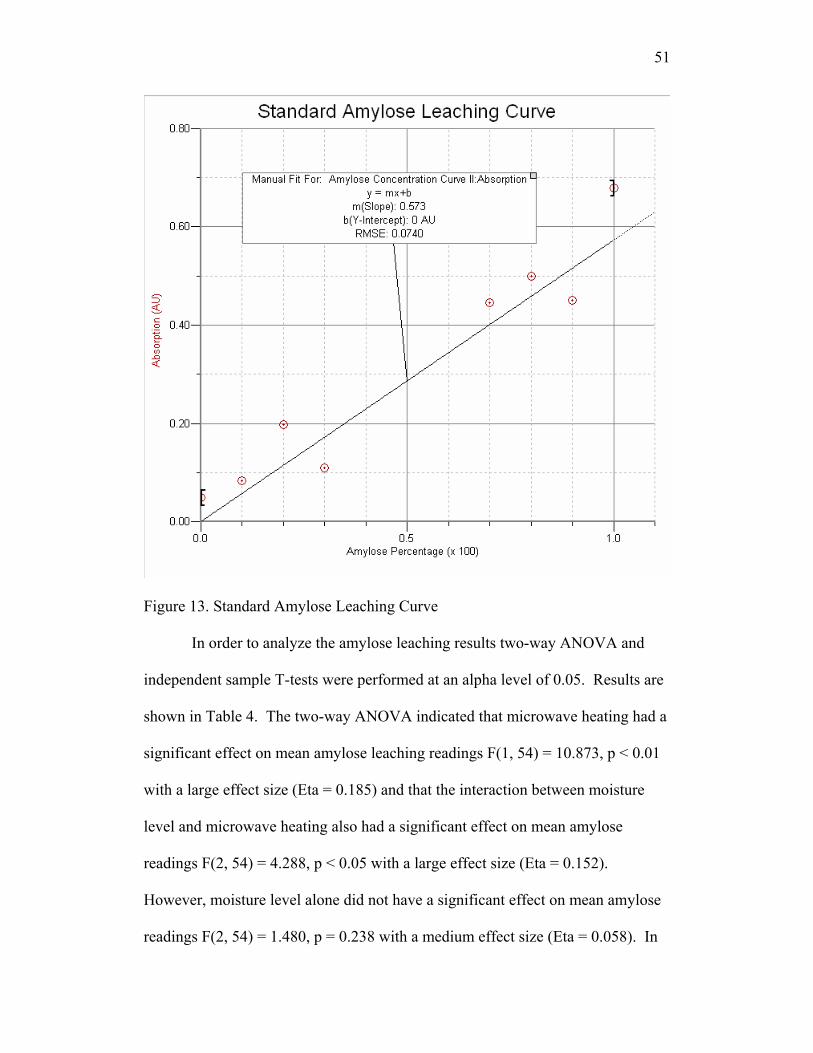
Amylose Leaching Results In order to determine the amylose leaching percentage 0-100% amylose
standards were prepared and tested with the same procedure as the treated
samples. The resulting graph is shown in Figure 13. Since there was a large
deviation from 40-60%, these data points were eliminated. The resulting graph
gave an equation of y = 0.573x which was used to determine the percent of
amylose that leached out of the starch granules during the test using the
absorbance readings from the starch-iodine test.
51
Figure 13. Standard Amylose Leaching Curve In order to analyze the amylose leaching results two-way ANOVA and
independent sample T-tests were performed at an alpha level of 0.05. Results are
shown in Table 4. The two-way ANOVA indicated that microwave heating had a
significant effect on mean amylose leaching readings F(1, 54) = 10.873, p < 0.01
with a large effect size (Eta = 0.185) and that the interaction between moisture
level and microwave heating also had a significant effect on mean amylose
readings F(2, 54) = 4.288, p < 0.05 with a large effect size (Eta = 0.152).
However, moisture level alone did not have a significant effect on mean amylose
readings F(2, 54) = 1.480, p = 0.238 with a medium effect size (Eta = 0.058). In
52
other words, moisture level alone did not affect mean amylose leaching, however
it did have a combined effect with microwave heating. Levene’s test of equality
of error variances showed that there was no significant difference in variances
among the different treatment groups F (5, 48) = 1.314, p = 0.274.
Since LSD could not be performed to determine the significance of the
difference between the different treatment groups, independent sample t-tests
were performed. The results of the t-tests indicated that the mean amylose
leaching reading for the unheated 44.4% moisture level starch was significantly
higher than the heated 44.4% moisture level starch, p < 0.001, and that the
unheated 40.0% moisture level starch and all of the 32.3% moisture level starch
were significantly higher than the heated 44.4% moisture level starch, p < 0.01.
The unheated 44.4% moisture level starch had significantly higher mean amylose
leaching than the heated 40.0% moisture level starch, p < 0.01. Differences
among the other treatments were not significant at the selected alpha level. This
means that mean amylose leaching was lowest for the heated 44.4% moisture
level starch, followed by the heated 40.0% moisture level starch, the unheated
40.0% moisture level starch and both treatments of 32.3% moisture level starch,
and finally the unheated 44.4% moisture level starch.
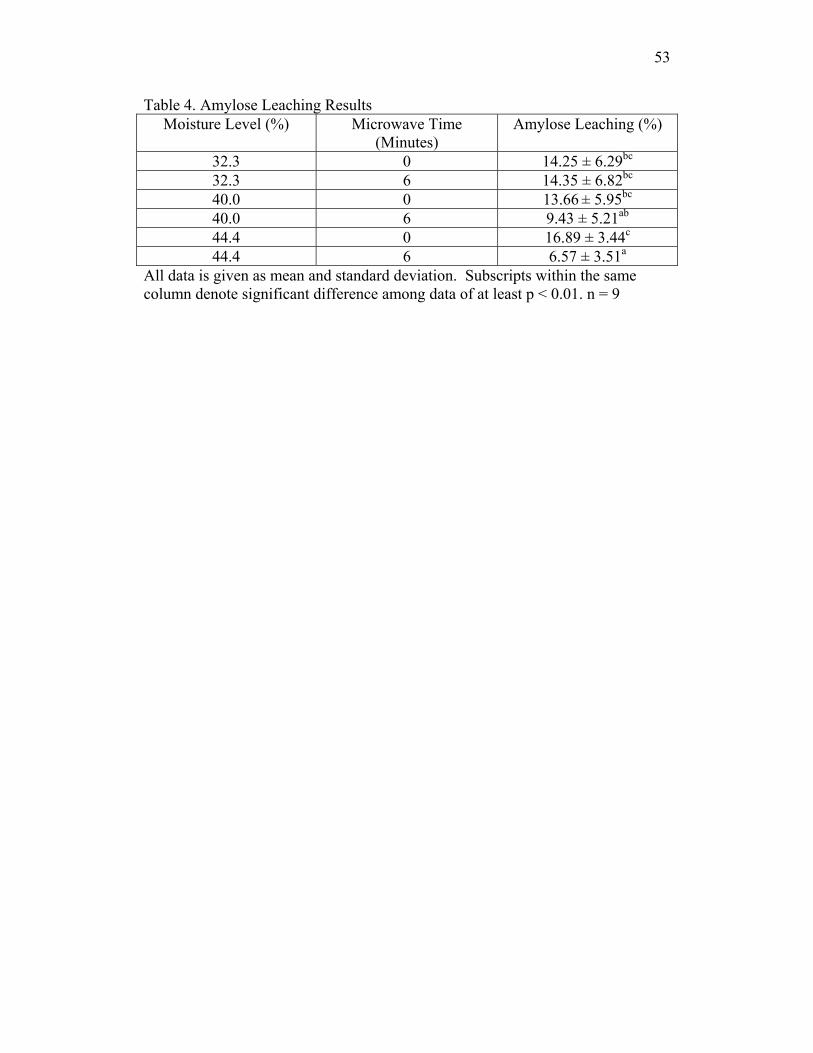
53
Table 4. Amylose Leaching Results Moisture Level (%) Microwave Time
(Minutes) Amylose Leaching (%)
32.3 0 14.25 ± 6.29bc
32.3 6 14.35 ± 6.82bc
40.0 0 13.66 ± 5.95bc
40.0 6 9.43 ± 5.21ab 44.4 0 16.89 ± 3.44c
44.4 6 6.57 ± 3.51a
All data is given as mean and standard deviation. Subscripts within the same column denote significant difference among data of at least p < 0.01. n = 9

54
CHAPTER V
DISCUSSION
In examining the results for this experiment it is important to note that, for
some buckwheat starch characteristics, heat treatment or the interaction of heat
treatment and moisture level had a significant effect, while for other
characteristics moisture level alone had a significant effect. Three main moisture
levels – 32.3%, 40.0%, and 44.4% - and two heating options – microwave heated
or unheated at below the gelatinization temperature - were used to create
microwave heat-moisture (32.3%, heated) and annealed (40.0%, 44.4%, heated)
samples. These factors, moisture and heat, created six treatment groups which
were applied to the buckwheat starch and then used to examine buckwheat starch
characteristics. The three tests used in this experiment examined a characteristic
which has to do with amylose interactions in the starch granule and characteristics
which have to do with the crystalline region of the starch granule (concentration
and stability). Results from these tests showed that buckwheat granule structures
can be stabilized in some ways using microwave and moisture heat treatment to
make it more resistant to breaking apart from further addition of heat and water.
X-ray diffraction results were found to be similar to previous x-ray
diffraction readings of buckwheat starch (Zheng, Sosulski, & Tyler, 1998). The
starch did have a cereal A-type crystallinity with two major d-spacing peaks at 5.0
Å (~17.7º) and 3.8 Å (~23.4º) and one smaller peak that was not recorded but was
visible as a shoulder at about 5.7 Å (~15.4º). This did not change with percent
moisture or heat treatment (see Figures 3 and 4). In general the intensity of the x-
55
ray diffraction readings increased as moisture level decreased. X-ray intensity
also increased with microwave annealing treatment of buckwheat starch with
moisture levels of 40.0% and 44.4% (see Figures 8 and 9).
Hoover and Vasanthan (1994a; 1994b) found that heat-moisture and
annealing treatment of cereal did increase peak intensities without changing d-
spacing. Stute (1992) found that heat-moisture treatment of B-type crystalline
structures caused a change in crystalline structure to A-type and C-type whereas
annealing did not cause any crystalline changes. Contrary to some of these
experiments heat-moisture treatment did not result in significant changes to
intensity (see Figures 5-7) while annealing did (see Figures 8 and 9). Percent
moisture, particularly of unheated starch (see Figure 3), also influenced x-ray
diffraction readings which could be expected since less water would mean lower
swelling in amorphous regions, decreasing concentration of amorphous regions
and increasing concentration of crystalline regions (Cullity, 1978). A possible
explanation for the increased intensity with annealing is that the excess moisture
coupled with heat may have been able to more evenly spread the amylose
throughout the starch granule, allowing interaction of the amylose and
amylopectin branches in the crystalline regions which would account for higher
intensity readings between heated and unheated starch at higher percent moisture
levels and comparable readings among several heated starches as seen in Figure 4.
As suggested in Hoover and Vasanthan (1994b) interaction between amylose and
amylopectin chains may also have occurred at the two moisture levels, which
would also account for increased concentration of the crystalline regions. Loss of

56
moisture due to heating was not considered a major factor for increased x-ray
diffraction readings since percent moisture level analyses of heat treated starches
found little percent moisture loss (32.261% pre-treatment, 30.745% post-
treatment; 40.017% pre-treatment, 38.954% post-treatment; 44.379% pre-
treatment, 43.335% post-treatment). More tests, however, would need to be run
to confirm these findings.
Temperature of fusion and heat of fusion results using the differential
scanning calorimeter (DSC) for this experiment were higher than previous
experiments which involved the use of heat and moisture treatment of cereal and
buckwheat starches (Hoover & Vasanthan, 1994a; Hoover & Vasanthan, 1994b;
Li, Lin, & Corke, 1997; Qian, Rayas-Duarte, & Grant, 1998). This is expected
per the results of Donovan’s experiment (1979) because, unlike the other
experiments, this experiment did not involve the addition of water to the DSC
samples prior to testing. With intermediate to low moisture levels higher
endotherms could be expected since, according to Donovan’s research (1979),
DSC readings at lower moisture levels were due to the melting of the majority of
the crystalline structure versus the small amount of crystalline structure stripping
that takes place at the lower (66ºC) endotherm when excess moisture is available.
In preliminary tests with buckwheat starch that had higher moisture levels and
with some of the 44.4% starch samples some endotherms in the 66ºC area were
visible. The lowest peak temperature for any of these readings was 67.64ºC.
Heat treatment temperature was set at 65.6ºC (150ºF) in order to supply enough
57
heat to cause changes in the crystals without causing gelatinization which did
partially occur in some samples as was noted in the results section.
DSC endothermic changes did occur, but, as stated in the results, were
attributed to moisture level changes, particularly between the 32.3% and 44.4%
moisture levels. The shift in higher endothermic parameters is contrary to
Donovan (1979) and other researchers who have studied the effect of moisture
content on DSC parameters (Rolee & LeMeste, 1999) and found DSC parameters
such as onset and peak temperature to decrease with increasing moisture content.
Change in enthalpy was more consistent with the findings of Donovan (1979) and
Rolee and LeMeste (1999) where peaks became smaller with decreased moisture
content. Although hard to conclude due to the great amount of variance in
especially peak temperatures, buckwheat starch with its higher water binding
capacity and higher amylose content may actually form stronger internal bonds
between amylose and itself or amylose and amylopectin at higher moisture levels
which would contribute to increased resistance to melting.
Amylose leaching results focused on the interaction of amylose with itself
and other starch granule components. The results of this experiment found that
amylose leaching was not significantly affected solely by moisture level as were
DSC endotherm readings; rather the amylose leaching was affected more by the
use of microwave heat treatment, and the combination of moisture and microwave
treatment. This was most significant especially with the 40.0% and 44.4%
moisture level annealed starch. Although the unheated 44.4% moisture level
starch had the highest mean amount of amylose leaching, it was not significantly
58
different from the other unheated starches. The most significant finding from this
test was that annealed starches had significantly lower amylose leaching. This
finding is consistent with annealing treatments of different starches by Hoover
and Vasanthan (1994b) but not heat-moisture treatment of different starches by
Hoover and Vasanthan (1994a). The findings are also consistent with the
restrictive swelling properties of buckwheat starch found by Qian, Rayas-Duarte,
and Grant (1998). Lower swelling relates to lower amylose leaching in that
granules that are more resistant to swelling are more resistant to leaching of their
components. Higher amounts of amylose, coupled with the effects of annealing
conditions, could help to form strong internal bonds between amylose and itself
and amylose and other starch granules components which would make the
granules more resistant to changes caused by the further addition of heat and
moisture.
Overall significant changes were observed in amylose leaching and DSC
endotherm parameters. Visible changes were observed in x-ray diffraction
readings in heated buckwheat starch at high moisture levels and in unheated
buckwheat starch at low moisture levels. The addition of moisture and in some
cases heat helped to form starch granules that were resistant to the breakdown of
crystalline structures and the leaching of amylose in the presence of supplemental
heat and moisture. Most of these changes were attributed to changes in
interactions between amylose and other components throughout the starch granule.

59
CHAPTER VI
CONCLUSION
The purpose of this experiment was to explore the effect of microwave
heat-moisture treatment and annealing on buckwheat starch properties. The
hypothesis was that both treatments would make the buckwheat starch granules
more resistant to destruction by further heat and moisture application. This
hypothesis was tested by isolating buckwheat starch from flour, preparing five
moisture levels, and setting up three different tests which looked at the resistance
of the buckwheat starch granule to melting from additional heat, the leaching of
amylose, a component of starch, with application of heat and water; and the
crystalline structure of the starch before and after heat treatment at the different
moisture levels. High moisture levels were found to have a significant effect on
melting parameters whereas annealing treatment was found to have a significant
effect on amylose leaching. There were no changes in d-space angles in x-ray
diffraction; however, intensities did increase with lower moisture level and
annealing. These findings were attributed to interactions between amylose and
other starch components throughout the starch granule.
60
Recommendations for Further Study
Future recommendations for studies with microwave annealing and heat-
moisture treatment of buckwheat starch include.
1. Create moisture levels that are farther apart and microwave starch for
longer periods of time to test the limits of microwave annealing and heat-
moisture possibilities.
2. Run more x-ray diffraction analyses on treated samples to ensure
reliability of results.
3. Conduct other resistance measurements such as alpha-amylase tests and
acid hydrolysis tests which examine resistance of treated starches to
digestion.
61
REFERENCES
Buffler, C. R. (1992). Microwave Cooking and Processing: Engineering Fundamentals for the Food Scientist. New York: Van Nostrand Reinhold. Chrastil, J. (1987). Improved colorimetric determination of amylose in starches or flours. Carbohydrate Research. 159, 154-158. Cullity, B. D. (1978). Elements of X-ray Diffraction (2nd ed.). Reading, Massachusetts: Addison-Wesley Publishing Company, Inc. Dietrych-Szostak, D., & Oleszek, W. (1999). Effect of processing on the flavonoid content in buckwheat (Fagopryum esculentum Möench) grain. Journal of Agricultural & Food Chemistry. 47, 4384-4387. Donovan, J. W. (1979). Phase transitions of the starch-water system. Biopolymers. 18, 263-275. Edwardson, S. (1996). Buckwheat: pseudocereal and nutraceutical. In J. Janick
(Ed.). Progress in new crops (pp. 195-207). Alexandria, Virginia: ASHS Press. Eliasson, A.C., & Tjerneld, E. (1990). Adsorption of wheat proteins on wheat starch granules. Cereal Chemistry. 67, 366-372. Fardet, A., Abecassis, J., Hoebler, C., Baldwin, P. M., Buléon, A., Bérot, S., Barry, J. L. (1999). Influence of technological modifications of the protein network from pasta on in vitro starch degradation. Journal of Cereal Science. 30, 133-145. Fellows, P. (2000). Food Processing Technology: Principles and Practices. (2nd ed.). New York, New York: CRC Press. Fennema, O. R. (1996). Water and Ice. In: O. R. Fennema (Ed.). Food Chemistry (3rd ed). (pp. 17-94). New York, New York: Marcel Dekker, Inc. Fornal, L., Smietana, Z., Soral-Smietana, M., Fornal, J., & Szpendowski, J. (1985). Products extruded from buckwheat flour and its mixtures with milk proteins. II. Chemical characteristics and physico-chemical properties of proteins and starch of products extruded from buckwheat flour and its mixture with milk proteins. Acta Alimentaria Polonica. 11, 397-411.

62
Goebel, N.K., Grider, J., Davis, E. A., Gordon, J. (1984). The effects of microwave energy and convection heating on wheat starch granule transformations. Food Microstructure. 3, 73-82. Hoover, R., & Vasanthan, T. (1994a). Effect of heat-moisture treatment on the structure and physicochemical properties of cereal, legume, and tuber starches. Carbohydrate Research. 252, 33-53. Hoover, R., & Vasanthan, T. (1994b). The effect of annealing on the
physicochemical properties of wheat, oat, potato and lentil starches. Journal of Food Biochemistry. 17, 303-325.
Harris, D.C. (2003). Fundamentals of Spectrophotometry. In: Quantitative Chemical Analysis (6th ed.). (pp. 407-432). New York, New York: W.H. Freeman and Company. Hoseney, R.C. (1994). Principles of Cereal Science and Technology (2nd ed.). St. Paul, Minnesota: American Association of Cereal Chemists, Inc. Jacobs, H., & Delcour, J. A. (1998). Hydrothermal modifications of granular starch, with retention of the granular structure: a review. Journal of Agricultural and Food Chemistry. 46, 2895-2905. Kayashita, J., Shimaoka, I., Nakajoh, M., Yamazaki, M., & Kato, N. (1997). Consumption of buckwheat protein lowers plasma cholesterol and raises fecal neutral sterols in cholesterol-fed rats because of its low digestibility. Journal of Nutrition. 127, 1395-1400. Khan, A. R., Johnson, J. A., & Robinson, R. J. (1979). Degradation of starch polymers by microwave energy. Cereal Chemistry. 56, 303-304. Li, S., & Zhang, Q. H. (2001). Advances in the development of functional foods from buckwheat. Critical Reviews in Food Science and Nutrition. 41, 451-464. Li, W., Lin, R., & Corke, H. (1997). Physicochemical properties of common and tartary buckwheat starch. Cereal Chemistry. 74,79-82. Liu, H., Arntfield, S. D., Holley, R. A., & Aime, D. B. (1997). Amylose-lipid complex formation in acetylated pea starch-lipid systems. Cereal Chemistry. 74, 159-162. Miller, L. A., Gordon, J., & Davis, E. A. 1991. Dielectric and thermal transition properties of chemically modified starches during heating. Cereal Chemistry. 68, 441-448.

63
Min, D. B., & Steenson, D. F. (1998). Crude fat analysis. In S. S. Nielsen (Ed.), Food Analysis (2nd ed.). (pp. 201-216). Gaithersburg, Maryland: Aspen Publishers, Inc. Minn-Dak Growers, Ltd. (1999). Buckwheat. Retrieved on January 30, 2002 from http://www.minndak.com/buckwhea.htm. National Agricultural Statistics Service. (1997). Census of Agriculture – State Data. Retrieved January 29, 2003 from http://www.nass.usda.gov/census/census97/volume1/vol1pubs.htm. Oomah, B. D., & Mazza, G. (1996). Flavonoids and antioxidative activities in buckwheat. Journal of Agricultural & Food Chemistry. 44, 1746-1750. Penner, M. H. (1998). Ultraviolet, visible, and fluorescence spectroscopy. In: S. S. Nielsen (Ed). Food Analysis (2nd ed.). (pp. 397-412). Gaithersburg, Maryland: Aspen Publishers, Inc. Pomeranz, Y. (1983). Buckwheat: structure, composition, and utilization. CRC Critical Reviews in Food Science and Nutrition. 19, 213-258. Pomeranz, Y., & Meloan, C. E. (2000). X-ray methods. In: Food Analysis: Theory and Practice (3rd ed). (pp. 158-171). Gaithersburg, Maryland: Aspen Publishers, Inc. Rolee, A., & LeMeste, M. (1999). Effect of moisture content on thermomechanical behavior of concentrate wheat starch-water preparations. Cereal Chemistry. 76, 452-458. Qian, J., Rayas-Duarte, P., & Grant L. (1998). Partial characterization of buckwheat (Fagopyrum esculentum) starch. Cereal Chemistry. 75, 365- 373. Saeger, E., & Dyck, E. (2001). Buckwheat. Minnesota Grown
Opportunities. Retrieved January 16, 2002 from http://www.mda.state.mn.us/mgo/publication/buckwheat.pdf.
Schenz, T. W., & Davis, E. A. (1998). Thermal analysis. In S. S. Nielsen (Ed.). Food Analysis (2nd ed.). (pp. 587-598). Gaithersburg, Maryland: Aspen Publishers, Inc. Shelton, D. R., & Lee, W. J. (2000). Cereal Carbohydrates. In: K. Kulp & J. G. Ponte, Jr. (Eds.). Handbook of Cereal Science and Technology (2nd ed.). (pp. 385-416). New York, New York: Marcel Dekker, Inc.

64
Skrabanja V., Elmståhl, H.G.M.L., Kreft I., & Björck, I. M.E. (2001). Nutritional properties of starch in buckwheat products: studies in vitro and in vivo. Journal of Agricultural & Food Chemistry. 49, 490-496. Skrabanja, V., & Kreft, I. (1998). Resistant starch formation following autoclaving of buckwheat (Fagopyrum esculentum Moench) groats. An in vitro study. Journal of Agricultural & Food Chemistry. 46, 2020-2023. Starr, C. (2000). Biology: concepts and applications, 4th ed. Pacific Grove, CA: Brooks/Cole Thomson Learning. Steadman, K.J., Burgoon, M. S., Lewis, B. A., Edwardson, S. E., & Obendorf, R. L. (2001). Buckwheat seed milling fractions: description, macronutrient composition and dietary fibre. Journal of Cereal Science. 33, 271-278. Steadman, K. J., Burgoon, M. S., Schuster, R. L., Lewis, B. A., Edwardson, S. E., & Obendorf, R. L. (2000). Fagopyitols, D-chiro-inositol, and other soluble carbohydrates in buckwheat seed milling fractions. Journal of Agricultural & Food Chemistry. 48, 2843-2847. Stute, R. (1992). Hydrothermal modification of starches: the difference between annealing and heat/moisture-treatment. Starch/Stärke. 44, S205-214. Sumnu, G., Ndife, M. K., Bayindirlu, L. (1999). Effects of sugar, protein and water content on wheat starch gelatinization due to microwave heating. European Food Research Technology. 209, 68-71. Szczodrak, J., & Pomeranz, Y. (1992). Starch-lipid interactions and formation of resistant starch in high-amylose barley. Cereal Chemistry. 69, 626-632. Tice, Tom. Food Grains Analysis Group. EPAS/FSA. (February 6, 2003). Email Correspondence. Tomotake, H., Shimaoka, I., Kayashita, J., Yokoyama, F., Nakajoh, M., & Kato, N. (2000). A buckwheat protein product suppresses gallstone formation and plasma cholesterol more strongly than soy protein isolate in hamsters. Journal of Nutrition. 130, 1670-1674. Vinning, G. (2001). Buckwheat: a demand-supply analysis. (Publications No 01/140) Kingston, Australia: Rural Industries Research and Development Corporation. Yiu, S. H., Weisz, J., & Wood, P. J. (1991). Comparison of the effects of microwave and conventional cooking on starch and β-glucan in rolled oats. Cereal Chemistry. 68, 372-375.

65
Zheng, G. H., Sosulski, F. W., & Tyler, R. T. (1998). Wet-milling, composition and functional properties of starch and protein isolated from buckwheat groats. Food Research International. 30, 493-502. Zylema, B. J., Grider, J. A., Gordon, J., & Davis, E. A. (1985). Model wheat starch systems heated by microwave irradiation and conduction with equalized heating times. Cereal Chemistry. 62, 447-453.
Related Documents