Water Research 38 (2004) 211–217 Effect of medium-pressure UV irradiation on bromate concentrations in drinking water, a pilot-scale study Sigrid Peldszus a, *, Susan A. Andrews b , Rosana Souza a , Franklyn Smith c , Ian Douglas d , Jim Bolton e , Peter M. Huck a a NSERC Chair in Water Treatment, University of Waterloo, Waterloo, Ont. N2L 3G1, Canada b Dept. of Civil Engineering, University of Waterloo, Waterloo, Ont. N2L 3G1, Canada c Regional Municipality of Waterloo, 150 Frederick St. 7th Floor, Kitchener, Ont. N2G 4J3, Canada d City of Ottawa, Water Division, 2731 Cassels Road, Ottawa, Ont. K2B 1A8, Canada e Bolton Photosciences Inc., 628 Cheriton Cres. NW, Edmonton, Alberta T6R 2M5, Canada Received 23 October 2002; received in revised form 28 August 2003; accepted 12 September 2003 Abstract This study investigated the potential for bromate removal from drinking water on irradiation with medium-pressure UV lamps—a technique gaining considerable interest for drinking water disinfection. Waters from two different sources were spiked with 20 mg/L of bromate and irradiated with UV fluences up to 718 mJ/cm 2 utilizing a pilot-scale reactor (Calgon Carbon Corp.) at a flow of 76 L/min (20 gallon/min). Essentially no removal was observed in one of the source waters. Limited bromate removal, up to 19%, was observed in the second source water at high UV fluences (696 mJ/ cm 2 ) and a fluence-response relationship was clearly evident. All removals would be negligible at UV fluences anticipated for drinking water disinfection (p40 mJ/cm 2 ). Different water characteristics, in particular competitive absorption by nitrate and possibly DOC, were most likely responsible for the differences in bromate removal in the waters tested. The source water that did not show any removal had a higher nitrate concentration (4 vs. 0.1 mg N/L) and also a higher DOC concentration (4.1 vs. 3.1 mg C/L) than the other source water which showed 19% bromate removal. r 2003 Elsevier Ltd. All rights reserved. Keywords: Bromate; Drinking water; Medium-pressure UV–UV disinfection 1. Introduction Bromate is formed as an ozonation by-product in bromide-containing waters (e.g. [1,2]). Therefore, water utilities that utilize ozonation as part of their treatment process have to be concerned with the possibility of elevated bromate concentrations. Bromate formation depends on various factors including initial bromide concentration, ozone dose, ozone residual and pH. Bromate concentrations of up to 60 mg/L have been observed following ozonation [3]. As a suspected carcinogen, bromate is regulated in the United States to 10 mg/L as of December 2001 [4]. Bull et al. [5] reported a cancer risk of 10 4 (lifetime exposure) at a bromate concentration of 5 mg/L, whereas the World Health Organisation (WHO) [6] has a provisional guideline value of 25 mg/L based on an excess lifetime cancer risk of 7 10 5 . Different approaches have been taken to reduce bromate concentrations in drinking water. The majority of studies have focused on optimizing ozonation processes to minimize bromate formation (e.g., [3,7,8]). In addition, removal of bromate after its formation has also been investigated, although to a lesser extent [9–13]. ARTICLE IN PRESS *Corresponding author. Tel.: +1-519-888-4567 ext. 3511; fax: +1-519-746-7499. E-mail address: [email protected] (S. Peldszus). 0043-1354/$ - see front matter r 2003 Elsevier Ltd. All rights reserved. doi:10.1016/j.watres.2003.09.010

Welcome message from author
This document is posted to help you gain knowledge. Please leave a comment to let me know what you think about it! Share it to your friends and learn new things together.
Transcript
Water Research 38 (2004) 211–217
ARTICLE IN PRESS
*Correspond
fax: +1-519-74
E-mail addr
0043-1354/$ - se
doi:10.1016/j.w
Effect of medium-pressure UV irradiation on bromateconcentrations in drinking water, a pilot-scale study
Sigrid Peldszusa,*, Susan A. Andrewsb, Rosana Souzaa, Franklyn Smithc,Ian Douglasd, Jim Boltone, Peter M. Hucka
aNSERC Chair in Water Treatment, University of Waterloo, Waterloo, Ont. N2L 3G1, CanadabDept. of Civil Engineering, University of Waterloo, Waterloo, Ont. N2L 3G1, Canada
cRegional Municipality of Waterloo, 150 Frederick St. 7th Floor, Kitchener, Ont. N2G 4J3, CanadadCity of Ottawa, Water Division, 2731 Cassels Road, Ottawa, Ont. K2B 1A8, Canada
eBolton Photosciences Inc., 628 Cheriton Cres. NW, Edmonton, Alberta T6R 2M5, Canada
Received 23 October 2002; received in revised form 28 August 2003; accepted 12 September 2003
Abstract
This study investigated the potential for bromate removal from drinking water on irradiation with medium-pressure
UV lamps—a technique gaining considerable interest for drinking water disinfection. Waters from two different sources
were spiked with 20 mg/L of bromate and irradiated with UV fluences up to 718mJ/cm2 utilizing a pilot-scale reactor
(Calgon Carbon Corp.) at a flow of 76L/min (20 gallon/min). Essentially no removal was observed in one of the source
waters. Limited bromate removal, up to 19%, was observed in the second source water at high UV fluences (696mJ/
cm2) and a fluence-response relationship was clearly evident. All removals would be negligible at UV fluences
anticipated for drinking water disinfection (p40mJ/cm2). Different water characteristics, in particular competitive
absorption by nitrate and possibly DOC, were most likely responsible for the differences in bromate removal in the
waters tested. The source water that did not show any removal had a higher nitrate concentration (4 vs. 0.1mg N/L)
and also a higher DOC concentration (4.1 vs. 3.1mg C/L) than the other source water which showed 19% bromate
removal.
r 2003 Elsevier Ltd. All rights reserved.
Keywords: Bromate; Drinking water; Medium-pressure UV–UV disinfection
1. Introduction
Bromate is formed as an ozonation by-product in
bromide-containing waters (e.g. [1,2]). Therefore, water
utilities that utilize ozonation as part of their treatment
process have to be concerned with the possibility of
elevated bromate concentrations. Bromate formation
depends on various factors including initial bromide
concentration, ozone dose, ozone residual and pH.
Bromate concentrations of up to 60mg/L have been
ing author. Tel.: +1-519-888-4567 ext. 3511;
6-7499.
ess: [email protected] (S. Peldszus).
e front matter r 2003 Elsevier Ltd. All rights reserve
atres.2003.09.010
observed following ozonation [3]. As a suspected
carcinogen, bromate is regulated in the United States
to 10 mg/L as of December 2001 [4]. Bull et al. [5]
reported a cancer risk of 10�4 (lifetime exposure) at a
bromate concentration of 5 mg/L, whereas the World
Health Organisation (WHO) [6] has a provisional
guideline value of 25 mg/L based on an excess lifetime
cancer risk of 7� 10�5.
Different approaches have been taken to reduce
bromate concentrations in drinking water. The majority
of studies have focused on optimizing ozonation
processes to minimize bromate formation (e.g., [3,7,8]).
In addition, removal of bromate after its formation has
also been investigated, although to a lesser extent [9–13].
d.
ARTICLE IN PRESSS. Peldszus et al. / Water Research 38 (2004) 211–217212
In the last few years UV disinfection of drinking water
has attracted increased interest, since it has been
demonstrated that Cryptosporidium parvum can be
inactivated by applying UV irradiation with either
low- or medium-pressure lamps at relatively low fluences
[14,15]. Waterworks employing ozone for reasons other
than disinfection (e.g. colour removal, taste and odour
control) may also use UV as their primary disinfection
process. One of the participants in this study is actually
in the process of installing full scale UV downstream of
their ozone application. As a consequence, in bromide-
containing waters, bromate may be present in the
influent of UV reactors.
However, little work has been done on bromate
removal in water by UV irradiation. Siddiqui et al. [9,10]
reported that application of low-pressure UV lamps in
bench scale studies led to lower bromate concentrations.
Mills et al. [11] investigated bromate removal by
semiconductor catalysis in the presence of low-pressure
UV irradiation. In control experiments, when employing
low-pressure UV alone, without the addition of the TiO2
catalyst, they observed bromate removals up to 80%
although only after irradiation times of almost 3 h [11].
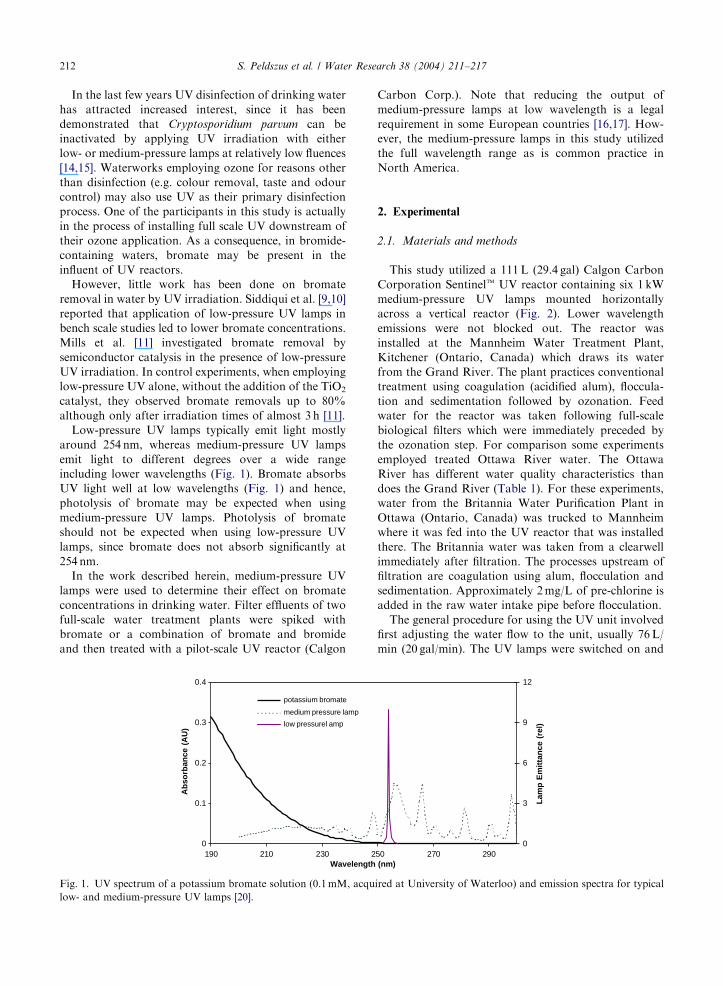
Low-pressure UV lamps typically emit light mostly
around 254 nm, whereas medium-pressure UV lamps
emit light to different degrees over a wide range
including lower wavelengths (Fig. 1). Bromate absorbs
UV light well at low wavelengths (Fig. 1) and hence,
photolysis of bromate may be expected when using
medium-pressure UV lamps. Photolysis of bromate
should not be expected when using low-pressure UV
lamps, since bromate does not absorb significantly at
254 nm.
In the work described herein, medium-pressure UV
lamps were used to determine their effect on bromate
concentrations in drinking water. Filter effluents of two
full-scale water treatment plants were spiked with
bromate or a combination of bromate and bromide
and then treated with a pilot-scale UV reactor (Calgon
0
0.1
0.2
0.3
0.4
190 210 230 2Wavelength
Ab
sorb
ance
(A
U)
potassium bromate
medium pressure lamp
low pressurel amp
Fig. 1. UV spectrum of a potassium bromate solution (0.1mM, acqu
low- and medium-pressure UV lamps [20].
Carbon Corp.). Note that reducing the output of
medium-pressure lamps at low wavelength is a legal
requirement in some European countries [16,17]. How-
ever, the medium-pressure lamps in this study utilized
the full wavelength range as is common practice in
North America.
2. Experimental
2.1. Materials and methods
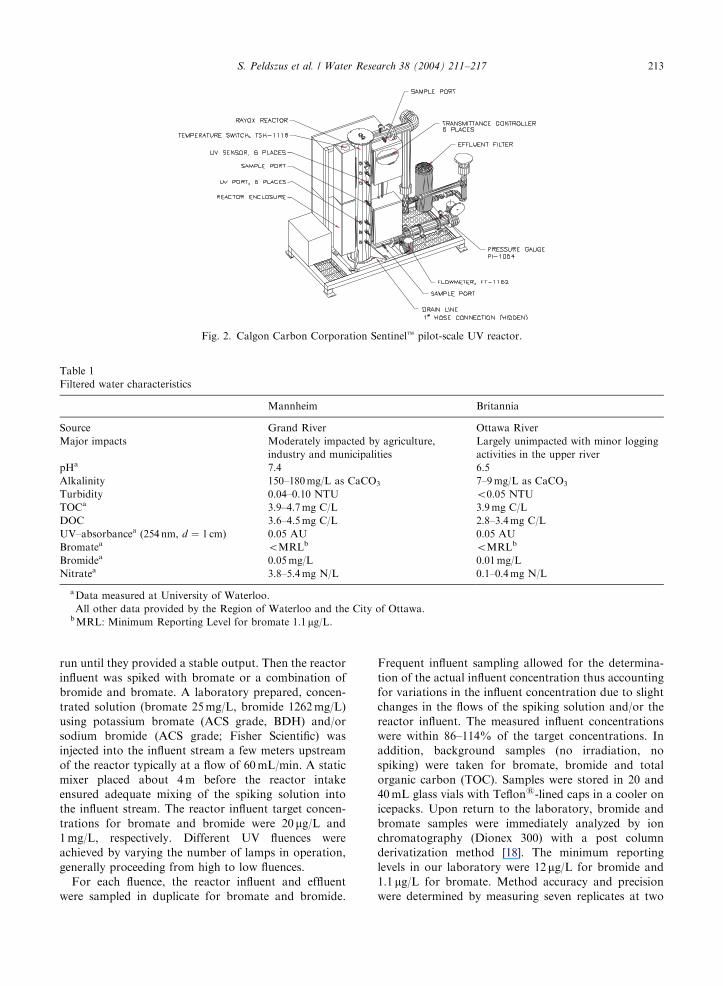
This study utilized a 111L (29.4 gal) Calgon Carbon
Corporation Sentinelt UV reactor containing six 1 kW
medium-pressure UV lamps mounted horizontally
across a vertical reactor (Fig. 2). Lower wavelength
emissions were not blocked out. The reactor was
installed at the Mannheim Water Treatment Plant,
Kitchener (Ontario, Canada) which draws its water
from the Grand River. The plant practices conventional
treatment using coagulation (acidified alum), floccula-
tion and sedimentation followed by ozonation. Feed
water for the reactor was taken following full-scale
biological filters which were immediately preceded by
the ozonation step. For comparison some experiments
employed treated Ottawa River water. The Ottawa
River has different water quality characteristics than
does the Grand River (Table 1). For these experiments,
water from the Britannia Water Purification Plant in
Ottawa (Ontario, Canada) was trucked to Mannheim
where it was fed into the UV reactor that was installed
there. The Britannia water was taken from a clearwell
immediately after filtration. The processes upstream of
filtration are coagulation using alum, flocculation and
sedimentation. Approximately 2mg/L of pre-chlorine is
added in the raw water intake pipe before flocculation.
The general procedure for using the UV unit involved
first adjusting the water flow to the unit, usually 76L/
min (20 gal/min). The UV lamps were switched on and
50 270 290 (nm)
0
3
6
9
12
Lam
p E
mit
tan
ce (
rel)
ired at University of Waterloo) and emission spectra for typical
ARTICLE IN PRESS
Fig. 2. Calgon Carbon Corporation Sentinelt pilot-scale UV reactor.
Table 1
Filtered water characteristics
Mannheim Britannia
Source Grand River Ottawa River
Major impacts Moderately impacted by agriculture,
industry and municipalities
Largely unimpacted with minor logging
activities in the upper river
pHa 7.4 6.5
Alkalinity 150–180mg/L as CaCO3 7–9mg/L as CaCO3
Turbidity 0.04–0.10 NTU o0.05 NTU
TOCa 3.9–4.7mg C/L 3.9mg C/L
DOC 3.6–4.5mg C/L 2.8–3.4mg C/L
UV–absorbancea (254 nm, d ¼ 1 cm) 0.05 AU 0.05 AU
Bromatea oMRLb oMRLb
Bromidea 0.05mg/L 0.01mg/L
Nitratea 3.8–5.4mg N/L 0.1–0.4mg N/L
aData measured at University of Waterloo.
All other data provided by the Region of Waterloo and the City of Ottawa.bMRL: Minimum Reporting Level for bromate 1.1 mg/L.
S. Peldszus et al. / Water Research 38 (2004) 211–217 213
run until they provided a stable output. Then the reactor
influent was spiked with bromate or a combination of
bromide and bromate. A laboratory prepared, concen-
trated solution (bromate 25mg/L, bromide 1262mg/L)
using potassium bromate (ACS grade, BDH) and/or
sodium bromide (ACS grade; Fisher Scientific) was
injected into the influent stream a few meters upstream
of the reactor typically at a flow of 60mL/min. A static
mixer placed about 4m before the reactor intake
ensured adequate mixing of the spiking solution into
the influent stream. The reactor influent target concen-
trations for bromate and bromide were 20mg/L and
1mg/L, respectively. Different UV fluences were
achieved by varying the number of lamps in operation,
generally proceeding from high to low fluences.
For each fluence, the reactor influent and effluent
were sampled in duplicate for bromate and bromide.
Frequent influent sampling allowed for the determina-
tion of the actual influent concentration thus accounting
for variations in the influent concentration due to slight
changes in the flows of the spiking solution and/or the
reactor influent. The measured influent concentrations
were within 86–114% of the target concentrations. In
addition, background samples (no irradiation, no
spiking) were taken for bromate, bromide and total
organic carbon (TOC). Samples were stored in 20 and
40mL glass vials with Teflons-lined caps in a cooler on
icepacks. Upon return to the laboratory, bromide and
bromate samples were immediately analyzed by ion
chromatography (Dionex 300) with a post column
derivatization method [18]. The minimum reporting
levels in our laboratory were 12mg/L for bromide and
1.1 mg/L for bromate. Method accuracy and precision
were determined by measuring seven replicates at two
ARTICLE IN PRESS
-25
0
25
50
75
100
0 100 200 300 400 500 600 700 800
Fluence (mJ/cm2)
Bro
mat
e R
emo
val (
%)
18/04/00, run a
18/04/00, run b
17/05/00, run a
17/05/00, run b
40 mJ/cm2
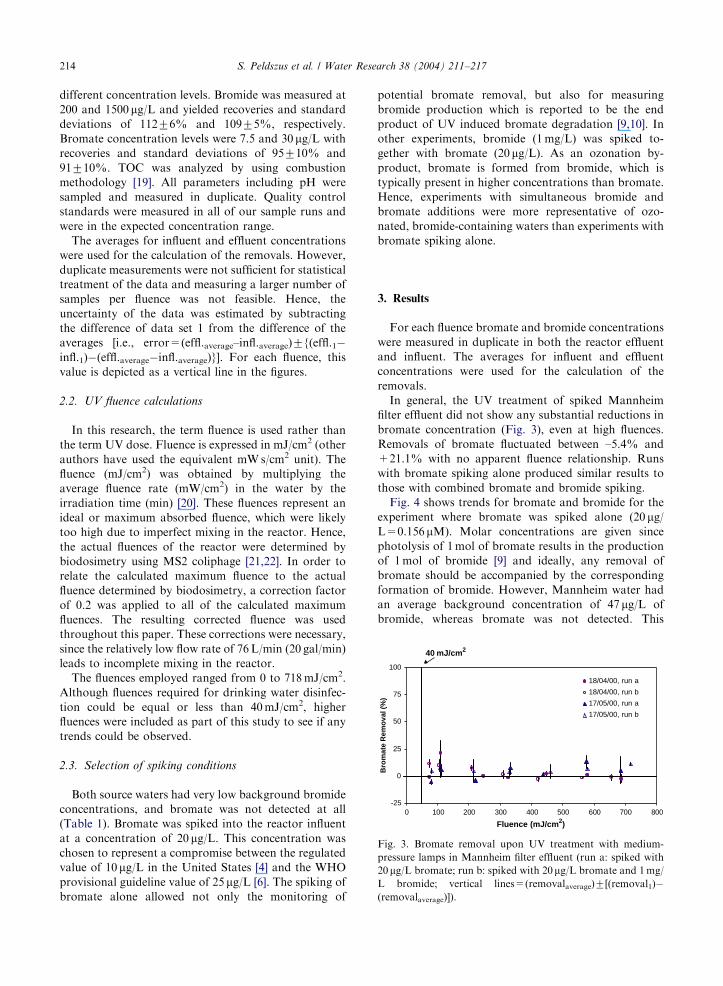
Fig. 3. Bromate removal upon UV treatment with medium-
pressure lamps in Mannheim filter effluent (run a: spiked with
20 mg/L bromate; run b: spiked with 20mg/L bromate and 1mg/
L bromide; vertical lines=(removalaverage)7[(removal1)�(removalaverage)]).
S. Peldszus et al. / Water Research 38 (2004) 211–217214
different concentration levels. Bromide was measured at
200 and 1500 mg/L and yielded recoveries and standard
deviations of 11276% and 10975%, respectively.
Bromate concentration levels were 7.5 and 30 mg/L with
recoveries and standard deviations of 95710% and
91710%. TOC was analyzed by using combustion
methodology [19]. All parameters including pH were
sampled and measured in duplicate. Quality control
standards were measured in all of our sample runs and
were in the expected concentration range.
The averages for influent and effluent concentrations
were used for the calculation of the removals. However,
duplicate measurements were not sufficient for statistical
treatment of the data and measuring a larger number of
samples per fluence was not feasible. Hence, the
uncertainty of the data was estimated by subtracting
the difference of data set 1 from the difference of the
averages [i.e., error=(effl.average–infl.average)7{(effl.1�infl.1)�(effl.average�infl.average)}]. For each fluence, this
value is depicted as a vertical line in the figures.
2.2. UV fluence calculations
In this research, the term fluence is used rather than
the term UV dose. Fluence is expressed in mJ/cm2 (other
authors have used the equivalent mWs/cm2 unit). The
fluence (mJ/cm2) was obtained by multiplying the
average fluence rate (mW/cm2) in the water by the
irradiation time (min) [20]. These fluences represent an
ideal or maximum absorbed fluence, which were likely
too high due to imperfect mixing in the reactor. Hence,
the actual fluences of the reactor were determined by
biodosimetry using MS2 coliphage [21,22]. In order to
relate the calculated maximum fluence to the actual
fluence determined by biodosimetry, a correction factor
of 0.2 was applied to all of the calculated maximum
fluences. The resulting corrected fluence was used
throughout this paper. These corrections were necessary,
since the relatively low flow rate of 76L/min (20 gal/min)
leads to incomplete mixing in the reactor.
The fluences employed ranged from 0 to 718mJ/cm2.
Although fluences required for drinking water disinfec-
tion could be equal or less than 40mJ/cm2, higher
fluences were included as part of this study to see if any
trends could be observed.
2.3. Selection of spiking conditions
Both source waters had very low background bromide
concentrations, and bromate was not detected at all
(Table 1). Bromate was spiked into the reactor influent
at a concentration of 20 mg/L. This concentration was
chosen to represent a compromise between the regulated
value of 10mg/L in the United States [4] and the WHO
provisional guideline value of 25 mg/L [6]. The spiking of
bromate alone allowed not only the monitoring of
potential bromate removal, but also for measuring
bromide production which is reported to be the end
product of UV induced bromate degradation [9,10]. In
other experiments, bromide (1mg/L) was spiked to-
gether with bromate (20 mg/L). As an ozonation by-
product, bromate is formed from bromide, which is
typically present in higher concentrations than bromate.
Hence, experiments with simultaneous bromide and
bromate additions were more representative of ozo-
nated, bromide-containing waters than experiments with
bromate spiking alone.
3. Results
For each fluence bromate and bromide concentrations
were measured in duplicate in both the reactor effluent
and influent. The averages for influent and effluent
concentrations were used for the calculation of the
removals.
In general, the UV treatment of spiked Mannheim
filter effluent did not show any substantial reductions in
bromate concentration (Fig. 3), even at high fluences.
Removals of bromate fluctuated between –5.4% and
+21.1% with no apparent fluence relationship. Runs
with bromate spiking alone produced similar results to
those with combined bromate and bromide spiking.
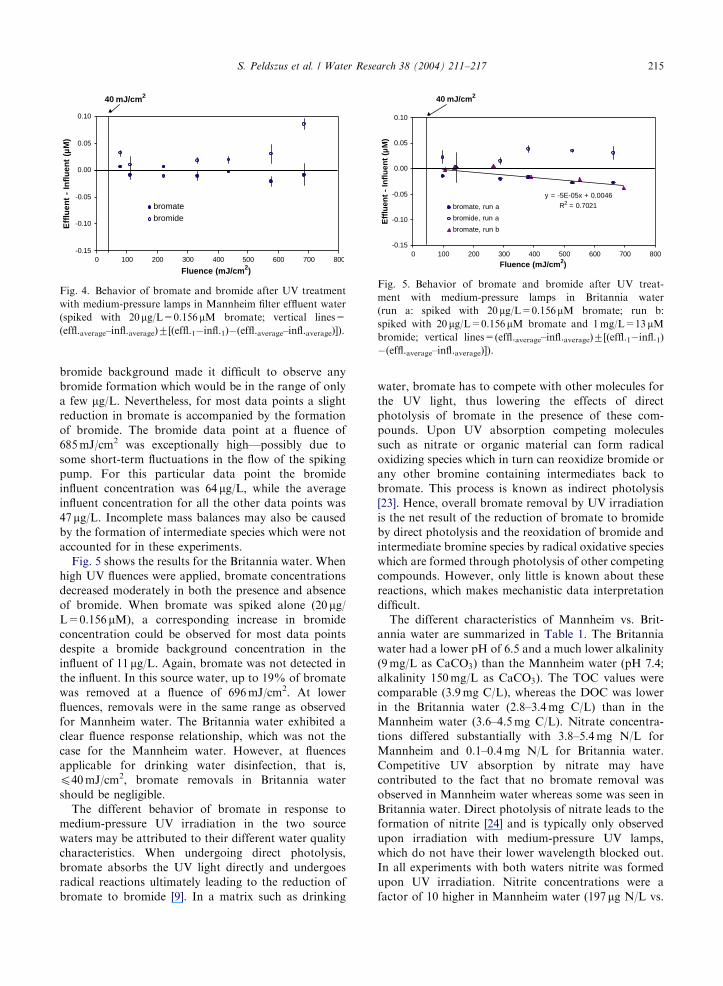
Fig. 4 shows trends for bromate and bromide for the
experiment where bromate was spiked alone (20 mg/L=0.156 mM). Molar concentrations are given since
photolysis of 1mol of bromate results in the production
of 1mol of bromide [9] and ideally, any removal of
bromate should be accompanied by the corresponding
formation of bromide. However, Mannheim water had
an average background concentration of 47 mg/L of
bromide, whereas bromate was not detected. This
ARTICLE IN PRESS
-0.15
-0.10
-0.05
0.00
0.05
0.10
0 100 200 300 400 500 600 700 800
Fluence (mJ/cm2)
Eff
luen
t -
Infl
uen
t (µ
M)
bromatebromide
40 mJ/cm2
Fig. 4. Behavior of bromate and bromide after UV treatment
with medium-pressure lamps in Mannheim filter effluent water
(spiked with 20mg/L=0.156 mM bromate; vertical lines=
(effl.average–infl.average)7[(effl.1�infl.1)�(effl.average–infl.average)]).
y = -5E-05x + 0.0046
R2 = 0.7021
-0.15
-0.10
-0.05
0.00
0.05
0.10
0 100 200 300 400 500 600 700 800
Fluence (mJ/cm2)
Eff
luen
t -
Infl
uen
t (µ
M)
bromate, run a
bromide, run a
bromate, run b
40 mJ/cm2
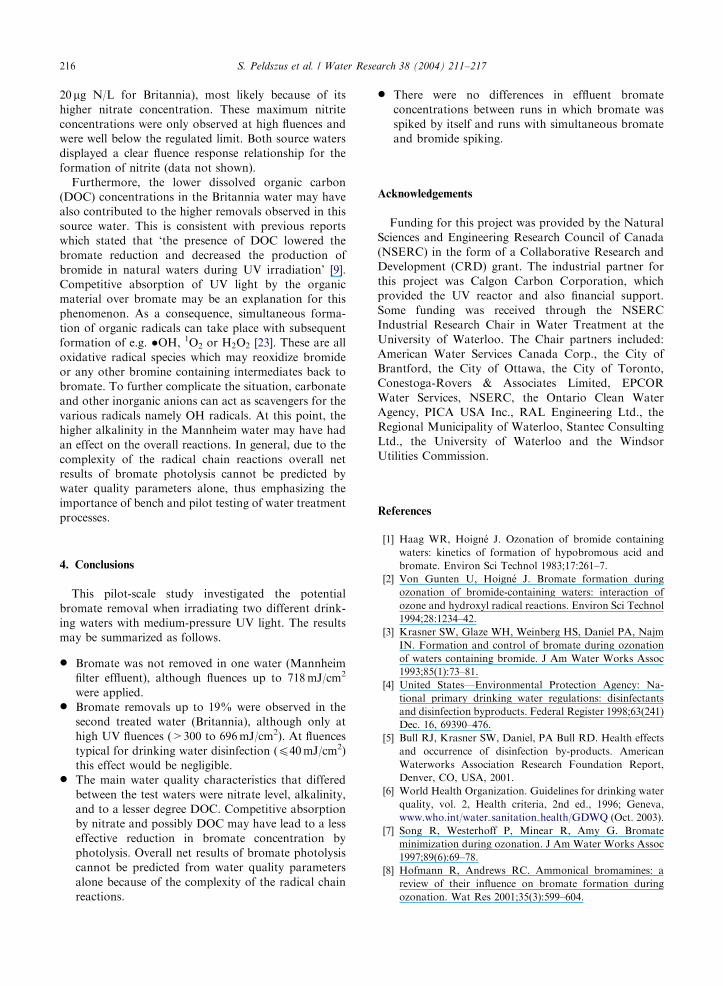
Fig. 5. Behavior of bromate and bromide after UV treat-
ment with medium-pressure lamps in Britannia water
(run a: spiked with 20 mg/L=0.156mM bromate; run b:
spiked with 20 mg/L=0.156mM bromate and 1mg/L=13 mMbromide; vertical lines=(effl.average–infl.average)7[(effl.1�infl.1)�(effl.average–infl.average)]).
S. Peldszus et al. / Water Research 38 (2004) 211–217 215
bromide background made it difficult to observe any
bromide formation which would be in the range of only
a few mg/L. Nevertheless, for most data points a slight
reduction in bromate is accompanied by the formation
of bromide. The bromide data point at a fluence of
685mJ/cm2 was exceptionally high—possibly due to
some short-term fluctuations in the flow of the spiking
pump. For this particular data point the bromide
influent concentration was 64 mg/L, while the average
influent concentration for all the other data points was
47mg/L. Incomplete mass balances may also be caused
by the formation of intermediate species which were not
accounted for in these experiments.
Fig. 5 shows the results for the Britannia water. When
high UV fluences were applied, bromate concentrations
decreased moderately in both the presence and absence
of bromide. When bromate was spiked alone (20 mg/L=0.156 mM), a corresponding increase in bromide
concentration could be observed for most data points
despite a bromide background concentration in the
influent of 11 mg/L. Again, bromate was not detected in
the influent. In this source water, up to 19% of bromate
was removed at a fluence of 696mJ/cm2. At lower
fluences, removals were in the same range as observed
for Mannheim water. The Britannia water exhibited a
clear fluence response relationship, which was not the
case for the Mannheim water. However, at fluences
applicable for drinking water disinfection, that is,
p40mJ/cm2, bromate removals in Britannia water
should be negligible.
The different behavior of bromate in response to
medium-pressure UV irradiation in the two source
waters may be attributed to their different water quality
characteristics. When undergoing direct photolysis,
bromate absorbs the UV light directly and undergoes
radical reactions ultimately leading to the reduction of
bromate to bromide [9]. In a matrix such as drinking
water, bromate has to compete with other molecules for
the UV light, thus lowering the effects of direct
photolysis of bromate in the presence of these com-
pounds. Upon UV absorption competing molecules
such as nitrate or organic material can form radical
oxidizing species which in turn can reoxidize bromide or
any other bromine containing intermediates back to
bromate. This process is known as indirect photolysis
[23]. Hence, overall bromate removal by UV irradiation
is the net result of the reduction of bromate to bromide
by direct photolysis and the reoxidation of bromide and
intermediate bromine species by radical oxidative species
which are formed through photolysis of other competing
compounds. However, only little is known about these
reactions, which makes mechanistic data interpretation
difficult.
The different characteristics of Mannheim vs. Brit-
annia water are summarized in Table 1. The Britannia
water had a lower pH of 6.5 and a much lower alkalinity
(9mg/L as CaCO3) than the Mannheim water (pH 7.4;
alkalinity 150mg/L as CaCO3). The TOC values were
comparable (3.9mg C/L), whereas the DOC was lower
in the Britannia water (2.8–3.4mg C/L) than in the
Mannheim water (3.6–4.5mg C/L). Nitrate concentra-
tions differed substantially with 3.8–5.4mg N/L for
Mannheim and 0.1–0.4mg N/L for Britannia water.
Competitive UV absorption by nitrate may have
contributed to the fact that no bromate removal was
observed in Mannheim water whereas some was seen in
Britannia water. Direct photolysis of nitrate leads to the
formation of nitrite [24] and is typically only observed
upon irradiation with medium-pressure UV lamps,
which do not have their lower wavelength blocked out.
In all experiments with both waters nitrite was formed
upon UV irradiation. Nitrite concentrations were a
factor of 10 higher in Mannheim water (197mg N/L vs.
ARTICLE IN PRESSS. Peldszus et al. / Water Research 38 (2004) 211–217216
20mg N/L for Britannia), most likely because of its
higher nitrate concentration. These maximum nitrite
concentrations were only observed at high fluences and
were well below the regulated limit. Both source waters
displayed a clear fluence response relationship for the
formation of nitrite (data not shown).
Furthermore, the lower dissolved organic carbon
(DOC) concentrations in the Britannia water may have
also contributed to the higher removals observed in this
source water. This is consistent with previous reports
which stated that ‘the presence of DOC lowered the
bromate reduction and decreased the production of
bromide in natural waters during UV irradiation’ [9].
Competitive absorption of UV light by the organic
material over bromate may be an explanation for this
phenomenon. As a consequence, simultaneous forma-
tion of organic radicals can take place with subsequent
formation of e.g. �OH, 1O2 or H2O2 [23]. These are all
oxidative radical species which may reoxidize bromide
or any other bromine containing intermediates back to
bromate. To further complicate the situation, carbonate
and other inorganic anions can act as scavengers for the
various radicals namely OH radicals. At this point, the
higher alkalinity in the Mannheim water may have had
an effect on the overall reactions. In general, due to the
complexity of the radical chain reactions overall net
results of bromate photolysis cannot be predicted by
water quality parameters alone, thus emphasizing the
importance of bench and pilot testing of water treatment
processes.
4. Conclusions
This pilot-scale study investigated the potential
bromate removal when irradiating two different drink-
ing waters with medium-pressure UV light. The results
may be summarized as follows.
* Bromate was not removed in one water (Mannheim
filter effluent), although fluences up to 718mJ/cm2
were applied.* Bromate removals up to 19% were observed in the
second treated water (Britannia), although only at
high UV fluences (>300 to 696mJ/cm2). At fluences
typical for drinking water disinfection (p40mJ/cm2)
this effect would be negligible.* The main water quality characteristics that differed
between the test waters were nitrate level, alkalinity,
and to a lesser degree DOC. Competitive absorption
by nitrate and possibly DOC may have lead to a less
effective reduction in bromate concentration by
photolysis. Overall net results of bromate photolysis
cannot be predicted from water quality parameters
alone because of the complexity of the radical chain
reactions.
* There were no differences in effluent bromate
concentrations between runs in which bromate was
spiked by itself and runs with simultaneous bromate
and bromide spiking.
Acknowledgements
Funding for this project was provided by the Natural
Sciences and Engineering Research Council of Canada
(NSERC) in the form of a Collaborative Research and
Development (CRD) grant. The industrial partner for
this project was Calgon Carbon Corporation, which
provided the UV reactor and also financial support.
Some funding was received through the NSERC
Industrial Research Chair in Water Treatment at the
University of Waterloo. The Chair partners included:
American Water Services Canada Corp., the City of
Brantford, the City of Ottawa, the City of Toronto,
Conestoga-Rovers & Associates Limited, EPCOR
Water Services, NSERC, the Ontario Clean Water
Agency, PICA USA Inc., RAL Engineering Ltd., the
Regional Municipality of Waterloo, Stantec Consulting
Ltd., the University of Waterloo and the Windsor
Utilities Commission.
References
[1] Haag WR, Hoign!e J. Ozonation of bromide containing
waters: kinetics of formation of hypobromous acid and
bromate. Environ Sci Technol 1983;17:261–7.
[2] Von Gunten U, Hoign!e J. Bromate formation during
ozonation of bromide-containing waters: interaction of
ozone and hydroxyl radical reactions. Environ Sci Technol
1994;28:1234–42.
[3] Krasner SW, Glaze WH, Weinberg HS, Daniel PA, Najm
IN. Formation and control of bromate during ozonation
of waters containing bromide. J Am Water Works Assoc
1993;85(1):73–81.
[4] United States—Environmental Protection Agency: Na-
tional primary drinking water regulations: disinfectants
and disinfection byproducts. Federal Register 1998;63(241)
Dec. 16, 69390–476.
[5] Bull RJ, Krasner SW, Daniel, PA Bull RD. Health effects
and occurrence of disinfection by-products. American
Waterworks Association Research Foundation Report,
Denver, CO, USA, 2001.
[6] World Health Organization. Guidelines for drinking water
quality, vol. 2, Health criteria, 2nd ed., 1996; Geneva,
www.who.int/water sanitation health/GDWQ (Oct. 2003).
[7] Song R, Westerhoff P, Minear R, Amy G. Bromate
minimization during ozonation. J Am Water Works Assoc
1997;89(6):69–78.
[8] Hofmann R, Andrews RC. Ammonical bromamines: a
review of their influence on bromate formation during
ozonation. Wat Res 2001;35(3):599–604.
ARTICLE IN PRESSS. Peldszus et al. / Water Research 38 (2004) 211–217 217
[9] Siddiqui M, Amy G, Ozekin K, Zhai W, Westerhoff P.
Alternative strategies for removing bromate. J Am Water
Works Assoc 1994;86(10):81–96.
[10] Siddiqui M, Amy G, Zhai W, Ozekin K, Westerhoff P,
Chandrakanth M. Removal of bromate after ozonation
during drinking water treatment. Proceedings American
Water Works Association Annual Conference, New York,
NY, 1994. p. 881–905.
[11] Mills A, Belghazi A, Rodman D. Bromate removal from
drinking water by semiconductor photocatalysis. Wat Res
1996;30(9):1973–8.
[12] Hijnen WAM, Jong R, van der Kooij D. Bromate removal
in a denitrifying bioreactor used in water treatment. Wat
Res 1999;33(4):1049–53.
[13] Gordon G, Gauw RD, Emmert GL, Walters BD, Bubnis
B. Chemical reduction methods for bromate ion removal. J
Am Water Works Assoc 2002;94(2):91–8.
[14] Bolton JR, Dussert B, Bukhari Z, Hargy T, Clancy JL.
Inactivation of Cryptosporidium parvum by medium-
pressure ultraviolet light in finished drinking water.
Proceedings, American Water Works Association Annual
Conference, Dallas, TX, vol. A, 1998. p. 389–403.
[15] Clancy JL, Bukhari Z, Hargy TM, Bolton JR, Dussert
BW, Marshall MM. Using UV to inactivate Cryptospor-
idium. J Am Water Works Assoc 2000;92(9):97–104.
[16] DVGW. German association on gas and water technical
standard W 294: UV systems for disinfection in drinking
water supplies—requirements and testing. DVGW stan-
dards and Guidelines, Bonn, Germany, 1997, http://
www.DVGW.de.
[17] .ONORM. Plants for the disinfection of water using
ultraviolet radiation: Requirements and testing..Osterreichisches Normungsinstitut, Vienna, Austria,
2001, http://www.on-norm.at.
[18] Salhi E, von Gunten U. Simultaneous determination of
bromide, bromate and nitrite in low mg/L levels by ion
chromatography without sample pretreatment. Wat Res
1999;33(15):3239–44.
[19] American Public Health Association, American Water
Works Association, Water Environment Federation.
Standard methods for the examination of water and
wastewater, 20th ed., 1998.
[20] Bolton JR, Linden KG. Standardization of methods
for fluence (UV dose) determination in bench-
scale UV experiments. J Environ Engr 2003;129(3):
209–16.
[21] Bolton JR. Report on UV dose test carried out on the
Calgon Carbon UV Reactor at the Mannheim Water
Treatment Plant. Report for Calgon Carbon Corporation,
Bolton Photosciences Inc., 628 Cheriton Cres. NW,
Edmonton, Alberta, Canada T6R 2M5, 2001.
[22] NWRI/AWWARF. Ultraviolet Disinfection Guidelines
for Drinking Water and Water Reuse. National
Water Research Institute, Fountain Valley, CA, USA,
2000.
[23] Halmann MM. Photodegradation of water pollutants.
Boca Raton, FL, USA: CRC Press; 1996.
[24] Mack J, Bolton JR. Photochemistry of nitrite and nitrate
in aqueous solution: a review. J Photobiol Photochem A
1999;128:1–13.
Related Documents