Talanta 76 (2008) 172–182 Contents lists available at ScienceDirect Talanta journal homepage: www.elsevier.com/locate/talanta Effect of long-term storage and use on the properties of reversed-phase liquid chromatographic columns Erik Haghedooren a , Edit Farkas b , ´ Agnes Kerner c , Sanja Dragovic a ,B´ ela Nosz ´ al d , Jos Hoogmartens a , Erwin Adams a,∗ a Katholieke Universiteit Leuven, Laboratorium voor Farmaceutische Analyse, O&N, 2, PB 923, Herestraat 49, B-3000 Leuven, Belgium b Semmelweis University, Department of Pharmaceutics, H˝ ogyes E. u. 7, H-1092 Budapest, Hungary c National Institute of Forensic Toxicology, Varann´ o u. 2-4, H-1146 Budapest, Hungary d Semmelweis University, Department of Pharmaceutical Chemistry, H˝ ogyes E. u. 9, H-1092 Budapest, Hungary article info Article history: Received 20 April 2007 Received in revised form 8 February 2008 Accepted 20 February 2008 Available online 4 March 2008 Keywords: Reversed-phase liquid chromatography Column characterisation Chromatographic tests Column classification Long-term usage Storage abstract In order to study column deterioration as a result of long-term storage and/or usage in liquid chromatog- raphy analyses, 55 pairs (same batch) of different commercial reversed-phase C 18 columns were examined using an already existing column characterisation system. After initial testing, one column was stored and the other was used to analyse different pharmaceuticals. All columns were characterized by four chro- matographic parameters reflecting hydrophobicity, silanol activity, metal impurity and steric selectivity at the beginning and at the end of the test. An F-value was calculated to express the change of column prop- erties with one single number. After performing analyses, higher F-values were obtained as compared to the non-used, stored columns. Although the time during which the columns were used to perform analyses was relatively short, an obvious influence was noticed, mainly resulting from small changes in silanol activity and hydrophobicity. Most of the affected columns have no endcapping and/or no base deactivation, making them more vulnerable for degradation, resulting in higher silanol activity and faster ageing. This effect is observed less with columns equipped with polar-embedded groups and/or polar endcapping, protecting the column by blocking the silanol groups and attracting a shielding water layer. Also columns with higher coverages and bulky or long chains show more resistance towards degradation. © 2008 Elsevier B.V. All rights reserved. 1. Introduction The variety of available stationary phases provide different selectivities and as a consequence, the search for a suitable column for a particular reversed-phase liquid chromatographic (RP-LC) separation may be complicated [1]. Although many silica gel-based RP columns can be considered as nominally identical, previous studies demonstrated significant differences between them [2–4]. Since there is a lack of unified, exact information from the manu- facturers, which allows easy classification of RP-LC phases, several column characterisation tests were developed based on destructive, spectroscopic or chromatographic methods. Subtle differences, which may have decisive impact on the separation process, can be measured principally by a chromatographic characterisation method [4–10]. After selecting the suitable type of stationary phase, the lifetime of the RP column is an important parameter for analysts, which is ∗ Corresponding author. Tel.: +32 16 323444; fax: +32 16 323448. E-mail address: [email protected] (E. Adams). often expressed in number of injections performed under a certain condition of analysis. In the literature, accelerated stability tests to study column ageing are described [11,12]. It was shown earlier that aqueous mobile phases above pH 8 could markedly enhance degradation of the silica support. High pH mainly attacks the sil- ica backbone, whereas the hydrolysis of the bonded phase is not considerable. Further investigation proved that the degradation is strongly affected by the type and purity of the silica support and also influenced by the nature of the bonded silane [13]. Enhanced column stability was observed with certain endcapped and densely bonded phase columns, where double endcapping appeared to be superior to single endcapping. Deterioration of stationary phase also depends on the nature of both the buffer salts and the organic modifier. The addition of an organic modifier to the aqueous buffer solution can result in a change of the apparent pH. The lifetime of the column can be influenced by the usage of organic buffers instead of inorganic ones [14,15]. Also, when the mobile phase con- tains a high percentage of organic solvent (70–80%) the dissolution of silica at high pH is lower [16]. At low pH, enhanced hydrolysis of the siloxane bond between the organosilane and the silica surface was observed. The ligand chain length, functionality and bonding 0039-9140/$ – see front matter © 2008 Elsevier B.V. All rights reserved. doi:10.1016/j.talanta.2008.02.020

Welcome message from author
This document is posted to help you gain knowledge. Please leave a comment to let me know what you think about it! Share it to your friends and learn new things together.
Transcript
Talanta 76 (2008) 172–182
Contents lists available at ScienceDirect
Talanta
journa l homepage: www.e lsev ier .com/ locate / ta lanta
Effect of long-term storage and use on the properties of reversed-phase liquidchromatographic columns
Erik Haghedoorena, Edit Farkasb, Agnes Kernerc, Sanja Dragovica, Bela Noszald,
Jos Hoogmartensa, Erwin Adamsa,∗a Katholieke Universiteit Leuven, Laboratorium voor Farmaceutische Analyse, O&N, 2, PB 923, Herestraat 49, B-3000 Leuven, Belgiumb Semmelweis University, Department of Pharmaceutics, Hogyes E. u. 7, H-1092 Budapest, Hungaryc National Institute of Forensic Toxicology, Varanno u. 2-4, H-1146 Budapest, Hungaryd 092 Bu
eteriame bolumlyse
eflectnd ofmberolumort, aphobmor
rvede colucover
Semmelweis University, Department of Pharmaceutical Chemistry, Hogyes E. u. 9, H-1
a r t i c l e i n f o
Article history:Received 20 April 2007Received in revised form 8 February 2008Accepted 20 February 2008Available online 4 March 2008
Keywords:Reversed-phase liquid chromatographyColumn characterisationChromatographic testsColumn classificationLong-term usageStorage
a b s t r a c t
In order to study column draphy analyses, 55 pairs (susing an already existing cthe other was used to anamatographic parameters rthe beginning and at the eerties with one single nuto the non-used, stored canalyses was relatively shsilanol activity and hydrodeactivation, making themageing. This effect is obseendcapping, protecting thAlso columns with higher
1. Introduction
The variety of available stationary phases provide differentselectivities and as a consequence, the search for a suitable columnfor a particular reversed-phase liquid chromatographic (RP-LC)separation may be complicated [1]. Although many silica gel-basedRP columns can be considered as nominally identical, previousstudies demonstrated significant differences between them [2–4].Since there is a lack of unified, exact information from the manu-facturers, which allows easy classification of RP-LC phases, severalcolumn characterisation tests were developed based on destructive,spectroscopic or chromatographic methods. Subtle differences,which may have decisive impact on the separation process, canbe measured principally by a chromatographic characterisationmethod [4–10].
After selecting the suitable type of stationary phase, the lifetimeof the RP column is an important parameter for analysts, which is
∗ Corresponding author. Tel.: +32 16 323444; fax: +32 16 323448.E-mail address: [email protected] (E. Adams).
0039-9140/$ – see front matter © 2008 Elsevier B.V. All rights reserved.doi:10.1016/j.talanta.2008.02.020
dapest, Hungary
oration as a result of long-term storage and/or usage in liquid chromatog-atch) of different commercial reversed-phase C18 columns were examinedn characterisation system. After initial testing, one column was stored anddifferent pharmaceuticals. All columns were characterized by four chro-ing hydrophobicity, silanol activity, metal impurity and steric selectivity atthe test. An F-value was calculated to express the change of column prop-
. After performing analyses, higher F-values were obtained as comparedns. Although the time during which the columns were used to performn obvious influence was noticed, mainly resulting from small changes inicity. Most of the affected columns have no endcapping and/or no basee vulnerable for degradation, resulting in higher silanol activity and fasterless with columns equipped with polar-embedded groups and/or polarmn by blocking the silanol groups and attracting a shielding water layer.ages and bulky or long chains show more resistance towards degradation.
© 2008 Elsevier B.V. All rights reserved.
often expressed in number of injections performed under a certaincondition of analysis. In the literature, accelerated stability teststo study column ageing are described [11,12]. It was shown earlierthat aqueous mobile phases above pH 8 could markedly enhancedegradation of the silica support. High pH mainly attacks the sil-ica backbone, whereas the hydrolysis of the bonded phase is notconsiderable. Further investigation proved that the degradation isstrongly affected by the type and purity of the silica support andalso influenced by the nature of the bonded silane [13]. Enhancedcolumn stability was observed with certain endcapped and denselybonded phase columns, where double endcapping appeared to besuperior to single endcapping. Deterioration of stationary phasealso depends on the nature of both the buffer salts and the organicmodifier. The addition of an organic modifier to the aqueous buffersolution can result in a change of the apparent pH. The lifetimeof the column can be influenced by the usage of organic buffersinstead of inorganic ones [14,15]. Also, when the mobile phase con-tains a high percentage of organic solvent (70–80%) the dissolutionof silica at high pH is lower [16]. At low pH, enhanced hydrolysis ofthe siloxane bond between the organosilane and the silica surfacewas observed. The ligand chain length, functionality and bonding
Talan
Sam
Ben
2,2′
Ura
e mix
ufacturer. After that, the second and subsequent columns werecharacterised. For the determination of the parameters after storageor performance of the separations (retest), the same chromato-graphic equipment was used as the first time.
Autoscaling of the data was performed to proceed in furthercalculations with four parameters with the same magnitude andrange. After the calculation of an averaged value from the threechromatograms and a S.D. for each parameter, each single valuewas autoscaled:
E. Haghedooren et al. /
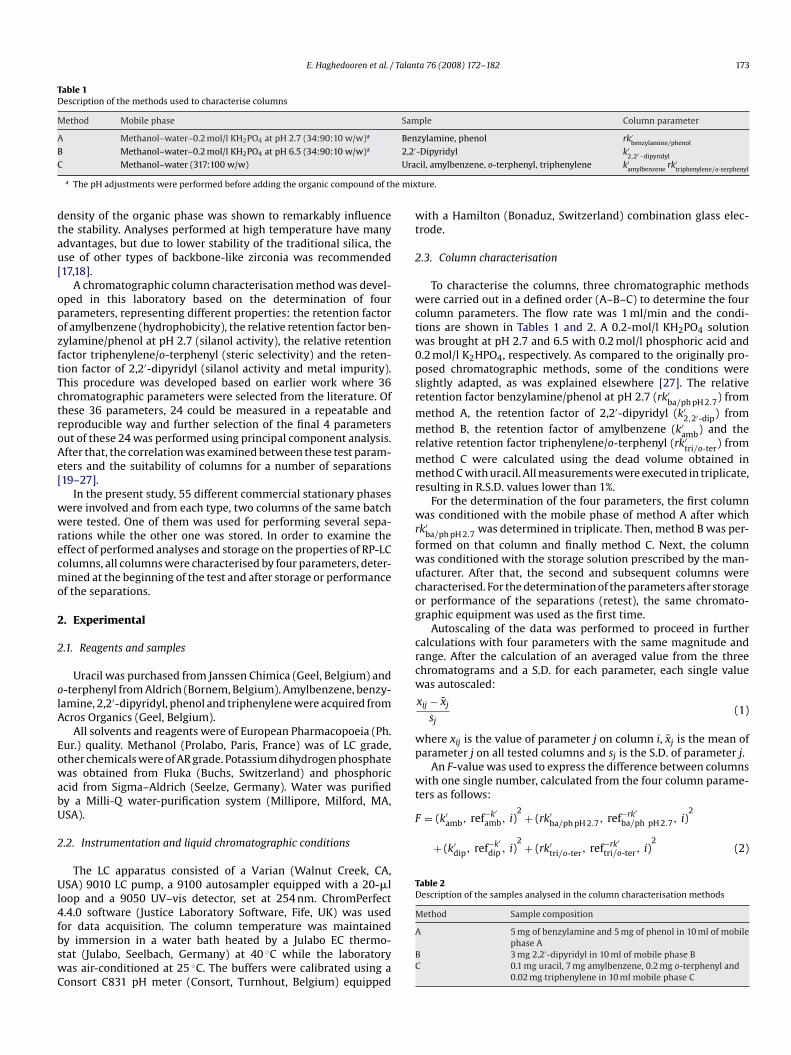
Table 1Description of the methods used to characterise columns
Method Mobile phase
A Methanol–water–0.2 mol/l KH2PO4 at pH 2.7 (34:90:10 w/w)a
B Methanol–water–0.2 mol/l KH2PO4 at pH 6.5 (34:90:10 w/w)a
C Methanol–water (317:100 w/w)
a The pH adjustments were performed before adding the organic compound of th
density of the organic phase was shown to remarkably influencethe stability. Analyses performed at high temperature have manyadvantages, but due to lower stability of the traditional silica, theuse of other types of backbone-like zirconia was recommended[17,18].
A chromatographic column characterisation method was devel-oped in this laboratory based on the determination of fourparameters, representing different properties: the retention factorof amylbenzene (hydrophobicity), the relative retention factor ben-zylamine/phenol at pH 2.7 (silanol activity), the relative retentionfactor triphenylene/o-terphenyl (steric selectivity) and the reten-tion factor of 2,2′-dipyridyl (silanol activity and metal impurity).This procedure was developed based on earlier work where 36chromatographic parameters were selected from the literature. Ofthese 36 parameters, 24 could be measured in a repeatable andreproducible way and further selection of the final 4 parametersout of these 24 was performed using principal component analysis.After that, the correlation was examined between these test param-eters and the suitability of columns for a number of separations[19–27].
In the present study, 55 different commercial stationary phaseswere involved and from each type, two columns of the same batchwere tested. One of them was used for performing several sepa-rations while the other one was stored. In order to examine theeffect of performed analyses and storage on the properties of RP-LCcolumns, all columns were characterised by four parameters, deter-mined at the beginning of the test and after storage or performanceof the separations.
2. Experimental
2.1. Reagents and samples
Uracil was purchased from Janssen Chimica (Geel, Belgium) ando-terphenyl from Aldrich (Bornem, Belgium). Amylbenzene, benzy-
lamine, 2,2′-dipyridyl, phenol and triphenylene were acquired fromAcros Organics (Geel, Belgium).All solvents and reagents were of European Pharmacopoeia (Ph.Eur.) quality. Methanol (Prolabo, Paris, France) was of LC grade,other chemicals were of AR grade. Potassium dihydrogen phosphatewas obtained from Fluka (Buchs, Switzerland) and phosphoricacid from Sigma–Aldrich (Seelze, Germany). Water was purifiedby a Milli-Q water-purification system (Millipore, Milford, MA,USA).
2.2. Instrumentation and liquid chromatographic conditions
The LC apparatus consisted of a Varian (Walnut Creek, CA,USA) 9010 LC pump, a 9100 autosampler equipped with a 20-�lloop and a 9050 UV–vis detector, set at 254 nm. ChromPerfect4.4.0 software (Justice Laboratory Software, Fife, UK) was usedfor data acquisition. The column temperature was maintainedby immersion in a water bath heated by a Julabo EC thermo-stat (Julabo, Seelbach, Germany) at 40 ◦C while the laboratorywas air-conditioned at 25 ◦C. The buffers were calibrated using aConsort C831 pH meter (Consort, Turnhout, Belgium) equipped
ta 76 (2008) 172–182 173
ple Column parameter
zylamine, phenol rk′benzylamine/phenol
-Dipyridyl k′2,2′−dipyridyl
cil, amylbenzene, o-terphenyl, triphenylene k′amylbenzene
rk′triphenylene/o-terphenyl
ture.
with a Hamilton (Bonaduz, Switzerland) combination glass elec-trode.
2.3. Column characterisation
To characterise the columns, three chromatographic methodswere carried out in a defined order (A–B–C) to determine the fourcolumn parameters. The flow rate was 1 ml/min and the condi-tions are shown in Tables 1 and 2. A 0.2-mol/l KH2PO4 solutionwas brought at pH 2.7 and 6.5 with 0.2 mol/l phosphoric acid and0.2 mol/l K2HPO4, respectively. As compared to the originally pro-posed chromatographic methods, some of the conditions wereslightly adapted, as was explained elsewhere [27]. The relativeretention factor benzylamine/phenol at pH 2.7 (rk′
ba/ph pH 2.7) frommethod A, the retention factor of 2,2′-dipyridyl (k′
2,2′-dip) frommethod B, the retention factor of amylbenzene (k′
amb) and therelative retention factor triphenylene/o-terphenyl (rk′
tri/o-ter) frommethod C were calculated using the dead volume obtained inmethod C with uracil. All measurements were executed in triplicate,resulting in R.S.D. values lower than 1%.
For the determination of the four parameters, the first columnwas conditioned with the mobile phase of method A after whichrk′
ba/ph pH 2.7 was determined in triplicate. Then, method B was per-formed on that column and finally method C. Next, the columnwas conditioned with the storage solution prescribed by the man-
xij − xj
sj(1)
where xij is the value of parameter j on column i, xj is the mean ofparameter j on all tested columns and sj is the S.D. of parameter j.
An F-value was used to express the difference between columnswith one single number, calculated from the four column parame-ters as follows:
F = (k′amb, ref−k′
amb, i)2 + (rk′
ba/ph pH 2.7, ref−rk′ba/ph pH 2.7, i)
2
+ (k′dip, ref−k′
dip , i)2 + (rk′
tri/o-ter, ref−rk′tri/o-ter, i)
2(2)
Table 2Description of the samples analysed in the column characterisation methods
Method Sample composition
A 5 mg of benzylamine and 5 mg of phenol in 10 ml of mobilephase A
B 3 mg 2,2′-dipyridyl in 10 ml of mobile phase BC 0.1 mg uracil, 7 mg amylbenzene, 0.2 mg o-terphenyl and
0.02 mg triphenylene in 10 ml mobile phase C
Talan
174 E. Haghedooren et al. /The F-value of a column i equals the sum of squares of the differ-ences between each parameter value of the reference column andof column i. The smaller the F-value, the more similar is column ito the reference column.
2.4. Chromatographic conditions of separations
All mobile phases were degassed by sparging with helium. Thestationary phase was kept at the right temperature by immersionin a water bath. For a particular analysis, the mobile phase, eventhe gradient, was the same for all columns. So, no adaptation wasmade in order to obtain similar retention times on all columns.
2.4.1. Analysis of tetracyclineThe mobile phase consisted of acetonitrile, 0.3 mol/l tetrabutyl
ammonium (TBA) pH 7.5, 0.3 mol/l ethylenediaminetetraacetic acid(EDTA) pH 7.5, water for the mobile phases: (A) (12:35:35:18 v/v)and (B) (30:35:35:0 v/v). Gradient program used 0–15 min, 5% ofB (isocratic); 15–45 min, 5–75% of B (linear gradient); 45–65 min,75% of B (isocratic) and 65–80 min, 75–5% of B (linear gradi-ent). The EDTA and TBA solutions were adjusted to the requiredpH with concentrated ammonia before bringing up to volume.Since a small change in the temperature within a sufficiently widerange around the selected operating conditions does not affect theseparation of the critical pair of tetracycline (TC) and 2-acetyl-2-decarboxamidotetracycline, the temperature was lowered from40.0 ◦C to 35.0 ◦C, to protect the columns. On the other hand, as therun time for TC on all the columns could not be predicted, the lastisocratic step was prolonged to 65 min instead of the prescribed45 min. Other chromatographic conditions were kept the same aspublished [28]. A flow rate of 1.0 ml/min was used and UV-detectionwas performed at 280 nm.
2.4.2. Analysis of erythromycinThe mobile phase consisted of acetonitrile, 0.2 mol/l potassium
phosphate pH 7.5 and water (35:5:65 v/v). The flow rate was1.0 ml/min. The detector was set at 210 nm and the column waskept at 65.0 ◦C [29].
2.4.3. Analysis of fluoxetine hydrochlorideThe Ph. Eur. method prescribes a mobile phase consisting of
methanol–tetrahydrofuran–triethylammonium phosphate buffer
(8:30:62 v/v). The buffer was prepared by adding 980 ml of waterto 10 ml of triethylamine, adjusting to pH 6.0 with phosphoric acidand diluting to 1000 ml with water. The flow rate was 1.0 ml/min.The detector was set at 215 nm and the column was kept at 30.0 ◦C[30].2.4.4. Analysis of gemcitabine hydrochlorideThe United States Pharmacopeia (USP) method was applied with
some slight modifications since the mixing of a pure organic sol-vent with an aqueous solution can cause problems. So, premixedeluents were prepared as follows: eluent A consisted of 97% ofsolution A (a filtered and degassed solution containing 13.8 g ofanhydrous monobasic sodium phosphate and 2.5 ml of phospho-ric acid in 1000 ml of water) and 3% of solution B (filtered anddegassed methanol). Eluent B was pure methanol. The pH of solu-tion A was checked to be 2.45–2.55 (2.4–2.6 was prescribed). Thegradient program was adapted as follows: 0–8 min, 100% eluent A;8–13 min, from 100% eluent A to 50% eluent A; 13–20 min, 50% elu-ent A; 20–25 min, from 50% eluent A to 100% eluent A. The flow ratewas 1.2 ml/min. The detector was set at 275 nm and the column waskept at 25.0 ◦C [31].
ta 76 (2008) 172–182
2.5. Column examination
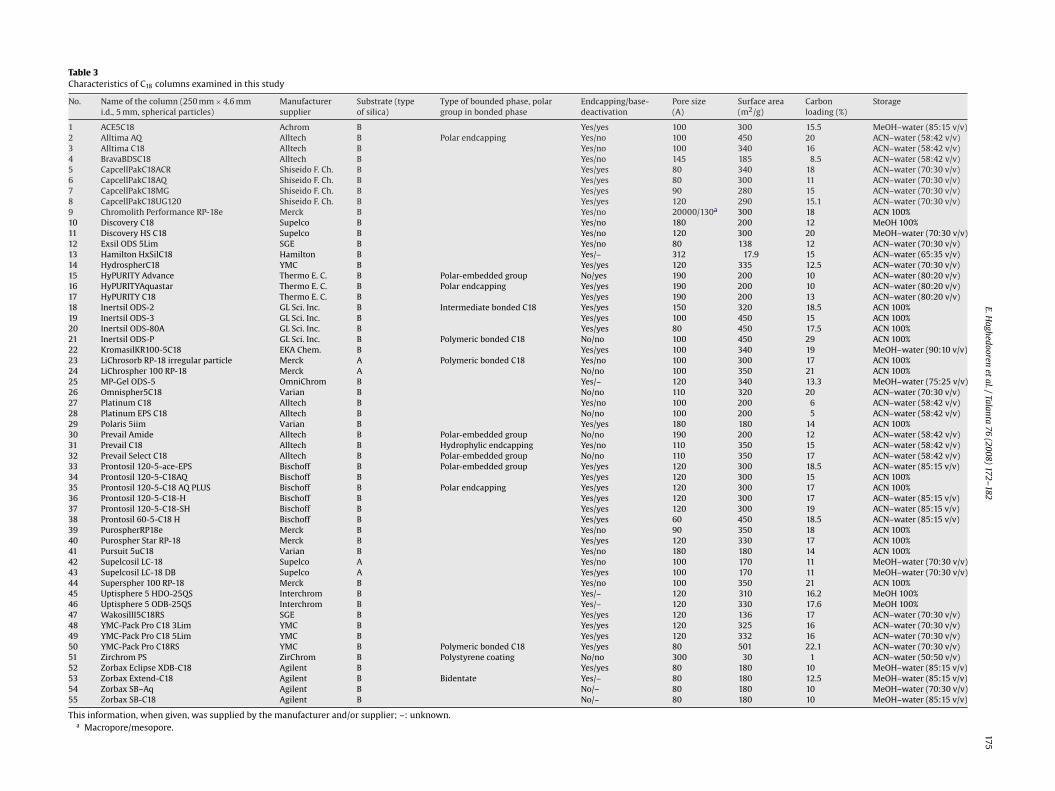
A set of 55 RP-LC columns was investigated. Specifications of thedifferent columns examined are given in Table 3. It must be notedthat Zirchrom (51) is a zirconia-based column whereas all othercolumns are silica based. All columns were gifts from either themanufacturer or the supplier. Two columns of each type and of thesame batch were available and they were characterised as describedunder Section 2.3. While one column of each pair was used forfour different, subsequent separations of drug substances fromtheir respective impurities, the other column was stored at roomtemperature, according to the prescriptions of the manufacturer.If nothing was prescribed, pure acetonitrile was used as a storagesolvent. Tetracycline, erythromycin, fluoxetine hydrochloride andgemcitabine hydrochloride were analysed on one column of eachpair. The respective chromatographic procedures are described inSection 2.4. The first substance was analysed on all the columnsbefore a next substance was analysed.
Each analysis was repeated three times, except for erythromycin,which was analysed twice since the total analysis time thencould reach 400 min. For erythromycin, the average passed columnvolume of all columns was estimated to be about 350 ml. For tetra-cycline, fluoxetine and gemcitabine, it was about 320 ml, 210 ml and250 ml, respectively. It must be noted that the total analysis timefluctuated slightly amongst columns.
Immediately after finishing the analysis of a compound eachcolumn was washed with acetonitrile:water:1 mol/l phosphoricacid (50:45:5 v/v) followed by acetonitrile:water (50:50 v/v) andfinally by the storage mixture, as prescribed by the company, or bypure acetonitrile if nothing was prescribed, all with a flow rate of1 ml/min for 30 min. When the first analysis was performed on allcolumns, the second analysis was started keeping the same orderof the columns. This means that the time difference between theperformed separations was the same for each column and duringthis period columns were stored in the same way as the second oneof the pair. Since the analyses were performed over a period of 15months (time consumed for doing analyses on the complete set ofcolumns), this was also the storage period for the second column ofeach pair. However, it must be noticed that each column that wasselected to perform analyses was only used effectively four timesfor 1 day. Each time half a day was used for column stabilizationand the other half for proper analysis.
2.6. Data treatment
After completion of the analyses, the stored and used columnswere characterised again. The deviations between the final andinitial four parameter values of the columns were calculated andplotted in function of the initial parameter value. Also, four differentF-values were determined: start, storage, storage + usage and usagealone. Fstart was calculated using the initially determined param-eters of the two columns of one batch. Fstorage was based on thedifference of the parameter values for columns before and afterstorage and Fstorage+usage on the difference of the parameter valuesfor columns before and after the analyses. Finally, Fusage was basedon the difference between the parameter values for columns fromthe same batch, where one column was stored and the other wasused for analyses. To clearly show these data, plots were drawnwhereby the X-axes represent each parameter value for one of apair of two columns to be compared. For each column type andeach of the four parameters, the percentage deviation (Y-axis) ofthe parameter obtained for the second column was calculated withreference to the value obtained for the first column. As mentionedin the introduction, the four parameters were tested earlier for theirrepeatable and reproducible character. The repeatability R.S.D. was
E.Haghedooren
etal./Talanta
76(2008)
172–182175
Table 3Characteristics of C18 columns examined in this study
No. Name of the column (250 mm × 4.6 mmi.d., 5 mm, spherical particles)
Manufacturersupplier
Substrate (typeof silica)
Type of bounded phase, polargroup in bonded phase
Endcapping/base-deactivation
Pore size(A)
Surface area(m2/g)
Carbonloading (%)
Storage
1 ACE5C18 Achrom B Yes/yes 100 300 15.5 MeOH–water (85:15 v/v)2 Alltima AQ Alltech B Polar endcapping Yes/no 100 450 20 ACN–water (58:42 v/v)3 Alltima C18 Alltech B Yes/no 100 340 16 ACN–water (58:42 v/v)4 BravaBDSC18 Alltech B Yes/no 145 185 8.5 ACN–water (58:42 v/v)5 CapcellPakC18ACR Shiseido F. Ch. B Yes/yes 80 340 18 ACN–water (70:30 v/v)6 CapcellPakC18AQ Shiseido F. Ch. B Yes/yes 80 300 11 ACN–water (70:30 v/v)7 CapcellPakC18MG Shiseido F. Ch. B Yes/yes 90 280 15 ACN–water (70:30 v/v)8 CapcellPakC18UG120 Shiseido F. Ch. B Yes/yes 120 290 15.1 ACN–water (70:30 v/v)9 Chromolith Performance RP-18e Merck B Yes/no 20000/130a 300 18 ACN 100%10 Discovery C18 Supelco B Yes/no 180 200 12 MeOH 100%11 Discovery HS C18 Supelco B Yes/no 120 300 20 MeOH–water (70:30 v/v)12 Exsil ODS 5Lim SGE B Yes/no 80 138 12 ACN–water (70:30 v/v)13 Hamilton HxSilC18 Hamilton B Yes/– 312 17.9 15 ACN–water (65:35 v/v)14 HydrospherC18 YMC B Yes/yes 120 335 12.5 ACN–water (70:30 v/v)15 HyPURITY Advance Thermo E. C. B Polar-embedded group No/yes 190 200 10 ACN–water (80:20 v/v)16 HyPURITYAquastar Thermo E. C. B Polar endcapping Yes/yes 190 200 10 ACN–water (80:20 v/v)17 HyPURITY C18 Thermo E. C. B Yes/yes 190 200 13 ACN–water (80:20 v/v)18 Inertsil ODS-2 GL Sci. Inc. B Intermediate bonded C18 Yes/yes 150 320 18.5 ACN 100%19 Inertsil ODS-3 GL Sci. Inc. B Yes/yes 100 450 15 ACN 100%20 Inertsil ODS-80A GL Sci. Inc. B Yes/yes 80 450 17.5 ACN 100%21 Inertsil ODS-P GL Sci. Inc. B Polymeric bonded C18 No/no 100 450 29 ACN 100%22 KromasilKR100-5C18 EKA Chem. B Yes/yes 100 340 19 MeOH–water (90:10 v/v)23 LiChrosorb RP-18 irregular particle Merck A Polymeric bonded C18 Yes/no 100 300 17 ACN 100%24 LiChrospher 100 RP-18 Merck A No/no 100 350 21 ACN 100%25 MP-Gel ODS-5 OmniChrom B Yes/– 120 340 13.3 MeOH–water (75:25 v/v)26 Omnispher5C18 Varian B No/no 110 320 20 ACN–water (70:30 v/v)27 Platinum C18 Alltech B Yes/no 100 200 6 ACN–water (58:42 v/v)28 Platinum EPS C18 Alltech B No/no 100 200 5 ACN–water (58:42 v/v)29 Polaris 5iim Varian B Yes/yes 180 180 14 ACN 100%30 Prevail Amide Alltech B Polar-embedded group No/no 190 200 12 ACN–water (58:42 v/v)31 Prevail C18 Alltech B Hydrophylic endcapping Yes/no 110 350 15 ACN–water (58:42 v/v)32 Prevail Select C18 Alltech B Polar-embedded group No/no 110 350 17 ACN–water (58:42 v/v)33 Prontosil 120-5-ace-EPS Bischoff B Polar-embedded group Yes/yes 120 300 18.5 ACN–water (85:15 v/v)34 Prontosil 120-5-C18AQ Bischoff B Yes/yes 120 300 15 ACN 100%35 Prontosil 120-5-C18 AQ PLUS Bischoff B Polar endcapping Yes/yes 120 300 17 ACN 100%36 Prontosil 120-5-C18-H Bischoff B Yes/yes 120 300 17 ACN–water (85:15 v/v)37 Prontosil 120-5-C18-SH Bischoff B Yes/yes 120 300 19 ACN–water (85:15 v/v)38 Prontosil 60-5-C18 H Bischoff B Yes/yes 60 450 18.5 ACN–water (85:15 v/v)39 PurospherRP18e Merck B Yes/no 90 350 18 ACN 100%40 Purospher Star RP-18 Merck B Yes/yes 120 330 17 ACN 100%41 Pursuit 5uC18 Varian B Yes/no 180 180 14 ACN 100%42 Supelcosil LC-18 Supelco A Yes/no 100 170 11 MeOH–water (70:30 v/v)43 Supelcosil LC-18 DB Supelco A Yes/yes 100 170 11 MeOH–water (70:30 v/v)44 Superspher 100 RP-18 Merck B Yes/no 100 350 21 ACN 100%45 Uptisphere 5 HDO-25QS Interchrom B Yes/– 120 310 16.2 MeOH 100%46 Uptisphere 5 ODB-25QS Interchrom B Yes/– 120 330 17.6 MeOH 100%47 WakosilII5C18RS SGE B Yes/yes 120 136 17 ACN–water (70:30 v/v)48 YMC-Pack Pro C18 3Lim YMC B Yes/yes 120 325 16 ACN–water (70:30 v/v)49 YMC-Pack Pro C18 5Lim YMC B Yes/yes 120 332 16 ACN–water (70:30 v/v)50 YMC-Pack Pro C18RS YMC B Polymeric bonded C18 Yes/yes 80 501 22.1 ACN–water (70:30 v/v)51 Zirchrom PS ZirChrom B Polystyrene coating No/no 300 30 1 ACN–water (50:50 v/v)52 Zorbax Eclipse XDB-C18 Agilent B Yes/yes 80 180 10 MeOH–water (85:15 v/v)53 Zorbax Extend-C18 Agilent B Bidentate Yes/– 80 180 12.5 MeOH–water (85:15 v/v)54 Zorbax SB–Aq Agilent B No/– 80 180 10 MeOH–water (70:30 v/v)55 Zorbax SB-C18 Agilent B No/– 80 180 10 MeOH–water (85:15 v/v)
This information, when given, was supplied by the manufacturer and/or supplier; –: unknown.a Macropore/mesopore.
Talan
176 E. Haghedooren et al. /less than 2% and the reproducibility R.S.D. in three different labo-
ratories was found to be less than 10% [19].In this study the experimental error of the test measurementswas also determined. Experimental error was examined on three ofthe columns on the same instrument. The procedure for the deter-mination of four test parameters was performed on each columnby injecting the samples (see Table 1) three times and then theprocedure was repeated twice in the same way, each time usingfreshly prepared mobile phase. The values obtained for the S.D. ofD% were not more than 1% for rk′
tri/o-ter, not more than 2% for k′amb
and k′2,2′-dip and not more than 5% for rk′
ba/ph pH 2.7. This means thatthe various conclusions in the present paper are based on reliabledata, which are not subjected to large experimental errors.
3. Results and discussion
3.1. Column characterisation in relation to the intra-batchdeviations
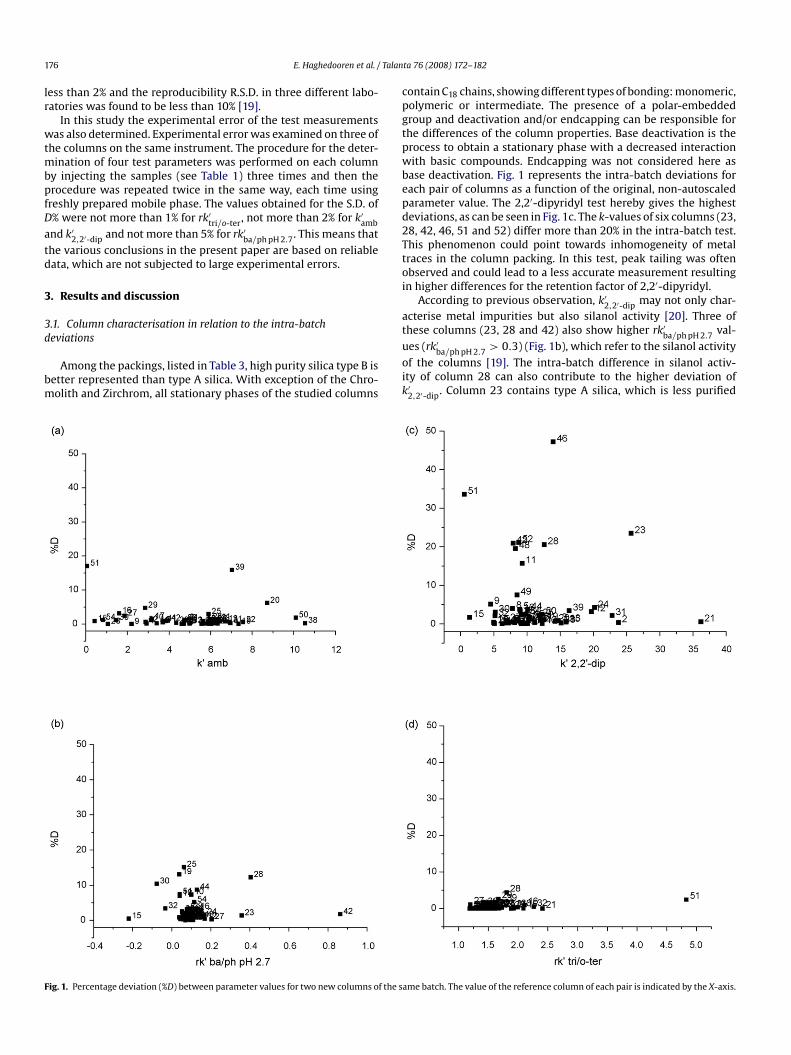
Among the packings, listed in Table 3, high purity silica type B isbetter represented than type A silica. With exception of the Chro-molith and Zirchrom, all stationary phases of the studied columns
Fig. 1. Percentage deviation (%D) between parameter values for two new columns of the s
ta 76 (2008) 172–182
contain C18 chains, showing different types of bonding: monomeric,
polymeric or intermediate. The presence of a polar-embeddedgroup and deactivation and/or endcapping can be responsible forthe differences of the column properties. Base deactivation is theprocess to obtain a stationary phase with a decreased interactionwith basic compounds. Endcapping was not considered here asbase deactivation. Fig. 1 represents the intra-batch deviations foreach pair of columns as a function of the original, non-autoscaledparameter value. The 2,2′-dipyridyl test hereby gives the highestdeviations, as can be seen in Fig. 1c. The k-values of six columns (23,28, 42, 46, 51 and 52) differ more than 20% in the intra-batch test.This phenomenon could point towards inhomogeneity of metaltraces in the column packing. In this test, peak tailing was oftenobserved and could lead to a less accurate measurement resultingin higher differences for the retention factor of 2,2′-dipyridyl.According to previous observation, k′2,2′-dip may not only char-
acterise metal impurities but also silanol activity [20]. Three ofthese columns (23, 28 and 42) also show higher rk′
ba/ph pH 2.7 val-ues (rk′
ba/ph pH 2.7 > 0.3) (Fig. 1b), which refer to the silanol activityof the columns [19]. The intra-batch difference in silanol activ-ity of column 28 can also contribute to the higher deviation ofk′
2,2′-dip. Column 23 contains type A silica, which is less purified
ame batch. The value of the reference column of each pair is indicated by the X-axis.
Talan
E. Haghedooren et al. /than the type B silica. Nine columns (10, 18, 19, 25, 28, 30, 44,51 and 54) have a difference in silanol activity within the samebatch between 5% and 20% while only three columns (20, 39 and51) deviate in this range for the hydrophobicity value (Fig. 1a).The deviation of the parameter measuring the steric selectivity isalways less than 5% (Fig. 1d). Since the retention time of benzy-lamine was small, usually close to the t0 of uracil, the parameter of
the silanol activity can be less precise than the other parameters.Three columns (15, 30 and 32) gave even less retention for benzy-lamine than for uracil. All three were non-endcapped columns witha polar-embedded group. These polar-embedded columns proba-bly provide a kind of shielding towards the silanol groups on thecolumn surface, leading to less interaction possibilities with thebenzylamine and to lower values. Moreover, an incorporated polargroup attracts a water layer, preventing the interaction of benzy-lamine with the silanol groups located below this strongly boundwater layer [32]. Zirchrom (51), a column which possesses porouszirconia particles coated with polystyrene, shows of course a lowsilanol activity and the 2,2′-dipyridyl parameter is equal to 0.56.The value for the other Zirchrom column is 0.84. These small num-bers result in a high percentage (33%) of difference, which canbe explained by the fact that Zirchrom columns have no silanolgroups and a very low amount of metal impurities in compari-son with other columns, leading to relatively low values for the2,2′-dipyridyl parameters. The smaller the values, the higher thepossibility of large percentage differences. Higher parameters formetal impurity and silanol activity (Fig. 1c, k′2,2′−dip > 17) were
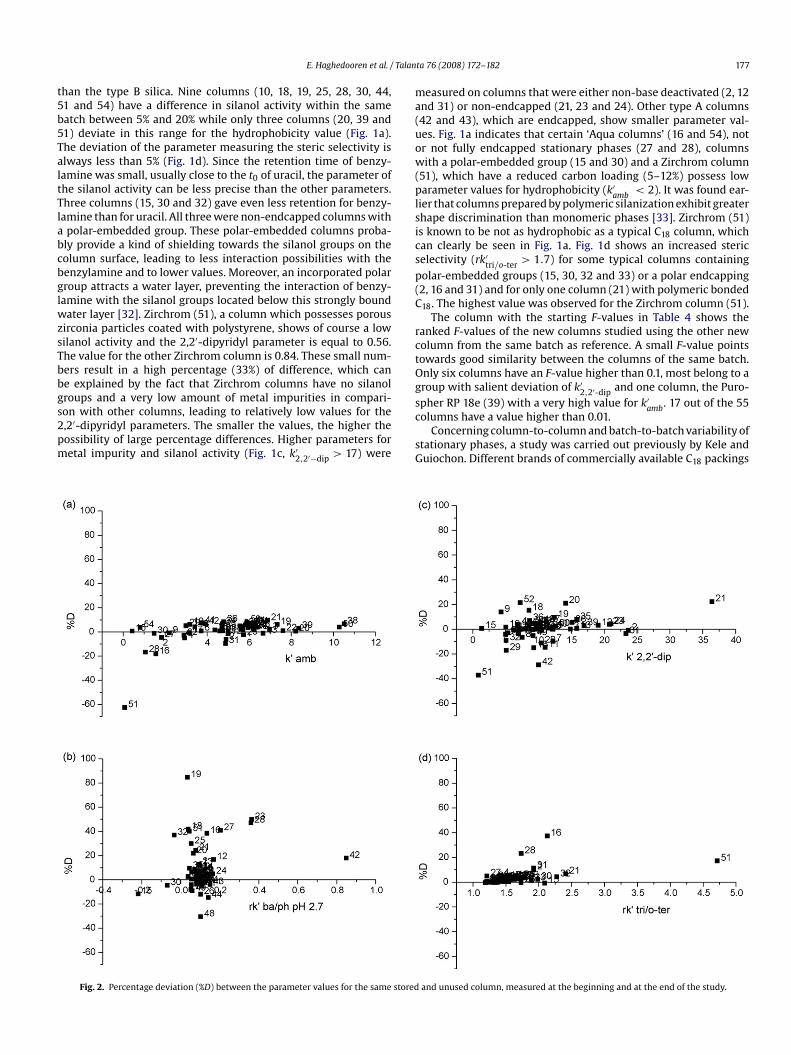
Fig. 2. Percentage deviation (%D) between the parameter values for the same stored
ta 76 (2008) 172–182 177
measured on columns that were either non-base deactivated (2, 12and 31) or non-endcapped (21, 23 and 24). Other type A columns(42 and 43), which are endcapped, show smaller parameter val-ues. Fig. 1a indicates that certain ‘Aqua columns’ (16 and 54), notor not fully endcapped stationary phases (27 and 28), columnswith a polar-embedded group (15 and 30) and a Zirchrom column(51), which have a reduced carbon loading (5–12%) possess low
parameter values for hydrophobicity (k′amb< 2). It was found ear-
lier that columns prepared by polymeric silanization exhibit greatershape discrimination than monomeric phases [33]. Zirchrom (51)is known to be not as hydrophobic as a typical C18 column, whichcan clearly be seen in Fig. 1a. Fig. 1d shows an increased stericselectivity (rk′
tri/o-ter > 1.7) for some typical columns containingpolar-embedded groups (15, 30, 32 and 33) or a polar endcapping(2, 16 and 31) and for only one column (21) with polymeric bondedC18. The highest value was observed for the Zirchrom column (51).
The column with the starting F-values in Table 4 shows theranked F-values of the new columns studied using the other newcolumn from the same batch as reference. A small F-value pointstowards good similarity between the columns of the same batch.Only six columns have an F-value higher than 0.1, most belong to agroup with salient deviation of k′
2,2′-dip and one column, the Puro-spher RP 18e (39) with a very high value for k′
amb. 17 out of the 55
columns have a value higher than 0.01.Concerning column-to-column and batch-to-batch variability of
stationary phases, a study was carried out previously by Kele andGuiochon. Different brands of commercially available C18 packings
and unused column, measured at the beginning and at the end of the study.
Talan
178 E. Haghedooren et al. /were examined as well as the short-term and long-term repeata-bility of chromatographic data, acquired on a single column andon different columns of the same batch or of different batches[34–38]. The parameters under investigation were characteristicfor the retention, the hydrophobic interaction selectivity, the stericselectivity, the relative retention of basic and neutral compounds,
the column efficiency and the peak asymmetry. Kele and Guiochonreported R.S.D. values below 0.02 for relative retention times of dif-ferent solutes [36]. In this study, 55 different stationary phases werechecked whereas Kele and Guiochon applied their test method ontofour different packings only. In our study, 43 out of the 55 columns(or almost 80%) have a percentage difference value below 0.02.3.2. Stability of columns after storage and after usage
Not only new columns should be characterised. Columns canalso be retested to monitor changes in column properties as a func-tion of time or of the samples analysed [39].
The percentage deviation between the parameter values at thebeginning and at the end of the study, as calculated for each storedand used column is shown in Figs. 2 and 3. Positive or negativechanges may be observed. The deviation between the character-istics of the used column and the stored column at the end of thestudy was also calculated to deduce the influence of the separations.The latter results can be seen in Fig. 4. Previous comparison of thecolumn parameters at the start of the study (Fig. 1) was necessaryto verify in how far the difference between parameters measured
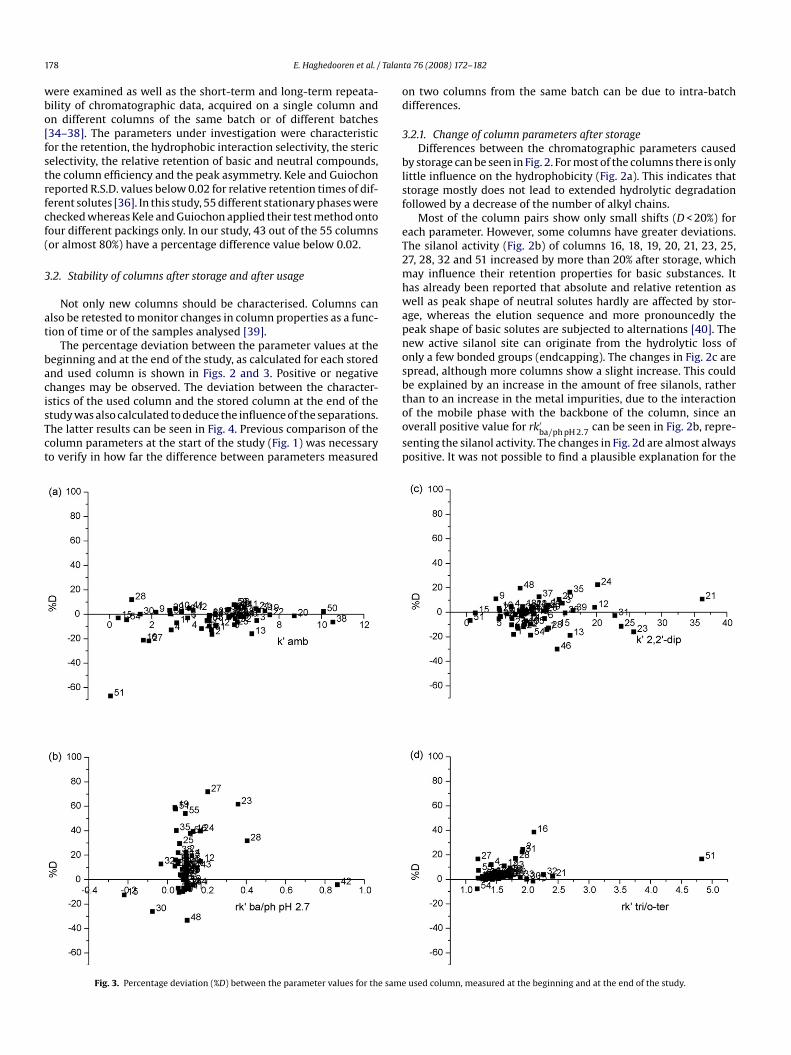
Fig. 3. Percentage deviation (%D) between the parameter values for the same
ta 76 (2008) 172–182
on two columns from the same batch can be due to intra-batchdifferences.
3.2.1. Change of column parameters after storageDifferences between the chromatographic parameters caused
by storage can be seen in Fig. 2. For most of the columns there is only
little influence on the hydrophobicity (Fig. 2a). This indicates thatstorage mostly does not lead to extended hydrolytic degradationfollowed by a decrease of the number of alkyl chains.Most of the column pairs show only small shifts (D < 20%) foreach parameter. However, some columns have greater deviations.The silanol activity (Fig. 2b) of columns 16, 18, 19, 20, 21, 23, 25,27, 28, 32 and 51 increased by more than 20% after storage, whichmay influence their retention properties for basic substances. Ithas already been reported that absolute and relative retention aswell as peak shape of neutral solutes hardly are affected by stor-age, whereas the elution sequence and more pronouncedly thepeak shape of basic solutes are subjected to alternations [40]. Thenew active silanol site can originate from the hydrolytic loss ofonly a few bonded groups (endcapping). The changes in Fig. 2c arespread, although more columns show a slight increase. This couldbe explained by an increase in the amount of free silanols, ratherthan to an increase in the metal impurities, due to the interactionof the mobile phase with the backbone of the column, since anoverall positive value for rk′
ba/ph pH 2.7 can be seen in Fig. 2b, repre-senting the silanol activity. The changes in Fig. 2d are almost alwayspositive. It was not possible to find a plausible explanation for the
used column, measured at the beginning and at the end of the study.
E. Haghedooren et al. / Talanta 76 (2008) 172–182 179
Table 4F-values of columns at the beginning of the test (start), of stored columns (storage), of used columns at the end of the test (storage + usage) and of used columns withoutstorage effect (usage), based on the ranking of the F-values of start
No. Column F-values
Start Storage Storage + usage Usage
23 LiChrosorb RP 18 0.544 0.437 3.352 0.90946 Uptisphere 5 ODB 0.513 0.007 0.422 0.01239 Purospher RP 18e 0.359 0.019 0.028 0.17628 Platinum EPSC18 0.208 0.596 1.080 0.55842 Supelcosil LC 18 0.126 0.267 0.093 0.00548 YMCPackPro 3 0.115 0.084 0.150 0.01411 Discovery HS C18 0.091 0.087 0.044 0.03120 Inertsil ODS-80A 0.066 0.135 0.052 0.14752 Zorbax Eclipse XDB 0.062 0.081 0.039 0.07224 LiChrospher 100 RP-18 0.042 0.034 0.661 0.69421 Inertsil ODS-P 0.030 0.452 0.325 0.19231 Prevail C18 0.025 0.246 0.252 0.09144 Superspher 100 RP-18 0.017 0.086 0.047 0.03149 YMCPackPro 5 0.015 0.008 0.002 0.00329 Polaris 5 0.014 0.014 0.025 0.03125 MP Gel ODS 5 0.013 0.056 0.072 0.02416 HyPURITYAquastar 0.010 0.947 1.010 0.03350 YMCPackPro RS 0.009 0.003 0.024 0.01051 Zirchrom PS 0.006 0.034 0.058 0.00432 Prevail Select C18 0.005 0.049 0.068 0.021
2 Alltima AQ 0.004 0.150 0.595 0.23954 Zorbax SB-Aq 0.004 0.023 0.189 0.23515 HyPURITY Advance 0.003 0.443 0.191 0.0979 Chromolith 0.003 0.041 0.035 0.005
12 Exsil ODS 5 0.003 0.023 0.087 0.1143 Alltima C18 0.003 0.019 0.048 0.070
10 Discovery C18 0.003 0.016 0.026 0.0065 Capcell Pak ACR 0.003 0.014 0.024 0.016
38 Prontosil 60-5-C18-H 0.003 0.009 0.090 0.1218 Capcell Pak UG120 0.003 0.004 0.012 0.0057 Capcell Pak MG 0.002 0.062 0.068 0.013
19 Inertsil ODS-3 0.002 0.055 0.059 0.00613 Hamilton Hx Sil 0.002 0.035 0.453 0.24226 Omnispher5 0.002 0.032 0.065 0.049
36 Prontosil 120-5-C18-H 0.0026 Capcell Pak AQ 0.00227 Platinum C18 0.00130 Prevail Amide 0.00118 Inertsil ODS-2 0.00141 Pursuit 5 0.00122 Kromasil KR100 5 0.00137 Prontosil 120-5-C18-SH 0.00140 Purospher Star RP-18 0.00117 HyPURITYC18 0.00155 Zorbax SB-C18 0.00135 Prontosil 120-5-C18AQPL 0.00145 Uptisphere 5 HDO 0.001
14 Hydrosphere 0.00143 Supelcosil LC 18 DB 0.00033 Prontosil 120-5-ace-EPS 0.0004 Brava BDSC18 0.00034 Prontosil 120-5-C18AQ 0.00053 Zorbax Extend C18re 0.000
1 ACE 0.00047 Wakosil II 5 RS 0.000
Average 0.042S.D. 0.11
relatively large changes found for columns 16, 28 and 51. Thesethree columns also show a relatively high change in silanol activity(Fig. 2b).
The F-values of stored columns at the end of the study are alsolisted in Table 4. Although the average F-value is low (Fav = 0.093), itis more than two times higher than the Fav (F = 0.042) of the intra-batch deviation. The highest F-values in the ranking (columns 16,28, 21, 15 and 23) were in the range of 0.4–1, which is consid-erably higher than the F-values for the first five ranked columns(23, 46, 39, 28 and 42) of the intra-batch test (0.1 < F < 0.6). Theseresults indicate that characteristics of at least some columns may
0.026 0.022 0.0370.004 0.011 0.0070.100 1.346 0.7030.075 0.105 0.0160.057 0.043 0.0280.029 0.023 0.0080.016 0.024 0.0280.014 0.062 0.0480.011 0.044 0.0210.011 0.008 0.0130.009 0.176 0.2150.007 0.163 0.1110.006 0.005 0.015
0.005 0.011 0.0150.041 0.019 0.0930.036 0.042 0.0100.022 0.097 0.0750.022 0.013 0.0470.018 0.066 0.0230.017 0.055 0.1000.005 0.003 0.0020.093 0.220 0.1070.17 0.51 0.19
change considerably upon storage. Previously, small changes inretention factors and in column properties like hydrophobicityand steric resistance were also reported over a 2-year period[41].
The data of Table 4 were also retreated by eliminating thenon-standard C18 columns (embedded polar, type A, etc). Withthe remaining 38 columns, the average Fstorage-value was 0.053(S.D. = 0.097) which is considerably smaller than the differencereported in Table 4, but seen the large S.D. not important.
Endcapped columns were also examined more in detail. It isgenerally accepted that endcapping is much more easily removed
180 E. Haghedooren et al. / Talanta 76 (2008) 172–182
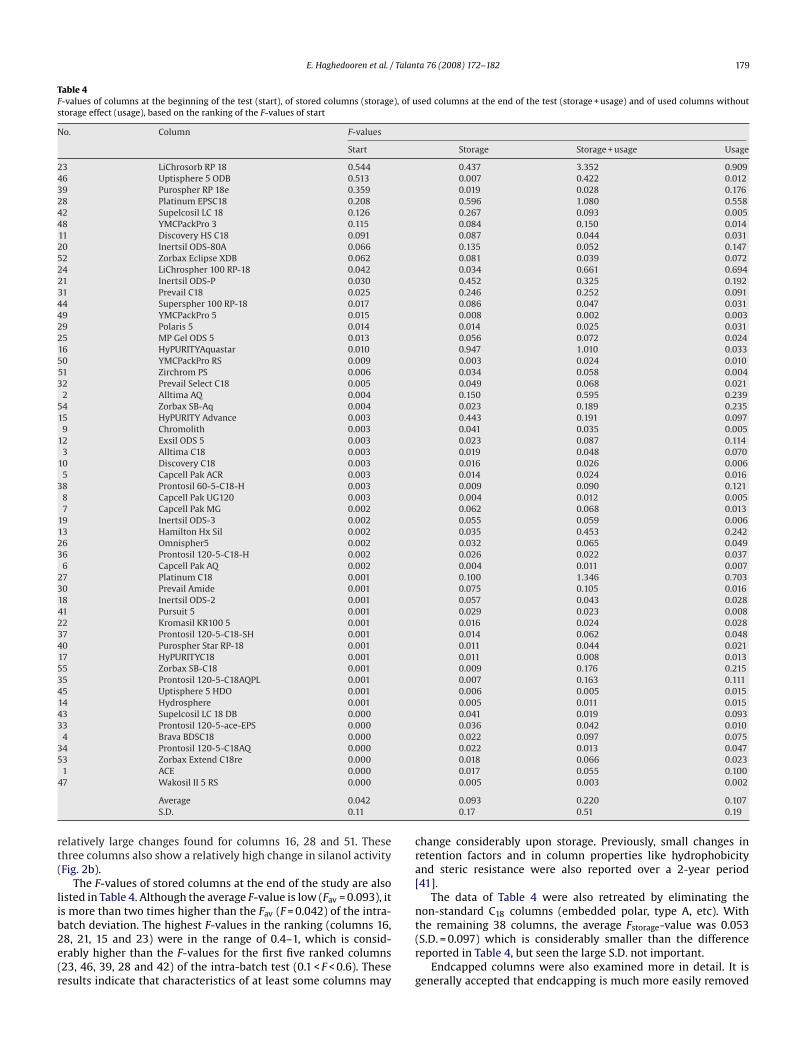
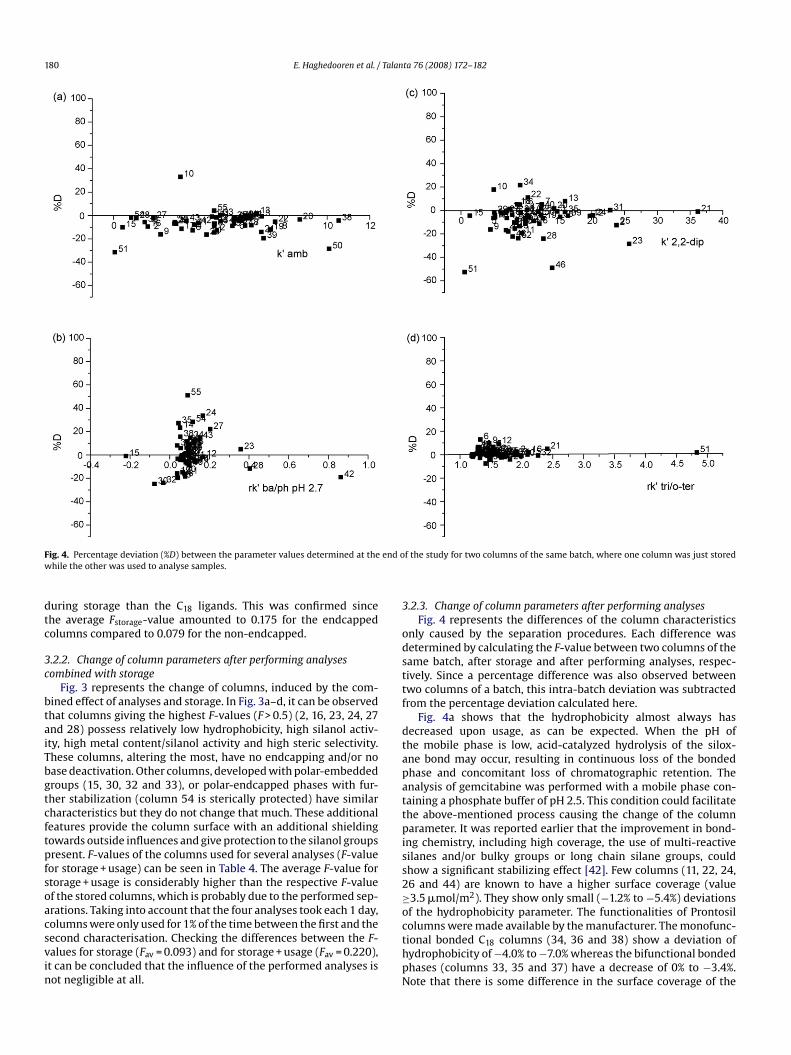
end o
Fig. 4. Percentage deviation (%D) between the parameter values determined at thewhile the other was used to analyse samples.during storage than the C18 ligands. This was confirmed sincethe average Fstorage-value amounted to 0.175 for the endcappedcolumns compared to 0.079 for the non-endcapped.
3.2.2. Change of column parameters after performing analysescombined with storage
Fig. 3 represents the change of columns, induced by the com-
bined effect of analyses and storage. In Fig. 3a–d, it can be observedthat columns giving the highest F-values (F > 0.5) (2, 16, 23, 24, 27and 28) possess relatively low hydrophobicity, high silanol activ-ity, high metal content/silanol activity and high steric selectivity.These columns, altering the most, have no endcapping and/or nobase deactivation. Other columns, developed with polar-embeddedgroups (15, 30, 32 and 33), or polar-endcapped phases with fur-ther stabilization (column 54 is sterically protected) have similarcharacteristics but they do not change that much. These additionalfeatures provide the column surface with an additional shieldingtowards outside influences and give protection to the silanol groupspresent. F-values of the columns used for several analyses (F-valuefor storage + usage) can be seen in Table 4. The average F-value forstorage + usage is considerably higher than the respective F-valueof the stored columns, which is probably due to the performed sep-arations. Taking into account that the four analyses took each 1 day,columns were only used for 1% of the time between the first and thesecond characterisation. Checking the differences between the F-values for storage (Fav = 0.093) and for storage + usage (Fav = 0.220),it can be concluded that the influence of the performed analyses isnot negligible at all.f the study for two columns of the same batch, where one column was just stored
3.2.3. Change of column parameters after performing analysesFig. 4 represents the differences of the column characteristics
only caused by the separation procedures. Each difference wasdetermined by calculating the F-value between two columns of thesame batch, after storage and after performing analyses, respec-tively. Since a percentage difference was also observed betweentwo columns of a batch, this intra-batch deviation was subtracted
from the percentage deviation calculated here.Fig. 4a shows that the hydrophobicity almost always hasdecreased upon usage, as can be expected. When the pH ofthe mobile phase is low, acid-catalyzed hydrolysis of the silox-ane bond may occur, resulting in continuous loss of the bondedphase and concomitant loss of chromatographic retention. Theanalysis of gemcitabine was performed with a mobile phase con-taining a phosphate buffer of pH 2.5. This condition could facilitatethe above-mentioned process causing the change of the columnparameter. It was reported earlier that the improvement in bond-ing chemistry, including high coverage, the use of multi-reactivesilanes and/or bulky groups or long chain silane groups, couldshow a significant stabilizing effect [42]. Few columns (11, 22, 24,26 and 44) are known to have a higher surface coverage (value≥3.5 �mol/m2). They show only small (−1.2% to −5.4%) deviationsof the hydrophobicity parameter. The functionalities of Prontosilcolumns were made available by the manufacturer. The monofunc-tional bonded C18 columns (34, 36 and 38) show a deviation ofhydrophobicity of −4.0% to −7.0% whereas the bifunctional bondedphases (columns 33, 35 and 37) have a decrease of 0% to −3.4%.Note that there is some difference in the surface coverage of the
Talan
[
[[
[
[
E. Haghedooren et al. /
mono-C18 columns (the values for columns 34, 36 and 38 are2.0 �mol/m2, 3.2 �mol/m2 and 3.0 �mol/m2) and bi-C18 columns(the value for columns 33, 35 and 37 is 3.2 �mol/m2). Among theZorbax columns, the deviation of Eclipse (52) with extra-densebonding is −3.3%, the sterically protected diisobutyl-ODS phases(columns 54 and 55) give −1.9% and 4.1% and finally, the bidentate-C18 phase (column 53) has a values of −4.0%, pointing out theirstability.
Fig. 4b demonstrates that the number of silanol sites increasesafter usage, mostly for endcapped columns. For non-endcappedcolumns, this phenomenon can be assigned to the loss of bondedphase. On “shielded phases”, where a neutral polar group has beenintroduced close to the surface, the silanol groups are blockedby strong hydrogen bonds. The polar group also attracts a waterlayer, preventing the interaction of analytes with the silanol groupslocated below this strongly bound water layer [32]. The polar-embedded phases ensure low silanol activity (columns 15, 30, 32and 33). No increase of the silanol sites could be observed afterusage of these columns. If silanols were formed, they were probablyalso shielded by the polar group.
The k′2,2′-dip value of the columns differs over a quite broad range
after usage (Fig. 4c). A number of the columns show an increasedvalue after use. This can be explained by the fact that most ofthese columns have also increased values for the rk′
ba/ph pH 2.7 value,pointing towards increased silanol activity. On the other hand, itcan also be observed in Fig. 4c, that the majority of the columnslose metal ions during analyses, which is attributable to the chro-matographic conditions used. For one separation, the mobile phasecontained the chelating agent EDTA, which can be responsible forpartial removal of metal ions.
Fig. 4d shows the differences in steric selectivity of the differentcolumns. This parameter does not deviate in the same manner asthe other three parameters, confirming that the bonding chemistrydoes not change.
When looking at the F-values (Table 4), the average for usage isslightly higher than that of storage alone. It must be noted that the F-value of the intra-batch deviation (Fav = 0.042) could be consideredto be partially included in the Fusage-value. Moreover, it has to bementioned that the chromatographic circumstances used were notvery aggressive. Also, the columns were used for a total of only 4days. It can therefore be concluded that changes due to use do occuralready after a short period of time.
4. Conclusion
In this paper, 55 pairs of RP columns were examined in orderto study the influence of storage and usage on their properties. Foreach column, four parameters were measured to assess hydropho-bicity, silanol activity, metal impurity and steric selectivity at thebeginning and at the end of the test. The deviation between theparameters revealed changes of different column properties dur-ing the test. The F-value was calculated to express the change offour column parameters within a single value.
Most unused RP columns from the same batch show very goodsimilarity. However, for those characterised by a high silanol activ-ity, greater differences were observed.
After long-term storage, small changes of the column character-istics occur for most of the columns, producing slightly increasedF-values. A few columns differed by a greater extent and showedconsiderable changes in silanol activity and hydrophobicity. Mostof these columns have no endcapping and/or no base deactiva-tion, making these stationary phases more vulnerable towardsdegradation. This effect is observed less with columns with polar-embedded groups and/or polar endcapping, protecting the column
[
[
[
[
[
[
[
[
[
[
[
[[
ta 76 (2008) 172–182 181
by blocking the silanol groups and attracting a shielding water layer.Also columns with higher coverages and bulky or long chains showmore resistance towards degradation.
When columns were used to perform analyses, about two timeshigher F-values were obtained compared to the non-used, storedcolumns. The difference can be attributed to the analyses per-formed. Loss of bonded phase and increase of the silanol sites wereobserved.
Considering the short analysis time (about 1% analysis time ver-sus a storage time of 15 months), it can be concluded that changes inthe stationary phases do occur. With the analytical conditions usedhere the influence of use was about 100 times more important thanthat of storage.
Acknowledgements
The authors thank the manufacturers and the suppliers forthe gift of columns. E. Farkas, A. Kerner and K. Koczian thankthe Ministry of the Flemish Community for financial support. E.Adams is a post-doctoral fellow of the Fund for Scientific Research(FWO)—Flanders, Belgium. Financial support to this project is givenby a Research Grant of the Fund for Scientific Research—Flanders(Belgium).
References
[1] H. Engelhardt, R. Gruner, Int. Lab. (1999) 34.[2] E. Cruz, M.R. Euerby, C.M. Johnson, C.A. Hackett, Chromatographia 44 (1997)
151.[3] A. Sandi, A. Bede, L. Szepesi, G. Rippel, Chromatographia 45 (1997)206.[4] L.R. Snyder, J.W. Dolan, P.W. Carr, J. Chromatogr A 1060 (2004) 77.[5] M.R. Euerby, P. Peterssonn, J. Chromatogr. A 1088 (2005) 1.[6] U.D. Neue, J.E. O’Gara, A. Mendez, J. Chromatogr. A 1127 (2006) 161.[7] D. Visky, Y. Vander Heyden, T. Ivanyi, P. Baten, J. De Beer, B. Noszal, E. Roets, D.L.
Massart, J. Hoogmartens, Pharmeuropa 14 (2002) 288.[8] K. Kimata, K. Iwaguchi, S. Onishi, K. Jinno, R. Eksteen, K. Hosoya, M. Araki, N.
Tanaka, J. Chromatogr. Sci. 27 (1989) 721.[9] H.A. Claessens, TrAC 20 (2001) 563.10] H.A. Claessens, M.A. van Straten, J. Chromatogr. A 1060 (2004) 23.
[11] M.J.J. Hetem, J.W. de Haan, H.A. Claessens, C.A. Cramers, A. Deege, G. Schomburg,J. Chromatogr. 540 (1991) 53.
12] J.J. Kirkland, M.A. van Straten, H.A. Claessens, J. Chromatogr. A 691 (1995)3.13] J.J. Kirkland, J.W. Henderson, J.J. DeStefano, M.A. van Straten, H.A. Claessens, J.
Chromatogr. A 762 (1997) 97.14] H.A. Claessen, M.A. van Straten, J.J. Kirkland, J. Chromatogr. A 728 (1996)
259–270.15] J.J. Kirkland, J.W. Henderson, J.J. DeStefano, M.A. van Straten, H.A. Claessen, J.
Chromatogr. A 762 (1997) 97–112.
16] B. Law, P.F. Chan, J. Chromatogr. 467 (1990) 267.[17] B.C. Trammell, C.A. Boissel, C. Carignan, D.J. O’Shea, C.J. Hudalla, U.D. Neue, P.C.Iraneta, J. Chromatogr. A 1060 (2004) 153.
18] S.J. Marin, B.A. Jones, W.D. Felix, J. Clark, J. Chromatogr. A 1030 (2004)255.
19] D. Visky, Y. Vander Heyden, T. Ivanyi, P. Baten, J. De Beer, Zs. Kovacs, B. Noszal,E. Roets, D.L. Massart, J. Hoogmartens, J. Chromatogr. A 977 (2002) 39.
20] T. Ivanyi, Y. Vander Heyden, D. Visky, P. Baten, J. De Beer, I. Lazar, D.L. Massart,E. Roets, J. Hoogmartens, J. Chromatogr. A 954 (2002) 99.
21] D. Visky, Y. Vander Heyden, T. Ivanyi, P. Baten, J. De Beer, Z. Kovacs, B. Noszal, P.Dehouck, E. Roets, D.L. Massart, J. Hoogmartens, J. Chromatogr. A 1012 (2003)11.
22] P. Dehouck, D. Visky, G. Van den Bergh, E. Haghedooren, E. Adams, A. Kerner,Y. Vander Heyden, D.L. Massart, Zs. Kovacs, B. Noszal, J. Hoogmartens, LC–GCEurope 17 (2004) 592.
23] P. Dehouck, D. Visky, Y. Vander Heyden, E. Adams, Z. Kovacs, B. Noszal, D.L.Massart, J. Hoogmartens, J. Chromatogr. A 1025 (2004) 189.
24] D. Visky, E. Haghedooren, P. Dehouck, Zs. Kovacs, K. Koczian, B. Noszal, J. Hoog-martens, E. Adams, J. Chromatogr. A 1101 (2006) 103.
25] E. Haghedooren, J. Diana, B. Noszal, J. Hoogmartens, E. Adams, Talanta 71 (2007)31.
26] E. Haghedooren, D. Visky, P. Dehouck, K. Koczian, Zs. Kovacs, B. Noszal, J. Hoog-martens, E. Adams, LC–GC Europe 20 (2007) 82.
27] E. Haghedooren, A. Kerner, B. Noszal, J. Hoogmartens, E. Adams, J. Pharm.Biomed. Anal. 44 (2007) 634.
28] R. Capote, J. Diana, E. Roets, J. Hoogmartens, J. Sep. Sci. 25 (2002) 399.29] H.K. Chepkwony, P. Dehouck, E. Roets, J. Hoogmartens, Chromatographia 53
(2001) 159.

[
[
[
[[
182 E. Haghedooren et al. / Talan
30] Council of Europe, European Pharmacopoeia, 1615, 5th edition, Council ofEurope, Strasbourg, France, 2005.
31] United States Pharmacopeial Convention, The United States Pharmacopeia,892, 28th edition, United States Pharmacopeial Convention, Rockville, USA,2005.
32] U.D. Neue, Y.-F. Cheng, Z. Lu, B.A. Alden, P.C. Iraneta, C.H. Phoebe, K. Van Tran,Chromatographia 54 (2001) 169.
33] L.C. Sander, M. Pursch, S.A. Wise, Anal. Chem. 71 (1999) 4821.34] M. Kele, G. Guiochon, J. Chromatogr. A 830 (1999) 41.
[[[[[[
[
ta 76 (2008) 172–182
35] M. Kele, G. Guiochon, J. Chromatogr. A 830 (1999) 55.36] M. Kele, G. Guiochon, J. Chromatogr. A 855 (1999) 423.37] M. Kele, G. Guiochon, J. Chromatogr. A 869 (2000) 181.38] M. Kele, G. Guiochon, J. Chromatogr. A 913 (2001) 89.39] C.F. Poole, The Essence of Chromatography, Elsevier, Amsterdam, 2003.40] H. Engelhardt, M. Jungheim, Chromatographia 29 (1990) 59.
[41] J.J. Gilroy, J.W. Dolan, L.R. Snyder, J. Chromatogr. A 1000 (2003) 757.42] N. Sagliano, T.R. Floyd, R.A. Hartwick, J.M. Dibussolo, N.T. Miller, J. Chromatogr.
A 443 (1988) 155.
Related Documents