Effect of key alloying elements on the feeding characteristics of aluminum–silicon casting alloys Manas Dash, Makhlouf Makhlouf * Advanced Casting Research Center, Metal Processing Institute, WPI, Worcester, MA 01609, USA Abstract The most common and serious defect in aluminum castings is porosity, which is a result of two phenomena, insufficient feeding and/or hydrogen precipitation during solidification. These defects cause costly scrap loss and limit the use of castings in critical, high-strength applications. In this paper, the effect of alloying elements Si, Fe, Mg, Mn, Cu, Sr, and Ti as well as the cooling rate on the amount of porosity retained in aluminum castings has been quantified. The density of samples taken from locations along the length of a plate cast in sand is measured using Archimedes’ principle following ASTM procedures. Hot isostatically pressed samples are used to determine the theoretical density of each of the alloys. The percent porosity is calculated from the difference between theoretical and measured density. The relative contribution of each of the alloying elements to porosity formation is calculated using analysis of variance. Scanning electron microscopy of some samples is performed to correlate the results obtained from analysis of variance to the intermetallics formed. It is observed that the morphology of the intermetallics greatly affects feedability of the alloy. Ó 2002 Elsevier Science Ltd. All rights reserved. 1. Introduction Aluminum castings are getting increased attention mainly because of their application in the automotive and aerospace industries. Forged structural steel parts are being replaced by aluminum castings to save weight and production costs. Cost reduction and product op- timization have been the driving force for research in the field of alleviating casting defects. Only in the last five decades have attempts been made to study the feeding mechanisms of aluminum–silicon alloys. It was nearly 1969 when Campbell [1] published a paper on the feeding mechanisms in casting. A notable literature- review by Taylor [2] drew attention to the scientific and technical knowledge on metal related castability effects in aluminum foundry alloys. Experimental work has been started though not on a wide scale, paying special attention to the feeding mechanisms and their influence on porosity formation. In recent years many papers have been published in different journals and transac- tions regarding feeding. During the initial period of mold filling, the dendritic network remains incomplete. The melt flows with the bulk properties of a liquid and then subsequently with the properties of a suspension of growing particles (equiaxed dendrites plus any other primary phases) in a liquid. Feedability becomes important once the semi- rigid network of the dendritic grains has formed. The dendrite arms continue to coarsen through various rip- ening mechanisms [3] and the intergranular regions de- crease in size as the volume fraction of solid increases. Channels between the dendrites and grains continue to narrow, creating an increasingly tortuous path through which the remaining liquid must flow. As the restrictions increase, the pressure head required to maintain flow also increases. This must be supplied either by applied external pressure or by metal shrinkage pressures. These narrowing fluid paths may become blocked by suspen- sions of non-metallic inclusions or growing intermetallic particles within the melt stream. This in turn tends to make fluid flow even more difficult [4–6]. The final liquid fraction to solidify is usually of eutectic composition (simple or complex). This liquid composition normally has a high fluidity. However, despite this gain, flow eventually ceases through the narrowing channels. It is during these latter stages of restricted interdendritic fluid flow that effect of alloy composition on viscosity and surface may become most evident [7]. Elements which segregate to the final eutectic liquid fraction and which also decrease melt viscosity or surface tension may Journal of Light Metals 1 (2001) 251–265 www.elsevier.com/locate/lightmetals * Corresponding author. E-mail address: [email protected] (M. Makhlouf). 1471-5317/02/$ - see front matter Ó 2002 Elsevier Science Ltd. All rights reserved. PII:S1471-5317(02)00002-0

Welcome message from author
This document is posted to help you gain knowledge. Please leave a comment to let me know what you think about it! Share it to your friends and learn new things together.
Transcript
Effect of key alloying elements on the feeding characteristicsof aluminum–silicon casting alloys
Manas Dash, Makhlouf Makhlouf *
Advanced Casting Research Center, Metal Processing Institute, WPI, Worcester, MA 01609, USA
Abstract
The most common and serious defect in aluminum castings is porosity, which is a result of two phenomena, insufficient feeding
and/or hydrogen precipitation during solidification. These defects cause costly scrap loss and limit the use of castings in critical,
high-strength applications. In this paper, the effect of alloying elements Si, Fe, Mg, Mn, Cu, Sr, and Ti as well as the cooling rate on
the amount of porosity retained in aluminum castings has been quantified. The density of samples taken from locations along the
length of a plate cast in sand is measured using Archimedes’ principle following ASTM procedures. Hot isostatically pressed samples
are used to determine the theoretical density of each of the alloys. The percent porosity is calculated from the difference between
theoretical and measured density. The relative contribution of each of the alloying elements to porosity formation is calculated using
analysis of variance. Scanning electron microscopy of some samples is performed to correlate the results obtained from analysis of
variance to the intermetallics formed. It is observed that the morphology of the intermetallics greatly affects feedability of the
alloy. � 2002 Elsevier Science Ltd. All rights reserved.
1. Introduction
Aluminum castings are getting increased attentionmainly because of their application in the automotiveand aerospace industries. Forged structural steel partsare being replaced by aluminum castings to save weightand production costs. Cost reduction and product op-timization have been the driving force for research in thefield of alleviating casting defects. Only in the last fivedecades have attempts been made to study the feedingmechanisms of aluminum–silicon alloys. It was nearly1969 when Campbell [1] published a paper on thefeeding mechanisms in casting. A notable literature-review by Taylor [2] drew attention to the scientific andtechnical knowledge on metal related castability effectsin aluminum foundry alloys. Experimental work hasbeen started though not on a wide scale, paying specialattention to the feeding mechanisms and their influenceon porosity formation. In recent years many papershave been published in different journals and transac-tions regarding feeding.
During the initial period of mold filling, the dendriticnetwork remains incomplete. The melt flows with the
bulk properties of a liquid and then subsequently withthe properties of a suspension of growing particles(equiaxed dendrites plus any other primary phases) ina liquid. Feedability becomes important once the semi-rigid network of the dendritic grains has formed. Thedendrite arms continue to coarsen through various rip-ening mechanisms [3] and the intergranular regions de-crease in size as the volume fraction of solid increases.Channels between the dendrites and grains continue tonarrow, creating an increasingly tortuous path throughwhich the remaining liquid must flow. As the restrictionsincrease, the pressure head required to maintain flowalso increases. This must be supplied either by appliedexternal pressure or by metal shrinkage pressures. Thesenarrowing fluid paths may become blocked by suspen-sions of non-metallic inclusions or growing intermetallicparticles within the melt stream. This in turn tends tomake fluid flow even more difficult [4–6]. The final liquidfraction to solidify is usually of eutectic composition(simple or complex). This liquid composition normallyhas a high fluidity. However, despite this gain, floweventually ceases through the narrowing channels. It isduring these latter stages of restricted interdendritic fluidflow that effect of alloy composition on viscosity andsurface may become most evident [7]. Elements whichsegregate to the final eutectic liquid fraction and whichalso decrease melt viscosity or surface tension may
Journal of Light Metals 1 (2001) 251–265
www.elsevier.com/locate/lightmetals
* Corresponding author.
E-mail address: [email protected] (M. Makhlouf).
1471-5317/02/$ - see front matter � 2002 Elsevier Science Ltd. All rights reserved.
PII: S1471-5317 (02 )00002-0
prolong the ability of the liquid to flow interdendriticallyand vice versa. Elements may also change interdendriticfeeding ability by shifting eutectic, liquidus or solidustemperatures. This may cause either a widening or nar-rowing of the alloy’s freezing range, with a consequentshift in its coherency point. This means that the perme-ability of the interdendritic zone is both alloy dependentand cooling rate dependent [8].
1.1. Feeding mechanisms during solidification
The solidification of most commercial alloys involvessignificant volume contraction. Thermal conductivity ofaluminum- and copper-based alloys being high, thethermal gradients inside the freezing metal will be small.For an alloy having a long freezing range, the size of thesolid–liquid region will become large, and a well-definedsolid shell will not form. Instead, the entire castingwould quickly fill with a mixture of solid dendrites andliquid, and remain filled with mushy material until theend of solidification. In such long freezing alloys, meltmust be fed through a partially solidified, coherent den-dritic network, if porosity and surface defects are to beavoided. Commercially pure metals, influenced by atemperature gradient ahead of the interface, solidify asa plane front or a short columnar zone, and melt caneasily feed the solidification shrinkage. However, as al-loying elements are added to the melt, the freezing rangeincreases and dendritic solidification begins to occurthroughout a large portion of the casting. A descriptionof the feeding mechanisms for long freezing range alloysis provided by Campbell [9] and he proposes five distinctfeeding mechanisms:
1. Liquid feeding,2. Mass feeding,3. Interdendritic feeding,4. Burst feeding,5. Solid feeding.
1.1.1. Liquid FeedingLiquid feeding is the most ‘‘open’’ feeding mechanism
and generally precedes other forms of feeding althoughin skin freezing metals and eutectics it is normally theonly method of feeding. It has been much investigatedboth theoretically and experimentally and for this rea-son is probably the best understood of all types offeeding [1]. Inadequate liquid feeding leads to formationof porosity by an elementary process: primary shrinkagepipes simply spreads into more distant regions of thecasting. Thus, resulting porosity may take the form ofa smooth sided or complex pore (the latter resemblingmicroporosity when sectioned) depending upon whetherthe alloy freezes at a single temperature or over a rangeof temperatures.
1.1.2. Mass feedingThis is a term coined by Baker [1], to denote con-
solidation of a fluid mass of solid crystals and residualliquid. Solid crystals start to form as the temperaturedrops below the nucleation temperature, and movementof the semi-solid slurry, where the dendrites are carriedwith the flow, is termed mass feeding.
1.1.3. Interdendritic feedingThe solid crystals flow with the melt as they continue
to grow, usually dendritically. This two-phase flow canbe treated as a slurry and may be responsible for feedingsolidification shrinkage until the solid develops into arigid, interconnected network. The dendrites impingeand form an interconnected solid network when thedendrite coherency point is reached [10]. After coher-ency the structural integrity of the dendritic networkprohibits further mass feeding. Instead, the melt mustflow through the solid network of dendrites to feed so-lidification shrinkage. At low fraction solid, the devel-oping network does not provide much resistance to themelt flow. The permeability of the solid network is high.
1.1.4. Burst feedingAs the fraction of solid continually increases, the
strength of the network increases, but the permeabilitydecreases, increasing the stress on the network. Burstfeeding occurs when the strength of the network is in-sufficient to resist the increasing pressure induced bycontinued solidification shrinkage. Campbell claimsthat this point occurs at a fraction solid of about 68%solid [10], but alloy composition and casting condi-tions probably play a significant role in determiningthis point. Both a knowledge of the permeability of themushy zone and the yield strength of the dendritic net-work must be known as a function of the fraction so-lidified to estimate a likely point for burst feeding to beactivated.
1.1.5. Solid feedingSince the permeability of the interdendritic network is
continuously decreasing with increasing solid fraction,the stress on the dendrites increases and the networkmay collapse, giving rise to transport of solid fragmentsand liquid. Solid feeding denotes the feeding of solidmaterial, by deformation, and may occur just below thesolidus temperature where the yield strength of the ma-terial is relatively low. It is usually desirable to avoidsolid feeding by insuring that one of the other feedingmechanisms continues to feed the solidification shrink-age to very high solid fractions.
The production of sound castings requires supplyingadequate amounts of feed metal during solidification ofthe casting. If the feed metal is insufficient, several de-fects, including porosity, shrinkage and surface sinkscan occur in the casting. Except for the effect of silicon
252 M. Dash, M. Makhlouf / Journal of Light Metals 1 (2001) 251–265
and copper on feedability, which is relatively well doc-umented, very little is known regarding the effect ofother alloying and impurity elements on feedability ofaluminum–silicon casting alloys. The objective of thiswork is to quantify the effect of key alloying elementsas well as cooling rate on feedability of Al–Si castingalloys.
2. Procedures
2.1. Design of experiment
Because of the large number of variables and theimportance of the interactions of these variables withone another, the Taguchi method for design of experi-ments was used. Before designing an experiment, knowl-edge of the product/process under investigation is ofprime importance for identifying the factors likelyto influence the outcome. The dependent variables,independent variables and constants in this project areshown in Table 1. Eight variables and six interactionsthat are perceived to be significant to the feedability ofaluminum–silicon casting alloys were identified. Sincethere are thirteen factors and each variable was tested attwo levels, an L16 Taguchi orthogonal array was used[11]. Table 2 shows the high and low levels of the alloychemistry and Table 3 shows the L16 orthogonal arraywith the values of the variables.
2.2. Mold fabrication
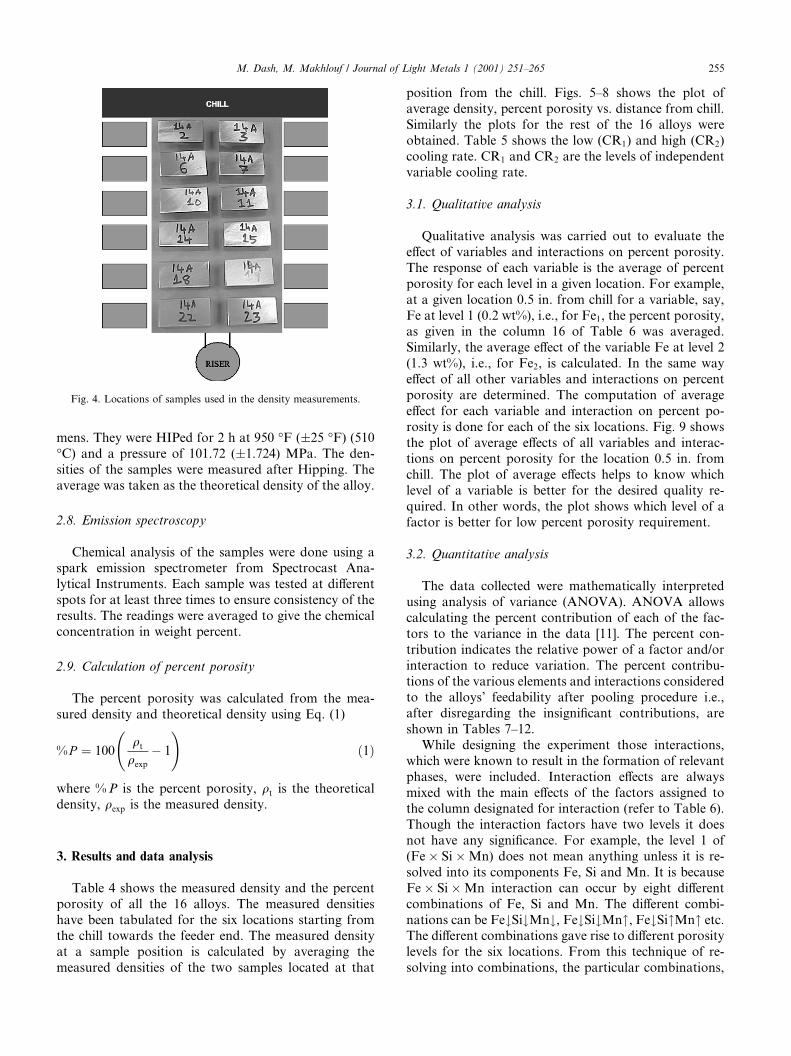
Sand molds were made at Palmer Foundry Inc. Thecope and the drag are shown in Figs. 1 and 2 respectively.
The cope contains the cavity for producing a platecasting of dimension 8 in:� 6 in:� 1 in: Two differentvolumes of iron chill, 1=6V and 3V were used where V isthe volume of the plate cavity. The chill was connected to
Table 1
The experiment’s parameters
Independent
variables
Dependent variables Constants
Alloying elements Shrinkage porosity
(macro and micro)
Mold design
Fe Mold material
Mn Mold temperature
Mg Holding temperature
Cu Insulating material
Si
TiB2
Sr
Cooling rate
Table 2
High and low levels of alloying elements
Elements First level (low)
(wt%)
Second level (high)
(wt%)
Iron 0.1–0.3 (0.2) 1.2–1.4 (1.3)
Manganese 0.0–0.1 (0.05) 0.6–0.8 (0.7)
Copper 0.1–0.3 (0.2) 3.25–3.75 (3.5)
Magnesium 0.0–0.1 (0.05) 0.55–0.65 (0.6)
Silicon 5.8–6.2 (6.0) 9.8–10.2 (10.0)
TiB2 0 0.15–0.25 (0.20)
Strontium 0 0.015–0.025 (0.02)
The ( ) indicates targeted value.
Table 3
L16 orthogonal array
L16 Fe Si Sr Fe �Mn � Si
Mg �Si � Cu
Fe �Mn
Mn Mg Mg � Si Fe �Si � Mg
TiB2 Fe �Ti
Chill
size
Cu
Experiment/
column
1 2 3 4 5 6 7 8 9 10 11 12 13 14 15
1 0.2 6 0 0.05 0.05 0 1 0.2
2 0.2 6 0 0.05 0.6 0.2 2 3.5
3 0.2 6 0 0.7 0.05 0.2 2 3.5
4 0.2 6 0 0.7 0.6 0 1 0.2
5 0.2 10 0.02 0.7 0.05 0 2 3.5
6 0.2 10 0.02 0.7 0.6 0.2 1 0.2
7 0.2 10 0.02 0.05 0.05 0.2 1 0.2
8 0.2 10 0.02 0.05 0.6 0 2 3.5
9 1.3 6 0.02 0.7 0.05 0 1 3.5
10 1.3 6 0.02 0.7 0.6 0.2 2 0.2
11 1.3 6 0.02 0.05 0.05 0.2 2 0.2
12 1.3 6 0.02 0.05 0.6 0 1 3.5
13 1.3 10 0 0.05 0.05 0 2 0.2
14 1.3 10 0 0.05 0.6 0.2 1 3.5
15 1.3 10 0 0.7 0.05 0.2 1 3.5
16 1.3 10 0 0.7 0.6 0 2 0.2
M. Dash, M. Makhlouf / Journal of Light Metals 1 (2001) 251–265 253
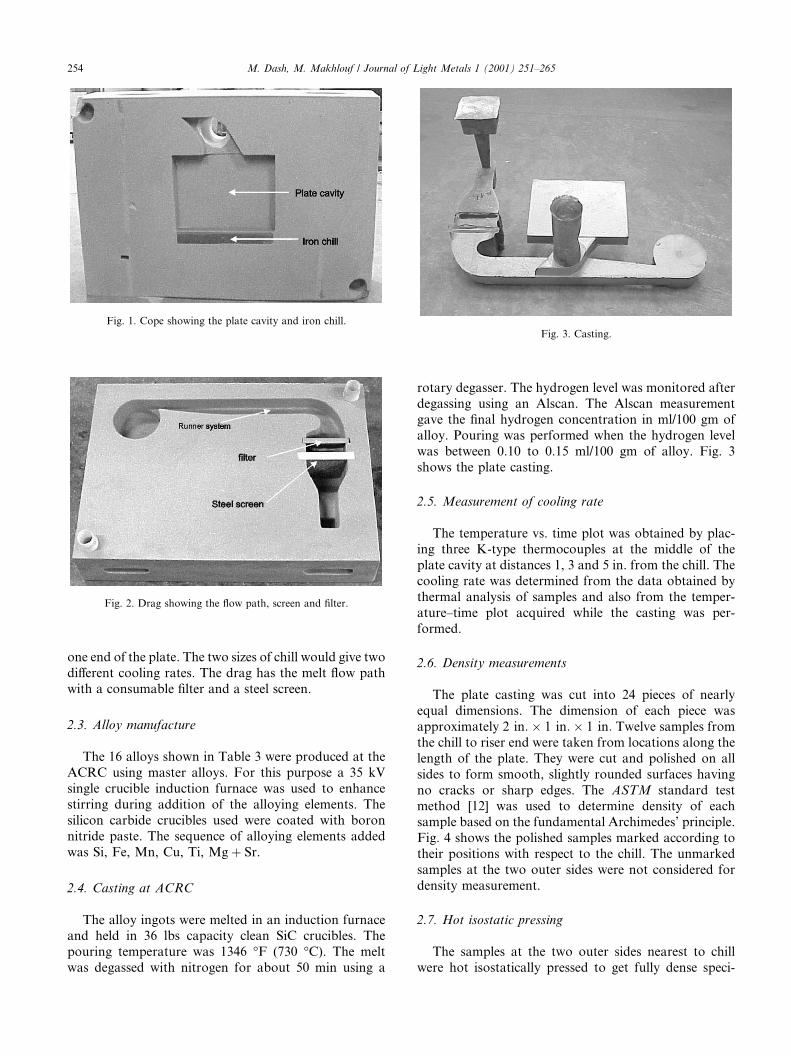
one end of the plate. The two sizes of chill would give twodifferent cooling rates. The drag has the melt flow pathwith a consumable filter and a steel screen.
2.3. Alloy manufacture
The 16 alloys shown in Table 3 were produced at theACRC using master alloys. For this purpose a 35 kVsingle crucible induction furnace was used to enhancestirring during addition of the alloying elements. Thesilicon carbide crucibles used were coated with boronnitride paste. The sequence of alloying elements addedwas Si, Fe, Mn, Cu, Ti, Mg þ Sr.
2.4. Casting at ACRC
The alloy ingots were melted in an induction furnaceand held in 36 lbs capacity clean SiC crucibles. Thepouring temperature was 1346 �F (730 �C). The meltwas degassed with nitrogen for about 50 min using a
rotary degasser. The hydrogen level was monitored afterdegassing using an Alscan. The Alscan measurementgave the final hydrogen concentration in ml/100 gm ofalloy. Pouring was performed when the hydrogen levelwas between 0.10 to 0.15 ml/100 gm of alloy. Fig. 3shows the plate casting.
2.5. Measurement of cooling rate
The temperature vs. time plot was obtained by plac-ing three K-type thermocouples at the middle of theplate cavity at distances 1, 3 and 5 in. from the chill. Thecooling rate was determined from the data obtained bythermal analysis of samples and also from the temper-ature–time plot acquired while the casting was per-formed.
2.6. Density measurements
The plate casting was cut into 24 pieces of nearlyequal dimensions. The dimension of each piece wasapproximately 2 in:� 1 in:� 1 in: Twelve samples fromthe chill to riser end were taken from locations along thelength of the plate. They were cut and polished on allsides to form smooth, slightly rounded surfaces havingno cracks or sharp edges. The ASTM standard testmethod [12] was used to determine density of eachsample based on the fundamental Archimedes’ principle.Fig. 4 shows the polished samples marked according totheir positions with respect to the chill. The unmarkedsamples at the two outer sides were not considered fordensity measurement.
2.7. Hot isostatic pressing
The samples at the two outer sides nearest to chillwere hot isostatically pressed to get fully dense speci-
Fig. 1. Cope showing the plate cavity and iron chill.
Fig. 2. Drag showing the flow path, screen and filter.
Fig. 3. Casting.
254 M. Dash, M. Makhlouf / Journal of Light Metals 1 (2001) 251–265
mens. They were HIPed for 2 h at 950 �F (�25 �F) (510�C) and a pressure of 101.72 (�1.724) MPa. The den-sities of the samples were measured after Hipping. Theaverage was taken as the theoretical density of the alloy.
2.8. Emission spectroscopy
Chemical analysis of the samples were done using aspark emission spectrometer from Spectrocast Ana-lytical Instruments. Each sample was tested at differentspots for at least three times to ensure consistency of theresults. The readings were averaged to give the chemicalconcentration in weight percent.
2.9. Calculation of percent porosity
The percent porosity was calculated from the mea-sured density and theoretical density using Eq. (1)
%P ¼ 100qt
qexp
� 1
!ð1Þ
where % P is the percent porosity, qt is the theoreticaldensity, qexp is the measured density.
3. Results and data analysis
Table 4 shows the measured density and the percentporosity of all the 16 alloys. The measured densitieshave been tabulated for the six locations starting fromthe chill towards the feeder end. The measured densityat a sample position is calculated by averaging themeasured densities of the two samples located at that
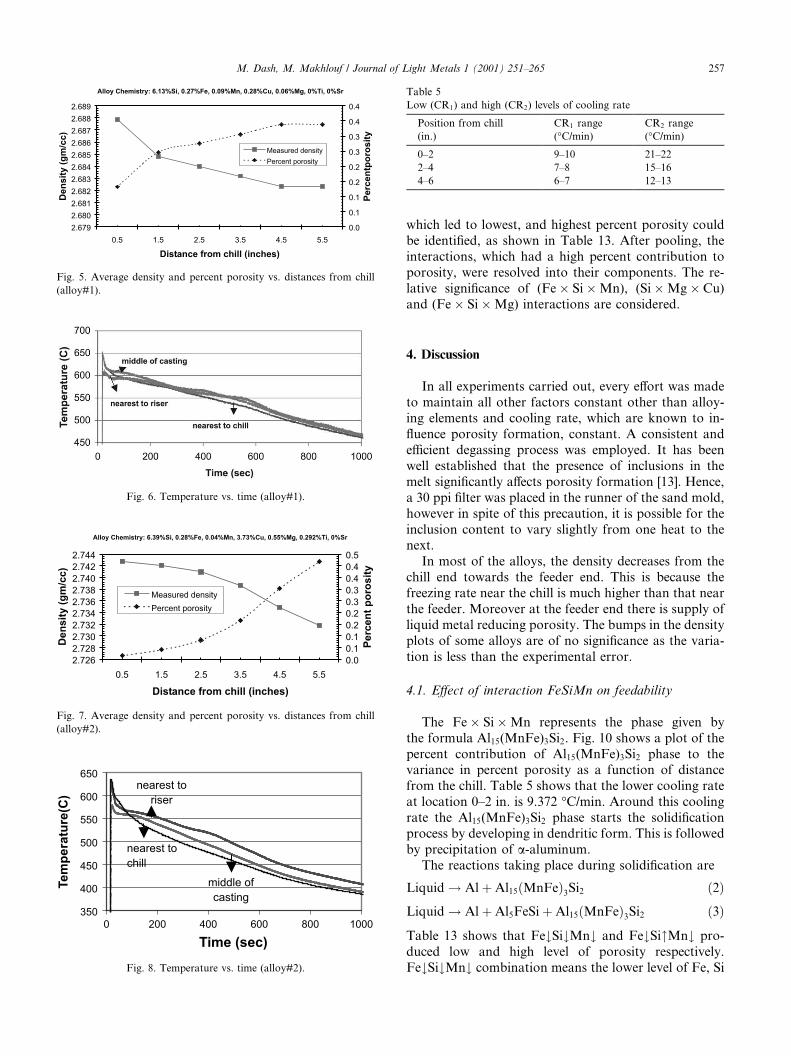
position from the chill. Figs. 5–8 shows the plot ofaverage density, percent porosity vs. distance from chill.Similarly the plots for the rest of the 16 alloys wereobtained. Table 5 shows the low (CR1) and high (CR2)cooling rate. CR1 and CR2 are the levels of independentvariable cooling rate.
3.1. Qualitative analysis
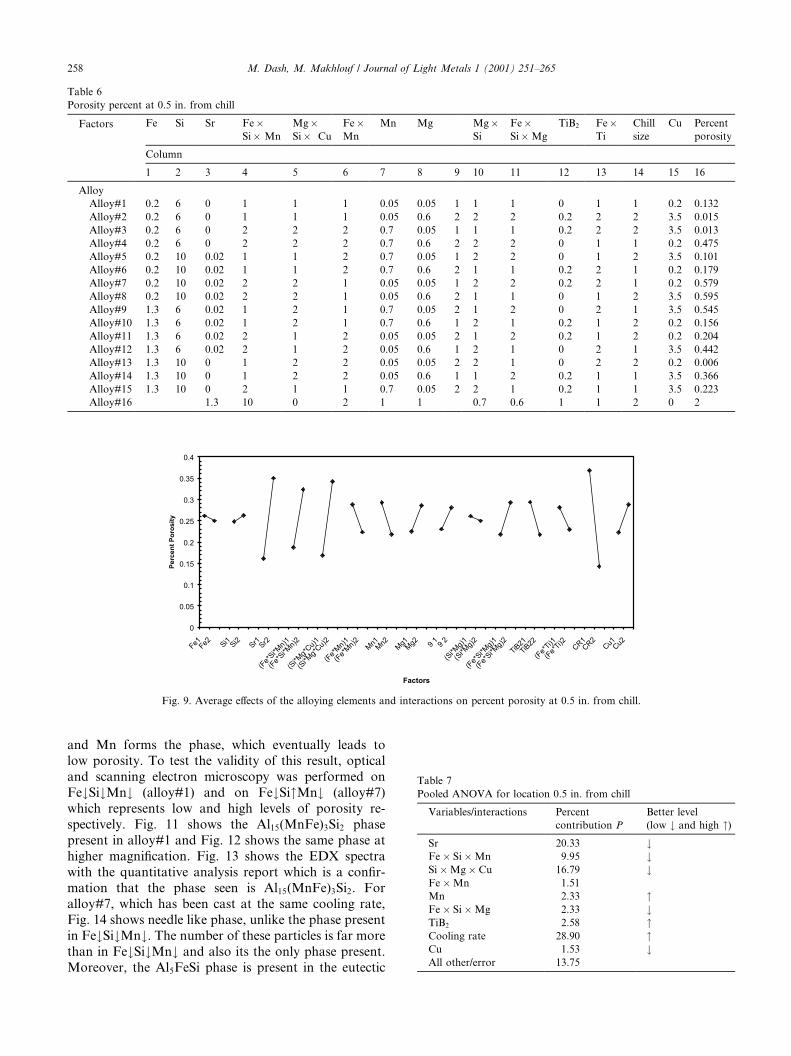
Qualitative analysis was carried out to evaluate theeffect of variables and interactions on percent porosity.The response of each variable is the average of percentporosity for each level in a given location. For example,at a given location 0.5 in. from chill for a variable, say,Fe at level 1 (0.2 wt%), i.e., for Fe1, the percent porosity,as given in the column 16 of Table 6 was averaged.Similarly, the average effect of the variable Fe at level 2(1.3 wt%), i.e., for Fe2, is calculated. In the same wayeffect of all other variables and interactions on percentporosity are determined. The computation of averageeffect for each variable and interaction on percent po-rosity is done for each of the six locations. Fig. 9 showsthe plot of average effects of all variables and interac-tions on percent porosity for the location 0.5 in. fromchill. The plot of average effects helps to know whichlevel of a variable is better for the desired quality re-quired. In other words, the plot shows which level of afactor is better for low percent porosity requirement.
3.2. Quantitative analysis
The data collected were mathematically interpretedusing analysis of variance (ANOVA). ANOVA allowscalculating the percent contribution of each of the fac-tors to the variance in the data [11]. The percent con-tribution indicates the relative power of a factor and/orinteraction to reduce variation. The percent contribu-tions of the various elements and interactions consideredto the alloys’ feedability after pooling procedure i.e.,after disregarding the insignificant contributions, areshown in Tables 7–12.
While designing the experiment those interactions,which were known to result in the formation of relevantphases, were included. Interaction effects are alwaysmixed with the main effects of the factors assigned tothe column designated for interaction (refer to Table 6).Though the interaction factors have two levels it doesnot have any significance. For example, the level 1 of(Fe � Si � Mn) does not mean anything unless it is re-solved into its components Fe, Si and Mn. It is becauseFe � Si � Mn interaction can occur by eight differentcombinations of Fe, Si and Mn. The different combi-nations can be Fe#Si#Mn#, Fe#Si#Mn", Fe#Si"Mn" etc.The different combinations gave rise to different porositylevels for the six locations. From this technique of re-solving into combinations, the particular combinations,
Fig. 4. Locations of samples used in the density measurements.
M. Dash, M. Makhlouf / Journal of Light Metals 1 (2001) 251–265 255
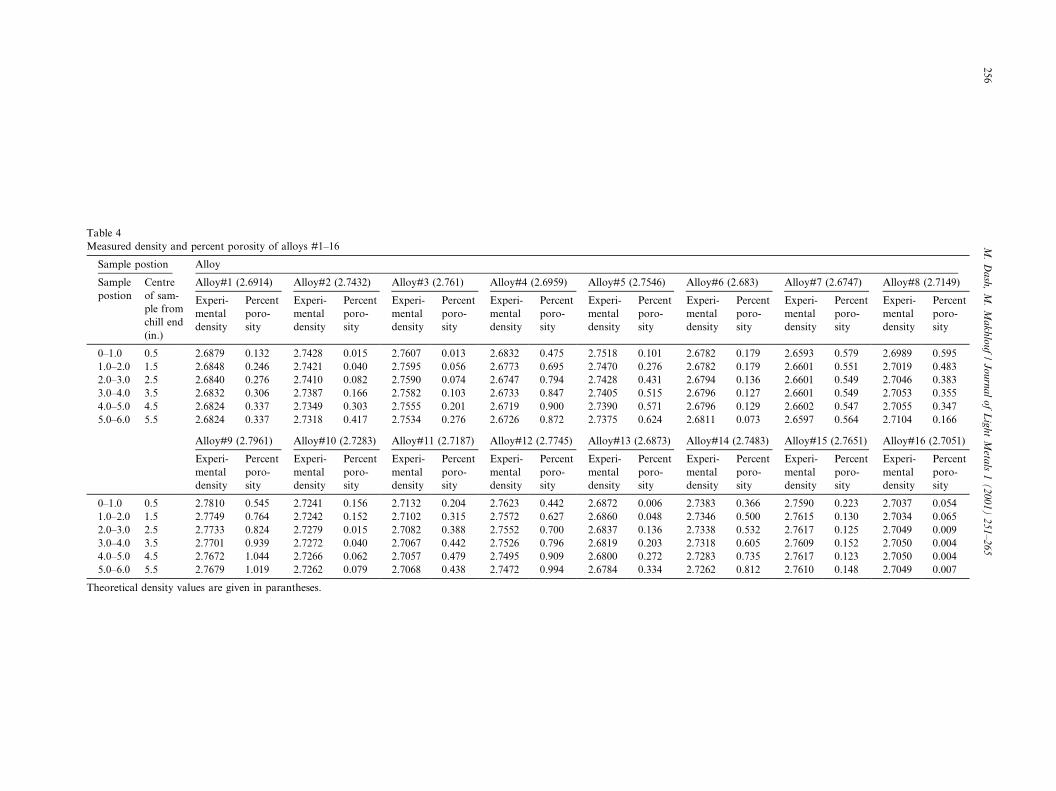
Table 4
Measured density and percent porosity of alloys #1–16
Sample postion Alloy
Sample
postion
Centre
of sam-
ple from
chill end
(in.)
Alloy#1 (2.6914) Alloy#2 (2.7432) Alloy#3 (2.761) Alloy#4 (2.6959) Alloy#5 (2.7546) Alloy#6 (2.683) Alloy#7 (2.6747) Alloy#8 (2.7149)
Experi-
mental
density
Percent
poro-
sity
Experi-
mental
density
Percent
poro-
sity
Experi-
mental
density
Percent
poro-
sity
Experi-
mental
density
Percent
poro-
sity
Experi-
mental
density
Percent
poro-
sity
Experi-
mental
density
Percent
poro-
sity
Experi-
mental
density
Percent
poro-
sity
Experi-
mental
density
Percent
poro-
sity
0–1.0 0.5 2.6879 0.132 2.7428 0.015 2.7607 0.013 2.6832 0.475 2.7518 0.101 2.6782 0.179 2.6593 0.579 2.6989 0.595
1.0–2.0 1.5 2.6848 0.246 2.7421 0.040 2.7595 0.056 2.6773 0.695 2.7470 0.276 2.6782 0.179 2.6601 0.551 2.7019 0.483
2.0–3.0 2.5 2.6840 0.276 2.7410 0.082 2.7590 0.074 2.6747 0.794 2.7428 0.431 2.6794 0.136 2.6601 0.549 2.7046 0.383
3.0–4.0 3.5 2.6832 0.306 2.7387 0.166 2.7582 0.103 2.6733 0.847 2.7405 0.515 2.6796 0.127 2.6601 0.549 2.7053 0.355
4.0–5.0 4.5 2.6824 0.337 2.7349 0.303 2.7555 0.201 2.6719 0.900 2.7390 0.571 2.6796 0.129 2.6602 0.547 2.7055 0.347
5.0–6.0 5.5 2.6824 0.337 2.7318 0.417 2.7534 0.276 2.6726 0.872 2.7375 0.624 2.6811 0.073 2.6597 0.564 2.7104 0.166
Alloy#9 (2.7961) Alloy#10 (2.7283) Alloy#11 (2.7187) Alloy#12 (2.7745) Alloy#13 (2.6873) Alloy#14 (2.7483) Alloy#15 (2.7651) Alloy#16 (2.7051)
Experi-
mental
density
Percent
poro-
sity
Experi-
mental
density
Percent
poro-
sity
Experi-
mental
density
Percent
poro-
sity
Experi-
mental
density
Percent
poro-
sity
Experi-
mental
density
Percent
poro-
sity
Experi-
mental
density
Percent
poro-
sity
Experi-
mental
density
Percent
poro-
sity
Experi-
mental
density
Percent
poro-
sity
0–1.0 0.5 2.7810 0.545 2.7241 0.156 2.7132 0.204 2.7623 0.442 2.6872 0.006 2.7383 0.366 2.7590 0.223 2.7037 0.054
1.0–2.0 1.5 2.7749 0.764 2.7242 0.152 2.7102 0.315 2.7572 0.627 2.6860 0.048 2.7346 0.500 2.7615 0.130 2.7034 0.065
2.0–3.0 2.5 2.7733 0.824 2.7279 0.015 2.7082 0.388 2.7552 0.700 2.6837 0.136 2.7338 0.532 2.7617 0.125 2.7049 0.009
3.0–4.0 3.5 2.7701 0.939 2.7272 0.040 2.7067 0.442 2.7526 0.796 2.6819 0.203 2.7318 0.605 2.7609 0.152 2.7050 0.004
4.0–5.0 4.5 2.7672 1.044 2.7266 0.062 2.7057 0.479 2.7495 0.909 2.6800 0.272 2.7283 0.735 2.7617 0.123 2.7050 0.004
5.0–6.0 5.5 2.7679 1.019 2.7262 0.079 2.7068 0.438 2.7472 0.994 2.6784 0.334 2.7262 0.812 2.7610 0.148 2.7049 0.007
Theoretical density values are given in parantheses.
256
M.D
ash
,M
.M
akhlo
uf
/Journ
alof
Lig
htM
etals
1(2001)
251–265
which led to lowest, and highest percent porosity couldbe identified, as shown in Table 13. After pooling, theinteractions, which had a high percent contribution toporosity, were resolved into their components. The re-lative significance of (Fe � Si � Mn), (Si � Mg � Cu)and (Fe � Si � Mg) interactions are considered.
4. Discussion
In all experiments carried out, every effort was madeto maintain all other factors constant other than alloy-ing elements and cooling rate, which are known to in-fluence porosity formation, constant. A consistent andefficient degassing process was employed. It has beenwell established that the presence of inclusions in themelt significantly affects porosity formation [13]. Hence,a 30 ppi filter was placed in the runner of the sand mold,however in spite of this precaution, it is possible for theinclusion content to vary slightly from one heat to thenext.
In most of the alloys, the density decreases from thechill end towards the feeder end. This is because thefreezing rate near the chill is much higher than that nearthe feeder. Moreover at the feeder end there is supply ofliquid metal reducing porosity. The bumps in the densityplots of some alloys are of no significance as the varia-tion is less than the experimental error.
4.1. Effect of interaction FeSiMn on feedability
The Fe � Si � Mn represents the phase given bythe formula Al15(MnFe)3Si2. Fig. 10 shows a plot of thepercent contribution of Al15(MnFe)3Si2 phase to thevariance in percent porosity as a function of distancefrom the chill. Table 5 shows that the lower cooling rateat location 0–2 in. is 9.372 �C/min. Around this coolingrate the Al15(MnFe)3Si2 phase starts the solidificationprocess by developing in dendritic form. This is followedby precipitation of a-aluminum.
The reactions taking place during solidification are
Liquid ! Al þ Al15ðMnFeÞ3Si2 ð2ÞLiquid ! Al þ Al5FeSi þ Al15ðMnFeÞ3Si2 ð3Þ
Table 13 shows that Fe#Si#Mn# and Fe#Si"Mn# pro-duced low and high level of porosity respectively.Fe#Si#Mn# combination means the lower level of Fe, Si
Fig. 5. Average density and percent porosity vs. distances from chill
(alloy#1).
Fig. 6. Temperature vs. time (alloy#1).
Fig. 7. Average density and percent porosity vs. distances from chill
(alloy#2).
Fig. 8. Temperature vs. time (alloy#2).
Table 5
Low (CR1) and high (CR2) levels of cooling rate
Position from chill
(in.)
CR1 range
(�C/min)
CR2 range
(�C/min)
0–2 9–10 21–22
2–4 7–8 15–16
4–6 6–7 12–13
M. Dash, M. Makhlouf / Journal of Light Metals 1 (2001) 251–265 257
and Mn forms the phase, which eventually leads tolow porosity. To test the validity of this result, opticaland scanning electron microscopy was performed onFe#Si#Mn# (alloy#1) and on Fe#Si"Mn# (alloy#7)which represents low and high levels of porosity re-spectively. Fig. 11 shows the Al15(MnFe)3Si2 phasepresent in alloy#1 and Fig. 12 shows the same phase athigher magnification. Fig. 13 shows the EDX spectrawith the quantitative analysis report which is a confir-mation that the phase seen is Al15(MnFe)3Si2. Foralloy#7, which has been cast at the same cooling rate,Fig. 14 shows needle like phase, unlike the phase presentin Fe#Si#Mn#. The number of these particles is far morethan in Fe#Si#Mn# and also its the only phase present.Moreover, the Al5FeSi phase is present in the eutectic
Fig. 9. Average effects of the alloying elements and interactions on percent porosity at 0.5 in. from chill.
Table 7
Pooled ANOVA for location 0.5 in. from chill
Variables/interactions Percent
contribution P
Better level
(low # and high ")
Sr 20.33 #Fe � Si � Mn 9.95 #Si � Mg � Cu 16.79 #Fe � Mn 1.51
Mn 2.33 "Fe � Si � Mg 2.33 #TiB2 2.58 "Cooling rate 28.90 "Cu 1.53 #All other/error 13.75
Table 6
Porosity percent at 0.5 in. from chill
Factors Fe Si Sr Fe�Si� Mn
Mg�Si� Cu
Fe�Mn
Mn Mg Mg�Si
Fe�Si� Mg
TiB2 Fe�Ti
Chill
size
Cu Percent
porosity
Column
1 2 3 4 5 6 7 8 9 10 11 12 13 14 15 16
Alloy
Alloy#1 0.2 6 0 1 1 1 0.05 0.05 1 1 1 0 1 1 0.2 0.132
Alloy#2 0.2 6 0 1 1 1 0.05 0.6 2 2 2 0.2 2 2 3.5 0.015
Alloy#3 0.2 6 0 2 2 2 0.7 0.05 1 1 1 0.2 2 2 3.5 0.013
Alloy#4 0.2 6 0 2 2 2 0.7 0.6 2 2 2 0 1 1 0.2 0.475
Alloy#5 0.2 10 0.02 1 1 2 0.7 0.05 1 2 2 0 1 2 3.5 0.101
Alloy#6 0.2 10 0.02 1 1 2 0.7 0.6 2 1 1 0.2 2 1 0.2 0.179
Alloy#7 0.2 10 0.02 2 2 1 0.05 0.05 1 2 2 0.2 2 1 0.2 0.579
Alloy#8 0.2 10 0.02 2 2 1 0.05 0.6 2 1 1 0 1 2 3.5 0.595
Alloy#9 1.3 6 0.02 1 2 1 0.7 0.05 2 1 2 0 2 1 3.5 0.545
Alloy#10 1.3 6 0.02 1 2 1 0.7 0.6 1 2 1 0.2 1 2 0.2 0.156
Alloy#11 1.3 6 0.02 2 1 2 0.05 0.05 2 1 2 0.2 1 2 0.2 0.204
Alloy#12 1.3 6 0.02 2 1 2 0.05 0.6 1 2 1 0 2 1 3.5 0.442
Alloy#13 1.3 10 0 1 2 2 0.05 0.05 2 2 1 0 2 2 0.2 0.006
Alloy#14 1.3 10 0 1 2 2 0.05 0.6 1 1 2 0.2 1 1 3.5 0.366
Alloy#15 1.3 10 0 2 1 1 0.7 0.05 2 2 1 0.2 1 1 3.5 0.223
Alloy#16 1.3 10 0 2 1 1 0.7 0.6 1 1 2 0 2
258 M. Dash, M. Makhlouf / Journal of Light Metals 1 (2001) 251–265
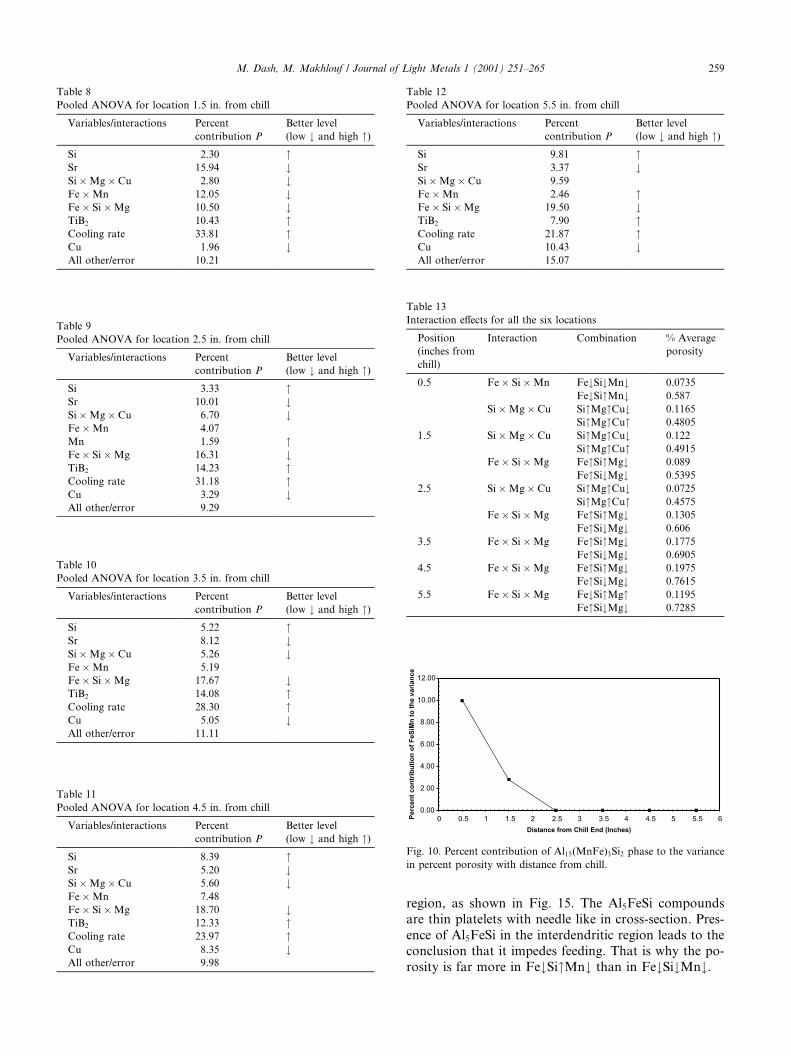
region, as shown in Fig. 15. The Al5FeSi compoundsare thin platelets with needle like in cross-section. Pres-ence of Al5FeSi in the interdendritic region leads to theconclusion that it impedes feeding. That is why the po-rosity is far more in Fe#Si"Mn# than in Fe#Si#Mn#.
Table 8
Pooled ANOVA for location 1.5 in. from chill
Variables/interactions Percent
contribution P
Better level
(low # and high ")
Si 2.30 "Sr 15.94 #Si � Mg � Cu 2.80 #Fe � Mn 12.05 #Fe � Si � Mg 10.50 #TiB2 10.43 "Cooling rate 33.81 "Cu 1.96 #All other/error 10.21
Table 9
Pooled ANOVA for location 2.5 in. from chill
Variables/interactions Percent
contribution P
Better level
(low # and high ")
Si 3.33 "Sr 10.01 #Si � Mg � Cu 6.70 #Fe � Mn 4.07
Mn 1.59 "Fe � Si � Mg 16.31 #TiB2 14.23 "Cooling rate 31.18 "Cu 3.29 #All other/error 9.29
Table 10
Pooled ANOVA for location 3.5 in. from chill
Variables/interactions Percent
contribution P
Better level
(low # and high ")
Si 5.22 "Sr 8.12 #Si � Mg � Cu 5.26 #Fe � Mn 5.19
Fe � Si � Mg 17.67 #TiB2 14.08 "Cooling rate 28.30 "Cu 5.05 #All other/error 11.11
Table 11
Pooled ANOVA for location 4.5 in. from chill
Variables/interactions Percent
contribution P
Better level
(low # and high ")
Si 8.39 "Sr 5.20 #Si � Mg � Cu 5.60 #Fe � Mn 7.48
Fe � Si � Mg 18.70 #TiB2 12.33 "Cooling rate 23.97 "Cu 8.35 #All other/error 9.98
Table 12
Pooled ANOVA for location 5.5 in. from chill
Variables/interactions Percent
contribution P
Better level
(low # and high ")
Si 9.81 "Sr 3.37 #Si � Mg � Cu 9.59
Fe � Mn 2.46 "Fe � Si � Mg 19.50 #TiB2 7.90 "Cooling rate 21.87 "Cu 10.43 #All other/error 15.07
Table 13
Interaction effects for all the six locations
Position
(inches from
chill)
Interaction Combination % Average
porosity
0.5 Fe � Si � Mn Fe#Si#Mn# 0.0735
Fe#Si"Mn# 0.587
Si � Mg � Cu Si"Mg"Cu# 0.1165
Si"Mg"Cu" 0.4805
1.5 Si � Mg � Cu Si"Mg"Cu# 0.122
Si"Mg"Cu" 0.4915
Fe � Si � Mg Fe"Si"Mg# 0.089
Fe"Si#Mg# 0.5395
2.5 Si � Mg � Cu Si"Mg"Cu# 0.0725
Si"Mg"Cu" 0.4575
Fe � Si � Mg Fe"Si"Mg# 0.1305
Fe"Si#Mg# 0.606
3.5 Fe � Si � Mg Fe"Si"Mg# 0.1775
Fe"Si#Mg# 0.6905
4.5 Fe � Si � Mg Fe"Si"Mg# 0.1975
Fe"Si#Mg# 0.7615
5.5 Fe � Si � Mg Fe#Si"Mg" 0.1195
Fe"Si#Mg# 0.7285
Fig. 10. Percent contribution of Al15(MnFe)3Si2 phase to the variance
in percent porosity with distance from chill.
M. Dash, M. Makhlouf / Journal of Light Metals 1 (2001) 251–265 259
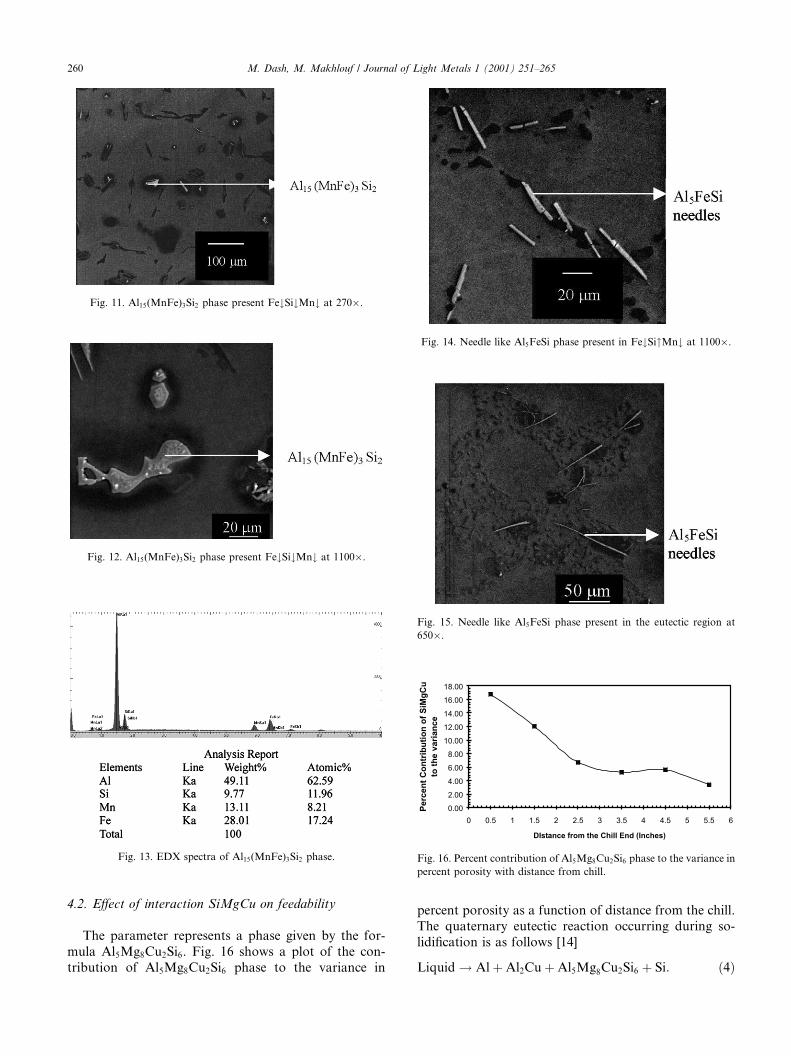
4.2. Effect of interaction SiMgCu on feedability
The parameter represents a phase given by the for-mula Al5Mg8Cu2Si6. Fig. 16 shows a plot of the con-tribution of Al5Mg8Cu2Si6 phase to the variance in
percent porosity as a function of distance from the chill.The quaternary eutectic reaction occurring during so-lidification is as follows [14]
Liquid ! Al þ Al2Cu þ Al5Mg8Cu2Si6 þ Si: ð4Þ
Fig. 11. Al15(MnFe)3Si2 phase present Fe#Si#Mn# at 270�.
Fig. 12. Al15(MnFe)3Si2 phase present Fe#Si#Mn# at 1100�.
Fig. 13. EDX spectra of Al15(MnFe)3Si2 phase.
Fig. 14. Needle like Al5FeSi phase present in Fe#Si"Mn# at 1100�.
Fig. 15. Needle like Al5FeSi phase present in the eutectic region at
650�.
Fig. 16. Percent contribution of Al5Mg8Cu2Si6 phase to the variance in
percent porosity with distance from chill.
260 M. Dash, M. Makhlouf / Journal of Light Metals 1 (2001) 251–265
The Al5Mg8Cu2Si6 phase forms towards the end of so-lidification. The Si"Mg"Cu# (Table 13) produced theleast porosity from chill end to mid of casting. ThereforeSi"Mg"Cu# helps in feeding at the chill end i.e., whenthe cooling rate is high. At moderate and slow coolingrates the percent contribution of this phase to the vari-ance in percent porosity is negligible as seen in Fig. 16.From Tables 7 and 8, the interaction Si � Mg � Cu hasnegative contribution of 16.79% and 12.05% at 0.5 and1.5 in. from the chill respectively. Considering the po-sition 0.5 in. from chill, Table 13 shows that Si"Mg"Cu#and Si"Mg"Cu" produced low and high levels of po-rosity respectively. To test the validity of this result,optical and scanning electron microscopy was per-formed on Si"Mg"Cu# (alloy#6) and on Si"Mg"Cu"(alloy#14), which produced low and high levels ofporosity respectively.
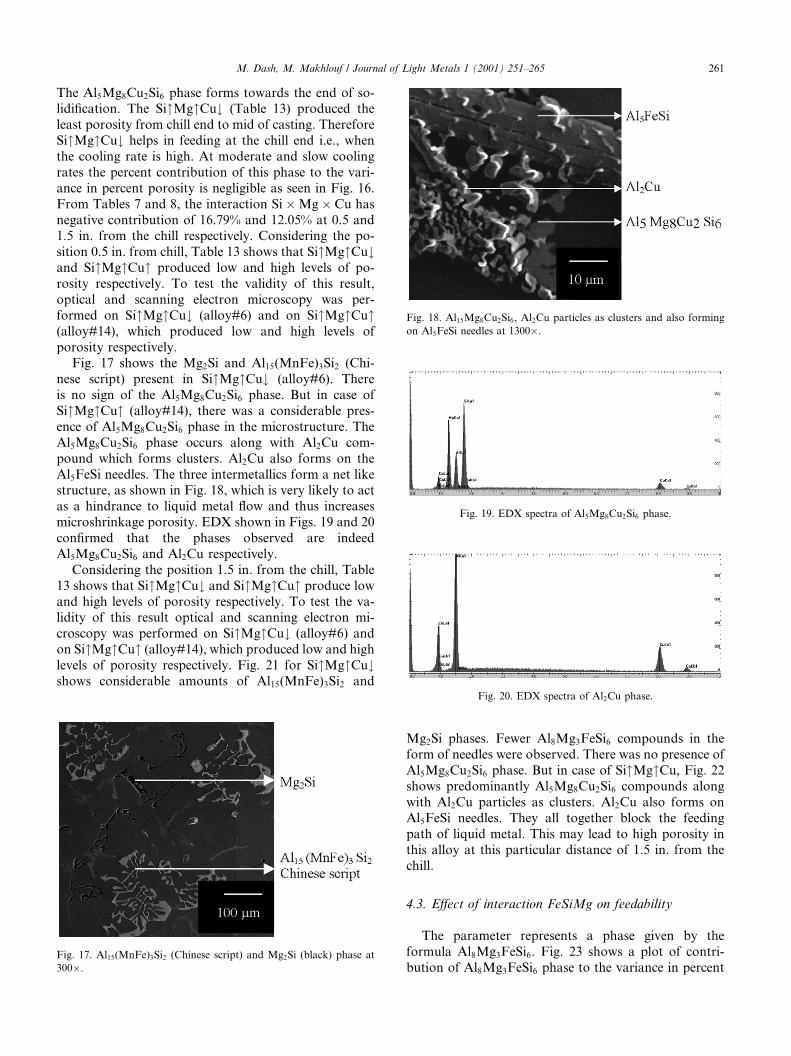
Fig. 17 shows the Mg2Si and Al15(MnFe)3Si2 (Chi-nese script) present in Si"Mg"Cu# (alloy#6). Thereis no sign of the Al5Mg8Cu2Si6 phase. But in case ofSi"Mg"Cu" (alloy#14), there was a considerable pres-ence of Al5Mg8Cu2Si6 phase in the microstructure. TheAl5Mg8Cu2Si6 phase occurs along with Al2Cu com-pound which forms clusters. Al2Cu also forms on theAl5FeSi needles. The three intermetallics form a net likestructure, as shown in Fig. 18, which is very likely to actas a hindrance to liquid metal flow and thus increasesmicroshrinkage porosity. EDX shown in Figs. 19 and 20confirmed that the phases observed are indeedAl5Mg8Cu2Si6 and Al2Cu respectively.
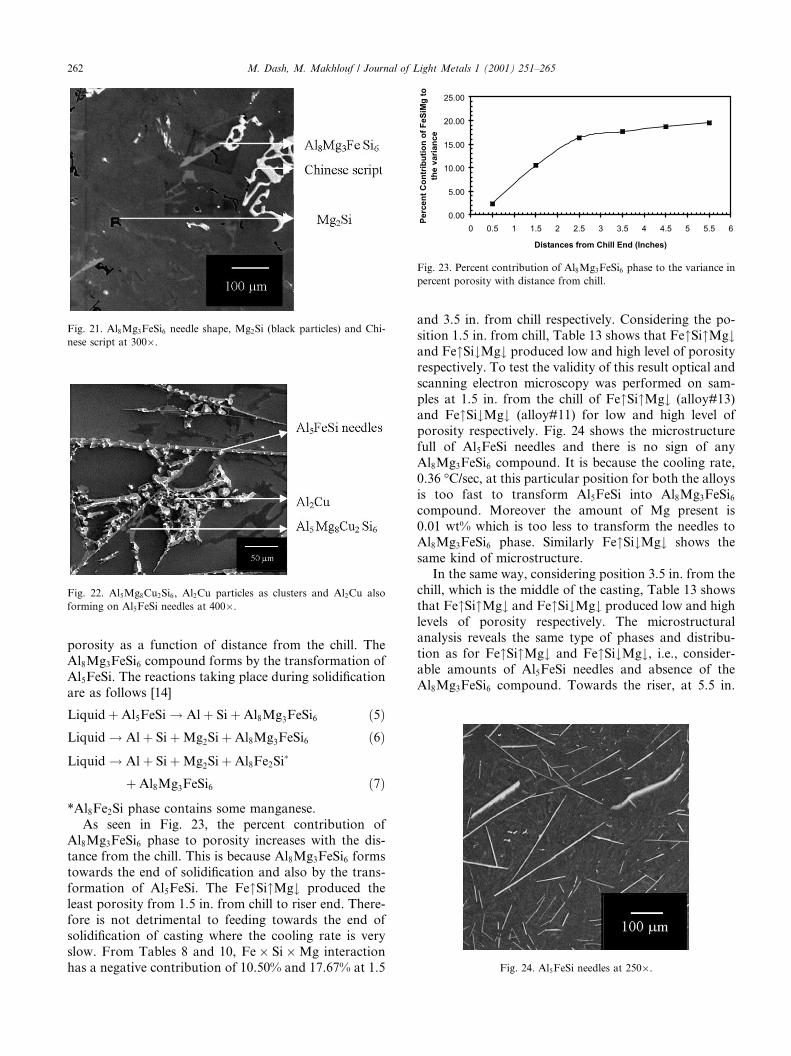
Considering the position 1.5 in. from the chill, Table13 shows that Si"Mg"Cu# and Si"Mg"Cu" produce lowand high levels of porosity respectively. To test the va-lidity of this result optical and scanning electron mi-croscopy was performed on Si"Mg"Cu# (alloy#6) andon Si"Mg"Cu" (alloy#14), which produced low and highlevels of porosity respectively. Fig. 21 for Si"Mg"Cu#shows considerable amounts of Al15(MnFe)3Si2 and
Mg2Si phases. Fewer Al8Mg3FeSi6 compounds in theform of needles were observed. There was no presence ofAl5Mg8Cu2Si6 phase. But in case of Si"Mg"Cu, Fig. 22shows predominantly Al5Mg8Cu2Si6 compounds alongwith Al2Cu particles as clusters. Al2Cu also forms onAl5FeSi needles. They all together block the feedingpath of liquid metal. This may lead to high porosity inthis alloy at this particular distance of 1.5 in. from thechill.
4.3. Effect of interaction FeSiMg on feedability
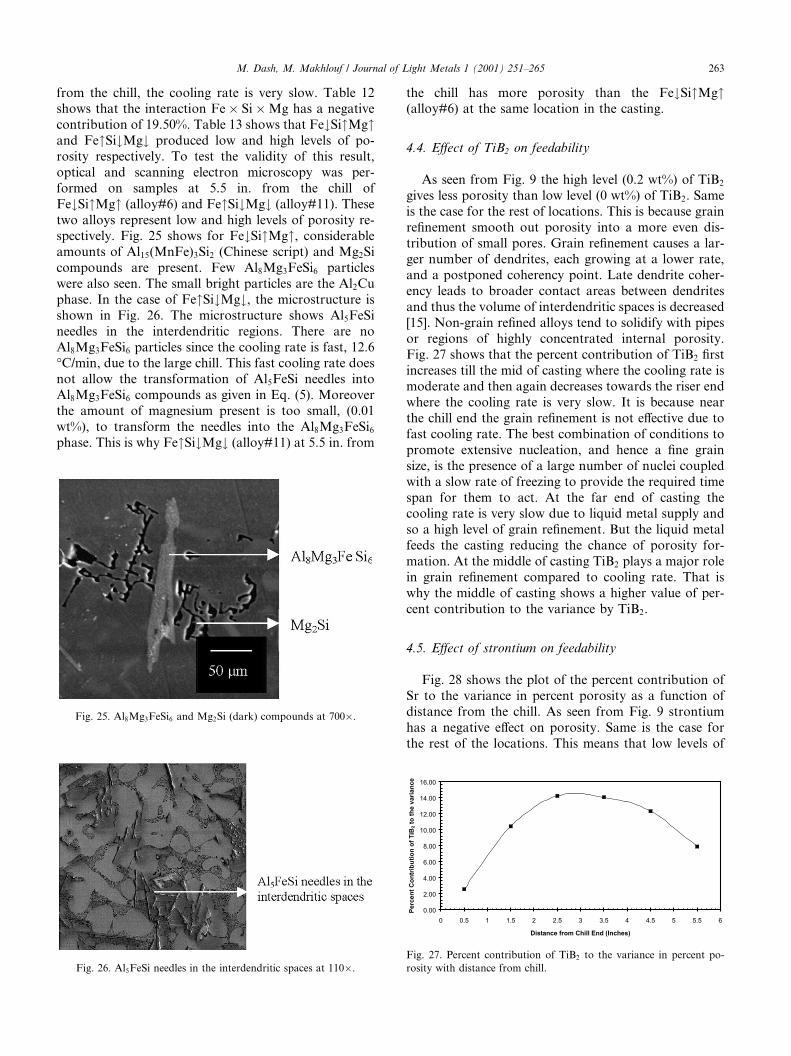
The parameter represents a phase given by theformula Al8Mg3FeSi6. Fig. 23 shows a plot of contri-bution of Al8Mg3FeSi6 phase to the variance in percent
Fig. 17. Al15(MnFe)3Si2 (Chinese script) and Mg2Si (black) phase at
300�.
Fig. 18. Al15Mg8Cu2Si6, Al2Cu particles as clusters and also forming
on Al5FeSi needles at 1300�.
Fig. 19. EDX spectra of Al5Mg8Cu2Si6 phase.
Fig. 20. EDX spectra of Al2Cu phase.
M. Dash, M. Makhlouf / Journal of Light Metals 1 (2001) 251–265 261
porosity as a function of distance from the chill. TheAl8Mg3FeSi6 compound forms by the transformation ofAl5FeSi. The reactions taking place during solidificationare as follows [14]
Liquid þ Al5FeSi ! Al þ Si þ Al8Mg3FeSi6 ð5ÞLiquid ! Al þ Si þ Mg2Si þ Al8Mg3FeSi6 ð6ÞLiquid ! Al þ Si þ Mg2Si þ Al8Fe2Si�
þ Al8Mg3FeSi6 ð7Þ
*Al8Fe2Si phase contains some manganese.As seen in Fig. 23, the percent contribution of
Al8Mg3FeSi6 phase to porosity increases with the dis-tance from the chill. This is because Al8Mg3FeSi6 formstowards the end of solidification and also by the trans-formation of Al5FeSi. The Fe"Si"Mg# produced theleast porosity from 1.5 in. from chill to riser end. There-fore is not detrimental to feeding towards the end ofsolidification of casting where the cooling rate is veryslow. From Tables 8 and 10, Fe � Si � Mg interactionhas a negative contribution of 10.50% and 17.67% at 1.5
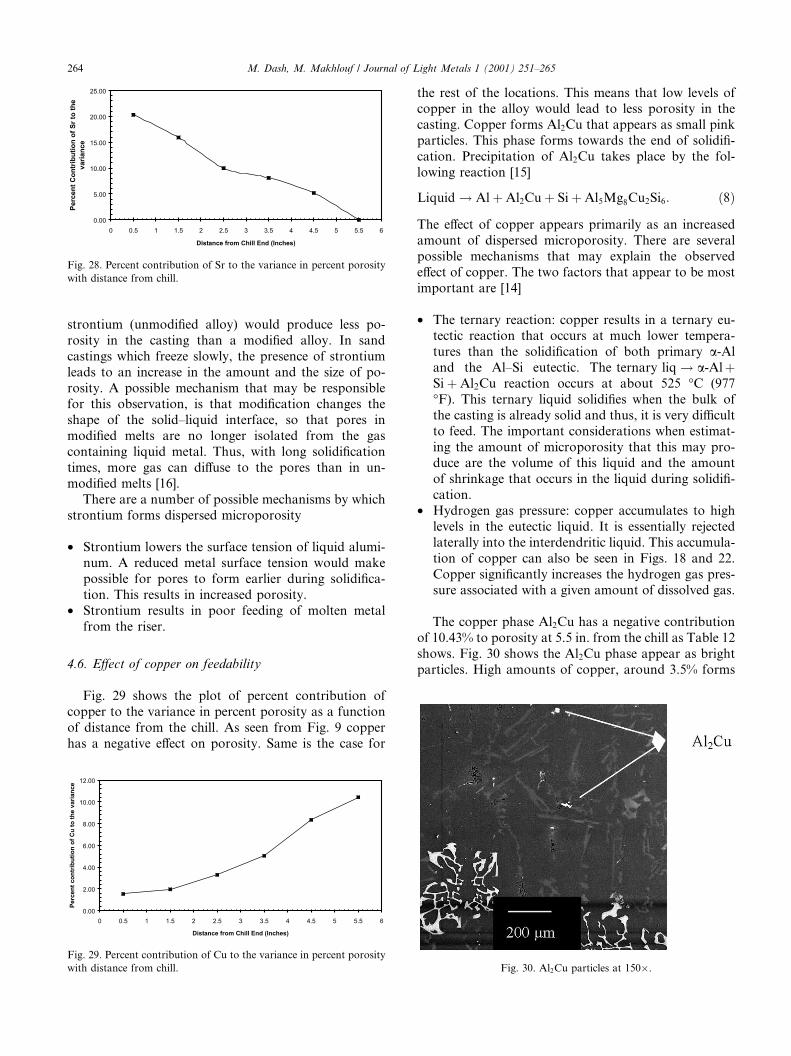
and 3.5 in. from chill respectively. Considering the po-sition 1.5 in. from chill, Table 13 shows that Fe"Si"Mg#and Fe"Si#Mg# produced low and high level of porosityrespectively. To test the validity of this result optical andscanning electron microscopy was performed on sam-ples at 1.5 in. from the chill of Fe"Si"Mg# (alloy#13)and Fe"Si#Mg# (alloy#11) for low and high level ofporosity respectively. Fig. 24 shows the microstructurefull of Al5FeSi needles and there is no sign of anyAl8Mg3FeSi6 compound. It is because the cooling rate,0.36 �C/sec, at this particular position for both the alloysis too fast to transform Al5FeSi into Al8Mg3FeSi6compound. Moreover the amount of Mg present is0.01 wt% which is too less to transform the needles toAl8Mg3FeSi6 phase. Similarly Fe"Si#Mg# shows thesame kind of microstructure.
In the same way, considering position 3.5 in. from thechill, which is the middle of the casting, Table 13 showsthat Fe"Si"Mg# and Fe"Si#Mg# produced low and highlevels of porosity respectively. The microstructuralanalysis reveals the same type of phases and distribu-tion as for Fe"Si"Mg# and Fe"Si#Mg#, i.e., consider-able amounts of Al5FeSi needles and absence of theAl8Mg3FeSi6 compound. Towards the riser, at 5.5 in.
Fig. 21. Al8Mg3FeSi6 needle shape, Mg2Si (black particles) and Chi-
nese script at 300�.
Fig. 22. Al5Mg8Cu2Si6, Al2Cu particles as clusters and Al2Cu also
forming on Al5FeSi needles at 400�.
Fig. 23. Percent contribution of Al8Mg3FeSi6 phase to the variance in
percent porosity with distance from chill.
Fig. 24. Al5FeSi needles at 250�.
262 M. Dash, M. Makhlouf / Journal of Light Metals 1 (2001) 251–265
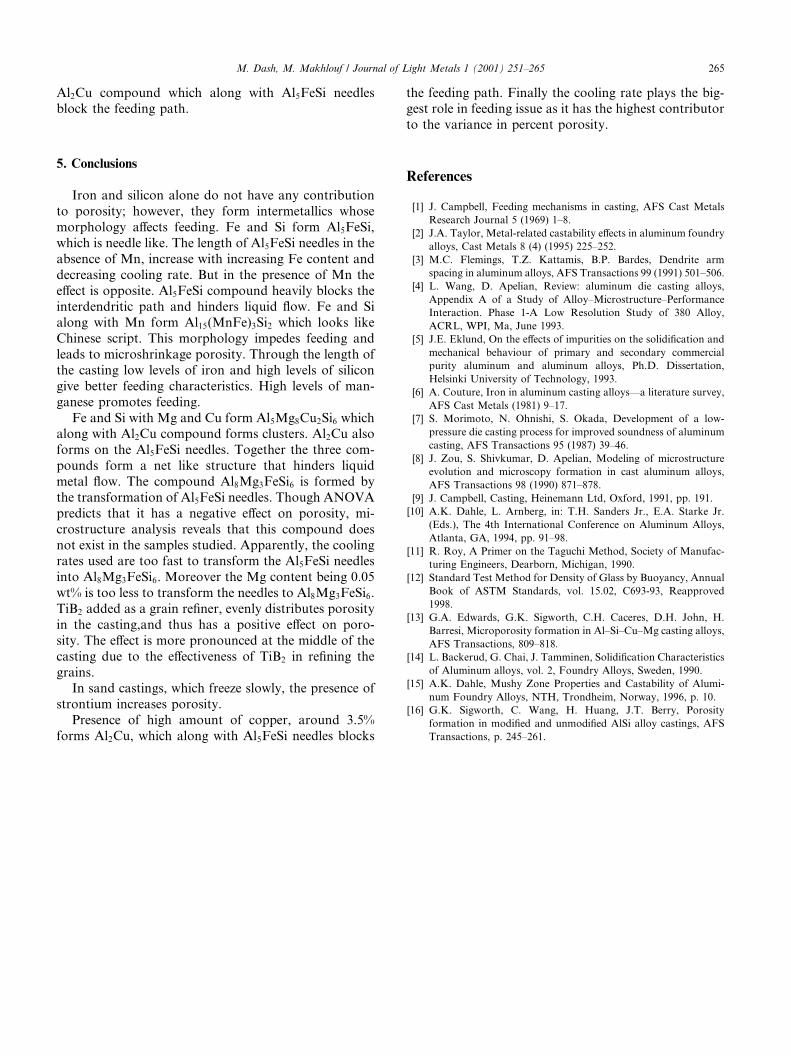
from the chill, the cooling rate is very slow. Table 12shows that the interaction Fe � Si � Mg has a negativecontribution of 19.50%. Table 13 shows that Fe#Si"Mg"and Fe"Si#Mg# produced low and high levels of po-rosity respectively. To test the validity of this result,optical and scanning electron microscopy was per-formed on samples at 5.5 in. from the chill ofFe#Si"Mg" (alloy#6) and Fe"Si#Mg# (alloy#11). Thesetwo alloys represent low and high levels of porosity re-spectively. Fig. 25 shows for Fe#Si"Mg", considerableamounts of Al15(MnFe)3Si2 (Chinese script) and Mg2Sicompounds are present. Few Al8Mg3FeSi6 particleswere also seen. The small bright particles are the Al2Cuphase. In the case of Fe"Si#Mg#, the microstructure isshown in Fig. 26. The microstructure shows Al5FeSineedles in the interdendritic regions. There are noAl8Mg3FeSi6 particles since the cooling rate is fast, 12.6�C/min, due to the large chill. This fast cooling rate doesnot allow the transformation of Al5FeSi needles intoAl8Mg3FeSi6 compounds as given in Eq. (5). Moreoverthe amount of magnesium present is too small, (0.01wt%), to transform the needles into the Al8Mg3FeSi6phase. This is why Fe"Si#Mg# (alloy#11) at 5.5 in. from
the chill has more porosity than the Fe#Si"Mg"(alloy#6) at the same location in the casting.
4.4. Effect of TiB2 on feedability
As seen from Fig. 9 the high level (0.2 wt%) of TiB2
gives less porosity than low level (0 wt%) of TiB2. Sameis the case for the rest of locations. This is because grainrefinement smooth out porosity into a more even dis-tribution of small pores. Grain refinement causes a lar-ger number of dendrites, each growing at a lower rate,and a postponed coherency point. Late dendrite coher-ency leads to broader contact areas between dendritesand thus the volume of interdendritic spaces is decreased[15]. Non-grain refined alloys tend to solidify with pipesor regions of highly concentrated internal porosity.Fig. 27 shows that the percent contribution of TiB2 firstincreases till the mid of casting where the cooling rate ismoderate and then again decreases towards the riser endwhere the cooling rate is very slow. It is because nearthe chill end the grain refinement is not effective due tofast cooling rate. The best combination of conditions topromote extensive nucleation, and hence a fine grainsize, is the presence of a large number of nuclei coupledwith a slow rate of freezing to provide the required timespan for them to act. At the far end of casting thecooling rate is very slow due to liquid metal supply andso a high level of grain refinement. But the liquid metalfeeds the casting reducing the chance of porosity for-mation. At the middle of casting TiB2 plays a major rolein grain refinement compared to cooling rate. That iswhy the middle of casting shows a higher value of per-cent contribution to the variance by TiB2.
4.5. Effect of strontium on feedability
Fig. 28 shows the plot of the percent contribution ofSr to the variance in percent porosity as a function ofdistance from the chill. As seen from Fig. 9 strontiumhas a negative effect on porosity. Same is the case forthe rest of the locations. This means that low levels of
Fig. 25. Al8Mg3FeSi6 and Mg2Si (dark) compounds at 700�.
Fig. 26. Al5FeSi needles in the interdendritic spaces at 110�.
Fig. 27. Percent contribution of TiB2 to the variance in percent po-
rosity with distance from chill.
M. Dash, M. Makhlouf / Journal of Light Metals 1 (2001) 251–265 263
strontium (unmodified alloy) would produce less po-rosity in the casting than a modified alloy. In sandcastings which freeze slowly, the presence of strontiumleads to an increase in the amount and the size of po-rosity. A possible mechanism that may be responsiblefor this observation, is that modification changes theshape of the solid–liquid interface, so that pores inmodified melts are no longer isolated from the gascontaining liquid metal. Thus, with long solidificationtimes, more gas can diffuse to the pores than in un-modified melts [16].
There are a number of possible mechanisms by whichstrontium forms dispersed microporosity
• Strontium lowers the surface tension of liquid alumi-num. A reduced metal surface tension would makepossible for pores to form earlier during solidifica-tion. This results in increased porosity.
• Strontium results in poor feeding of molten metalfrom the riser.
4.6. Effect of copper on feedability
Fig. 29 shows the plot of percent contribution ofcopper to the variance in percent porosity as a functionof distance from the chill. As seen from Fig. 9 copperhas a negative effect on porosity. Same is the case for
the rest of the locations. This means that low levels ofcopper in the alloy would lead to less porosity in thecasting. Copper forms Al2Cu that appears as small pinkparticles. This phase forms towards the end of solidifi-cation. Precipitation of Al2Cu takes place by the fol-lowing reaction [15]
Liquid ! Al þ Al2Cu þ Si þ Al5Mg8Cu2Si6: ð8Þ
The effect of copper appears primarily as an increasedamount of dispersed microporosity. There are severalpossible mechanisms that may explain the observedeffect of copper. The two factors that appear to be mostimportant are [14]
• The ternary reaction: copper results in a ternary eu-tectic reaction that occurs at much lower tempera-tures than the solidification of both primary a-Aland the Al–Si eutectic. The ternary liq ! a-AlþSi þ Al2Cu reaction occurs at about 525 �C (977�F). This ternary liquid solidifies when the bulk ofthe casting is already solid and thus, it is very difficultto feed. The important considerations when estimat-ing the amount of microporosity that this may pro-duce are the volume of this liquid and the amountof shrinkage that occurs in the liquid during solidifi-cation.
• Hydrogen gas pressure: copper accumulates to highlevels in the eutectic liquid. It is essentially rejectedlaterally into the interdendritic liquid. This accumula-tion of copper can also be seen in Figs. 18 and 22.Copper significantly increases the hydrogen gas pres-sure associated with a given amount of dissolved gas.
The copper phase Al2Cu has a negative contributionof 10.43% to porosity at 5.5 in. from the chill as Table 12shows. Fig. 30 shows the Al2Cu phase appear as brightparticles. High amounts of copper, around 3.5% forms
Fig. 28. Percent contribution of Sr to the variance in percent porosity
with distance from chill.
Fig. 29. Percent contribution of Cu to the variance in percent porosity
with distance from chill. Fig. 30. Al2Cu particles at 150�.
264 M. Dash, M. Makhlouf / Journal of Light Metals 1 (2001) 251–265
Al2Cu compound which along with Al5FeSi needlesblock the feeding path.
5. Conclusions
Iron and silicon alone do not have any contributionto porosity; however, they form intermetallics whosemorphology affects feeding. Fe and Si form Al5FeSi,which is needle like. The length of Al5FeSi needles in theabsence of Mn, increase with increasing Fe content anddecreasing cooling rate. But in the presence of Mn theeffect is opposite. Al5FeSi compound heavily blocks theinterdendritic path and hinders liquid flow. Fe and Sialong with Mn form Al15(MnFe)3Si2 which looks likeChinese script. This morphology impedes feeding andleads to microshrinkage porosity. Through the length ofthe casting low levels of iron and high levels of silicongive better feeding characteristics. High levels of man-ganese promotes feeding.
Fe and Si with Mg and Cu form Al5Mg8Cu2Si6 whichalong with Al2Cu compound forms clusters. Al2Cu alsoforms on the Al5FeSi needles. Together the three com-pounds form a net like structure that hinders liquidmetal flow. The compound Al8Mg3FeSi6 is formed bythe transformation of Al5FeSi needles. Though ANOVApredicts that it has a negative effect on porosity, mi-crostructure analysis reveals that this compound doesnot exist in the samples studied. Apparently, the coolingrates used are too fast to transform the Al5FeSi needlesinto Al8Mg3FeSi6. Moreover the Mg content being 0.05wt% is too less to transform the needles to Al8Mg3FeSi6.TiB2 added as a grain refiner, evenly distributes porosityin the casting,and thus has a positive effect on poro-sity. The effect is more pronounced at the middle of thecasting due to the effectiveness of TiB2 in refining thegrains.
In sand castings, which freeze slowly, the presence ofstrontium increases porosity.
Presence of high amount of copper, around 3.5%forms Al2Cu, which along with Al5FeSi needles blocks
the feeding path. Finally the cooling rate plays the big-gest role in feeding issue as it has the highest contributorto the variance in percent porosity.
References
[1] J. Campbell, Feeding mechanisms in casting, AFS Cast Metals
Research Journal 5 (1969) 1–8.
[2] J.A. Taylor, Metal-related castability effects in aluminum foundry
alloys, Cast Metals 8 (4) (1995) 225–252.
[3] M.C. Flemings, T.Z. Kattamis, B.P. Bardes, Dendrite arm
spacing in aluminum alloys, AFS Transactions 99 (1991) 501–506.
[4] L. Wang, D. Apelian, Review: aluminum die casting alloys,
Appendix A of a Study of Alloy–Microstructure–Performance
Interaction. Phase 1-A Low Resolution Study of 380 Alloy,
ACRL, WPI, Ma, June 1993.
[5] J.E. Eklund, On the effects of impurities on the solidification and
mechanical behaviour of primary and secondary commercial
purity aluminum and aluminum alloys, Ph.D. Dissertation,
Helsinki University of Technology, 1993.
[6] A. Couture, Iron in aluminum casting alloys––a literature survey,
AFS Cast Metals (1981) 9–17.
[7] S. Morimoto, N. Ohnishi, S. Okada, Development of a low-
pressure die casting process for improved soundness of aluminum
casting, AFS Transactions 95 (1987) 39–46.
[8] J. Zou, S. Shivkumar, D. Apelian, Modeling of microstructure
evolution and microscopy formation in cast aluminum alloys,
AFS Transactions 98 (1990) 871–878.
[9] J. Campbell, Casting, Heinemann Ltd, Oxford, 1991, pp. 191.
[10] A.K. Dahle, L. Arnberg, in: T.H. Sanders Jr., E.A. Starke Jr.
(Eds.), The 4th International Conference on Aluminum Alloys,
Atlanta, GA, 1994, pp. 91–98.
[11] R. Roy, A Primer on the Taguchi Method, Society of Manufac-
turing Engineers, Dearborn, Michigan, 1990.
[12] Standard Test Method for Density of Glass by Buoyancy, Annual
Book of ASTM Standards, vol. 15.02, C693-93, Reapproved
1998.
[13] G.A. Edwards, G.K. Sigworth, C.H. Caceres, D.H. John, H.
Barresi, Microporosity formation in Al–Si–Cu–Mg casting alloys,
AFS Transactions, 809–818.
[14] L. Backerud, G. Chai, J. Tamminen, Solidification Characteristics
of Aluminum alloys, vol. 2, Foundry Alloys, Sweden, 1990.
[15] A.K. Dahle, Mushy Zone Properties and Castability of Alumi-
num Foundry Alloys, NTH, Trondheim, Norway, 1996, p. 10.
[16] G.K. Sigworth, C. Wang, H. Huang, J.T. Berry, Porosity
formation in modified and unmodified AlSi alloy castings, AFS
Transactions, p. 245–261.
M. Dash, M. Makhlouf / Journal of Light Metals 1 (2001) 251–265 265
Related Documents