Effect of ion concentration on slow light propagation in highly doped erbium fibers Sonia Melle a, * , Oscar G. Caldero ´n a , F. Carren ˜o a , Eduardo Cabrera a , M.A. Anto ´n a , S. Jarabo b a Escuela Universitaria de O ´ ptica, Universidad Complutense de Madrid, C/ Arcos de Jalo ´ n s/n, 28037 Madrid, Spain b Departamento de Fı ´sica Aplicada, Facultad de Ciencias, Universidad de Zaragoza, Pedro Cerbuna 12, 50009 Zaragoza, Spain Received 4 August 2006; received in revised form 28 June 2007; accepted 30 June 2007 Abstract The effect of ion density on slow light propagation enabled by coherent population oscillations has been experimentally investigated for highly doped erbium fibers at room temperature. We found that fractional delay increases with ion density. A saturation effect in the fractional delay has been observed for doping levels above 3150 ppm. Ultra-high ion concentration can simultaneously increase the fractional delay and the bandwidth of the signals. We have studied the propagation of Gaussian pulses along the fibers obtaining frac- tional delays up to 0.7 for the highest doping levels used. It is shown that pulse power can be used as a control parameter to reduce distortion at different pulse bandwidths. Ó 2007 Elsevier B.V. All rights reserved. PACS: 42.65.k; 42.50.Gy Keywords: Slow-light propagation; Coherence population oscillations; Erbium doped fibers 1. Introduction The process of coherent population oscillations (CPO) allows the reduction of absorption and simultaneously pro- vides a steep spectral variation of the refractive index which leads to a strong reduction of the optical group velocity, i.e., slow light propagation. This process is easily achieved in a two-level system which interacts with a signal whose amplitude is periodically modulated. The population of the ground state of the medium will be induced to oscillate at the modulation frequency. This oscillation creates a nar- row hole in the absorption spectrum, whose linewidth is proportional to the inverse of the relaxation lifetime of the excited level [1]. CPO is highly insensitive to dephasing processes in contrast to what happens in other schema such as electromagnetically induced transparency (EIT) [2–7], where the width of the spectral hole burned in the absorp- tion profile is proportional to the inverse of the dephasing time of the ground state. That makes CPO an appropriate technique to easily achieve slow light propagation in solid- state materials at room temperature. The first experiment concerning slow light propagation using CPO at room temperature was carried out by Bige- low et al. [8]. They reported a reduction of the speed of light in a 7.25-cm-long ruby rod down to 57 m/s by produc- ing a hole as narrow as 36 Hz (HWHM) in the absorption spectrum. Thus, pulses of 25 ms width (FWHM) were delayed by 0.71 ms and fractional delays of 0.028 were reached. Later, other materials were shown to successfully produce slow-light propagation based on CPO, as in alex- andrite crystals [9] and in semiconductor structures [10–12]. Furthermore, using cryogenic temperatures, a decrease of group velocity down to 3 m/s was recently reported in a 3-mm-long erbium-doped crystal [13]. Thanks to the long 0030-4018/$ - see front matter Ó 2007 Elsevier B.V. All rights reserved. doi:10.1016/j.optcom.2007.06.053 * Corresponding author. Tel.: +34 913946909; fax: +34 913946885. E-mail address: smelle@fis.ucm.es (S. Melle). URL: http://www.ucm.es/info/laserlab. www.elsevier.com/locate/optcom Optics Communications 279 (2007) 53–63

Welcome message from author
This document is posted to help you gain knowledge. Please leave a comment to let me know what you think about it! Share it to your friends and learn new things together.
Transcript
www.elsevier.com/locate/optcom
Optics Communications 279 (2007) 53–63
Effect of ion concentration on slow light propagationin highly doped erbium fibers
Sonia Melle a,*, Oscar G. Calderon a, F. Carreno a, Eduardo Cabrera a,M.A. Anton a, S. Jarabo b
a Escuela Universitaria de Optica, Universidad Complutense de Madrid, C/ Arcos de Jalon s/n, 28037 Madrid, Spainb Departamento de Fısica Aplicada, Facultad de Ciencias, Universidad de Zaragoza, Pedro Cerbuna 12, 50009 Zaragoza, Spain
Received 4 August 2006; received in revised form 28 June 2007; accepted 30 June 2007
Abstract
The effect of ion density on slow light propagation enabled by coherent population oscillations has been experimentally investigatedfor highly doped erbium fibers at room temperature. We found that fractional delay increases with ion density. A saturation effect in thefractional delay has been observed for doping levels above �3150 ppm. Ultra-high ion concentration can simultaneously increase thefractional delay and the bandwidth of the signals. We have studied the propagation of Gaussian pulses along the fibers obtaining frac-tional delays up to 0.7 for the highest doping levels used. It is shown that pulse power can be used as a control parameter to reducedistortion at different pulse bandwidths.� 2007 Elsevier B.V. All rights reserved.
PACS: 42.65.�k; 42.50.Gy
Keywords: Slow-light propagation; Coherence population oscillations; Erbium doped fibers
1. Introduction
The process of coherent population oscillations (CPO)allows the reduction of absorption and simultaneously pro-vides a steep spectral variation of the refractive index whichleads to a strong reduction of the optical group velocity,i.e., slow light propagation. This process is easily achievedin a two-level system which interacts with a signal whoseamplitude is periodically modulated. The population ofthe ground state of the medium will be induced to oscillateat the modulation frequency. This oscillation creates a nar-row hole in the absorption spectrum, whose linewidth isproportional to the inverse of the relaxation lifetime ofthe excited level [1]. CPO is highly insensitive to dephasingprocesses in contrast to what happens in other schema such
0030-4018/$ - see front matter � 2007 Elsevier B.V. All rights reserved.
doi:10.1016/j.optcom.2007.06.053
* Corresponding author. Tel.: +34 913946909; fax: +34 913946885.E-mail address: [email protected] (S. Melle).URL: http://www.ucm.es/info/laserlab.
as electromagnetically induced transparency (EIT) [2–7],where the width of the spectral hole burned in the absorp-tion profile is proportional to the inverse of the dephasingtime of the ground state. That makes CPO an appropriatetechnique to easily achieve slow light propagation in solid-state materials at room temperature.
The first experiment concerning slow light propagationusing CPO at room temperature was carried out by Bige-low et al. [8]. They reported a reduction of the speed oflight in a 7.25-cm-long ruby rod down to 57 m/s by produc-ing a hole as narrow as 36 Hz (HWHM) in the absorptionspectrum. Thus, pulses of 25 ms width (FWHM) weredelayed by 0.71 ms and fractional delays of 0.028 werereached. Later, other materials were shown to successfullyproduce slow-light propagation based on CPO, as in alex-andrite crystals [9] and in semiconductor structures [10–12].Furthermore, using cryogenic temperatures, a decrease ofgroup velocity down to 3 m/s was recently reported in a3-mm-long erbium-doped crystal [13]. Thanks to the long
EDF
md ftF =
PD
PCDA
Fractional delay
1/99LD TC
DFB LD PD
FG
VOA
in
dtFτ
=Pbg
Ppulse
P0
Pm
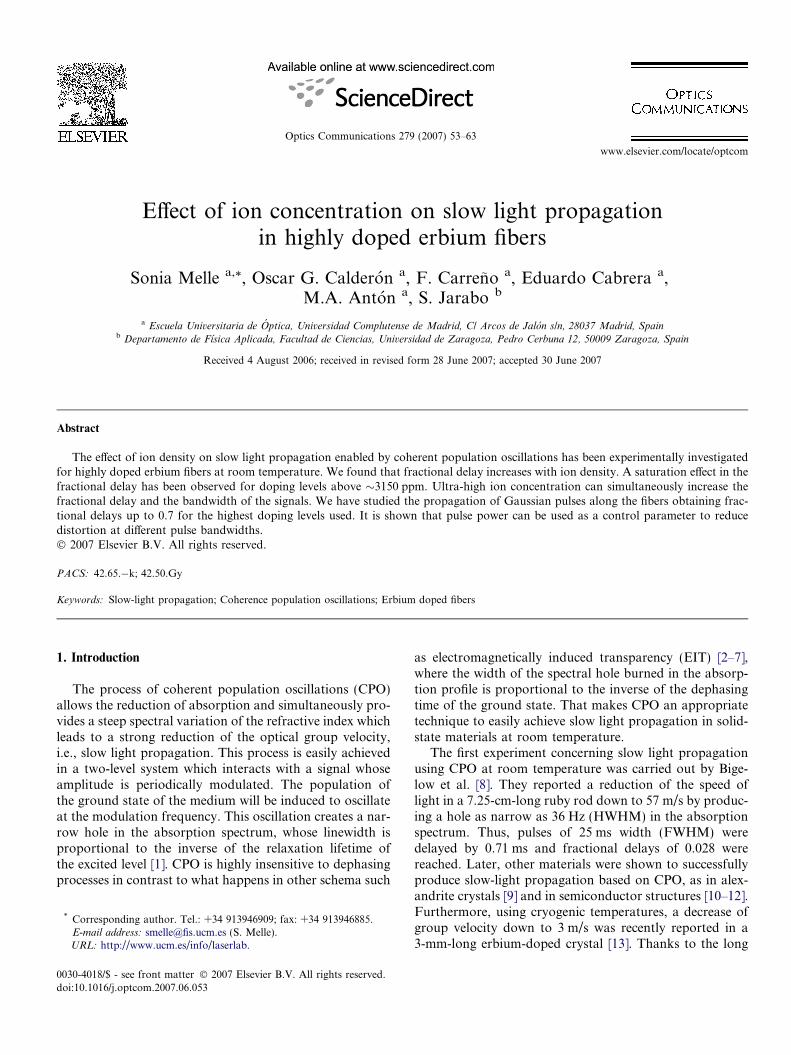
Fig. 1. Experimental setup used to measure slow light in erbium-dopedfibers. LD TC, laser diode and temperature controller; FG, functiongenerator; DFB LD, distributed feedback laser diode; EDF, erbium-doped fiber; VOA, variable optical attenuator; PD, photodetector; DA,data acquisition card; PC, personal computer. The upper-right cornershows the normalized modulated reference signal at fm = 120 Hz (thinline) and the corresponding EDF signal (thick line) after propagatingthrough the Er80 fiber. The laser input power was P0 = 0.13 mW and themodulation amplitude was Pm = 0.065 mW. The signal was delayedtd = 1.7 ms corresponding to an average group velocity of vg � 580 m/s,i.e. a group index of ng � 5 · 105.
Table 1Properties of the EDFs
Fibercode
Peak absorption(dB/m)
Ion density q(m�3)
Ion concentration(ppm)
Er20 20 ± 2 1.6 · 1025 800Er30 30 ± 3 2.1 · 1025 1050Er40 40 ± 4 2.7 · 1025 1350Er80 80 ± 8 6.3 · 1025 3150Er110 110 ± 10 8.7 · 1025 4350
54 S. Melle et al. / Optics Communications 279 (2007) 53–63
lifetime of the excited state of the Er ions, a spectral hole asnarrow as 26 Hz (HWHM) is produced, thus providingfractional delays of the order of 0.012.
An interesting work by Schweinsberg et al. [14] hasshown slow light propagation of both sinusoidally modu-lated signals and Gaussian pulses in an erbium-doped fiber(EDF) at the telecommunication wavelength of 1.55 lm.They used a 13 m-long EDF with an Er ion density of1.78 · 1024 m�3 (90 ppm). Pulses as short as 3.2 ms-wide(FWHM) were delayed by 0.38 ms, hence fractional delaysof 0.12 were achieved. The use of optical fibers to produceslow-light propagation has many advantages over othersolid-sate systems since they operate at the telecommunica-tion window, allowing for the use of long interactionlengths. Thus, EDFs are promising candidates for control-lable optical delay lines and optical buffers.
The important issue in slow-light delay lines is notmerely the achievement of large time delays, but to producelarge fractional delays (time delay normalized to the timeduration of the signal) since this parameter roughly mea-sures the information storage capacity of the optical med-ium [15]. Moreover, most practical applications requirethat large modulation bandwidths be able to experienceslow-light effects [15]. Thus, large fractional delays andlarge modulation bandwidths are desirable simultaneously.Many applications require a minimization of fiber lengthwithout the reduction of achievable fractional delay [15].A possible way to increase the fractional delay is to usefiber with a high ion doping level. In this work we studythe effect of ion density on slow-light propagation. We usedEDFs with ion concentrations ranging from 10 to 50 timesgreater than that used in previous work [14]. We analyzedhow ion density influences the fractional delay and band-width. We found that ultra-highly doped erbium fibersshow simultaneously higher bandwidths and larger frac-tional delays than do highly doped fibers.
2. Experimental setup
The experimental setup is depicted in Fig. 1. We use adistributed feedback laser diode (Anritsu, modelGB5A016) operating at 1536.2 ± 0.5 nm. The laser poweris controlled with an accuracy of 0.01 mW using a com-bined laser and temperature controller (Thorlabs, modelITC502) that allows us to keep the laser at room tempera-ture with a stability of 0.005 �C. The laser output is splitinto two signals: one part of the laser signal (99%) goesthrough an EDF 1 m in length and then to a switchable-gain, amplified InGaAs photodetector (Thorlabs, modelPDA400) with 10 MHz bandwidth at the minimum gainsetting. The other part of the laser output signal (1%) issent directly to an identical photodetector to be used as ref-erence. An in-line variable optical attenuator (Thorlabs,model VOA50) was placed between the EDF and the detec-tor to prevent saturation of the photodetector. Both thereference signal and the EDF signal are recorded with afast data acquisition card (rate of 107 samples/s) (National
Instruments, model PCI-6115 S series) and sent to a com-puter for analysis. The experiment is controlled with a Lab-View program.
We use single mode, Al2SiO5-glass-based fibers dopedwith Er3+ ions at several concentrations (provided by Lie-kki Ltd.) The transition between the ground state 4I15/2 andthe excited metastable state 4I13/2 of the erbium ions is at1536 nm. The ion density corresponding to each fiber,shown in Table 1, ranges from 800 ppm to 4350 ppm. Inwhat follows we will refer to the differently doped fiberswith a code associated to their nominal peak absorptionaccording to Table 1. All the fibers have a nominal modefield diameter at 1550 nm of 6.5 lm, a fiber cladding of245 lm, and a numerical aperture of 0.20.
We have carried out two kinds of experiments. In thefirst, the injection current of the laser was sinusoidallymodulated by a function generator (Agilent, model33220A) so that the laser power injected into the fiberwas P = P0 + Pm cos (2pfmt), where P0 is the averagepower, Pm the modulation amplitude, and fm the modula-tion frequency. We computed the time delay td from the
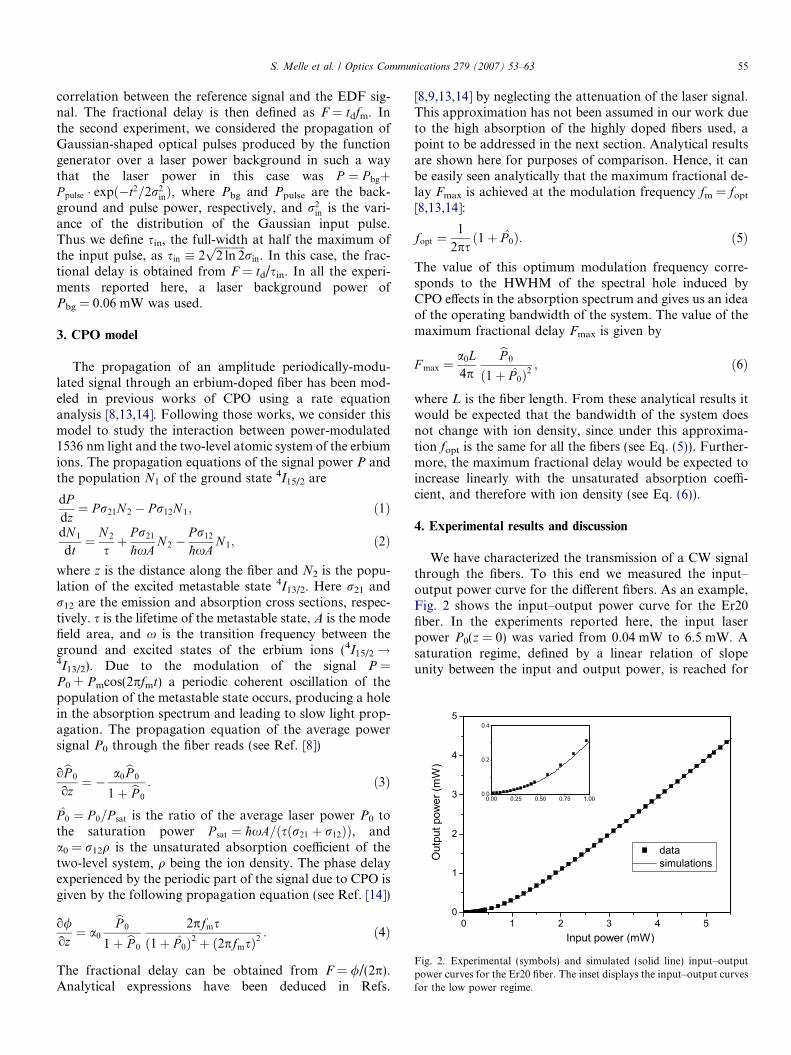
Fig. 2. Experimental (symbols) and simulated (solid line) input–outputpower curves for the Er20 fiber. The inset displays the input–output curvesfor the low power regime.
S. Melle et al. / Optics Communications 279 (2007) 53–63 55
correlation between the reference signal and the EDF sig-nal. The fractional delay is then defined as F = tdfm. Inthe second experiment, we considered the propagation ofGaussian-shaped optical pulses produced by the functiongenerator over a laser power background in such a waythat the laser power in this case was P ¼ P bgþP pulse � expð�t2=2r2
inÞ, where Pbg and Ppulse are the back-ground and pulse power, respectively, and r2
in is the vari-ance of the distribution of the Gaussian input pulse.Thus we define sin, the full-width at half the maximum ofthe input pulse, as sin � 2
ffiffiffiffiffiffiffiffiffiffiffi2 ln 2p
rin. In this case, the frac-tional delay is obtained from F = td/sin. In all the experi-ments reported here, a laser background power ofPbg = 0.06 mW was used.
3. CPO model
The propagation of an amplitude periodically-modu-lated signal through an erbium-doped fiber has been mod-eled in previous works of CPO using a rate equationanalysis [8,13,14]. Following those works, we consider thismodel to study the interaction between power-modulated1536 nm light and the two-level atomic system of the erbiumions. The propagation equations of the signal power P andthe population N1 of the ground state 4I15/2 are
dPdz¼ Pr21N 2 � Pr12N 1; ð1Þ
dN 1
dt¼ N 2
sþ Pr21
�hxAN 2 �
Pr12
�hxAN 1; ð2Þ
where z is the distance along the fiber and N2 is the popu-lation of the excited metastable state 4I13/2. Here r21 andr12 are the emission and absorption cross sections, respec-tively. s is the lifetime of the metastable state, A is the modefield area, and x is the transition frequency between theground and excited states of the erbium ions (4I15/2!4I13/2). Due to the modulation of the signal P =P0 + Pmcos(2pfmt) a periodic coherent oscillation of thepopulation of the metastable state occurs, producing a holein the absorption spectrum and leading to slow light prop-agation. The propagation equation of the average powersignal P0 through the fiber reads (see Ref. [8])
obP 0
oz¼ � a0
bP 0
1þ bP 0
: ð3Þ
P 0 ¼ P 0=P sat is the ratio of the average laser power P0 tothe saturation power P sat ¼ �hxA=ðsðr21 þ r12ÞÞ, anda0 = r12q is the unsaturated absorption coefficient of thetwo-level system, q being the ion density. The phase delayexperienced by the periodic part of the signal due to CPO isgiven by the following propagation equation (see Ref. [14])
o/oz¼ a0
bP 0
1þ bP 0
2pfms
ð1þ P 0Þ2 þ ð2pfmsÞ2: ð4Þ
The fractional delay can be obtained from F = //(2p).Analytical expressions have been deduced in Refs.
[8,9,13,14] by neglecting the attenuation of the laser signal.This approximation has not been assumed in our work dueto the high absorption of the highly doped fibers used, apoint to be addressed in the next section. Analytical resultsare shown here for purposes of comparison. Hence, it canbe easily seen analytically that the maximum fractional de-lay Fmax is achieved at the modulation frequency fm = fopt
[8,13,14]:
fopt ¼1
2psð1þ P 0Þ: ð5Þ
The value of this optimum modulation frequency corre-sponds to the HWHM of the spectral hole induced byCPO effects in the absorption spectrum and gives us an ideaof the operating bandwidth of the system. The value of themaximum fractional delay Fmax is given by
F max ¼a0L4p
bP 0
ð1þ P 0Þ2; ð6Þ
where L is the fiber length. From these analytical results itwould be expected that the bandwidth of the system doesnot change with ion density, since under this approxima-tion fopt is the same for all the fibers (see Eq. (5)). Further-more, the maximum fractional delay would be expected toincrease linearly with the unsaturated absorption coeffi-cient, and therefore with ion density (see Eq. (6)).
4. Experimental results and discussion
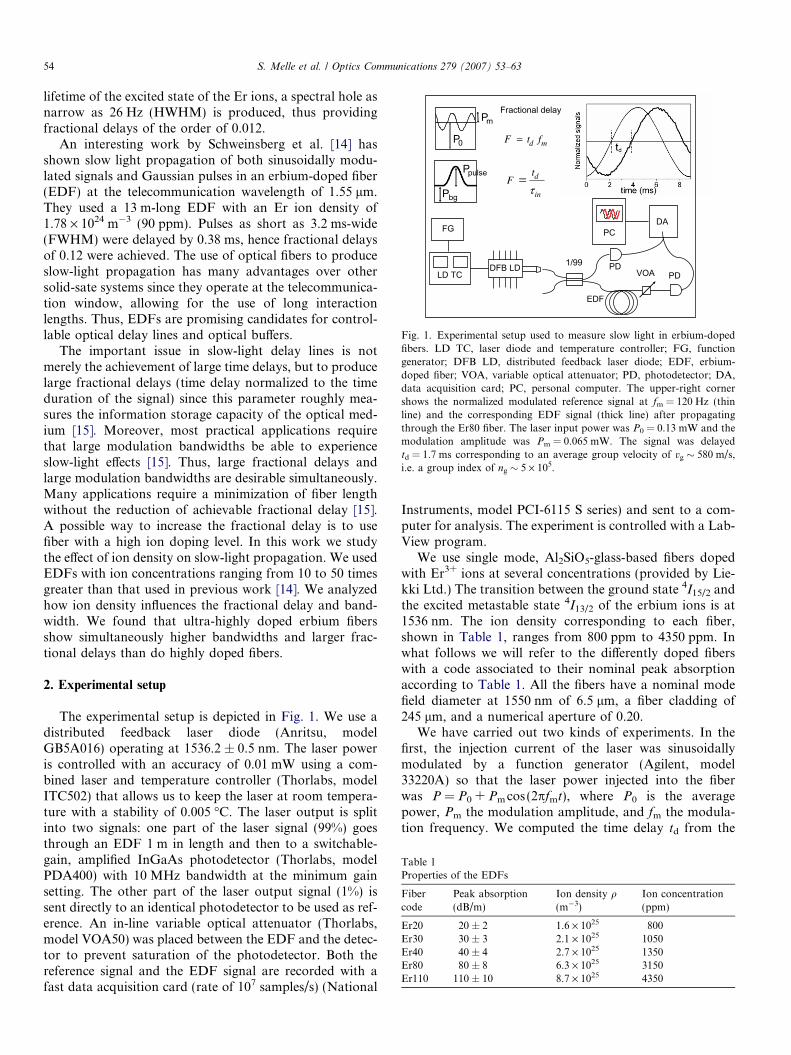
We have characterized the transmission of a CW signalthrough the fibers. To this end we measured the input–output power curve for the different fibers. As an example,Fig. 2 shows the input–output power curve for the Er20fiber. In the experiments reported here, the input laserpower P0(z = 0) was varied from 0.04 mW to 6.5 mW. Asaturation regime, defined by a linear relation of slopeunity between the input and output power, is reached for
56 S. Melle et al. / Optics Communications 279 (2007) 53–63
fibers Er20, Er30 and Er40 at input powers greater than1.5 mW, 2 mW and 3 mW, respectively. However, forfibers Er80 and Er110, we observed that the saturationregime is not reached even for the greatest input laserpower used in the experiments (not shown). In particular,for P0(z = 0) = 6.5 mW, the measured output power isP0(z = L) = 130 lW for Er80 fiber and P0(z = L) = 8 lWfor Er110 fiber. These results clearly indicate a strongattenuation of the signals propagating through the ultra-highly doped erbium fibers (Er80 and Er110). Therefore,it would be expected that the behavior of the optimum fre-quency fopt and the maximum fractional delay Fmax shouldnot follow the analytical expressions given by Eqs. (5) and(6). In view of this, we resort to determining the spatialevolution of P0 and / by numerical methods.
By numerically solving Eq. (3) we calculate the input–output power curve considering similar absorption andemission cross sections r12 ’ r21 = r. The numericalresults are fitted to the experimental data using the absorp-tion cross section r and the effective mode field diameter das variable parameters. The fitting provides a value ofr = 1.8 · 10�25 m2 (consistent with values previously usedin other works [14,16]) and a value of d = 3.9 lm (closeto the value given by the manufacturer). Thus, the satura-tion intensity is Isat ’ 3.4 kW/cm2 (Psat ’ 0.4 mW) and theunsaturated absorption coefficient in our experimentsranges from a0 = 0.03 cm�1 to a0 = 0.16 cm�1 (see Table1 for the corresponding values of q). The metastable statelifetime we considered is s = 10.5 ms [14]. In Fig. 2 (solidline) we show the simulated input–output power curveobtained for the Er20 using the above mentionedparameters.
4.1. Sinusoidally modulated signal
For each fiber we have measured the fractional delay F
as a function of the modulation frequency fm. In order toanalyze the influence of the modulation amplitude (Pm)on the fractional delay, we changed the ratio of modulation
Fig. 3. Fractional delay as a function of the modulation frequency at a laser plaser power (Mod = 100 · Pm/P0). On the left Er20 fiber; on the right Er110 fi
amplitude to average input power from 10 to 70%, therebychanging Pm/P0 from 0.1 to 0.7. As an example, Fig. 3 dis-plays the experimental fractional delay for different modu-lation amplitudes as a function of the modulationfrequency in a semilog scale. Those measurements werecarried out at a fixed average input laser power ofP0 = 0.6 mW. The figure on the left shows the results forthe least highly doped fiber (Er20), and the one on the rightshows the results for the most highly doped fiber (Er110).Note that, in both cases, the fractional delay does not exhi-bit significant changes upon the change of modulationamplitude. Thus, in what follows we consider a modulationamplitude of 50%. A further inspection of Fig. 3 revealsthat the maximum fractional delay Fmax and the optimummodulation frequency at which this maximum fractiondelay occurs (fopt) are both very different for each fiber.In particular, for the least highly doped fiber (Er20, onthe left) the maximum fractional delay achieved isFmax � 0.05, whereas for the most highly doped fiber(Er110, on the right) the maximum fractional delayincreases by a factor of 3.6 to Fmax � 0.18. This increasefactor is smaller than the ratio between ion concentrationsand could indicate that Fmax is not proportional to iondensity. Furthermore, the optimum frequency at whichthe maximum fractional delay takes place appears with avalue around fopt � 30 Hz for the Er20 doped fiber (seeFig. 3 left) and shifts to a higher frequency value aroundfopt � 150 Hz for the Er110 fiber (see Fig. 3 right). Thus,the bandwidth of the system exhibits a strong dependenceupon ion density, which is not evident in the simple modelused previously (Eq. (5)).
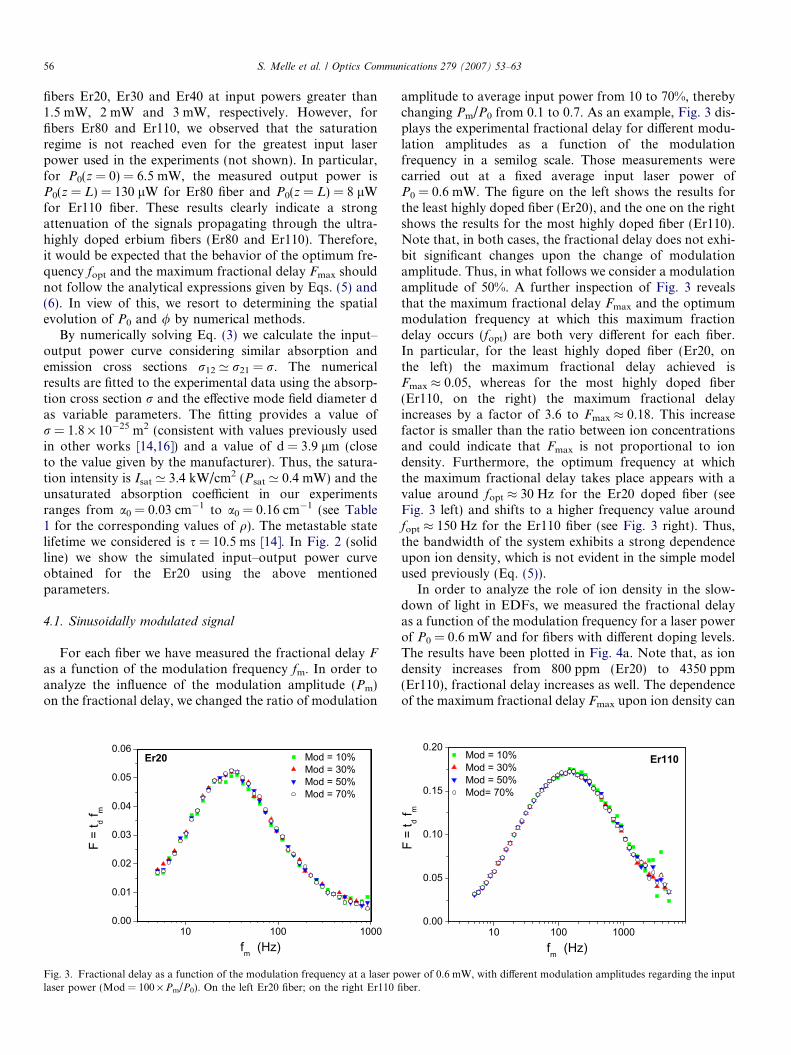
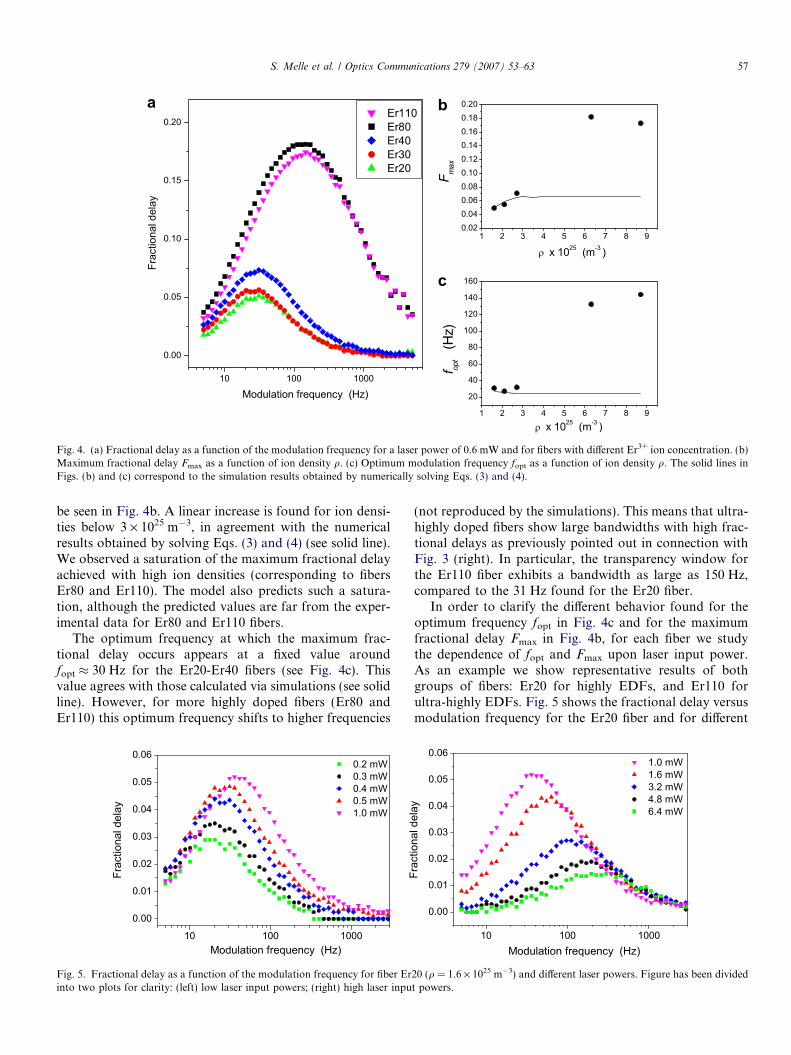
In order to analyze the role of ion density in the slow-down of light in EDFs, we measured the fractional delayas a function of the modulation frequency for a laser powerof P0 = 0.6 mW and for fibers with different doping levels.The results have been plotted in Fig. 4a. Note that, as iondensity increases from 800 ppm (Er20) to 4350 ppm(Er110), fractional delay increases as well. The dependenceof the maximum fractional delay Fmax upon ion density can
ower of 0.6 mW, with different modulation amplitudes regarding the inputber.
a b
c
Fig. 4. (a) Fractional delay as a function of the modulation frequency for a laser power of 0.6 mW and for fibers with different Er3+ ion concentration. (b)Maximum fractional delay Fmax as a function of ion density q. (c) Optimum modulation frequency fopt as a function of ion density q. The solid lines inFigs. (b) and (c) correspond to the simulation results obtained by numerically solving Eqs. (3) and (4).
S. Melle et al. / Optics Communications 279 (2007) 53–63 57
be seen in Fig. 4b. A linear increase is found for ion densi-ties below 3 · 1025 m�3, in agreement with the numericalresults obtained by solving Eqs. (3) and (4) (see solid line).We observed a saturation of the maximum fractional delayachieved with high ion densities (corresponding to fibersEr80 and Er110). The model also predicts such a satura-tion, although the predicted values are far from the exper-imental data for Er80 and Er110 fibers.
The optimum frequency at which the maximum frac-tional delay occurs appears at a fixed value aroundfopt � 30 Hz for the Er20-Er40 fibers (see Fig. 4c). Thisvalue agrees with those calculated via simulations (see solidline). However, for more highly doped fibers (Er80 andEr110) this optimum frequency shifts to higher frequencies
Fig. 5. Fractional delay as a function of the modulation frequency for fiber Erinto two plots for clarity: (left) low laser input powers; (right) high laser inpu
(not reproduced by the simulations). This means that ultra-highly doped fibers show large bandwidths with high frac-tional delays as previously pointed out in connection withFig. 3 (right). In particular, the transparency window forthe Er110 fiber exhibits a bandwidth as large as 150 Hz,compared to the 31 Hz found for the Er20 fiber.
In order to clarify the different behavior found for theoptimum frequency fopt in Fig. 4c and for the maximumfractional delay Fmax in Fig. 4b, for each fiber we studythe dependence of fopt and Fmax upon laser input power.As an example we show representative results of bothgroups of fibers: Er20 for highly EDFs, and Er110 forultra-highly EDFs. Fig. 5 shows the fractional delay versusmodulation frequency for the Er20 fiber and for different
20 (q = 1.6 · 1025 m�3) and different laser powers. Figure has been dividedt powers.

Fig. 7. Optimum modulation frequency (up) and maximum fractionaldelay (down) as a function of input laser power for fibers of different ionconcentration: Experimental results (symbols), and simulated result fromnumerically solving Eqs. (3) and (4) (line). Each line is labeled with itscorresponding fiber.
58 S. Melle et al. / Optics Communications 279 (2007) 53–63
laser input powers P0; Fig. 5 has been divided into twoplots for the sake of clarity. We observed an increase inthe optimum modulation frequency with the laser powerfrom 21 Hz (for P0 = 0.2 mW) to 232 Hz (forP0 = 6.4 mW). This increase is more pronounced when sur-passing a laser power around P0 ’ 1 mW (see right part ofFig. 5). We can also see in Fig. 5 (on the left) that the frac-tional delay increases upon increasing laser power until alaser power around P0 ’ 1 mW is reached. For laser pow-ers above P0 ’ 1 mW, the fractional delay decreases uponincreasing laser power (see right plot of Fig. 5). Thisdecrease is an expected result since, because we are workingabove the saturation intensity through most of the fiberlength, the number of excited ions contributing to theCPO effect is reduced as a consequence of saturation. Thissaturation leads to a power broadening of the spectral holewhich produces an increase of group velocity [13].
In Fig. 6 we present the corresponding results for theEr110 fiber. Note that for low laser powers (on the left)the optimum modulation frequency increases abruptly withlaser power. However, contrary to the behavior found forthe Er20 fiber, the bandwidth for this fiber remains unal-tered upon raising laser power above P0 = 0.13 mW. Fur-thermore, the maximum fractional delay increasesabruptly up to a value of Fmax � 0.2, reached when thelaser input power is P0 = 0.13 mW. Above this power valuethe maximum fractional delay decreases very slowly uponincreasing laser input power. This is a great advantage overthe less-doped fibers, for in these fibers it is not necessary toincrease the laser power in order to obtain largerbandwidths.
In order to summarize our results, we plot in Fig. 7 theexperimental data (in symbols) for fopt and Fmax as a func-tion of laser power, together with the simulated valuesobtained by numerically solving Eqs. (3) and (4) (solidline). As we mentioned before, the group of fibers withlow ion concentration (Er20, Er30 and Er40) behaves dif-ferently from the group of ultra-highly doped fibers (Er80and Er110). For the least highly doped fibers (Er20, andEr30) the optimum modulation frequency does not change
Fig. 6. Fractional delay as a function of the modulation frequency for fiber Er1into two plots for clarity: (left) low laser input powers; (right) high laser inpu
appreciably when the input laser power is smaller thanP0 � 1 mW. These low input powers are not enough tobroaden the hole in the absorption spectra and thereforethe hole width only depends upon the lifetime of the meta-stable state s. However, for laser powers greater than the
10 (q = 8.7 · 1025 m�3) and different laser powers. Figure has been dividedt powers.
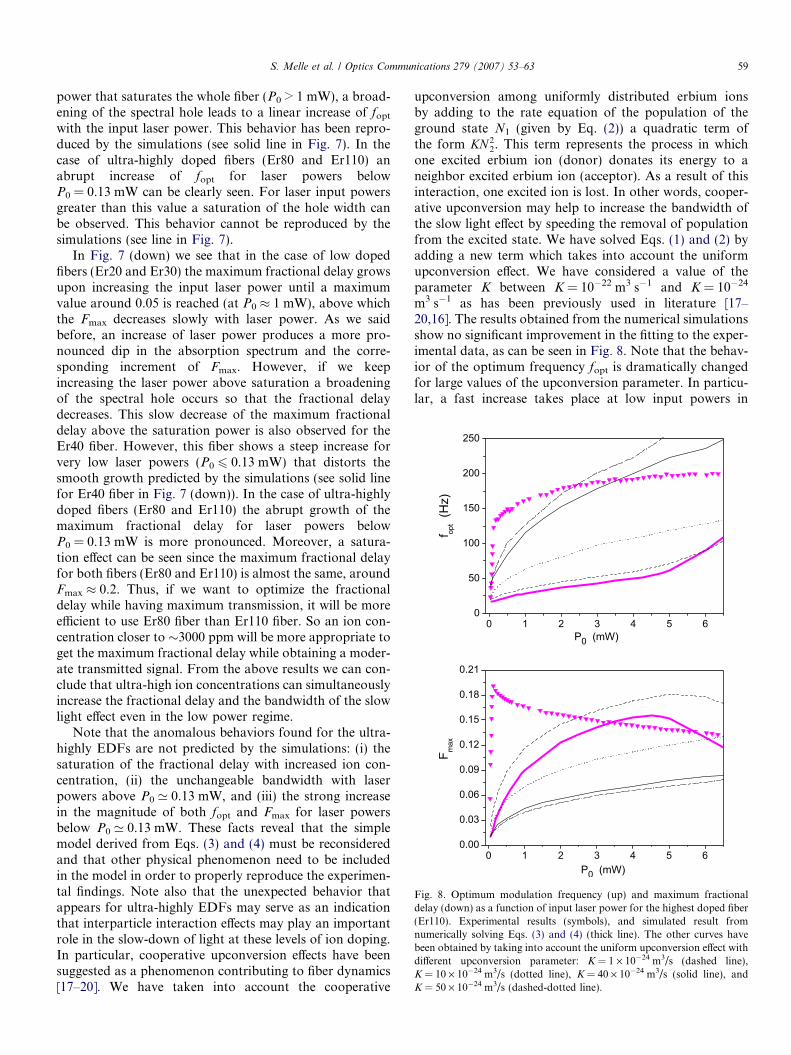
Fig. 8. Optimum modulation frequency (up) and maximum fractionaldelay (down) as a function of input laser power for the highest doped fiber(Er110). Experimental results (symbols), and simulated result fromnumerically solving Eqs. (3) and (4) (thick line). The other curves havebeen obtained by taking into account the uniform upconversion effect withdifferent upconversion parameter: K = 1 · 10�24 m3/s (dashed line),K = 10 · 10�24 m3/s (dotted line), K = 40 · 10�24 m3/s (solid line), andK = 50 · 10�24 m3/s (dashed-dotted line).
S. Melle et al. / Optics Communications 279 (2007) 53–63 59
power that saturates the whole fiber (P0 > 1 mW), a broad-ening of the spectral hole leads to a linear increase of fopt
with the input laser power. This behavior has been repro-duced by the simulations (see solid line in Fig. 7). In thecase of ultra-highly doped fibers (Er80 and Er110) anabrupt increase of fopt for laser powers belowP0 = 0.13 mW can be clearly seen. For laser input powersgreater than this value a saturation of the hole width canbe observed. This behavior cannot be reproduced by thesimulations (see line in Fig. 7).
In Fig. 7 (down) we see that in the case of low dopedfibers (Er20 and Er30) the maximum fractional delay growsupon increasing the input laser power until a maximumvalue around 0.05 is reached (at P0 � 1 mW), above whichthe Fmax decreases slowly with laser power. As we saidbefore, an increase of laser power produces a more pro-nounced dip in the absorption spectrum and the corre-sponding increment of Fmax. However, if we keepincreasing the laser power above saturation a broadeningof the spectral hole occurs so that the fractional delaydecreases. This slow decrease of the maximum fractionaldelay above the saturation power is also observed for theEr40 fiber. However, this fiber shows a steep increase forvery low laser powers (P0 6 0.13 mW) that distorts thesmooth growth predicted by the simulations (see solid linefor Er40 fiber in Fig. 7 (down)). In the case of ultra-highlydoped fibers (Er80 and Er110) the abrupt growth of themaximum fractional delay for laser powers belowP0 = 0.13 mW is more pronounced. Moreover, a satura-tion effect can be seen since the maximum fractional delayfor both fibers (Er80 and Er110) is almost the same, aroundFmax � 0.2. Thus, if we want to optimize the fractionaldelay while having maximum transmission, it will be moreefficient to use Er80 fiber than Er110 fiber. So an ion con-centration closer to �3000 ppm will be more appropriate toget the maximum fractional delay while obtaining a moder-ate transmitted signal. From the above results we can con-clude that ultra-high ion concentrations can simultaneouslyincrease the fractional delay and the bandwidth of the slowlight effect even in the low power regime.
Note that the anomalous behaviors found for the ultra-highly EDFs are not predicted by the simulations: (i) thesaturation of the fractional delay with increased ion con-centration, (ii) the unchangeable bandwidth with laserpowers above P0 ’ 0.13 mW, and (iii) the strong increasein the magnitude of both fopt and Fmax for laser powersbelow P0 ’ 0.13 mW. These facts reveal that the simplemodel derived from Eqs. (3) and (4) must be reconsideredand that other physical phenomenon need to be includedin the model in order to properly reproduce the experimen-tal findings. Note also that the unexpected behavior thatappears for ultra-highly EDFs may serve as an indicationthat interparticle interaction effects may play an importantrole in the slow-down of light at these levels of ion doping.In particular, cooperative upconversion effects have beensuggested as a phenomenon contributing to fiber dynamics[17–20]. We have taken into account the cooperative
upconversion among uniformly distributed erbium ionsby adding to the rate equation of the population of theground state N1 (given by Eq. (2)) a quadratic term ofthe form KN 2
2. This term represents the process in whichone excited erbium ion (donor) donates its energy to aneighbor excited erbium ion (acceptor). As a result of thisinteraction, one excited ion is lost. In other words, cooper-ative upconversion may help to increase the bandwidth ofthe slow light effect by speeding the removal of populationfrom the excited state. We have solved Eqs. (1) and (2) byadding a new term which takes into account the uniformupconversion effect. We have considered a value of theparameter K between K = 10�22 m3 s�1 and K = 10�24
m3 s�1 as has been previously used in literature [17–20,16]. The results obtained from the numerical simulationsshow no significant improvement in the fitting to the exper-imental data, as can be seen in Fig. 8. Note that the behav-ior of the optimum frequency fopt is dramatically changedfor large values of the upconversion parameter. In particu-lar, a fast increase takes place at low input powers in
60 S. Melle et al. / Optics Communications 279 (2007) 53–63
agreement with the experiments. However, the behavior ofthe maximum fractional delay at low input powers is notqualitatively reproduced by the simulations. These resultspoint out that other phenomena should be taken intoaccount. Wysocki et al. [16] analyzed interparticle interac-tions to explain the effect of ion concentration in theerbium-doped fiber amplifier efficiency. They found thatuniform cooperative upconversion fails to explain the effectof ion concentration. However, pair interaction was foundto be the mechanism which explains their results. It seems,then, that more complex numerical models, including therapid cross-relaxation between paired ions, should be usedto reproduce the behavior of ultra-highly doped erbiumfibers. Further studies are currently being carried out toaddress this matter.
4.2. Gaussian pulse signal
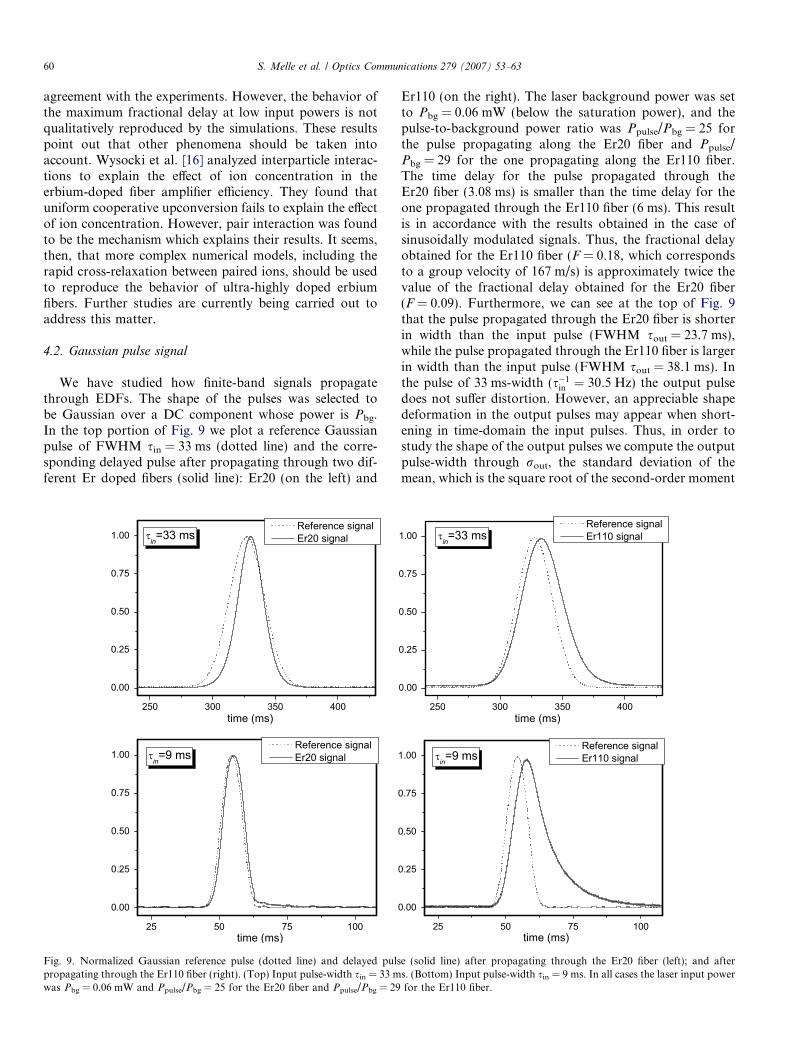
We have studied how finite-band signals propagatethrough EDFs. The shape of the pulses was selected tobe Gaussian over a DC component whose power is Pbg.In the top portion of Fig. 9 we plot a reference Gaussianpulse of FWHM sin = 33 ms (dotted line) and the corre-sponding delayed pulse after propagating through two dif-ferent Er doped fibers (solid line): Er20 (on the left) and
Fig. 9. Normalized Gaussian reference pulse (dotted line) and delayed pulspropagating through the Er110 fiber (right). (Top) Input pulse-width sin = 33 mwas Pbg = 0.06 mW and Ppulse/Pbg = 25 for the Er20 fiber and Ppulse/Pbg = 29
Er110 (on the right). The laser background power was setto Pbg = 0.06 mW (below the saturation power), and thepulse-to-background power ratio was Ppulse/Pbg = 25 forthe pulse propagating along the Er20 fiber and Ppulse/Pbg = 29 for the one propagating along the Er110 fiber.The time delay for the pulse propagated through theEr20 fiber (3.08 ms) is smaller than the time delay for theone propagated through the Er110 fiber (6 ms). This resultis in accordance with the results obtained in the case ofsinusoidally modulated signals. Thus, the fractional delayobtained for the Er110 fiber (F = 0.18, which correspondsto a group velocity of 167 m/s) is approximately twice thevalue of the fractional delay obtained for the Er20 fiber(F = 0.09). Furthermore, we can see at the top of Fig. 9that the pulse propagated through the Er20 fiber is shorterin width than the input pulse (FWHM sout = 23.7 ms),while the pulse propagated through the Er110 fiber is largerin width than the input pulse (FWHM sout = 38.1 ms). Inthe pulse of 33 ms-width (s�1
in ¼ 30:5 Hz) the output pulsedoes not suffer distortion. However, an appreciable shapedeformation in the output pulses may appear when short-ening in time-domain the input pulses. Thus, in order tostudy the shape of the output pulses we compute the outputpulse-width through rout, the standard deviation of themean, which is the square root of the second-order moment
e (solid line) after propagating through the Er20 fiber (left); and afters. (Bottom) Input pulse-width sin = 9 ms. In all cases the laser input powerfor the Er110 fiber.
S. Melle et al. / Optics Communications 279 (2007) 53–63 61
of the output pulse intensity distribution. In the previousexample, the input pulse-width calculated using the vari-ance of the distribution is rin = 14 ms (which agrees withrin ¼ ð2
ffiffiffiffiffiffiffiffiffiffiffi2 ln 2p
Þ�1sin), while the output pulse-width afterpropagating through the Er20 and Er110 fiber arerout = 11.1 ms and rout = 17.1 ms, respectively. Although,as we said above, the output pulse does not suffer an appre-ciable distortion (see Fig. 9 (top)), the relation between rout
and sout slightly deviates from the case of a perfect gaussianpulse.
In Fig. 9 (bottom) a short input pulse (sin = 9 ms) ispropagated through both fibers. As in the case of the prop-agation of modulated signals presented in previous section(Section 4.1), these high-bandwidth pulses will show largerfractional delays: F = 0.13 for Er20 fiber and F = 0.57 (i.e.,a group velocity of 322 m/s) for Er110. Furthermore, thisshort pulse does not suffer any appreciable shape deforma-tion when propagating through the Er20 fiber (see left partof Fig. 9 (bottom)). However, an appreciable broadeningof the tail observed when propagating the same pulsethrough the ultra-highly doped fiber Er110 leads to rout
= 3.4 rin (see right part of Fig. 9 (bottom)). This deforma-tion arises from the fact that the pulse bandwidth(s�1
in ¼ 110 Hz) is larger than the linewidth of the CPO hole.We have analyzed in detail the fractional delay and
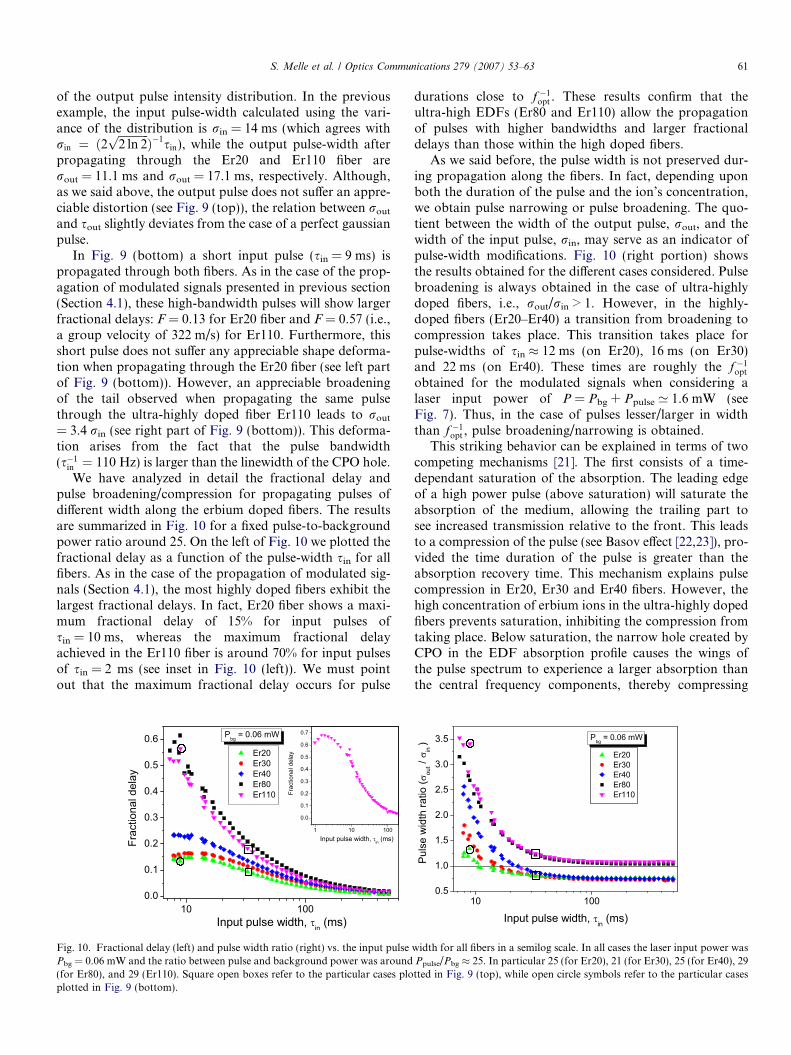
pulse broadening/compression for propagating pulses ofdifferent width along the erbium doped fibers. The resultsare summarized in Fig. 10 for a fixed pulse-to-backgroundpower ratio around 25. On the left of Fig. 10 we plotted thefractional delay as a function of the pulse-width sin for allfibers. As in the case of the propagation of modulated sig-nals (Section 4.1), the most highly doped fibers exhibit thelargest fractional delays. In fact, Er20 fiber shows a maxi-mum fractional delay of 15% for input pulses ofsin = 10 ms, whereas the maximum fractional delayachieved in the Er110 fiber is around 70% for input pulsesof sin = 2 ms (see inset in Fig. 10 (left)). We must pointout that the maximum fractional delay occurs for pulse
Fig. 10. Fractional delay (left) and pulse width ratio (right) vs. the input pulsePbg = 0.06 mW and the ratio between pulse and background power was around(for Er80), and 29 (Er110). Square open boxes refer to the particular cases ploplotted in Fig. 9 (bottom).
durations close to f �1opt . These results confirm that the
ultra-high EDFs (Er80 and Er110) allow the propagationof pulses with higher bandwidths and larger fractionaldelays than those within the high doped fibers.
As we said before, the pulse width is not preserved dur-ing propagation along the fibers. In fact, depending uponboth the duration of the pulse and the ion’s concentration,we obtain pulse narrowing or pulse broadening. The quo-tient between the width of the output pulse, rout, and thewidth of the input pulse, rin, may serve as an indicator ofpulse-width modifications. Fig. 10 (right portion) showsthe results obtained for the different cases considered. Pulsebroadening is always obtained in the case of ultra-highlydoped fibers, i.e., rout/rin > 1. However, in the highly-doped fibers (Er20–Er40) a transition from broadening tocompression takes place. This transition takes place forpulse-widths of sin � 12 ms (on Er20), 16 ms (on Er30)and 22 ms (on Er40). These times are roughly the f �1
opt
obtained for the modulated signals when considering alaser input power of P = Pbg + Ppulse ’ 1.6 mW (seeFig. 7). Thus, in the case of pulses lesser/larger in widththan f �1
opt , pulse broadening/narrowing is obtained.This striking behavior can be explained in terms of two
competing mechanisms [21]. The first consists of a time-dependant saturation of the absorption. The leading edgeof a high power pulse (above saturation) will saturate theabsorption of the medium, allowing the trailing part tosee increased transmission relative to the front. This leadsto a compression of the pulse (see Basov effect [22,23]), pro-vided the time duration of the pulse is greater than theabsorption recovery time. This mechanism explains pulsecompression in Er20, Er30 and Er40 fibers. However, thehigh concentration of erbium ions in the ultra-highly dopedfibers prevents saturation, inhibiting the compression fromtaking place. Below saturation, the narrow hole created byCPO in the EDF absorption profile causes the wings ofthe pulse spectrum to experience a larger absorption thanthe central frequency components, thereby compressing
width for all fibers in a semilog scale. In all cases the laser input power wasPpulse/Pbg � 25. In particular 25 (for Er20), 21 (for Er30), 25 (for Er40), 29tted in Fig. 9 (top), while open circle symbols refer to the particular cases
62 S. Melle et al. / Optics Communications 279 (2007) 53–63
the pulse spectrum and broadening the pulse in timedomain [21,24]. This mechanism explains pulse broadeningin Er80 and Er110 fibers. The broadening of the pulse willbe especially noticeable for short pulses when a significantpart of the pulse does not lie within the hole in the absorp-tion profile.
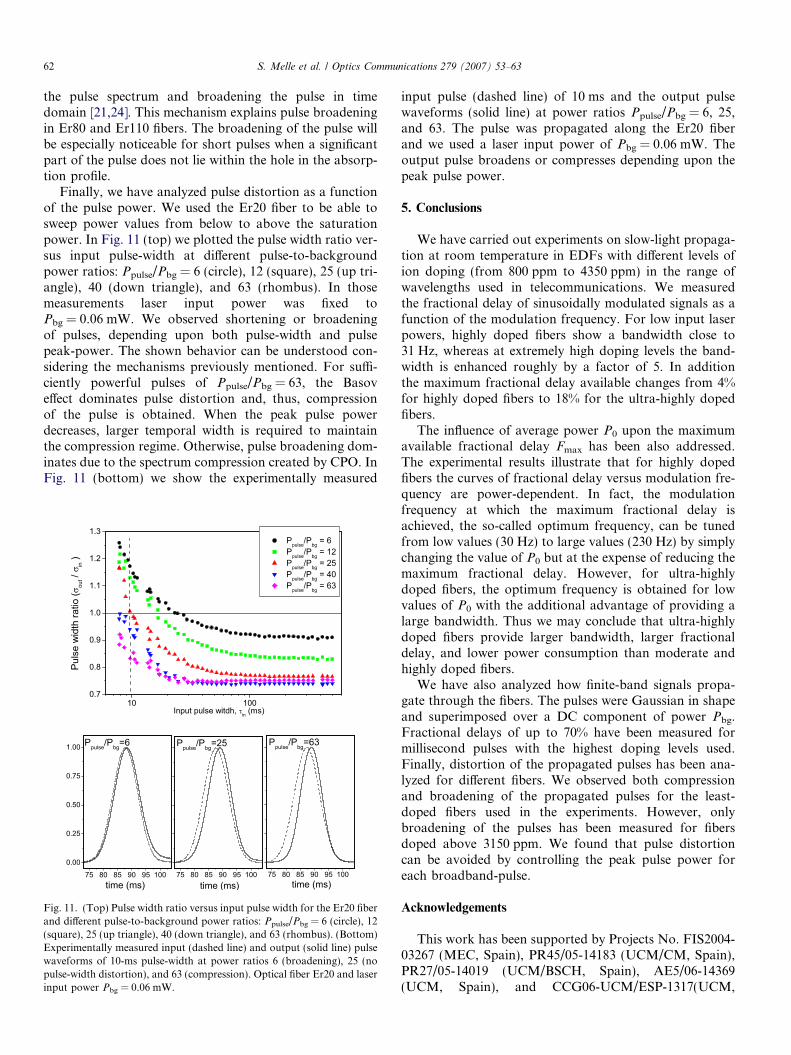
Finally, we have analyzed pulse distortion as a functionof the pulse power. We used the Er20 fiber to be able tosweep power values from below to above the saturationpower. In Fig. 11 (top) we plotted the pulse width ratio ver-sus input pulse-width at different pulse-to-backgroundpower ratios: Ppulse/Pbg = 6 (circle), 12 (square), 25 (up tri-angle), 40 (down triangle), and 63 (rhombus). In thosemeasurements laser input power was fixed toPbg = 0.06 mW. We observed shortening or broadeningof pulses, depending upon both pulse-width and pulsepeak-power. The shown behavior can be understood con-sidering the mechanisms previously mentioned. For suffi-ciently powerful pulses of Ppulse/Pbg = 63, the Basoveffect dominates pulse distortion and, thus, compressionof the pulse is obtained. When the peak pulse powerdecreases, larger temporal width is required to maintainthe compression regime. Otherwise, pulse broadening dom-inates due to the spectrum compression created by CPO. InFig. 11 (bottom) we show the experimentally measured
Fig. 11. (Top) Pulse width ratio versus input pulse width for the Er20 fiberand different pulse-to-background power ratios: Ppulse/Pbg = 6 (circle), 12(square), 25 (up triangle), 40 (down triangle), and 63 (rhombus). (Bottom)Experimentally measured input (dashed line) and output (solid line) pulsewaveforms of 10-ms pulse-width at power ratios 6 (broadening), 25 (nopulse-width distortion), and 63 (compression). Optical fiber Er20 and laserinput power Pbg = 0.06 mW.
input pulse (dashed line) of 10 ms and the output pulsewaveforms (solid line) at power ratios Ppulse/Pbg = 6, 25,and 63. The pulse was propagated along the Er20 fiberand we used a laser input power of Pbg = 0.06 mW. Theoutput pulse broadens or compresses depending upon thepeak pulse power.
5. Conclusions
We have carried out experiments on slow-light propaga-tion at room temperature in EDFs with different levels ofion doping (from 800 ppm to 4350 ppm) in the range ofwavelengths used in telecommunications. We measuredthe fractional delay of sinusoidally modulated signals as afunction of the modulation frequency. For low input laserpowers, highly doped fibers show a bandwidth close to31 Hz, whereas at extremely high doping levels the band-width is enhanced roughly by a factor of 5. In additionthe maximum fractional delay available changes from 4%for highly doped fibers to 18% for the ultra-highly dopedfibers.
The influence of average power P0 upon the maximumavailable fractional delay Fmax has been also addressed.The experimental results illustrate that for highly dopedfibers the curves of fractional delay versus modulation fre-quency are power-dependent. In fact, the modulationfrequency at which the maximum fractional delay isachieved, the so-called optimum frequency, can be tunedfrom low values (30 Hz) to large values (230 Hz) by simplychanging the value of P0 but at the expense of reducing themaximum fractional delay. However, for ultra-highlydoped fibers, the optimum frequency is obtained for lowvalues of P0 with the additional advantage of providing alarge bandwidth. Thus we may conclude that ultra-highlydoped fibers provide larger bandwidth, larger fractionaldelay, and lower power consumption than moderate andhighly doped fibers.
We have also analyzed how finite-band signals propa-gate through the fibers. The pulses were Gaussian in shapeand superimposed over a DC component of power Pbg.Fractional delays of up to 70% have been measured formillisecond pulses with the highest doping levels used.Finally, distortion of the propagated pulses has been ana-lyzed for different fibers. We observed both compressionand broadening of the propagated pulses for the least-doped fibers used in the experiments. However, onlybroadening of the pulses has been measured for fibersdoped above 3150 ppm. We found that pulse distortioncan be avoided by controlling the peak pulse power foreach broadband-pulse.
Acknowledgements
This work has been supported by Projects No. FIS2004-03267 (MEC, Spain), PR45/05-14183 (UCM/CM, Spain),PR27/05-14019 (UCM/BSCH, Spain), AE5/06-14369(UCM, Spain), and CCG06-UCM/ESP-1317(UCM,
S. Melle et al. / Optics Communications 279 (2007) 53–63 63
Spain) S.M. and O.G.C. thank R.W. Boyd, M.S. Bigelow,E. Baldit, A. Schweinsberg, M. Gonzalez Herraez, J.M.Guerra, R. Weigand, I. Gonzalo, and J.M. Rico for helpfuladvice. We are grateful to T. Lorca and C.E. Caro for theEnglish revisions of the manuscript.
References
[1] L.W. Hillman, R.W. Boyd, J. Kransinski, C.R. Stroud Jr., Opt.Commun. 45 (1983) 416.
[2] S.E. Harris, J.E. Field, A. Kasapi, Phys. Rev. A 46 (1992) R29.[3] A. Kasapi, M. Jain, G.Y. Yin, S.E. Harris, Phys. Rev. Lett. 74 (1995)
2447.[4] L.V. Hau, S.E. Harris, Z. Dutton, C.H. Behroozi, Nature (London)
397 (1999) 594.[5] M.M. Kash, V.A. Sautenkov, A.S. Zibrov, L. Hollberg, G.R. Welch,
M.D. Lukin, Y. Rostovtsev, E.S. Fry, M.O. Scully, Phys. Rev. Lett.82 (1999) 5229.
[6] D. Budker, D.F. Kimball, S.M. Rochester, V.V. Yashchuk, Phys.Rev. Lett. 83 (1999) 1767.
[7] A.V. Turukhin, V.S. Sudarshanam, M.S. Shahriar, Phys. Rev. Lett.88 (2002) 023602.
[8] M.S. Bigelow, N.N. Lepeshkin, R.W. Boyd, Phys. Rev. Lett. 90(2003) 113903.
[9] M.S. Bigelow, N.N. Lepeshkin, R.W. Boyd, Science 301 (2003)200.
[10] P.C. Ku, F. Sedgwick, C.J. Chang-Hasnain, P. Palinginis, T. Li, H.Wang, S.W. Chang, S.L. Chuang, Opt. Lett. 29 (2004) 2291.
[11] X. Zhao, P. Palinguinis, B. Pesala, C.J. Chang-Hasnain, P. Hemmer,Opt. Express 13 (2005) 7899.
[12] H. Su, S.L. Chuang, Opt. Lett. 31 (2006) 271.[13] E. Baldit, K. Bencheikh, P. Monnier, J.A. Levenson, V. Rouget,
Phys. Rev. Lett. 95 (2005) 143601.[14] A. Schweinsberg, N.N. Lepeshkin, M.S. Bigelow, R.W. Boyd, S.
Jarabo, Europhys. Lett. 73 (2006) 218.[15] R.W.Boyd,D.J. Gauthier,A.L.Gaeta,Opt.Photon.News17(2006)18.[16] P.F. Wysocki, J.L. Wagener, M.J.F. Digonnet, H.J. Shaw, Proc. SPIE
Fiber Laser Sources Amplifiers IV 1789 (1992) 66.[17] E. Snoeks, G.N. van den Hoven, A. Polman, B. Hendriksen, M.B.
Diemeer, F. Priolo, J. Opt. Soc. Am. B 12 (1995) 1468.[18] Y.L. Xue, G.B. Smith, A.T. Baker, IEEE J. Quantum Electron. 34
(1998) 1380.[19] M.V.D. Vermelho, U. Peschel, J.S. Aitchison, J. Lightwave Technol.
18 (2000) 401.[20] B-Ch. Hwang, S. Jiang, T. Luo, J. Watson, G. Sorbello, N.
Peyghambarian, J. Opt. Soc. Am. B 17 (2000) 833.[21] H. Shin, A. Schweinsberg, G. Gehring, K. Schwertz, H.J. Chang,
R.W. Boyd, Q.-H. Park, D.J. Gauthier, Opt. Lett. Doc. ID 78405(2007).
[22] N.G. Basov, R.V. Ambartsumyan, V.S. Zuev, P.G. Kryukov, V.S.Letokhov, Sov. Phys. JETP 23 (1966) 16.
[23] A.C. Selden, Brit. J. Appl. Phys. 18 (1967) 743.[24] H. Cao, A. Dogariu, L.J. Wang, IEEE J. Sel. Top. Quantum
Electron. 9 (2003) 52.
Related Documents