EFFECT OF ICE CRYSTAL SIZE ON THE TEXTURAL PROPERTIES OF ICE CREAM AND SORBET A Major Qualifying Project Proposal Submitted to the Faculty of the WORCESTER POLYTECHNIC INSTITUTE In Partial Fulfilment of the requirements for the Degree of Bachelor of Science By Han Huynh Ngan Nguyen Kevin K. Yiu Date: April 30 th , 2014 Approved: Professor David DiBiasio, Primary Advisor Professor Satya Shivkumar, Co-Advisor This report represents the work of one or more WPI undergraduate students submitted to the faculty as evidence of completion of a degree requirement. WPI routinely publishes these reports on its web site without editorial or peer review.

Welcome message from author
This document is posted to help you gain knowledge. Please leave a comment to let me know what you think about it! Share it to your friends and learn new things together.
Transcript
EFFECT OF ICE CRYSTAL SIZE ON THE TEXTURAL PROPERTIES OF ICE CREAM AND SORBET
A Major Qualifying Project Proposal Submitted to the Faculty
of the WORCESTER POLYTECHNIC INSTITUTE
In Partial Fulfilment of the requirements for the Degree of Bachelor of Science
By
Han Huynh
Ngan Nguyen
Kevin K. Yiu
Date: April 30th, 2014
Approved:
Professor David DiBiasio, Primary Advisor
Professor Satya Shivkumar, Co-Advisor
This report represents the work of one or more WPI undergraduate students submitted to the faculty as evidence of completion of a degree requirement. WPI routinely publishes these reports on its web site without editorial or peer
review.
ABSTRACT
Coarsening of ice crystals adversely affects the texture and shelf life of frozen products. The
addition of stabilizers offers a potential solution to this problem. The goals of this project were to
examine the coarsening behavior and the impact of stabilizers in a variety of frozen products. Various
techniques including fluorescence microscopy, differential scanning calorimetry, viscometry and
hardness measurements were used to study the kinetics of coarsening. The results indicated that ice
crystal size can change significantly during handling and as a result leads to variations in the hardness.
The data suggested a mixed control kinetic mechanism for coarsening. The addition of stabilizers was
found to generally reduce the coarsening rate.
i
ACKNOWLEDGEMENTS
We would like to express our deepest gratitude to Victoria Huntress, Microscopy/Imaging
Technology Manager, whose guidance and persistent help have made this project possible. Special
thanks to our advisors, Professor DiBiasio and Professor Shivkumar, for overseeing our project during
the entire school year. Finally, we thank Professor MacDonald for giving us permission to use the
differential scanning calorimetry. If it had not been for their commitment and dedication, this project
would not have been possible.
ii
TABLE OF CONTENTS ABSTRACT ....................................................................................................................................................... i
ACKNOWLEDGEMENTS ................................................................................................................................. ii
TABLE OF CONTENTS .................................................................................................................................... iii
LIST OF TABLES ............................................................................................................................................. vi
LIST OF FIGURES .......................................................................................................................................... vii
1.0 EXECUTIVE SUMMARY ...................................................................................................................... 1
2.0 OBJECTIVES ....................................................................................................................................... 5
3.0 BACKGROUND REVIEW ..................................................................................................................... 6
3.1. OVERVIEW OF ICE CREAM INDUSTRY ........................................................................................... 6
3.2 ICE CREAM STRUCTURE ................................................................................................................ 6
3.2.1 MILK PROTEIN ....................................................................................................................... 7
3.2.2 FATS ....................................................................................................................................... 7
3.2.3 SUGARS ................................................................................................................................. 7
3.2.4 ICE CRYSTAL AND WATER...................................................................................................... 8
3.2.5 EMULSIFIER ........................................................................................................................... 8
3.2.6 STABILIZERS ........................................................................................................................... 8
3.3 ICE CREAM MECHANISM ............................................................................................................... 9
3.3.1 CRYSTALLIZATION KINETICS .................................................................................................. 9
3.3.2 RECRYSTALLIZATION KINETICS ............................................................................................ 12
3.3.3 DIFFUSION KINETICS ........................................................................................................... 15
3.4 EFFECTS AND DEFECTS OF STABILIZERS ON ICE CREAM ............................................................. 16
3.4.1 RHEOLOGY........................................................................................................................... 16
3.4.2 OVERRUN ............................................................................................................................ 17
3.4.3 THERMODYNAMIC PROPERTIES ......................................................................................... 17
3.4.4 CRYOPROTECTION ............................................................................................................... 18
3.4.5 MELTING RATE .................................................................................................................... 19
3.4.6 MIXTURE OF STABILIZERS ................................................................................................... 19
3.4.7 DEFECTS CAUSED BY STABILIZERS ....................................................................................... 20
4.0 MATERIALS AND METHODS ............................................................................................................ 21
4.1 SORBET AND ICE CREAM PREPARATION ..................................................................................... 21
4.2 PROCESSING CONDITIONS .......................................................................................................... 22
4.3 FLUORESCENCE MICROSCOPY .................................................................................................... 23
iii
4.4 IMAGE ANALYSIS AND CRYSTAL SIZE DISTRIBUTION .................................................................. 24
4.5 HARDNESS MEASUREMENT ........................................................................................................ 25
4.6 VISCOSITY MEASUREMENT ......................................................................................................... 26
4.7 DIFFERENTIAL SCANNING CALORIMETRY MEASUREMENT ........................................................ 27
5.0 RESULTS AND DISCUSSION .............................................................................................................. 29
5.1 SORBET ANALYSIS ....................................................................................................................... 29
5.1.1 ICE CRYSTAL SIZE AND DISTRIBUTION MEASUREMENT ...................................................... 29
5.1.2 VISCOSITY MEASUREMENTS ............................................................................................... 31
5.1.3 HARDNESS MEASUREMENTS .............................................................................................. 33
5.2 ICE CREAM ANALYSIS .................................................................................................................. 34
5.2.1 ICE CRYSTAL SIZE AND DISTRIBUTION MEASUREMENTS .................................................... 34
5.2.2 VISCOSITY MEASUREMENTS ............................................................................................... 39
5.2.3 HARDNESS MEASUREMENTS .............................................................................................. 41
5.2.4 DSC MEASUREMENTS ......................................................................................................... 43
6.0 CONCLUSIONS AND RECOMMENDATIONS ..................................................................................... 44
7.0 REFERENCES .................................................................................................................................... 46
8.0 APPENDIX ........................................................................................................................................ 48
8.1 ICE CREAM FORMULATIONS ....................................................................................................... 48
8.2 CALCULATION OF WEIGHT AVERAGE CRYTAL SIZE ..................................................................... 49
8.3 SORBET ICE CRYSTAL ANALYSIS ................................................................................................... 50
8.3.1 ICE CRYSTAL STRUCTURE .................................................................................................... 50
8.3.2 ICE CRYSTAL DISRIBUTION .................................................................................................. 52
8.3.3 ICE CRYSTAL MELTING MECHANISM ................................................................................... 59
8.4 ICE CREAM ICE CRYSTAL ANALYSIS ............................................................................................. 63
8.4.1 ICE CRYSTAL STRUCTURE .................................................................................................... 63
8.4.2 ICE CRYSTAL DISTRIBUTION ................................................................................................ 66
8.4.3 ICE CRYSTAL MELTING MECHANISM ................................................................................... 76
8.5 VISCOSITY CALCULATION ............................................................................................................ 83
8.6 HARDNESS CALCULATION ........................................................................................................... 83
8.7 CRYSTALLINITY CALCULATION..................................................................................................... 83
8.8 CALCULATION SPREADSHEETS .................................................................................................... 85
8.8.1 WEIGHTED AVERAGE CRYSTAL SIZE .................................................................................... 85
8.8.2 VISCOSITY MEASUREMENTS ............................................................................................... 89
iv
8.9 DSC MEASUREMENT ................................................................................................................... 94
v
LIST OF TABLES Table 1. Viscosity measurements of ice cream with and without stabilizers at a constant shear rate of 50 RPM. ......................................................................................................................................................... 3 Table 2. Heat of fusion and crystallinity of unstabilized and stabilized ice cream. ................................... 4 Table 3. Formulation of a typical ice cream ................................................................................................ 7 Table 4. Ingredients of Häagen-Daz mango sorbet used in sorbet experiments. .................................... 21 Table 5. Ice cream formulation for the experiments. ............................................................................... 22 Table 6. Compositions of main ingredients in the ice cream mix. ............................................................ 22 Table 7. Variation of ice crystal size in Häagen-Daz mango sorbet for various recrystallization times. . 30 Table 8. Variation in viscosity of Häagen-Daz mango sorbet for various shear rates. ............................ 32 Table 9. Variation in crystal size for ice cream with different stabilizer concentrations. ....................... 35 Table 10. Viscosity measurements for ice cream with different stabilizer concentrations. ................... 40 Table 11. Summary table for n (flow behavior index) and K (consistency index) for ice cream with different stabilizer concentrations. ........................................................................................................... 40 Table 12. Heat of fusion and crystallinity of unstabilized and stabilized ice cream. ............................... 43 Table 13. Summary of different ice cream formulations. ......................................................................... 49 Table 14. Weighted average crystal size of sorbet. .................................................................................. 85 Table 15. Weighted average crystal size for 0.00% stabilized ice cream. ................................................ 86 Table 16. Weighted average crystal size for 0.05% stabilized ice cream. ................................................ 86 Table 17. Weighted average crystal size for 0.10% stabilized ice cream. ................................................ 87 Table 18. Weighted average crystal size for 0.15% stabilized ice cream. ................................................ 88 Table 19. Viscosity measurements for sorbet. .......................................................................................... 89 Table 20. Viscosity measurements for 0.00% stabilized ice cream. ......................................................... 90 Table 21. Viscosity measurements for 0.05% stabilized ice cream. ......................................................... 91 Table 22. Viscosity measurements for 0.10% stabilized ice cream. ......................................................... 92 Table 23. Viscosity measurements for 0.15% stabilized ice cream. ......................................................... 93
vi
LIST OF FIGURES Figure 1. Ice crystal size distribution in ice cream for various recrystallization times. An initial sample (0 min) was obtained and left in the freezer. Subsequently, the sample was placed outside for the times indicated (hereon referred to as recrystallization time) and immediately placed in the freezer. It was taken out after 12 hr and tested immediately. The arrows indicate the mean in the distribution. ............. 1 Figure 2. Hardness of sorbet for various recrystallization times. The arrows indicate the peak force or the hardness of sorbet. ........................................................................................................................................ 2 Figure 3. Kinetic models for ice cream, where n = 2 represents interface surface energy kinetics and n = 3 represents diffusion kinetics. ........................................................................................................................ 3 Figure 4. Ice cream composition (Caillet et. al, 2003). .................................................................................. 9 Figure 5. Schematic of a scrap-surface freezer (Hartel, 1996). ................................................................... 10 Figure 6. Relationship between nucleation and growth rate over a range of temperature (Hartel, 1996). .................................................................................................................................................................... 11 Figure 7. Ostwald ripening of a small crystal during hold at -10 ± 0.01°C on a microscope stage (Donhowe, 1993; Hartel, 1998). .................................................................................................................. 13 Figure 8. Isomass rounding and accretion phenomenon of crystals during hold at -5 ± 0.01°C on a microstage (Donhowe, 1993; Hartel, 1998). ............................................................................................... 14 Figure 9. Flow chart of ice cream making and samples preparation processes. ........................................ 22 Figure 10. Carl Zeiss fluorescence microscope at Gateway Park. ............................................................... 23 Figure 11. Hardness test set up in Washburn food engineering laboratory. .............................................. 25 Figure 12. A typical graph of force as a function of deformation. The peak force represents the hardness of the sample. ............................................................................................................................................. 26 Figure 13. Variation of ice crystal size with recrystallization time. An initial sample (0 min) was obtained and stored in the freezer as soon as the container was opened. Subsequently, the sample was placed outside for the times indicated (hereon referred to as recrystallization time) and immediately placed in the freezer. They were all taken out after 12 hours, transported to the lab on dry ice and tested immediately. The yellow circles represent the typical ice crystals that were analyzed and measured. ..... 29 Figure 14. Typical ice crystal distributions in Häagen-Dazs mango sorbet. Data are plotted for various recrystallization times of 0, 10, and 20 minute. The arrows indicate the mean in the distribution. ......... 30 Figure 15. Kinetic models for Häagen-Daz mango sorbet, where n = 2 represents interface surface energy kinetic and n = 3 represents diffusion kinetic. ............................................................................................. 31 Figure 16. Viscosity measurement for Häagen-Daz mango sorbet with various shear rates. .................... 32 Figure 17. Hardness measurement for sorbet over coarsening time. The peak force is defined as the hardness of sorbet at time intervals of 0, 10 and 20 minutes (shown by arrow and labeled).................... 33 Figure 18. Typical ice crystal distributions in ice cream. Data are plotted for various recrystallization times of 0, 10, and 20 minutes. The arrows indicate the mean in the distribution. ................................... 34 Figure 19.Typical ice crystal distribution in ice cream. Data are plotted for ice cream with various stabilizer concentration at recrystallization time of 20 minutes. The arrows represent the mean in the distribution. ................................................................................................................................................. 35 Figure 20. Kinetic models for ice cream, where n = 2 represents interface surface energy kinetic and n = 3 represents diffusion kinetic. ........................................................................................................................ 36 Figure 21. Ice crystal structure for 0.10% stabilized ice cream (Run 1). The yellow circles represent the typical ice crystals that were analyzed and measured. .............................................................................. 37 Figure 22. Diffusion kinetic model for ice cream at different stabilizers concentration. ............................ 38
vii
Figure 23. Interface surface energy kinetic model for ice cream with different stabilizers concentration. 38 Figure 24. Variation of viscosity of ice cream with different stabilizer concentrations. ............................. 39 Figure 25. Hardness measurement for 0.00% stabilized ice cream over coarsening time. The peak force is defined as the hardness of sorbet at time intervals of 0, 10 and 20 minutes (shown by arrow and labeled). ...................................................................................................................................................... 41 Figure 26. Hardness test for ice cream with and without stabilizer at 0 minute. ....................................... 42 Figure 27. Crystal images for sorbet samples at 0 min for three runs. ....................................................... 50 Figure 28. Crystal images for sorbet samples at 10 min for two runs. ....................................................... 50 Figure 29. Crystal images for sorbet samples at 20 min for two runs. ....................................................... 51 Figure 30. Crystal images for sorbet samples at 30 min for three runs. ..................................................... 51 Figure 31. Crystal images for sorbet samples at 40 min. ............................................................................ 51 Figure 32. Crystal images for sorbet samples at 50 min. ............................................................................ 52 Figure 33. Ice crystal distribution of sorbet at 0 min (Run 1). ..................................................................... 52 Figure 34. Ice crystal distribution of sorbet at 0 min (Run 2). ..................................................................... 53 Figure 35. Ice crystal distribution of sorbet at 0 min (Run 3). ..................................................................... 53 Figure 36. Ice crystal distribution of sorbet at 10 min (Run 1). ................................................................... 54 Figure 37. Ice crystal distribution of sorbet at 10 min (Run 2). ................................................................... 54 Figure 38. Ice crystal distribution of sorbet at 20 min (Run 1). ................................................................... 55 Figure 39. Ice crystal distribution of sorbet at 20 min (Run 2). ................................................................... 55 Figure 40. Ice crystal distribution of sorbet at 30 min (Run 1). ................................................................... 56 Figure 41. Ice crystal distribution of sorbet at 30 min (Run 2). ................................................................... 56 Figure 42. Ice crystal distribution of sorbet at 30 min (Run 3). ................................................................... 57 Figure 43. Ice crystal distribution of sorbet at 40 min. ............................................................................... 57 Figure 44 . Ice crystal distribution of sorbet at 50 min. .............................................................................. 58 Figure 45. Ostwald ripening for sorbet at 0 min (Run 2). ........................................................................... 59 Figure 46. Ostwald ripening for sorbet at 0 min (Run 3). ........................................................................... 59 Figure 47. Ostwald ripening for sorbet at 10 min (Run 1). ......................................................................... 59 Figure 48. Ostwald ripening for sorbet at 10 min (Run 2). ......................................................................... 60 Figure 49.Ostwald ripening for sorbet at 20 min (Run 1). .......................................................................... 60 Figure 50. Ostwald ripening for sorbet at 20 min (Run 2). ......................................................................... 60 Figure 51. Ostwald ripening for sorbet at 30 min (Run 1). ......................................................................... 61 Figure 52. Ostwald ripening for sorbet at 30 min (Run 2). ......................................................................... 61 Figure 53. Ostwald ripening for sorbet at 30 min (Run 3). ......................................................................... 61 Figure 54. Ostwald ripening for sorbet at 40 min. ...................................................................................... 62 Figure 55. Ostwald ripening for sorbet at 50 min. ...................................................................................... 62 Figure 56. Crystal images for 0.00% stabilized samples (Run 1). ................................................................ 63 Figure 57. Crystal images for 0.05% stabilized ice cream samples (Run 1). ............................................... 63 Figure 58. Crystal images for 0.05% stabilized ice cream samples (Run 2). ............................................... 63 Figure 59. Crystal images for 0.10% stabilized ice cream samples (Run 1). ............................................... 64 Figure 60. Crystal images for 0.10% stabilized ice cream samples (Run 2). ............................................... 64 Figure 61. Crystal images for 0.10% stabilized ice cream samples (Run 3). ............................................... 64 Figure 62. Crystal images for 0.15% stabilized ice cream samples (Run 1). ............................................... 65 Figure 63. Crystal images for 0.15% stabilized ice cream samples (Run 2). ............................................... 65 Figure 64. Ice crystal distribution of 0.00% stabilized ice cream at 0 min (Run 1). ..................................... 66
viii
Figure 65. Ice crystal distribution of 0.00% stabilized ice cream at 10 min (Run 1). ................................... 66 Figure 66. Ice crystal distribution of 0.00% stabilized ice cream at 20 min (Run 1). ................................... 67 Figure 67. Ice crystal distribution of 0.05% stabilized ice cream at 0 min (Run 1). ..................................... 67 Figure 68. Ice crystal distribution of 0.05% stabilized ice cream at 60 min (Run 1). ................................... 68 Figure 69. Ice crystal distribution of 0.05% stabilized ice cream at 0 min (Run 2). ..................................... 68 Figure 70. Ice crystal distribution of 0.05% stabilized ice cream at 10 min (Run 2). ................................... 69 Figure 71. Ice crystal distribution of 0.05% stabilized ice cream at 20 min (Run 2). ................................... 69 Figure 72. Ice crystal distribution of 0.10% stabilized ice cream at 0 min (Run 1). ..................................... 70 Figure 73. Ice crystal distribution of 0.10% stabilized ice cream at 10 min (Run 1). ................................... 70 Figure 74. Ice crystal distribution of 0.10% stabilized ice cream at 20 min (Run 1). ................................... 71 Figure 75. Ice crystal distribution of 0.10% stabilized ice cream at 10 min (Run 2). ................................... 71 Figure 76. Ice crystal distribution of 0.10% stabilized ice cream at 20 min (Run 2). ................................... 72 Figure 77. Ice crystal distribution of 0.10% stabilized ice cream at 0 min (Run 3). ..................................... 72 Figure 78. Ice crystal distribution of 0.10% stabilized ice cream at 10 min (Run 3). ................................... 73 Figure 79. Ice crystal distribution of 0.10% stabilized ice cream at 20 min (Run 3). ................................... 73 Figure 80. Ice crystal distribution of 0.15% stabilized ice cream at 0 min (Run 1). ..................................... 74 Figure 81. Ice crystal distribution of 0.15% stabilized ice cream at 10 min (Run 1). ................................... 74 Figure 82. Ice crystal distribution of 0.15% stabilized ice cream at 20 min (Run 1). ................................... 75 Figure 83. Ostwald ripening for 0.00 % stabilized ice cream at 0 min (Run 1). .......................................... 76 Figure 84. Ostwald ripening for 0.00% stabilized ice cream at 10 min (Run 1). ......................................... 76 Figure 85. Ostwald ripening for 0.00% stabilized ice cream at 20 min (Run 1). ......................................... 76 Figure 86. Ostwald ripening for 0.05% stabilized ice cream at 0 min (Run 1). ........................................... 77 Figure 87. Ostwald ripening for 0.05% stabilized ice cream at 60 min (Run 1). ......................................... 77 Figure 88. Ostwald ripening for 0.05% stabilized ice cream at 0 min (Run 2). ........................................... 77 Figure 89. Ostwald ripening for 0.05% stabilized ice cream at 10 min (Run 2). ......................................... 78 Figure 90. Ostwald ripening for 0.05% stabilized ice cream at 20 min (Run 2). ......................................... 78 Figure 91. Ostwald ripening for 0.10% stabilized ice cream at 0 min (Run 1). ........................................... 78 Figure 92. Ostwald ripening for 0.10% stabilized ice cream at 10 min (Run 1). ......................................... 79 Figure 93. Ostwald ripening for 0.10% stabilized ice cream at 20 min (Run 1). ......................................... 79 Figure 94. Ostwald ripening for 0.10% stabilized ice cream at 10 min (Run 2). ......................................... 79 Figure 95. Ostwald ripening for 0.10% stabilized ice cream at 20 min (Run 2). ......................................... 80 Figure 96. Ostwald ripening for 0.10% stabilized ice cream at 0 min (Run 3). ........................................... 80 Figure 97. Ostwald ripening for 0.10% stabilized ice cream at 10 min (Run 3). ......................................... 80 Figure 98. Ostwald ripening for 0.10% stabilized ice cream at 20 min (Run 3). ......................................... 81 Figure 99. Ostwald ripening for 0.15% stabilized ice cream at 0 min (Run 1). ........................................... 81 Figure 100. Ostwald ripening for 0.15% stabilized ice cream at 10 min (Run 1). ....................................... 81 Figure 101. Ostwald ripening for 0.15% stabilized ice cream at 20 min (Run 1). ....................................... 82 Figure 102. Ostwald ripening for 0.15% stabilized ice cream at 0 min (Run 2). ......................................... 82 Figure 103. Ostwald ripening for 0.15% stabilized ice cream at 10 min (Run 2). ....................................... 82 Figure 104. DSC measurement of water. .................................................................................................... 94 Figure 105. DSC measurement of Häagen-Dazs mango sorbet. ................................................................. 94 Figure 106. DSC measurement of 0.00% stabilized ice cream. ................................................................... 95 Figure 107. DSC measurement of 0.05% stabilized ice cream. ................................................................... 95 Figure 108. DSC measurement of 0.10% stabilized ice cream. ................................................................... 96
ix
Figure 109. DSC measurement of 0.15% stabilized ice cream. ................................................................... 96
x
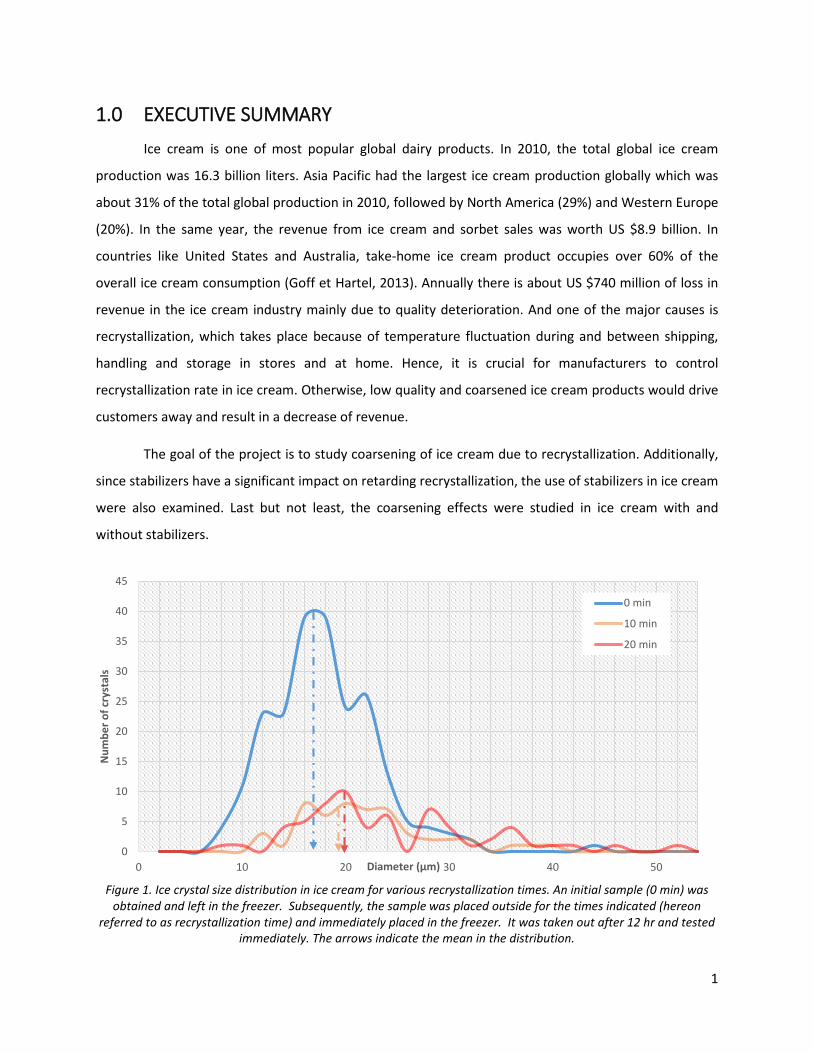
Figure 1. Ice crystal size distribution in ice cream for various recrystallization times. An initial sample (0 min) was obtained and left in the freezer. Subsequently, the sample was placed outside for the times indicated (hereon
referred to as recrystallization time) and immediately placed in the freezer. It was taken out after 12 hr and tested immediately. The arrows indicate the mean in the distribution.
1.0 EXECUTIVE SUMMARY
Ice cream is one of most popular global dairy products. In 2010, the total global ice cream
production was 16.3 billion liters. Asia Pacific had the largest ice cream production globally which was
about 31% of the total global production in 2010, followed by North America (29%) and Western Europe
(20%). In the same year, the revenue from ice cream and sorbet sales was worth US $8.9 billion. In
countries like United States and Australia, take-home ice cream product occupies over 60% of the
overall ice cream consumption (Goff et Hartel, 2013). Annually there is about US $740 million of loss in
revenue in the ice cream industry mainly due to quality deterioration. And one of the major causes is
recrystallization, which takes place because of temperature fluctuation during and between shipping,
handling and storage in stores and at home. Hence, it is crucial for manufacturers to control
recrystallization rate in ice cream. Otherwise, low quality and coarsened ice cream products would drive
customers away and result in a decrease of revenue.
The goal of the project is to study coarsening of ice cream due to recrystallization. Additionally,
since stabilizers have a significant impact on retarding recrystallization, the use of stabilizers in ice cream
were also examined. Last but not least, the coarsening effects were studied in ice cream with and
without stabilizers.
1
0
5
10
15
20
25
30
35
40
45
0 10 20 30 40 50
Num
ber o
f cry
stal
s
Diameter (µm)
0 min
10 min
20 min
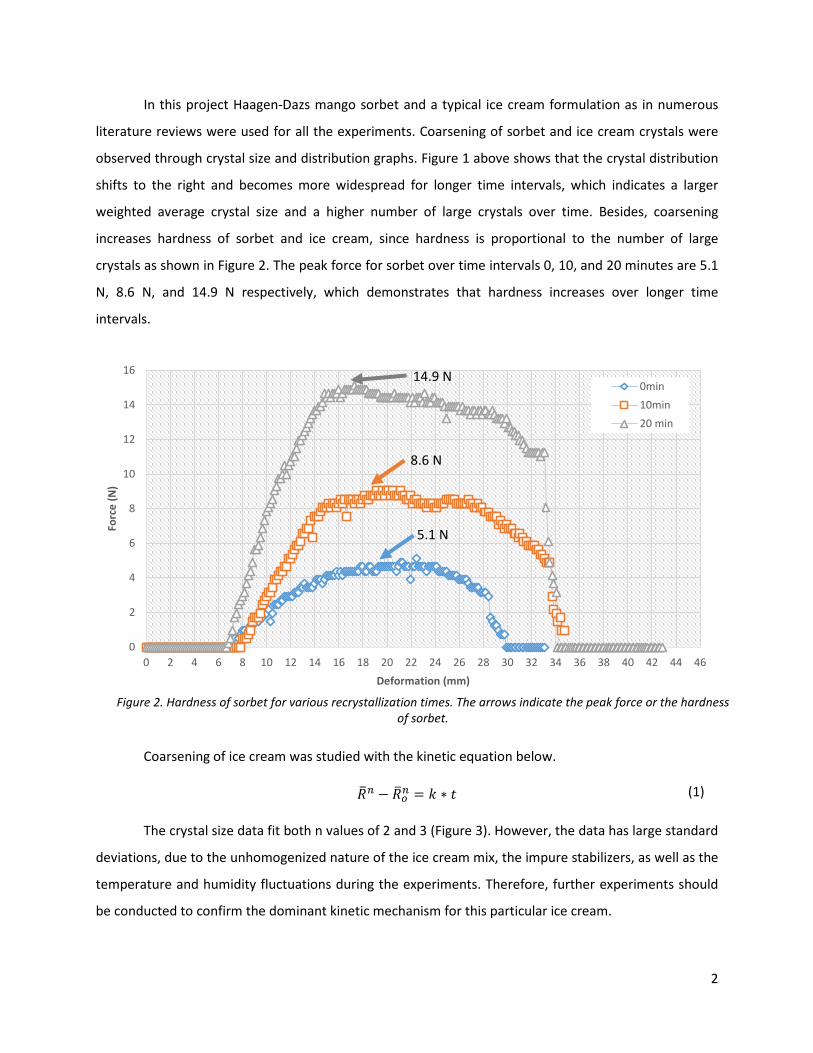
Figure 2. Hardness of sorbet for various recrystallization times. The arrows indicate the peak force or the hardness of sorbet.
In this project Haagen-Dazs mango sorbet and a typical ice cream formulation as in numerous
literature reviews were used for all the experiments. Coarsening of sorbet and ice cream crystals were
observed through crystal size and distribution graphs. Figure 1 above shows that the crystal distribution
shifts to the right and becomes more widespread for longer time intervals, which indicates a larger
weighted average crystal size and a higher number of large crystals over time. Besides, coarsening
increases hardness of sorbet and ice cream, since hardness is proportional to the number of large
crystals as shown in Figure 2. The peak force for sorbet over time intervals 0, 10, and 20 minutes are 5.1
N, 8.6 N, and 14.9 N respectively, which demonstrates that hardness increases over longer time
intervals.
Coarsening of ice cream was studied with the kinetic equation below.
𝑅𝑅�𝑛𝑛 − 𝑅𝑅�𝑜𝑜𝑛𝑛 = 𝑘𝑘 ∗ 𝑡𝑡
The crystal size data fit both n values of 2 and 3 (Figure 3). However, the data has large standard
deviations, due to the unhomogenized nature of the ice cream mix, the impure stabilizers, as well as the
temperature and humidity fluctuations during the experiments. Therefore, further experiments should
be conducted to confirm the dominant kinetic mechanism for this particular ice cream.
0
2
4
6
8
10
12
14
16
0 2 4 6 8 10 12 14 16 18 20 22 24 26 28 30 32 34 36 38 40 42 44 46
Forc
e (N
)
Deformation (mm)
0min10min20 min
14.9 N
8.6 N
5.1 N
(1)
2
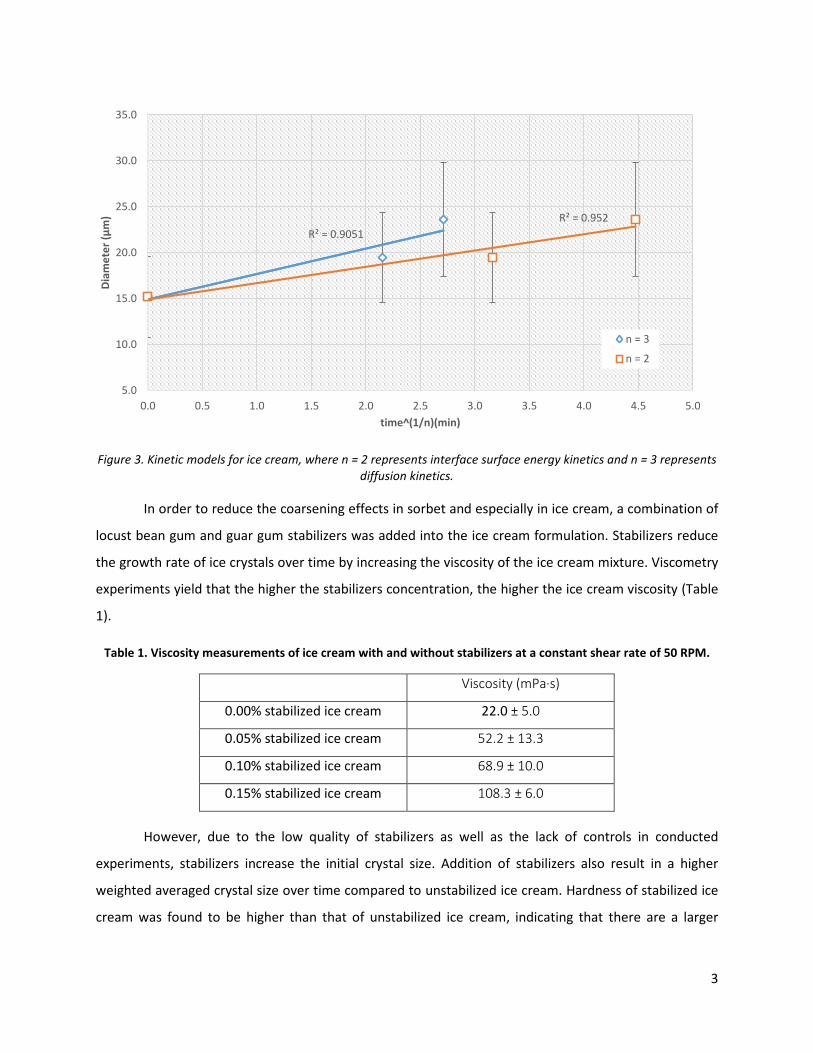
Figure 3. Kinetic models for ice cream, where n = 2 represents interface surface energy kinetics and n = 3 represents diffusion kinetics.
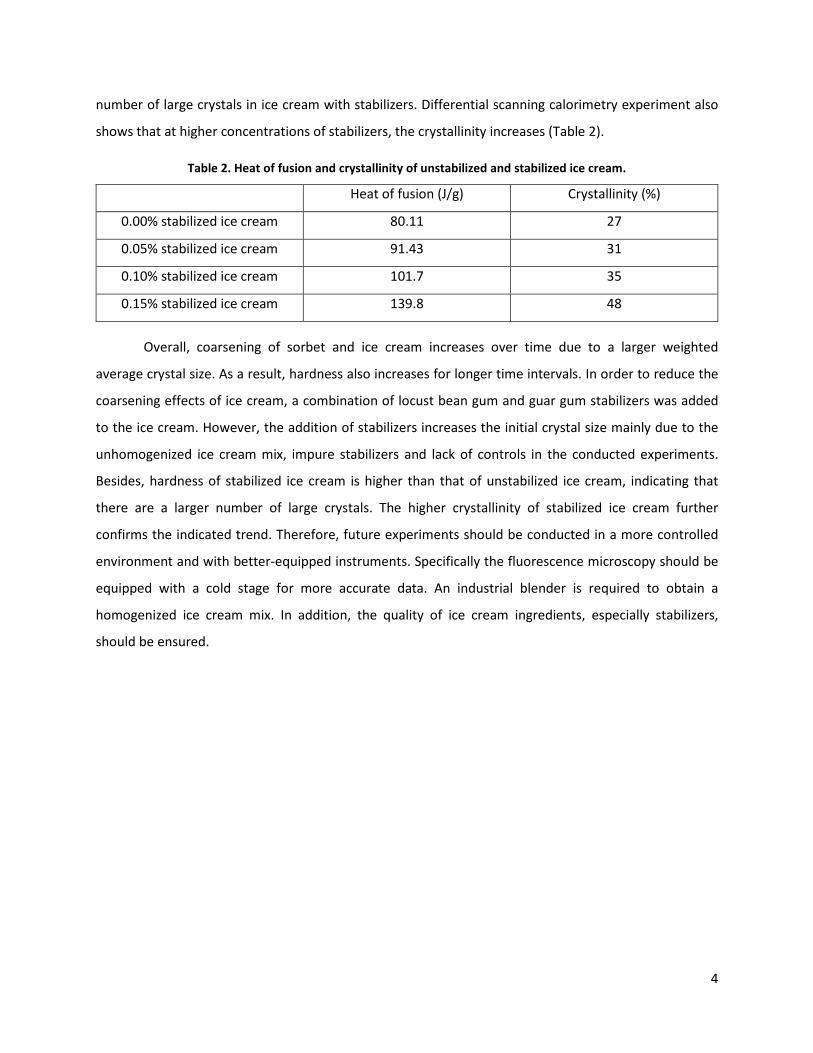
In order to reduce the coarsening effects in sorbet and especially in ice cream, a combination of
locust bean gum and guar gum stabilizers was added into the ice cream formulation. Stabilizers reduce
the growth rate of ice crystals over time by increasing the viscosity of the ice cream mixture. Viscometry
experiments yield that the higher the stabilizers concentration, the higher the ice cream viscosity (Table
1).
Table 1. Viscosity measurements of ice cream with and without stabilizers at a constant shear rate of 50 RPM.
Viscosity (mPa·s)
0.00% stabilized ice cream 22.0 ± 5.0
0.05% stabilized ice cream 52.2 ± 13.3
0.10% stabilized ice cream 68.9 ± 10.0
0.15% stabilized ice cream 108.3 ± 6.0
However, due to the low quality of stabilizers as well as the lack of controls in conducted
experiments, stabilizers increase the initial crystal size. Addition of stabilizers also result in a higher
weighted averaged crystal size over time compared to unstabilized ice cream. Hardness of stabilized ice
cream was found to be higher than that of unstabilized ice cream, indicating that there are a larger
R² = 0.9051R² = 0.952
5.0
10.0
15.0
20.0
25.0
30.0
35.0
0.0 0.5 1.0 1.5 2.0 2.5 3.0 3.5 4.0 4.5 5.0
Diam
eter
(µm
)
time^(1/n)(min)
n = 3
n = 2
3
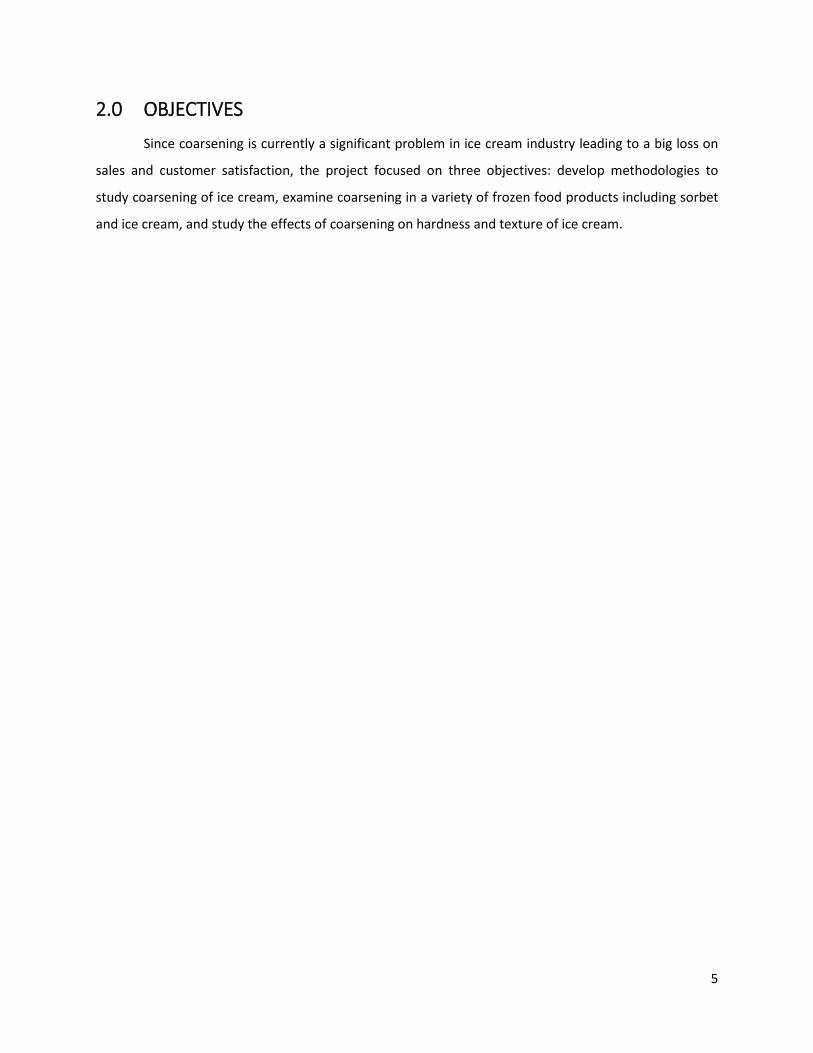
number of large crystals in ice cream with stabilizers. Differential scanning calorimetry experiment also
shows that at higher concentrations of stabilizers, the crystallinity increases (Table 2).
Table 2. Heat of fusion and crystallinity of unstabilized and stabilized ice cream.
Heat of fusion (J/g) Crystallinity (%)
0.00% stabilized ice cream 80.11 27
0.05% stabilized ice cream 91.43 31
0.10% stabilized ice cream 101.7 35
0.15% stabilized ice cream 139.8 48
Overall, coarsening of sorbet and ice cream increases over time due to a larger weighted
average crystal size. As a result, hardness also increases for longer time intervals. In order to reduce the
coarsening effects of ice cream, a combination of locust bean gum and guar gum stabilizers was added
to the ice cream. However, the addition of stabilizers increases the initial crystal size mainly due to the
unhomogenized ice cream mix, impure stabilizers and lack of controls in the conducted experiments.
Besides, hardness of stabilized ice cream is higher than that of unstabilized ice cream, indicating that
there are a larger number of large crystals. The higher crystallinity of stabilized ice cream further
confirms the indicated trend. Therefore, future experiments should be conducted in a more controlled
environment and with better-equipped instruments. Specifically the fluorescence microscopy should be
equipped with a cold stage for more accurate data. An industrial blender is required to obtain a
homogenized ice cream mix. In addition, the quality of ice cream ingredients, especially stabilizers,
should be ensured.
4
2.0 OBJECTIVES
Since coarsening is currently a significant problem in ice cream industry leading to a big loss on
sales and customer satisfaction, the project focused on three objectives: develop methodologies to
study coarsening of ice cream, examine coarsening in a variety of frozen food products including sorbet
and ice cream, and study the effects of coarsening on hardness and texture of ice cream.
5
3.0 BACKGROUND REVIEW
3.1. OVERVIEW OF ICE CREAM INDUSTRY
Ice cream is one of the most popular global dairy products. In 2010, the total global ice cream
production was 16.3 billion liters. Asia Pacific had the largest ice cream production globally which was
about 31% of the total global production in 2010, followed by North America (29%) and Western Europe
(20%). In the same year, the revenue from ice cream and sorbet sales was worth US $8.9. Moreover,
Italy had the highest expenditure for ice cream of US $113 per capita, while US had an ice cream
expenditure of US $50 per capita in 2010. The data from Euromonitor International in 2011
demonstrated that the world ice cream production has been increasing slightly every year; the average
growth of product from 2006 to 2010 was about 1.56% per year. Furthermore, the take-home ice cream
consumption in the global market has been shrinking since 2006. In countries like United States and
Australia, take-home ice cream product occupies over 60% over the overall ice cream consumption (Goff
et Hartel, 2013). Since take-home market takes up a significant portion of the American, European and
Australian market, it is critical for ice cream companies to manufacture products that retain their
maximum quality when the customers bring home their products. The main reason of ice cream quality
deterioration is recrystallization. The outcome of recrystallization is the coarsening of ice cream, which
makes ice cream icy and undesirable. Further information about the mechanism of recrystallization is
presented in later sections of the paper. As a result, it is important to investigate recrystallization and
find a way to slow down the process so that customers can get the best quality products possible. This
can help ice cream companies to maintain their customer with the declining clientele that they are
facing. But first of all, it is necessary to introduce what ice cream is made of and it will lay out a platform
to understand how recrystallization affects ice cream quality.
3.2 ICE CREAM STRUCTURE
Ice cream consists of water, air, sugar, milk fat, milk-solid-non-fat, sugar/sweeteners, stabilizer,
emulsifier and flavoring agents (Goff & Hartel, 2013). A typical composition of ice cream consists of
about 30% ice, 5% fat, 15% matrix and 50% air by volume; the concentrations of ingredients above vary
for different ice cream brands and countries. Below is a table showing the weight component of
different ingredients in a typical ice cream. The ingredients in ice cream exist in three states: fat and ice
crystals as solid, matrix as liquid and air as gas. The ice crystals, fat droplets and air bubbles are
dispersed in the continuous matrix phase that is made of stabilizer, sugar and protein suspensions
(Clark, 2013).
6
Table 3. Formulation of a typical ice cream
Ingredient Amount (% weight)
Milk Protein 4 – 5 %
Fat 7 – 15 %
Sugars 17 – 23 %
Water 60 – 72 %
Emulsifier & Stabilizer 0.5 %
3.2.1 MILK PROTEIN
The two major functions of milk protein are the stabilization of water-continuous emulsion and
foams, as well as the contribution to the unique flavor of ice cream. The sources of milk protein are milk,
skimmed milk powder, whey powders and buttermilk. Casein and whey protein are two kinds of milk
protein and they respectively make up 80% and 20% of the whole protein structure. Caseins are surface-
active colloidal proteins that contain both hydrophilic and hydrophobic ends, allowing them to form
micelles. Whey proteins are globular and also surface-active. They are around 3-6 nm while caseins are
approximately 100 nm. They have a critical function in stabilizing and forming air pockets in ice cream
(Clark, 2013).
3.2.2 FATS
Fats have a critical role in stabilizing air bubbles in ice cream, contributing to the creamy texture
and flavor, as well as slowing down the melting rate of ice cream. Typical commercial ice cream has a fat
content of about 8-10% and the fat content of some premium ice cream can reach as high as 15-20%.
The main sources of fat for ice cream manufacturing are cream and vegetable fat. Milk fat is the most
common fat that is present in ice cream. They are about 0.1 – 10 µm in size and mostly in solid phase
between -5°C and 5°C.
3.2.3 SUGARS
The purposes of sugar are to sweeten and control the hardness of ice cream (i.e. the higher the
sugar content, the lower ice content, and the softer the ice cream). Sugar depresses the freezing point
of the ice cream mix and hence lowers the amount of ice crystals in ice cream production. Sugar also
increases the viscosity of the ice cream matrix; the higher the degree of polymerization of sugar is, the
more viscous the matrix is. The sensation of creaminess is correlated with higher viscosity of ice cream;
however, higher viscosity causes stickiness and difficulty in scooping ice cream. The common examples
7
of sugars used in ice cream are dextrose, sucrose, fructose, lactose, corn syrup and sugar alcohol (Clark,
2013).
3.2.4 ICE CRYSTAL AND WATER
Ice cream has water content of about 60-72 weight %. During ice cream production, the majority
of water is converted to ice crystals (Clark, 2013). The average size range of ice crystal is 20 -55 µm and
the size range varies with different formulations of ice cream (Hagiwara & Hartel, 1995).
3.2.5 EMULSIFIER
Emulsifier is another surface-active component found in ice cream. Its function is to de-emulsify
a portion of fat to help the stabilization of air pockets during ice cream production. The most common
emulsifier in the industry is mono-/diglycerides. Another source of emulsifier is egg yolk. The surface
active properties of mono-/diglycerides come from the hydrophilic head and hydrophobic end of the
molecule. The sources of mono-/diglycerides are from the hydrogenation of vegetable fats such as palm
oils and soybean oils (Clark, 2013).
3.2.6 STABILIZERS
The advantages of using stabilizers are to enhance smoothness of ice cream, slow down melting
rate, prevent shrinkage of ice cream due to loss of moisture, disguise the detection of ice crystal in ice
cream and stabilize the foam structure of ice cream. Stabilizers are water-soluble polymers that contain
hydroxyl functional groups. They usually have a degree of polymerization of about 1000 and molecular
weight of approximately 105 − 106 g/mol. They are able to produce high viscosity even at a small
concentration (typically around 0.2%). Furthermore, stabilizers have a synergistic property where their
effectiveness in ice crystal growth retardation can be enhanced by combining two different stabilizers.
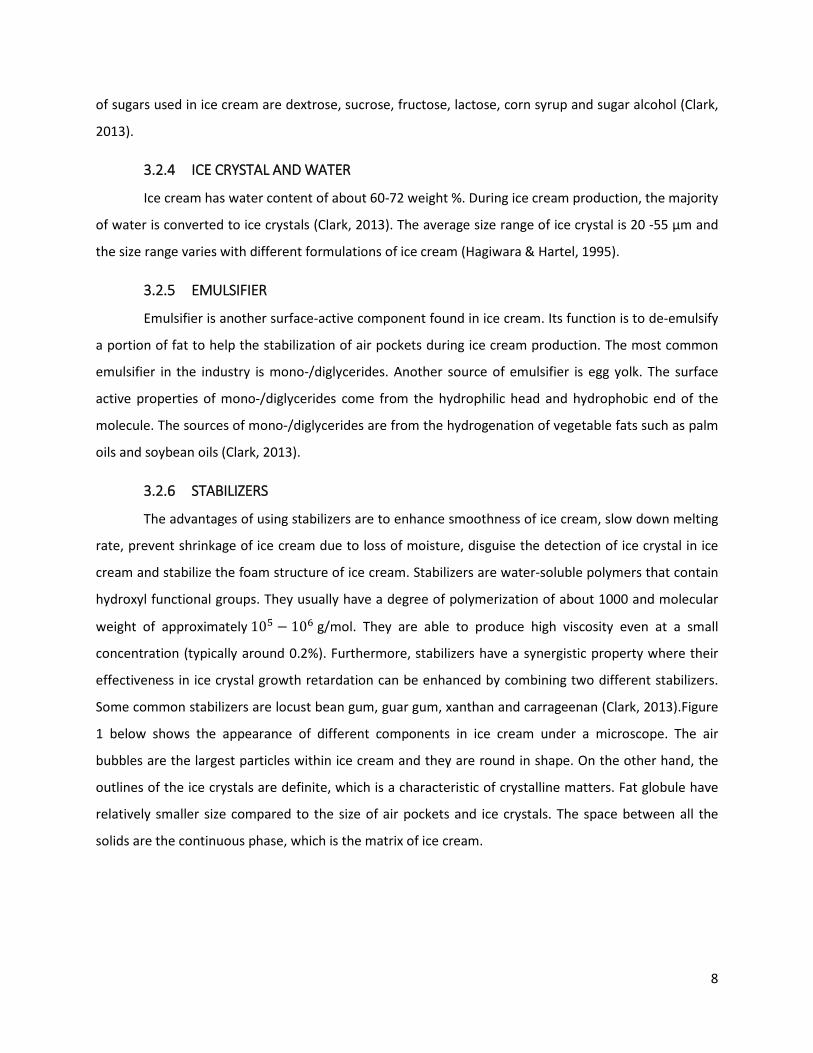
Some common stabilizers are locust bean gum, guar gum, xanthan and carrageenan (Clark, 2013).Figure
1 below shows the appearance of different components in ice cream under a microscope. The air
bubbles are the largest particles within ice cream and they are round in shape. On the other hand, the
outlines of the ice crystals are definite, which is a characteristic of crystalline matters. Fat globule have
relatively smaller size compared to the size of air pockets and ice crystals. The space between all the
solids are the continuous phase, which is the matrix of ice cream.
8
Figure 4. Ice cream composition (Caillet et. al, 2003).
3.3 ICE CREAM MECHANISM
3.3.1 CRYSTALLIZATION KINETICS
In order to produce the smoothness texture in ice cream, it is important to control the amount
and size of ice crystals in ice cream during initial freezing as well as storage and distribution process.
Crystallization is the process at which ice crystals form on the wall of a scraped-surface freezer. During
ice crystallization, proper preparation and control of ice cream solution can maximize the shelf life of ice
cream. In the ice cream industry, a scraped-surface freezer with ammonia vaporizing on the outside of
the freezer barrel is often used, providing the means for small crystals to form. The scraper blades need
to remain sharp every time a new batch of ice cream is produced, and they must touch the inner surface
of the freezer evenly in order to produce consistently small crystals. The newly-formed crystals at the
wall are believed to disperse into the center of the barrel thanks to the rotation of the blades, as shown
in Figure 1. At a higher temperature than the freezer wall, the center of the barrel is where ice crystals
start to grow and ripen. The formation or nucleation of ice crystals at the freezer wall is due to the large
temperature driving force there. Based on the temperature difference between the ammonia blanket
and the thickness of the ice layer on the inner surface, there is an approximate temperature gradient of
20 to 25°C at the wall (Hartel, 1996). Since ice cream is such a complex material, and changing one
factor during the freezing step affects several properties of the mix, the exact nucleation mechanism has
not been confirmed. However, there have been many speculated hypotheses regarding this process.
9
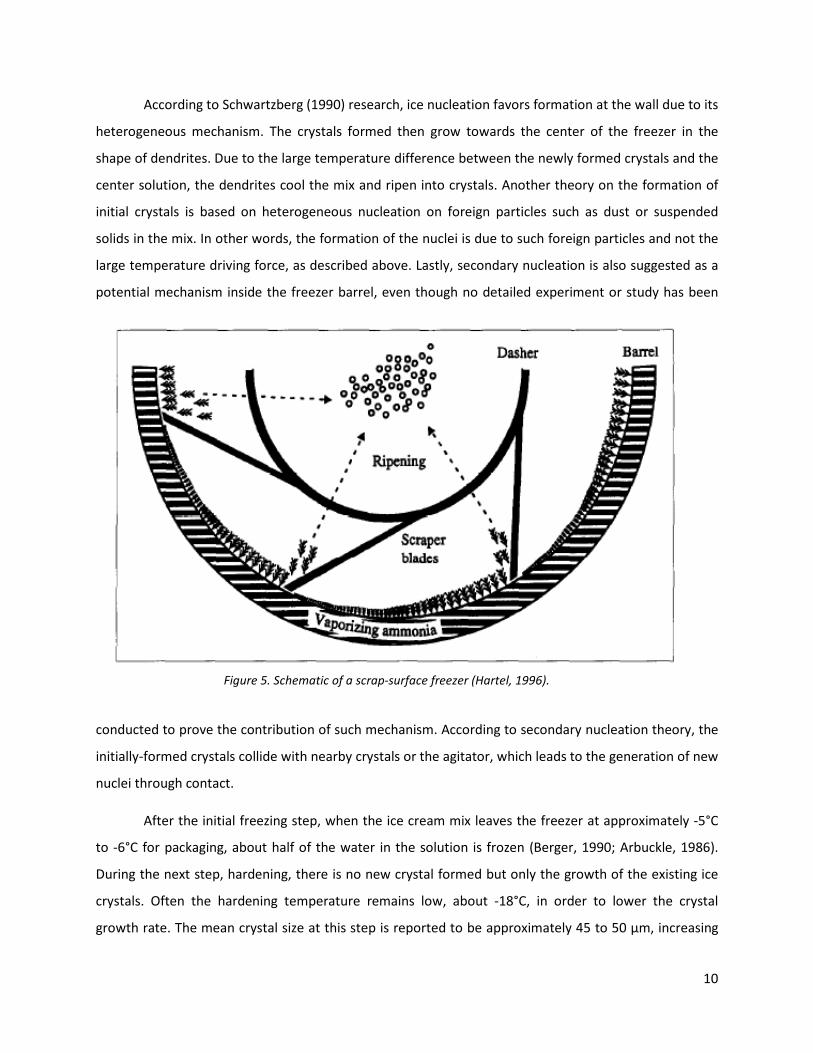
According to Schwartzberg (1990) research, ice nucleation favors formation at the wall due to its
heterogeneous mechanism. The crystals formed then grow towards the center of the freezer in the
shape of dendrites. Due to the large temperature difference between the newly formed crystals and the
center solution, the dendrites cool the mix and ripen into crystals. Another theory on the formation of
initial crystals is based on heterogeneous nucleation on foreign particles such as dust or suspended
solids in the mix. In other words, the formation of the nuclei is due to such foreign particles and not the
large temperature driving force, as described above. Lastly, secondary nucleation is also suggested as a
potential mechanism inside the freezer barrel, even though no detailed experiment or study has been
conducted to prove the contribution of such mechanism. According to secondary nucleation theory, the
initially-formed crystals collide with nearby crystals or the agitator, which leads to the generation of new
nuclei through contact.
After the initial freezing step, when the ice cream mix leaves the freezer at approximately -5°C
to -6°C for packaging, about half of the water in the solution is frozen (Berger, 1990; Arbuckle, 1986).
During the next step, hardening, there is no new crystal formed but only the growth of the existing ice
crystals. Often the hardening temperature remains low, about -18°C, in order to lower the crystal
growth rate. The mean crystal size at this step is reported to be approximately 45 to 50 µm, increasing
Figure 5. Schematic of a scrap-surface freezer (Hartel, 1996).
10
slightly from the mean crystal size during initial freezing, 30 – 35 µm (Berger, 1990; Donhowe, Hartel, &
Bradley, 1991). Even though the hardening temperature remains low, the glass transition temperature
of ice cream is generally lower. Therefore, the amount of frozen water at this stage is still only 75 to
80%. Further development of ice crystals in the ice cream solution in the next stage, storage and
distribution, is discussed below in the recrystallization section. Because of the complicated mechanism
of crystallization and its strong effect on the final texture of ice cream, it is essential to control the
nucleation and growth rate of ice crystals that are depicted in Figure 3 from Hartel (1996) research.
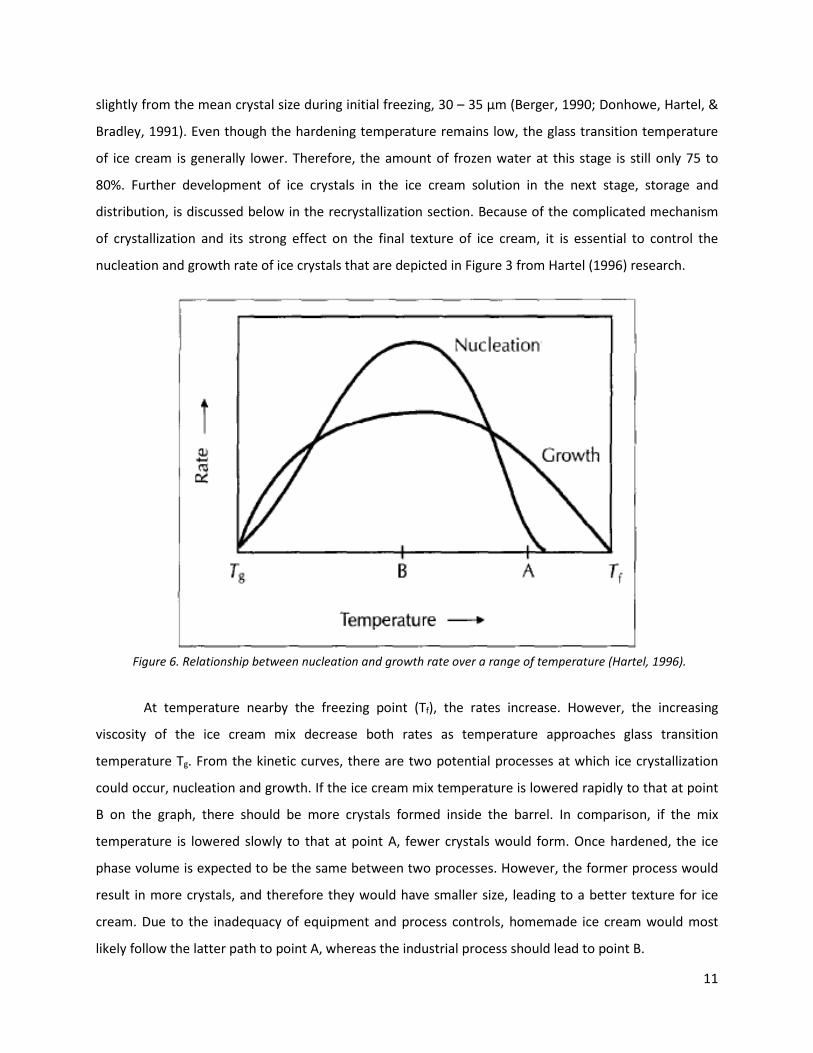
At temperature nearby the freezing point (Tf), the rates increase. However, the increasing
viscosity of the ice cream mix decrease both rates as temperature approaches glass transition
temperature Tg. From the kinetic curves, there are two potential processes at which ice crystallization
could occur, nucleation and growth. If the ice cream mix temperature is lowered rapidly to that at point
B on the graph, there should be more crystals formed inside the barrel. In comparison, if the mix
temperature is lowered slowly to that at point A, fewer crystals would form. Once hardened, the ice
phase volume is expected to be the same between two processes. However, the former process would
result in more crystals, and therefore they would have smaller size, leading to a better texture for ice
cream. Due to the inadequacy of equipment and process controls, homemade ice cream would most
likely follow the latter path to point A, whereas the industrial process should lead to point B.
Figure 6. Relationship between nucleation and growth rate over a range of temperature (Hartel, 1996).
11
Formulation and process conditions are the two most significant factors that affect ice
crystallization. As mentioned in the earlier section of ice cream structure, water content or total solids in
the ice cream plays a significant role in the final ice crystal size. The lower the amount of water in the
mix, the smaller the ice crystal size would be. Sweetener concentration has the opposite relationship
with ice crystal size: a higher concentration of sweetener is preferred, since it alters the freezing point
depression and the glass transition temperature of the ice cream (Hartel, 1996). Similar with sweetener,
a higher amount of MSNF would result in a decrease in averaged ice crystal size. Emulsifiers have little
effect on ice crystals, whereas stabilizers play a major role in the retardation of ice crystal growth rates.
As stabilizers increase the viscosity of the ice cream mix, the diffusion rate of ice crystals in the solution
is lowered. Among all the potential process conditions that affect ice crystallization process, the draw
temperature of the ice cream freezer is the most important. As a measure of the amount of heat
removal, the draw temperature is different for each freezer type. It is also dependent on various factors
including ammonia temperature, overall heat transfer coefficient between ice cream and ammonia, and
the throughput rate (Hartel, 1996). Therefore, it is essential for the industry to have proper control of
the ice cream initial freezing step, since it has tremendous effects on the quality of the final product.
3.3.2 RECRYSTALLIZATION KINETICS
During storage and distribution, ice crystal size increases due to recrystallization phenomenon
and thus gives ice cream a coarsening texture. Therefore, it is important to minimize the ice crystal size
in order to increase ice cream shelf life. There are many factors that would result in a larger crystal size
including low solids, low freezing point, high draw temperature, slow hardening, inadequate stabilizer,
etc., among which the group has chosen to focus on the use of stabilizers to minimize the rate of
recrystallization (Goff & Hartel, 2013).
The average threshold size of ice crystals has been reported to be from 20 to 55 µm depending
on the ice cream formulation and storage conditions, above which the sensory gland can pick up the
coarse and grainy texture of ice cream. More important than the average crystal size is the uniform
distribution of many small crystals, since it helps minimize the influence of thermal shock from
fluctuating storage temperature and enhance shelf-life (Hagiwara & Hartel, 1995).
12
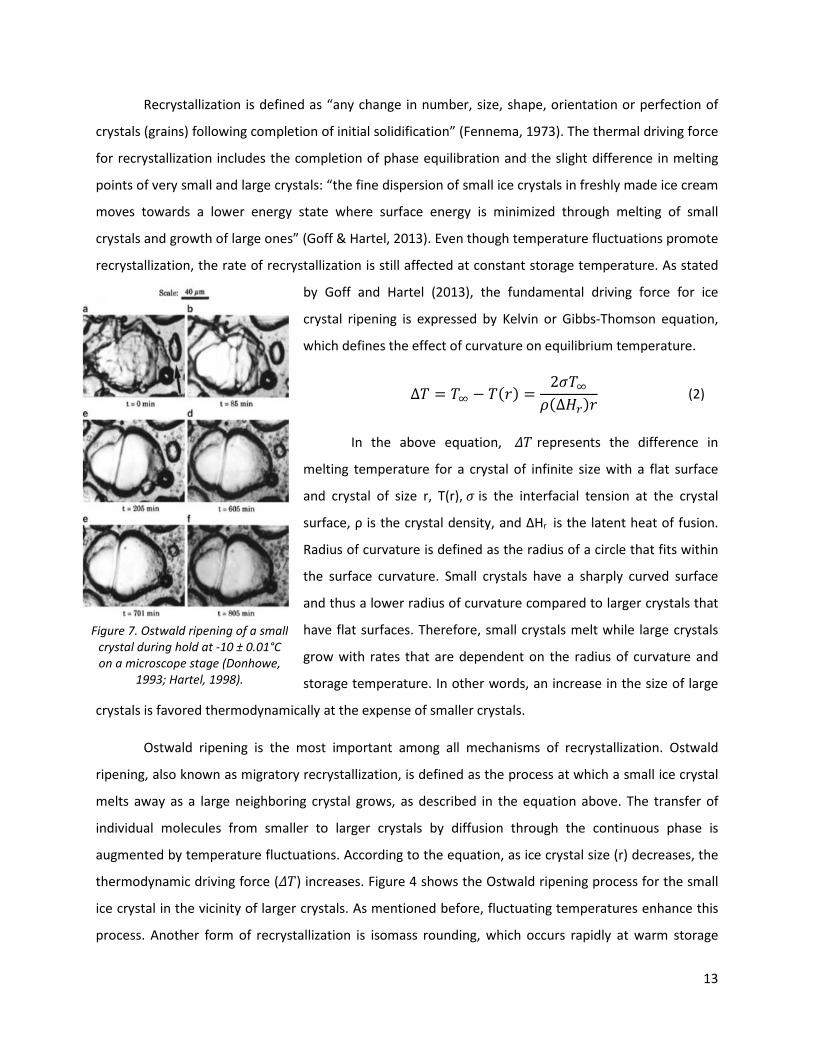
Recrystallization is defined as “any change in number, size, shape, orientation or perfection of
crystals (grains) following completion of initial solidification” (Fennema, 1973). The thermal driving force
for recrystallization includes the completion of phase equilibration and the slight difference in melting
points of very small and large crystals: “the fine dispersion of small ice crystals in freshly made ice cream
moves towards a lower energy state where surface energy is minimized through melting of small
crystals and growth of large ones” (Goff & Hartel, 2013). Even though temperature fluctuations promote
recrystallization, the rate of recrystallization is still affected at constant storage temperature. As stated
by Goff and Hartel (2013), the fundamental driving force for ice
crystal ripening is expressed by Kelvin or Gibbs-Thomson equation,
which defines the effect of curvature on equilibrium temperature.
∆𝑇𝑇 = 𝑇𝑇∞ − 𝑇𝑇(𝑟𝑟) =2𝜎𝜎𝑇𝑇∞
𝜌𝜌(∆𝐻𝐻𝑟𝑟)𝑟𝑟
In the above equation, 𝛥𝛥𝑇𝑇 represents the difference in
melting temperature for a crystal of infinite size with a flat surface
and crystal of size r, T(r), 𝜎𝜎 is the interfacial tension at the crystal
surface, ρ is the crystal density, and ΔHr is the latent heat of fusion.
Radius of curvature is defined as the radius of a circle that fits within
the surface curvature. Small crystals have a sharply curved surface
and thus a lower radius of curvature compared to larger crystals that
have flat surfaces. Therefore, small crystals melt while large crystals
grow with rates that are dependent on the radius of curvature and
storage temperature. In other words, an increase in the size of large
crystals is favored thermodynamically at the expense of smaller crystals.
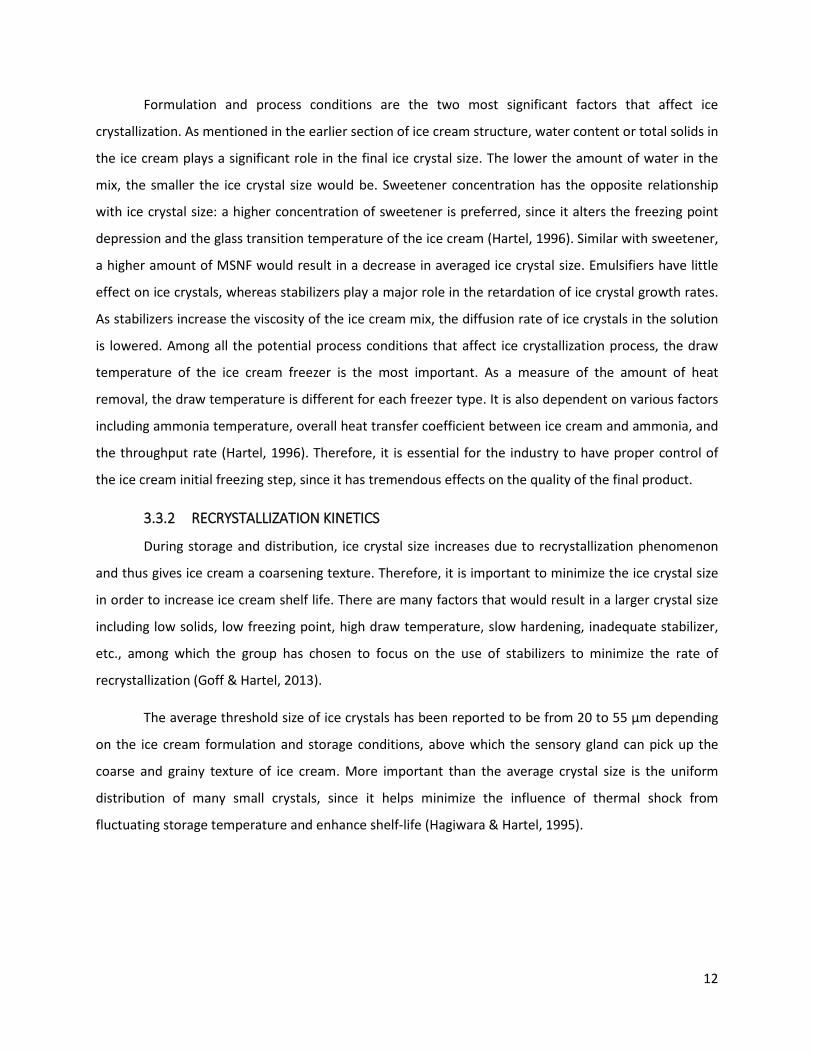
Ostwald ripening is the most important among all mechanisms of recrystallization. Ostwald
ripening, also known as migratory recrystallization, is defined as the process at which a small ice crystal
melts away as a large neighboring crystal grows, as described in the equation above. The transfer of
individual molecules from smaller to larger crystals by diffusion through the continuous phase is
augmented by temperature fluctuations. According to the equation, as ice crystal size (r) decreases, the
thermodynamic driving force (𝛥𝛥𝑇𝑇) increases. Figure 4 shows the Ostwald ripening process for the small
ice crystal in the vicinity of larger crystals. As mentioned before, fluctuating temperatures enhance this
process. Another form of recrystallization is isomass rounding, which occurs rapidly at warm storage
Figure 7. Ostwald ripening of a small crystal during hold at -10 ± 0.01°C on a microscope stage (Donhowe,
1993; Hartel, 1998).
(2)
13
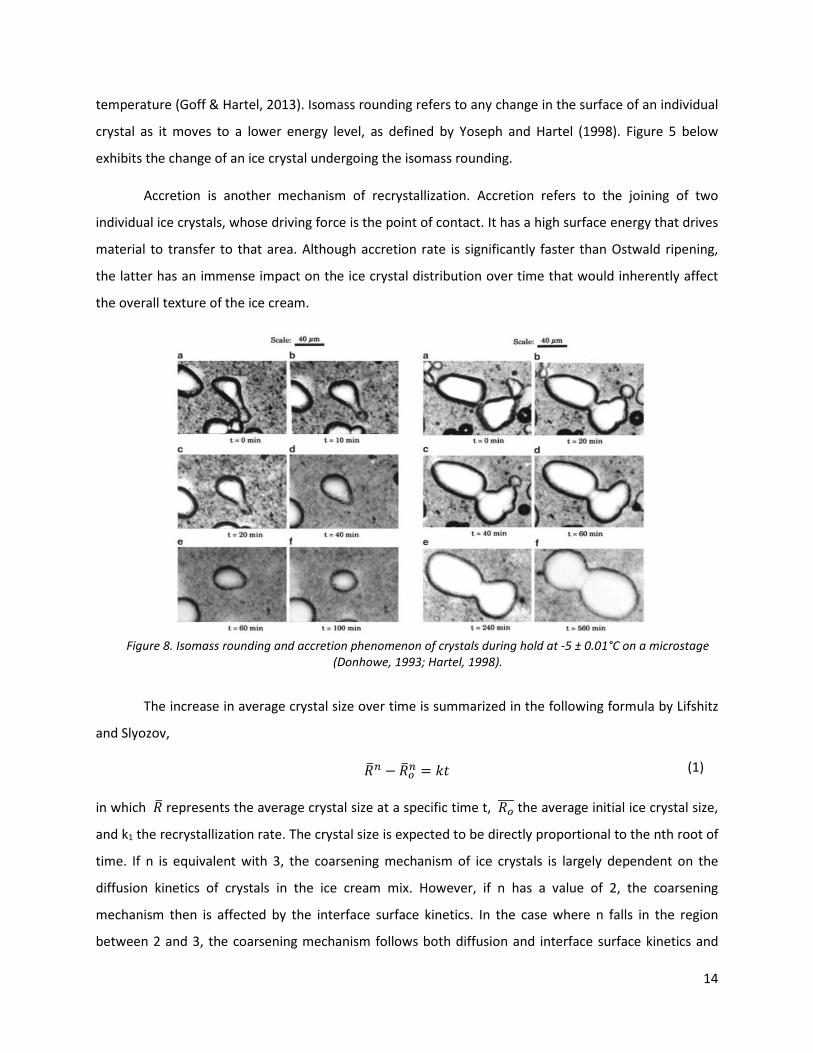
temperature (Goff & Hartel, 2013). Isomass rounding refers to any change in the surface of an individual
crystal as it moves to a lower energy level, as defined by Yoseph and Hartel (1998). Figure 5 below
exhibits the change of an ice crystal undergoing the isomass rounding.
Accretion is another mechanism of recrystallization. Accretion refers to the joining of two
individual ice crystals, whose driving force is the point of contact. It has a high surface energy that drives
material to transfer to that area. Although accretion rate is significantly faster than Ostwald ripening,
the latter has an immense impact on the ice crystal distribution over time that would inherently affect
the overall texture of the ice cream.
The increase in average crystal size over time is summarized in the following formula by Lifshitz
and Slyozov,
𝑅𝑅�𝑛𝑛 − 𝑅𝑅�𝑜𝑜𝑛𝑛 = 𝑘𝑘𝑡𝑡
in which 𝑅𝑅� represents the average crystal size at a specific time t, 𝑅𝑅𝑜𝑜���� the average initial ice crystal size,
and k1 the recrystallization rate. The crystal size is expected to be directly proportional to the nth root of
time. If n is equivalent with 3, the coarsening mechanism of ice crystals is largely dependent on the
diffusion kinetics of crystals in the ice cream mix. However, if n has a value of 2, the coarsening
mechanism then is affected by the interface surface kinetics. In the case where n falls in the region
between 2 and 3, the coarsening mechanism follows both diffusion and interface surface kinetics and
Figure 8. Isomass rounding and accretion phenomenon of crystals during hold at -5 ± 0.01°C on a microstage (Donhowe, 1993; Hartel, 1998).
(1)
14
therefore is mix controlled. Rarely if n value is outside of the region 2 to 3, the kinetics of the ice cream
mix would then depend on a different factor that would require further investigation to figure out.
Martino and Zaritzky (1987) offer a mechanism known as melt-refreeze recrystallization. As the
temperature increases during the melting process, large crystals start decreasing in size while small
crystals may melt completely as in isomass rounding. When the temperature decreases, no new crystals
would form since nucleation only occurs during the initial freezing stage of ice cream. While the driving
force for recrystallization is slower at this time, the crystals continue growing to larger sizes. Overall, the
larger crystals continue to grow and merge as smaller crystals melt and disappear. During ice cream
distribution and many melt-refreeze cycles at home refrigerators, the ice cream undergoes temperature
changes that result in an overall increase in ice crystal size and a decrease in the total number of
crystals.
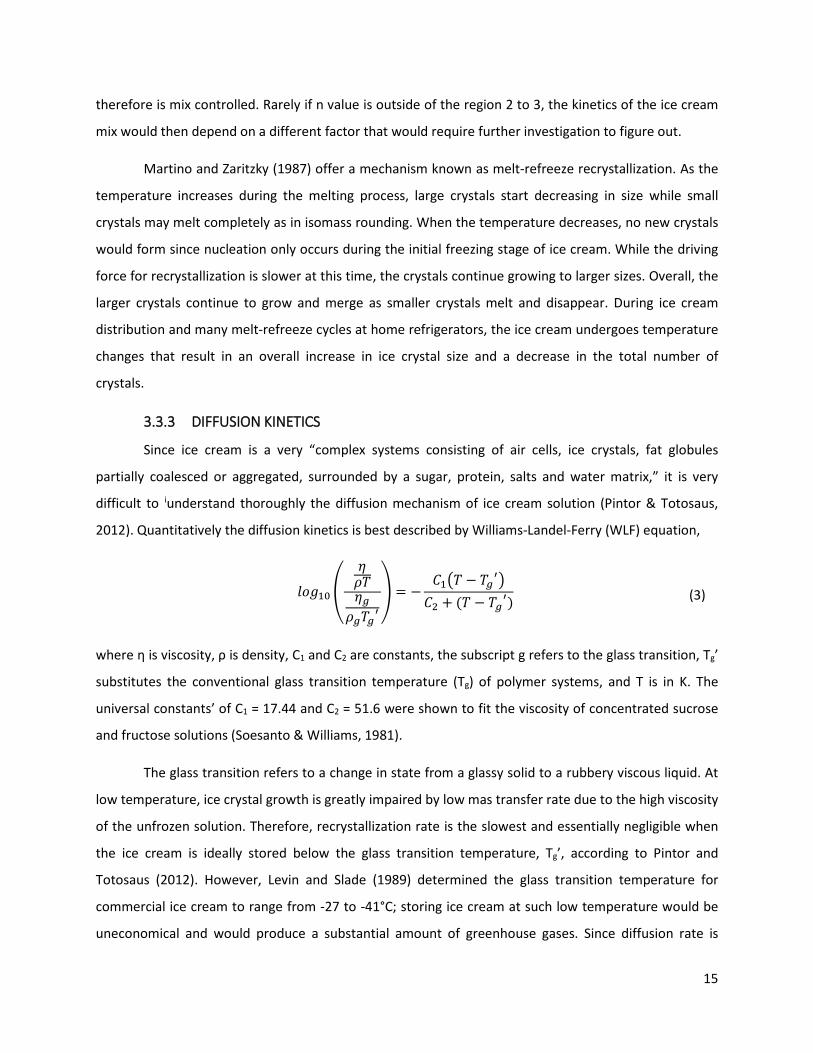
3.3.3 DIFFUSION KINETICS
Since ice cream is a very “complex systems consisting of air cells, ice crystals, fat globules
partially coalesced or aggregated, surrounded by a sugar, protein, salts and water matrix,” it is very
difficult to iunderstand thoroughly the diffusion mechanism of ice cream solution (Pintor & Totosaus,
2012). Quantitatively the diffusion kinetics is best described by Williams-Landel-Ferry (WLF) equation,
𝑙𝑙𝑙𝑙𝑙𝑙10 �
𝜂𝜂𝜌𝜌𝑇𝑇𝜂𝜂𝑔𝑔𝜌𝜌𝑔𝑔𝑇𝑇𝑔𝑔′
� = −𝐶𝐶1�𝑇𝑇 − 𝑇𝑇𝑔𝑔′�𝐶𝐶2 + (𝑇𝑇 − 𝑇𝑇𝑔𝑔
′)
where η is viscosity, ρ is density, C1 and C2 are constants, the subscript g refers to the glass transition, Tg’
substitutes the conventional glass transition temperature (Tg) of polymer systems, and T is in K. The
universal constants’ of C1 = 17.44 and C2 = 51.6 were shown to fit the viscosity of concentrated sucrose
and fructose solutions (Soesanto & Williams, 1981).
The glass transition refers to a change in state from a glassy solid to a rubbery viscous liquid. At
low temperature, ice crystal growth is greatly impaired by low mas transfer rate due to the high viscosity
of the unfrozen solution. Therefore, recrystallization rate is the slowest and essentially negligible when
the ice cream is ideally stored below the glass transition temperature, Tg’, according to Pintor and
Totosaus (2012). However, Levin and Slade (1989) determined the glass transition temperature for
commercial ice cream to range from -27 to -41°C; storing ice cream at such low temperature would be
uneconomical and would produce a substantial amount of greenhouse gases. Since diffusion rate is
(3)
15
inversely proportional to the viscosity, it is important to formulate a sufficiently viscous ice cream mix
solution with the aid of stabilizers. As seen in the above equation, the rate of diffusion increases rapidly
with increases in temperature or concentration of water. Hence, Ostwald ripening mechanism would
happen more quickly with lower solids in the ice cream mix and higher storage temperature.
Furthermore, the glass transition temperature decreases with the inverse of the weight-average
molecular weight of the solution, which means an increase in water content of the ice cream mix would
result in a depression effect for Tg’. In other words, there is a greater decrease in viscosity as
temperature increases than predicted in WLF equation.
3.4 EFFECTS AND DEFECTS OF STABILIZERS ON ICE CREAM
Stabilizers are one of the most important factors that influence the texture of ice cream despite
the low concentration in the formulation. One of its significant effects is to reduce or retard the
coarsening rate in ice cream. Stabilizers are also known as colloids, hydrocolloids and gums. These
materials are macromolecules, mostly polysaccharides, and they are capable of interacting with water.
Stabilizers used in ice cream must have a clean, neutral flavor that does not impart off ice cream
flavors. The type and amount of stabilizer in ice cream depend on its properties, mix composition and
ingredients used, as well as processing times, temperature, and pressure. Storage time and temperature
are also considered when choosing stabilizer. 0.1-0.5% is usually used in the ice cream mix
(Bahramparvar & Tehrani, 2011).
Using stabilizers in ice cream produces smoothness in body and texture, retards or reduces ice
and lactose crystal growth during storage, provides uniformity to the product, and increases in viscosity
of ice cream mix, slows down moisture migration from the product to the package on the air and
prevents shrinkage of the product volume during storage.
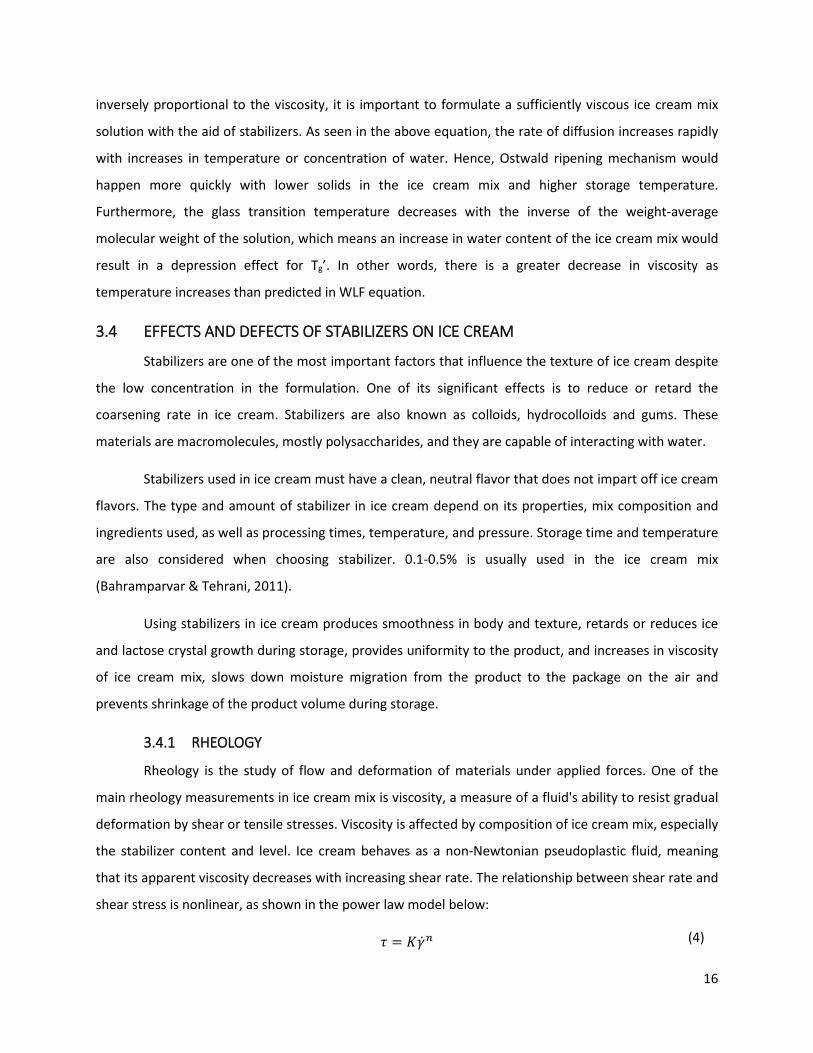
3.4.1 RHEOLOGY
Rheology is the study of flow and deformation of materials under applied forces. One of the
main rheology measurements in ice cream mix is viscosity, a measure of a fluid's ability to resist gradual
deformation by shear or tensile stresses. Viscosity is affected by composition of ice cream mix, especially
the stabilizer content and level. Ice cream behaves as a non-Newtonian pseudoplastic fluid, meaning
that its apparent viscosity decreases with increasing shear rate. The relationship between shear rate and
shear stress is nonlinear, as shown in the power law model below:
𝜏𝜏 = 𝐾𝐾�̇�𝛾𝑛𝑛 (4)
16
where 𝜏𝜏 the shear stress (Pa), K is is the consistency index (Pa.sn), �̇�𝛾 is the shear rate (s-1) and n is the
flow behavior index. The values of K and n define the flow characteristics of fluid foods such as ice
cream. The smaller the n value, the greater ice cream departs from Newtonian behavior, leading to
greater pseudoplasticity. As shown in previous studies, the pseudoplasticity increases (n value
decreases) as the concentration increases and as the temperature decreases. According to
Bahramparvar and Tehrani (2011), the consistency index, a measure of the viscous nature of food,
increases with stabilizer concentration. As a results, ice cream with more stabilizer bind the mobility and
diffusion rate of ice crystals, leading to a smaller number of large crystals in ice cream.
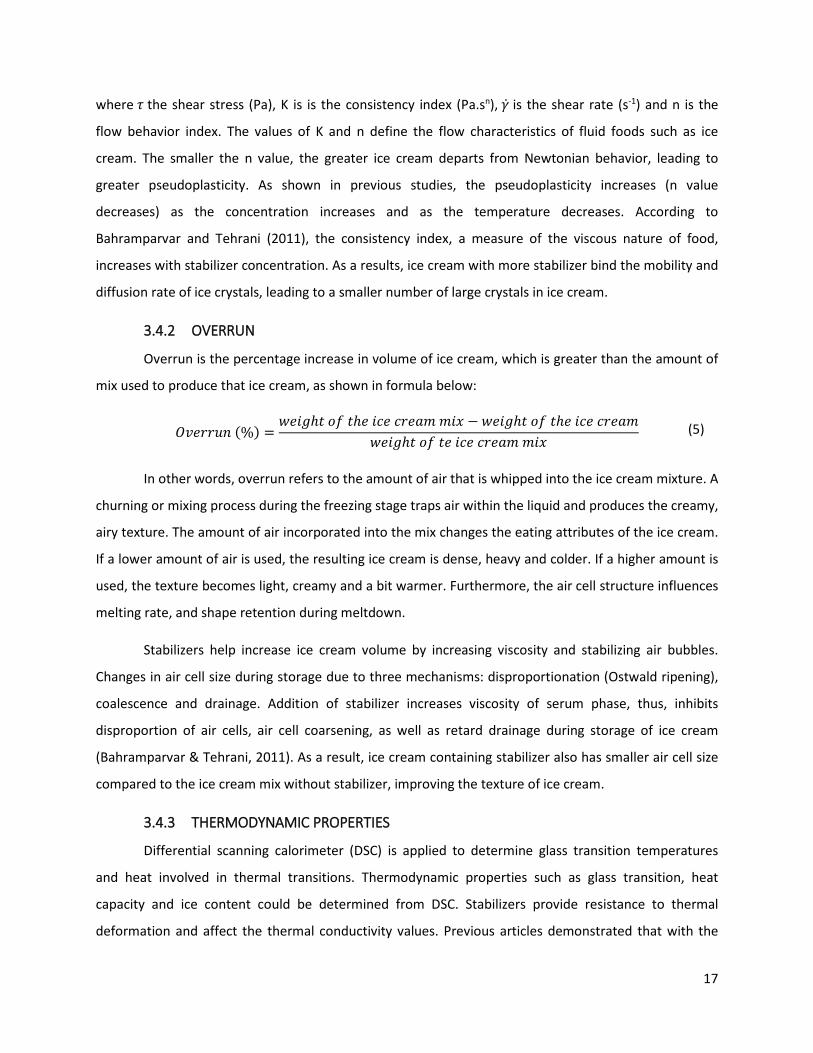
3.4.2 OVERRUN
Overrun is the percentage increase in volume of ice cream, which is greater than the amount of
mix used to produce that ice cream, as shown in formula below:
𝑂𝑂𝑂𝑂𝑂𝑂𝑟𝑟𝑟𝑟𝑂𝑂𝑂𝑂 (%) =𝑤𝑤𝑂𝑂𝑤𝑤𝑙𝑙ℎ𝑡𝑡 𝑙𝑙𝑜𝑜 𝑡𝑡ℎ𝑂𝑂 𝑤𝑤𝑖𝑖𝑂𝑂 𝑖𝑖𝑟𝑟𝑂𝑂𝑐𝑐𝑐𝑐 𝑐𝑐𝑤𝑤𝑚𝑚 − 𝑤𝑤𝑂𝑂𝑤𝑤𝑙𝑙ℎ𝑡𝑡 𝑙𝑙𝑜𝑜 𝑡𝑡ℎ𝑂𝑂 𝑤𝑤𝑖𝑖𝑂𝑂 𝑖𝑖𝑟𝑟𝑂𝑂𝑐𝑐𝑐𝑐
𝑤𝑤𝑂𝑂𝑤𝑤𝑙𝑙ℎ𝑡𝑡 𝑙𝑙𝑜𝑜 𝑡𝑡𝑂𝑂 𝑤𝑤𝑖𝑖𝑂𝑂 𝑖𝑖𝑟𝑟𝑂𝑂𝑐𝑐𝑐𝑐 𝑐𝑐𝑤𝑤𝑚𝑚
In other words, overrun refers to the amount of air that is whipped into the ice cream mixture. A
churning or mixing process during the freezing stage traps air within the liquid and produces the creamy,
airy texture. The amount of air incorporated into the mix changes the eating attributes of the ice cream.
If a lower amount of air is used, the resulting ice cream is dense, heavy and colder. If a higher amount is
used, the texture becomes light, creamy and a bit warmer. Furthermore, the air cell structure influences
melting rate, and shape retention during meltdown.
Stabilizers help increase ice cream volume by increasing viscosity and stabilizing air bubbles.
Changes in air cell size during storage due to three mechanisms: disproportionation (Ostwald ripening),
coalescence and drainage. Addition of stabilizer increases viscosity of serum phase, thus, inhibits
disproportion of air cells, air cell coarsening, as well as retard drainage during storage of ice cream
(Bahramparvar & Tehrani, 2011). As a result, ice cream containing stabilizer also has smaller air cell size
compared to the ice cream mix without stabilizer, improving the texture of ice cream.
3.4.3 THERMODYNAMIC PROPERTIES
Differential scanning calorimeter (DSC) is applied to determine glass transition temperatures
and heat involved in thermal transitions. Thermodynamic properties such as glass transition, heat
capacity and ice content could be determined from DSC. Stabilizers provide resistance to thermal
deformation and affect the thermal conductivity values. Previous articles demonstrated that with the
(5)
17
increasing concentration of stabilizer, heat of fusion decreases due to the water binding ability of
stabilizer (Bahramparvar & Tehrani, 2011).
3.4.4 CRYOPROTECTION
Even though stabilizers have no effects on the initial ice crystal size distribution in ice cream
when it was first taken out from the scraped surface heat exchanger or the initial ice growth during
freezing and hardening, they reduce the growth rate of ice crystals during recrystallization through three
mechanisms: viscosity and molecular mobility, cryo-gel formation and hydrocolloid phase separation.
Addition of stabilizers in ice cream mix increases viscosity through controlling ice crystals
growth. However, the definitive correlation between viscosity and recrystallization of the mix has not
been found. Budiaman and Fennema (1987) stated that for any given stabilizer, the linear rate of water
crystallization decreases with increasing viscosity. However, each stabilizer has a different rate, so
viscosity is not a good predictor of the capacity of a stabilizer in inhibiting crystallization. In other words,
mix viscosity does not correlate well with stabilizer effects. At the same level of viscosity, different
stabilizers are unequally effective for retarding ice crystal growth. However, at least some aspects of
stabilizer functionality with respect to recrystallization protection come from the increased
viscoelasticity that results from freeze-concentration of the polysaccharide in the unfrozen phase of ice
cream. It is perhaps due to hyper-entanglements and solution structure formation. This concept was
related to the rate at which water can diffuse to the surface of a growing crystal during temperature
fluctuation or the rate at which solutes and macromolecules can diffuse away from the surface of a
growing ice crystal. Thus, studying the relationship between water mobility in freeze-concentrated
matrix and recrystallization rate is suggested in order to gain better understanding the mechanism of
stabilizer in controlling the ice recrystallization.
The capacity to form cryo-gels of stabilizers as a result of heat shock during storage is the
second mechanism of stabilizer action. The cryo-gel structure restricts the diffusion of water and solutes
within their network, along with holding free water as water of hydration around the polysaccharide
structure. The higher the self-diffusion coefficients of water in the freeze-concentrated matrix of sugar
solution, the higher the recrystallization rate. A gel-like network also hinders the water mobility of the
system, resulting in preservation of ice crystal size and in a small span of ice crystal size distribution.
Nevertheless, this is not the only mechanism of stabilizer action since some stabilizers that do not form
a gel-like network are still effective in retarding the ice crystal growth (Bahramparvar & Tehrani, 2011).
18
Last but not least, the incompatibility of stabilizers with milk proteins in the ice cream mix is also an
important factor in reducing the ice cream recrystallization.
3.4.5 MELTING RATE
Desirable qualities of ice cream include a slow melting rate, good shape retention and slower
foam collapse. As the ice cream melts, heat from the warm air surrounding the product transfers into
the ice cream to melt the ice crystals. Initially the ice at the exterior of the ice cream melts and a local
cooling effect occurs. The water from the melting ice must diffuse into the viscous unfrozen serum
phase, and this diluted solution then flows downwards (due to gravity) through the structural elements
(destabilized fat globules, air cells, and remaining ice crystals) to drip. Fat destabilization, ice crystal size,
and consistency coefficient of ice cream mix were found to affect the melting rate of ice cream. One
function of stabilizers in ice cream is to increase the melting resistance, as described in numerous
studies. Hydrocolloids, due to their water-holding and microviscosity enhancement ability, significantly
affect melting quality of ice cream. Moreover, it seems that the influence of stabilizers on thermal
properties of ice cream such as thermal conductivity, melting onset, and heat of fusion could affect the
melting rate (Muse & Hartel, 2004).
3.4.6 MIXTURE OF STABILIZERS
Various substances have been used as stabilizers. Each of them has its own characteristics and
optimal percentage in ice cream mix. Some common commercial stabilizers utilized in ice cream are guar
gum (GG), sodium carboxyl methyl cellulose (CMC), locust bean gum (LBG), xanthan and so on. Besides,
local hydrocolloids have also been used as ice cream stabilizers. For instance, salep serves as stabilizers
in traditional ice cream in Iran and Turkey at 0.78-1% level (Kaya & Tekin, 2001). Water-soluble gums
obtained from the seeds of achi, which is commonly found in Nigeria, was also studied and compared
with commercial stabilizers (Uzomah & Ahligwo, 1999). Other local gums have also been examined.
Since each stabilizer has its own characteristics and limitations, individual stabilizers are usually
mixed to improve the overall effectiveness in ice cream mix. According to Guven and Kacar (2003), using
multiple stabilizer ingredients reduced the cost of stabilizer system and led to better results than using
solely one stabilizer. Adapa showed that guar gum and locust bean gum are considered to be the most
widely used stabilizers to inhibit ice cream recrystallization. Hence in this project, a mixture of GG and
LBG was used. Obtained from the seeds of guar- a tropical legume, GG effectively decreases the
unwanted effects of heat shock in ice cream. It disperses well and does not cause excessive viscosity in
the mix. GG is considered to be a strong stabilizer since it only requires 0.1-0.2% in ice cream mix. LBG is
19
extracted from the beans of the tree Ceratonia siliqua. LBG is only partially soluble in cold water, so it
must be heated above 85°C in order to be dissolved in the ice cream mix. LBG does not bind to ice cream
flavor and forms a cryo-gel, which is effective in cryo protection. LBC creates a uniform medium and
reproduces viscosity that is not destroyed by agitation. It also cools uniformly and easily incorporates air
into the mix. Additionally, LBG effectively thwarts the effect of heat shock. Therefore, it is also
considered a strong stabilizer with only 0.1-0.2% needed in the mix. Furthermore, LBG was proved to be
more effective than GG in retarding ice cream recrystallization. Ice cream mix having the highest LBG to
GG ratio has the highest thermal conductivities. Ice cream mix with more LBG also freezes faster
because the relatively lower amount of bound water makes them less viscous compared to ice creams
containing GG. Thus, the ratio of LBG to GG was chosen to be 75:25 for this project. Moreover, none of
the previous literatures articles has used various technique such as microscope, rheometer, viscometer
and DSC to thorough study the effects of this combination in ice crystal coarsening. Therefore, the
combination of LBG and GG was chosen for this project.
3.4.7 DEFECTS CAUSED BY STABILIZERS
Even though stabilizers are effective in retarding ice cream recrystallization, excessive use of
stabilizers may lead to undesirable melting characteristics, excessive viscosity of the ice cream mix and
contributes to a heavy, soggy texture. Moreover, stabilizers can also impart off the ice cream flavor since
they can be oxidized if not kept in a dry and cool environment. The most important defect is excessive
stabilizers reduce amount of air incorporated into ice cream mix, leading to lower overrun. Thus, excess
of stabilizers in ice cream mix can reduce the quality of the products.
20
4.0 MATERIALS AND METHODS
4.1 SORBET AND ICE CREAM PREPARATION
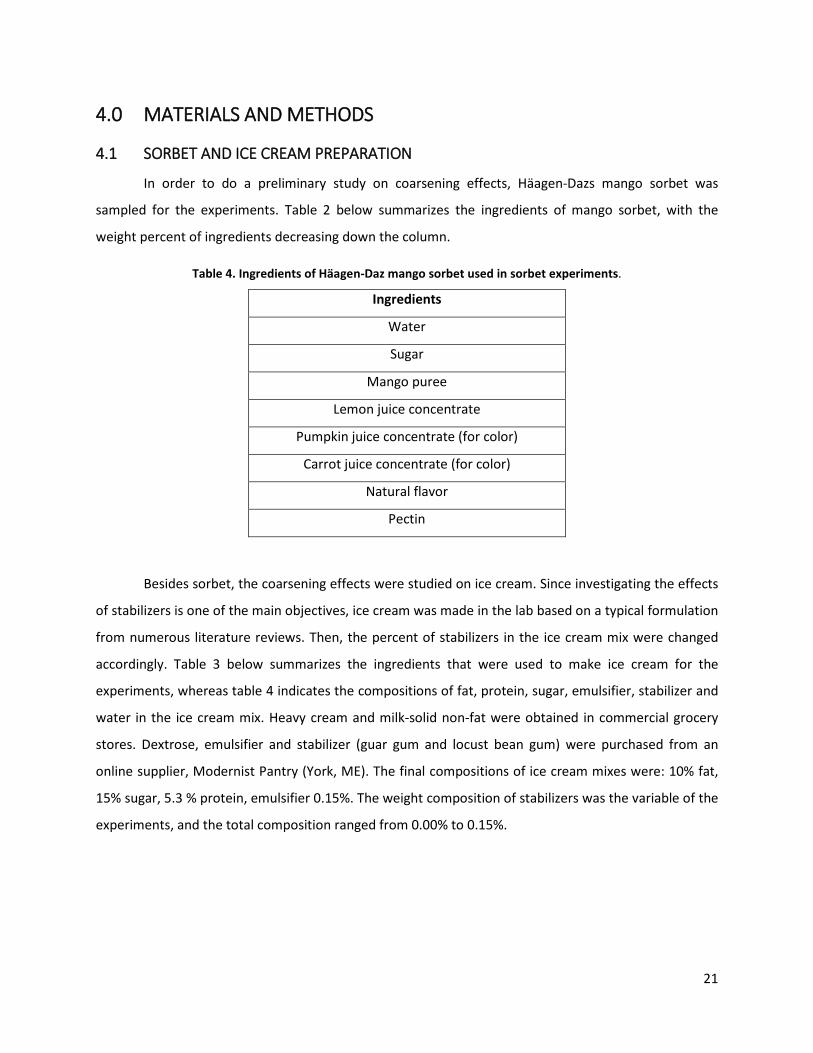
In order to do a preliminary study on coarsening effects, Häagen-Dazs mango sorbet was
sampled for the experiments. Table 2 below summarizes the ingredients of mango sorbet, with the
weight percent of ingredients decreasing down the column.
Table 4. Ingredients of Häagen-Daz mango sorbet used in sorbet experiments.
Ingredients
Water
Sugar
Mango puree
Lemon juice concentrate
Pumpkin juice concentrate (for color)
Carrot juice concentrate (for color)
Natural flavor
Pectin
Besides sorbet, the coarsening effects were studied on ice cream. Since investigating the effects
of stabilizers is one of the main objectives, ice cream was made in the lab based on a typical formulation
from numerous literature reviews. Then, the percent of stabilizers in the ice cream mix were changed
accordingly. Table 3 below summarizes the ingredients that were used to make ice cream for the
experiments, whereas table 4 indicates the compositions of fat, protein, sugar, emulsifier, stabilizer and
water in the ice cream mix. Heavy cream and milk-solid non-fat were obtained in commercial grocery
stores. Dextrose, emulsifier and stabilizer (guar gum and locust bean gum) were purchased from an
online supplier, Modernist Pantry (York, ME). The final compositions of ice cream mixes were: 10% fat,
15% sugar, 5.3 % protein, emulsifier 0.15%. The weight composition of stabilizers was the variable of the
experiments, and the total composition ranged from 0.00% to 0.15%.
21
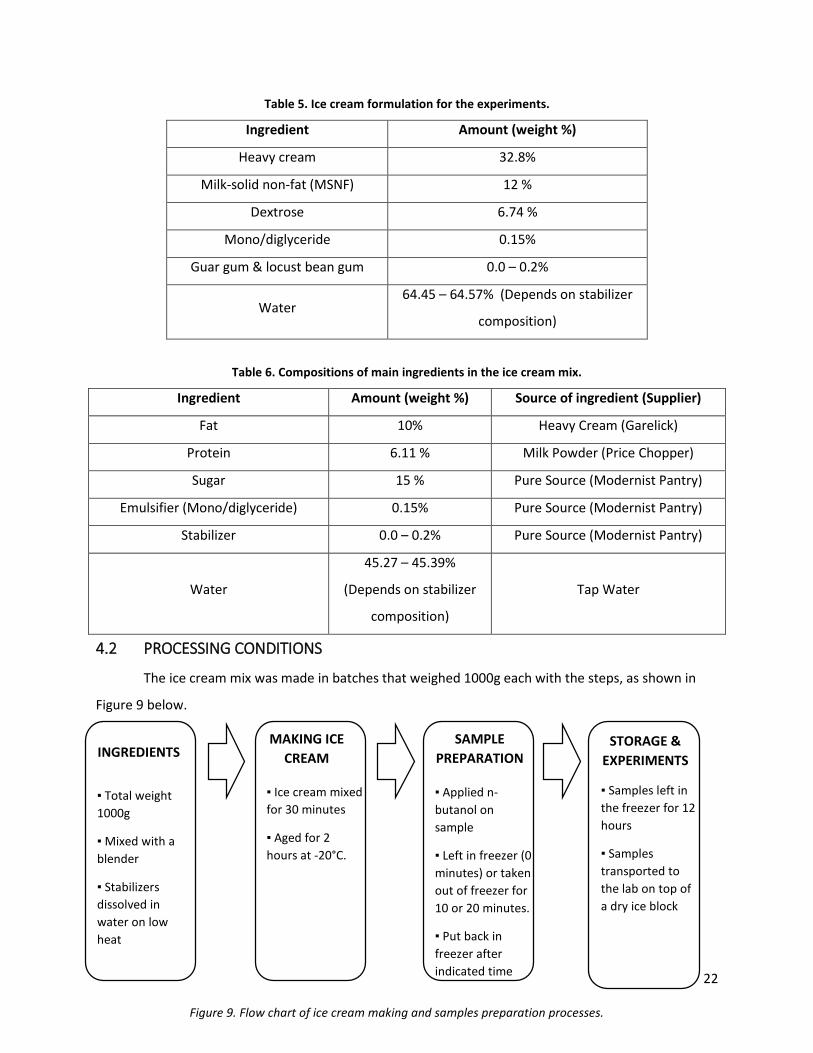
Table 5. Ice cream formulation for the experiments.
Ingredient Amount (weight %)
Heavy cream 32.8%
Milk-solid non-fat (MSNF) 12 %
Dextrose 6.74 %
Mono/diglyceride 0.15%
Guar gum & locust bean gum 0.0 – 0.2%
Water 64.45 – 64.57% (Depends on stabilizer
composition)
Table 6. Compositions of main ingredients in the ice cream mix.
Ingredient Amount (weight %) Source of ingredient (Supplier)
Fat 10% Heavy Cream (Garelick)
Protein 6.11 % Milk Powder (Price Chopper)
Sugar 15 % Pure Source (Modernist Pantry)
Emulsifier (Mono/diglyceride) 0.15% Pure Source (Modernist Pantry)
Stabilizer 0.0 – 0.2% Pure Source (Modernist Pantry)
Water
45.27 – 45.39%
(Depends on stabilizer
composition)
Tap Water
4.2 PROCESSING CONDITIONS
The ice cream mix was made in batches that weighed 1000g each with the steps, as shown in
Figure 9 below.
▪ Total weight 1000g
▪ Mixed with a blender
▪ Stabilizers dissolved in water on low heat
▪ Ice cream mixed for 30 minutes
▪ Aged for 2 hours at -20°C.
▪ Applied n-butanol on sample
▪ Left in freezer (0 minutes) or taken out of freezer for 10 or 20 minutes.
▪ Put back in freezer after indicated time
STORAGE & EXPERIMENTS
SAMPLE PREPARATION INGREDIENTS
MAKING ICE CREAM
▪ Samples left in the freezer for 12 hours
▪ Samples transported to the lab on top of a dry ice block
Figure 9. Flow chart of ice cream making and samples preparation processes.
22
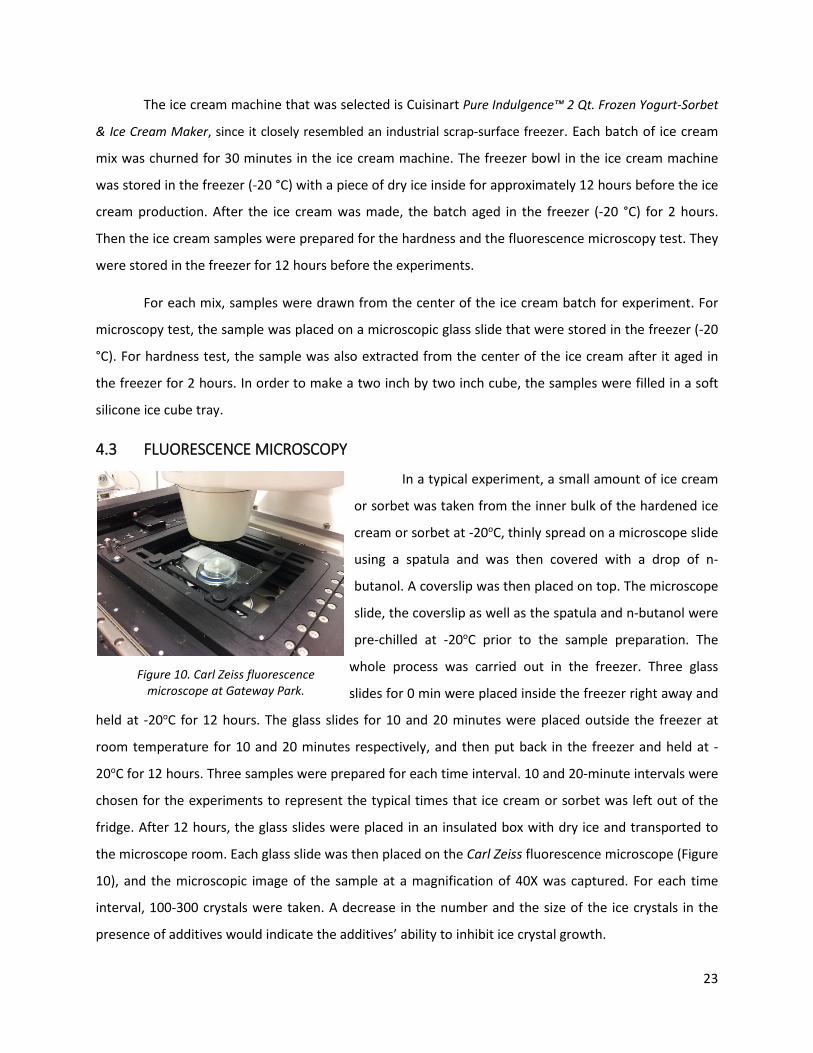
Figure 10. Carl Zeiss fluorescence microscope at Gateway Park.
The ice cream machine that was selected is Cuisinart Pure Indulgence™ 2 Qt. Frozen Yogurt-Sorbet
& Ice Cream Maker, since it closely resembled an industrial scrap-surface freezer. Each batch of ice cream
mix was churned for 30 minutes in the ice cream machine. The freezer bowl in the ice cream machine
was stored in the freezer (-20 °C) with a piece of dry ice inside for approximately 12 hours before the ice
cream production. After the ice cream was made, the batch aged in the freezer (-20 °C) for 2 hours.
Then the ice cream samples were prepared for the hardness and the fluorescence microscopy test. They
were stored in the freezer for 12 hours before the experiments.
For each mix, samples were drawn from the center of the ice cream batch for experiment. For
microscopy test, the sample was placed on a microscopic glass slide that were stored in the freezer (-20
°C). For hardness test, the sample was also extracted from the center of the ice cream after it aged in
the freezer for 2 hours. In order to make a two inch by two inch cube, the samples were filled in a soft
silicone ice cube tray.
4.3 FLUORESCENCE MICROSCOPY
In a typical experiment, a small amount of ice cream
or sorbet was taken from the inner bulk of the hardened ice
cream or sorbet at -20oC, thinly spread on a microscope slide
using a spatula and was then covered with a drop of n-
butanol. A coverslip was then placed on top. The microscope
slide, the coverslip as well as the spatula and n-butanol were
pre-chilled at -20oC prior to the sample preparation. The
whole process was carried out in the freezer. Three glass
slides for 0 min were placed inside the freezer right away and
held at -20oC for 12 hours. The glass slides for 10 and 20 minutes were placed outside the freezer at
room temperature for 10 and 20 minutes respectively, and then put back in the freezer and held at -
20oC for 12 hours. Three samples were prepared for each time interval. 10 and 20-minute intervals were
chosen for the experiments to represent the typical times that ice cream or sorbet was left out of the
fridge. After 12 hours, the glass slides were placed in an insulated box with dry ice and transported to
the microscope room. Each glass slide was then placed on the Carl Zeiss fluorescence microscope (Figure
10), and the microscopic image of the sample at a magnification of 40X was captured. For each time
interval, 100-300 crystals were taken. A decrease in the number and the size of the ice crystals in the
presence of additives would indicate the additives’ ability to inhibit ice crystal growth.
23
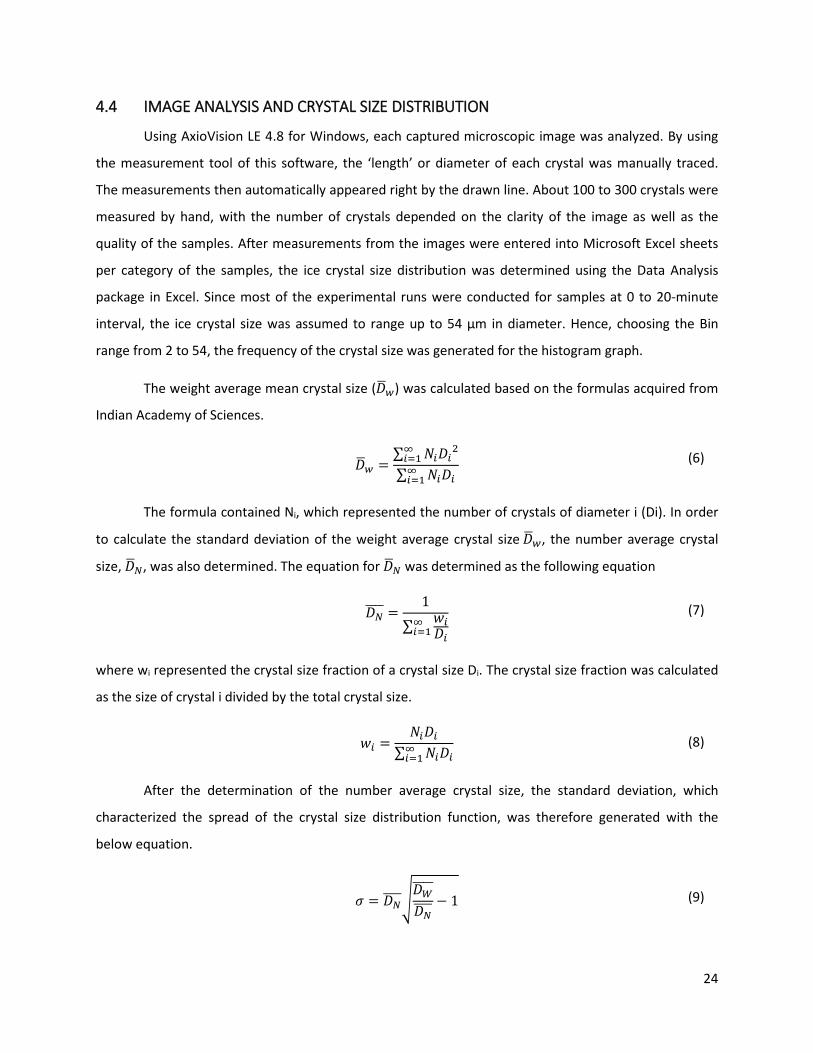
4.4 IMAGE ANALYSIS AND CRYSTAL SIZE DISTRIBUTION
Using AxioVision LE 4.8 for Windows, each captured microscopic image was analyzed. By using
the measurement tool of this software, the ‘length’ or diameter of each crystal was manually traced.
The measurements then automatically appeared right by the drawn line. About 100 to 300 crystals were
measured by hand, with the number of crystals depended on the clarity of the image as well as the
quality of the samples. After measurements from the images were entered into Microsoft Excel sheets
per category of the samples, the ice crystal size distribution was determined using the Data Analysis
package in Excel. Since most of the experimental runs were conducted for samples at 0 to 20-minute
interval, the ice crystal size was assumed to range up to 54 µm in diameter. Hence, choosing the Bin
range from 2 to 54, the frequency of the crystal size was generated for the histogram graph.
The weight average mean crystal size (𝐷𝐷�𝑤𝑤) was calculated based on the formulas acquired from
Indian Academy of Sciences.
𝐷𝐷�𝑤𝑤 =∑ 𝑁𝑁𝑖𝑖𝐷𝐷𝑖𝑖2∞𝑖𝑖=1∑ 𝑁𝑁𝑖𝑖𝐷𝐷𝑖𝑖∞𝑖𝑖=1
The formula contained Ni, which represented the number of crystals of diameter i (Di). In order
to calculate the standard deviation of the weight average crystal size 𝐷𝐷�𝑤𝑤, the number average crystal
size, 𝐷𝐷�𝑁𝑁, was also determined. The equation for 𝐷𝐷�𝑁𝑁 was determined as the following equation
𝐷𝐷𝑁𝑁���� =1
∑ 𝑤𝑤𝑖𝑖𝐷𝐷𝑖𝑖
∞𝑖𝑖=1
where wi represented the crystal size fraction of a crystal size Di. The crystal size fraction was calculated
as the size of crystal i divided by the total crystal size.
𝑤𝑤𝑖𝑖 =𝑁𝑁𝑖𝑖𝐷𝐷𝑖𝑖
∑ 𝑁𝑁𝑖𝑖𝐷𝐷𝑖𝑖∞𝑖𝑖=1
After the determination of the number average crystal size, the standard deviation, which
characterized the spread of the crystal size distribution function, was therefore generated with the
below equation.
𝜎𝜎 = 𝐷𝐷𝑁𝑁�����𝐷𝐷𝑊𝑊����𝐷𝐷𝑁𝑁����
− 1
(6)
(7)
(8)
(9)
24
Figure 11. Hardness test set up in Washburn food engineering laboratory.
4.5 HARDNESS MEASUREMENT
Hardness, as a physical properties of ice cream or
sorbet, measures the resistance of the sample to
deformation when an external force is applied. Additionally,
hardness is an indirect measure of the ice crystal size in both
sorbet and ice cream. Therefore, the hardness measurement
was conducted to confirm the coarsening in ice cream and
sorbet over time observed in the microscopy experiment.
Hence, the experiment was designed to compare the
change of the hardness of both sorbet and ice cream over
time by measuring the applied force to penetrate the sample
cube. The samples were left out of the fridge for different
time periods: 0 to 20 minutes with a 10-minute increment. At
a constant strain rate of 0.00166 meters per second, an
aluminum rod with a diameter of 6 mm was used to
penetrate the sample cube until a depth of 2.54 cm was reached. The sample cube was 5.08 cm by 5.08
cm. For each time interval, three samples were tested. Then, a graph of force versus time of ice cream
was generated per sample per time interval. The deformation of the sample was calculated for each
data point following the below equation.
𝐷𝐷𝑂𝑂𝑜𝑜𝑙𝑙𝑟𝑟𝑐𝑐𝑐𝑐𝑡𝑡𝑤𝑤𝑙𝑙𝑂𝑂 (𝑐𝑐𝑐𝑐) = 𝑇𝑇𝑤𝑤𝑐𝑐𝑂𝑂 𝑂𝑂𝑙𝑙𝑐𝑐𝑒𝑒𝑒𝑒𝑂𝑂𝑒𝑒 ∗ 0.00166𝑐𝑐𝑒𝑒∗ 1000
𝑐𝑐𝑐𝑐𝑐𝑐
After that, the force was graphed as a function of deformation, as shown in the following figure
(Figure 12). The peak force here is the hardness, representing the mouth feel or the texture of ice cream
or sorbet. Wilbey et al. (1998) found the relationship between the ice content and the hardness: as the
amount of large ice crystals increases, similarly hardness of the sample would go up. Furthermore, Muse
and Hartel (2004) also found the same trend between the crystal size and hardness. So it was expected
that at longer time interval, the hardness would increase.
(10)
25
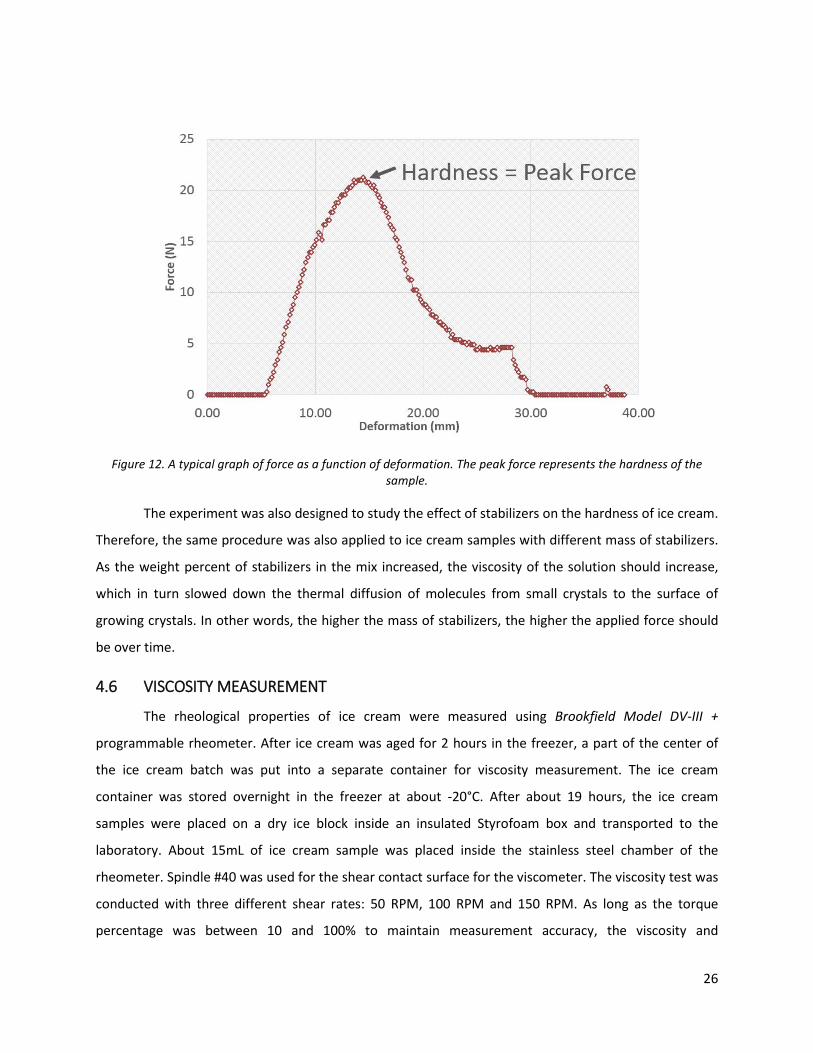
Figure 12. A typical graph of force as a function of deformation. The peak force represents the hardness of the sample.
The experiment was also designed to study the effect of stabilizers on the hardness of ice cream.
Therefore, the same procedure was also applied to ice cream samples with different mass of stabilizers.
As the weight percent of stabilizers in the mix increased, the viscosity of the solution should increase,
which in turn slowed down the thermal diffusion of molecules from small crystals to the surface of
growing crystals. In other words, the higher the mass of stabilizers, the higher the applied force should
be over time.
4.6 VISCOSITY MEASUREMENT
The rheological properties of ice cream were measured using Brookfield Model DV-III +
programmable rheometer. After ice cream was aged for 2 hours in the freezer, a part of the center of
the ice cream batch was put into a separate container for viscosity measurement. The ice cream
container was stored overnight in the freezer at about -20°C. After about 19 hours, the ice cream
samples were placed on a dry ice block inside an insulated Styrofoam box and transported to the
laboratory. About 15mL of ice cream sample was placed inside the stainless steel chamber of the
rheometer. Spindle #40 was used for the shear contact surface for the viscometer. The viscosity test was
conducted with three different shear rates: 50 RPM, 100 RPM and 150 RPM. As long as the torque
percentage was between 10 and 100% to maintain measurement accuracy, the viscosity and
26
temperature of the sample were recorded after 10 seconds. Three samples per shear rate were used for
each ice cream batch. The same procedures were repeated for ice cream mix with different
concentrations of stabilizers. After the recorded measurements, Power Law model was applied in order
to determine the flow behavior index (n) and the consistency index (K).
𝜏𝜏 = 𝐾𝐾�̇�𝛾𝑛𝑛
𝜂𝜂�̇�𝛾 = 𝐾𝐾�̇�𝛾𝑛𝑛
𝜂𝜂 = 𝐾𝐾�̇�𝛾𝑛𝑛−1
ln(𝜂𝜂) = (𝑂𝑂 − 1) ln(𝐾𝐾) + (𝑂𝑂 − 1) ln(�̇�𝛾)
In order to find n and K values, a log-log graph was generated per ice cream batch for shear rate
(�̇�𝛾) versus viscosity (𝜂𝜂). The slope of the graph was then equivalent to (n-1) and the intercept of the
graph was the value of (n-1)*lnK. Consequently, the values for n and K were compared among different
ice cream mixes.
4.7 DIFFERENTIAL SCANNING CALORIMETRY MEASUREMENT
Differential scanning calorimetry (DSC) was used to measure thermal properties of ice cream in
order to further understand the effects of stabilizers. Nitrogen gas was continuously flushed through the
cell to eliminate problems associated with water condensation. Besides, some regular checking runs
were also performed with pure water to check the calorimeter calibration. The DSC was calibrated with
indium and mercury standards. Melted ice cream samples in the range of 10mg to 30mg was placed in
aluminum pans and precisely weighted. The aluminum pans were then placed in the DSC and cooled
quickly to -10oC. After that, the samples were heated to 10 oC at a rate of 1 oC/min. An identical empty
aluminum pan, used as a reference, was exposed to the same temperature rate increase of 1oC/min for
all the experimental runs with frozen samples. All the measurements were carried out by using
temperature increase to avoid nucleation and the supercooling problems. Then, these experimental
data were analyzed in order to derive the enthalpy values according to the temperature changes. The
heat of fusion, which is the amount of energy required to change a gram of a substance from the solid to
the liquid state without changing its temperature, was determined by measuring the area of the melting
peak. The crystallinity, the percent of crystals in ice cream, was calculated using the following equation.
𝐶𝐶𝑟𝑟𝐶𝐶𝑒𝑒𝑡𝑡𝑐𝑐𝑙𝑙𝑙𝑙𝑤𝑤𝑂𝑂𝑤𝑤𝑡𝑡𝐶𝐶 =�𝑀𝑀𝑂𝑂𝑐𝑐𝑒𝑒𝑂𝑂𝑟𝑟𝑂𝑂𝑒𝑒 ℎ𝑂𝑂𝑐𝑐𝑡𝑡 𝑙𝑙𝑜𝑜 𝑜𝑜𝑂𝑂𝑒𝑒𝑤𝑤𝑙𝑙𝑂𝑂 𝑙𝑙𝑜𝑜 𝑤𝑤𝑖𝑖𝑂𝑂 𝑖𝑖𝑟𝑟𝑂𝑂𝑐𝑐𝑐𝑐
𝑜𝑜𝑟𝑟𝑐𝑐𝑖𝑖𝑡𝑡𝑤𝑤𝑙𝑙𝑂𝑂 𝑙𝑙𝑜𝑜 𝑤𝑤𝑐𝑐𝑡𝑡𝑂𝑂𝑟𝑟 𝑤𝑤𝑂𝑂 𝑤𝑤𝑖𝑖𝑂𝑂 𝑖𝑖𝑟𝑟𝑂𝑂𝑐𝑐𝑐𝑐 �
𝐻𝐻𝑂𝑂𝑐𝑐𝑡𝑡 𝑙𝑙𝑜𝑜 𝑜𝑜𝑂𝑂𝑒𝑒𝑤𝑤𝑙𝑙𝑂𝑂 𝑙𝑙𝑜𝑜 𝑒𝑒𝑂𝑂𝑟𝑟𝑂𝑂 𝑤𝑤𝑐𝑐𝑡𝑡𝑂𝑂𝑟𝑟∗ 100%
(11)
(12)
27
These experiment procedures and calculations were conducted for ice cream with and without
stabilizer. Three samples were tested for each ice cream mix with different amount of stabilizers. The
data was then analyzed and compared to study the effect of stabilizer on crystal size and coarsening
process.
28
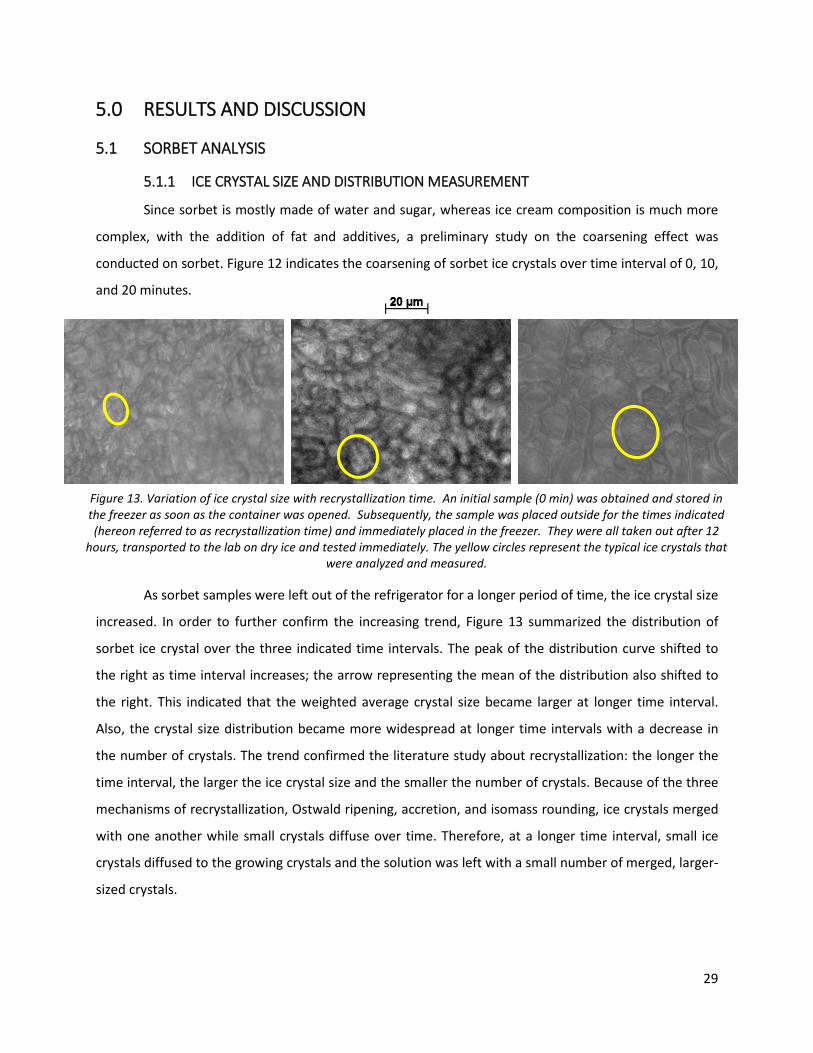
5.0 RESULTS AND DISCUSSION
5.1 SORBET ANALYSIS
5.1.1 ICE CRYSTAL SIZE AND DISTRIBUTION MEASUREMENT
Since sorbet is mostly made of water and sugar, whereas ice cream composition is much more
complex, with the addition of fat and additives, a preliminary study on the coarsening effect was
conducted on sorbet. Figure 12 indicates the coarsening of sorbet ice crystals over time interval of 0, 10,
and 20 minutes.
As sorbet samples were left out of the refrigerator for a longer period of time, the ice crystal size
increased. In order to further confirm the increasing trend, Figure 13 summarized the distribution of
sorbet ice crystal over the three indicated time intervals. The peak of the distribution curve shifted to
the right as time interval increases; the arrow representing the mean of the distribution also shifted to
the right. This indicated that the weighted average crystal size became larger at longer time interval.
Also, the crystal size distribution became more widespread at longer time intervals with a decrease in
the number of crystals. The trend confirmed the literature study about recrystallization: the longer the
time interval, the larger the ice crystal size and the smaller the number of crystals. Because of the three
mechanisms of recrystallization, Ostwald ripening, accretion, and isomass rounding, ice crystals merged
with one another while small crystals diffuse over time. Therefore, at a longer time interval, small ice
crystals diffused to the growing crystals and the solution was left with a small number of merged, larger-
sized crystals.
10 min 20 min 0 min Figure 13. Variation of ice crystal size with recrystallization time. An initial sample (0 min) was obtained and stored in the freezer as soon as the container was opened. Subsequently, the sample was placed outside for the times indicated (hereon referred to as recrystallization time) and immediately placed in the freezer. They were all taken out after 12
hours, transported to the lab on dry ice and tested immediately. The yellow circles represent the typical ice crystals that were analyzed and measured.
29
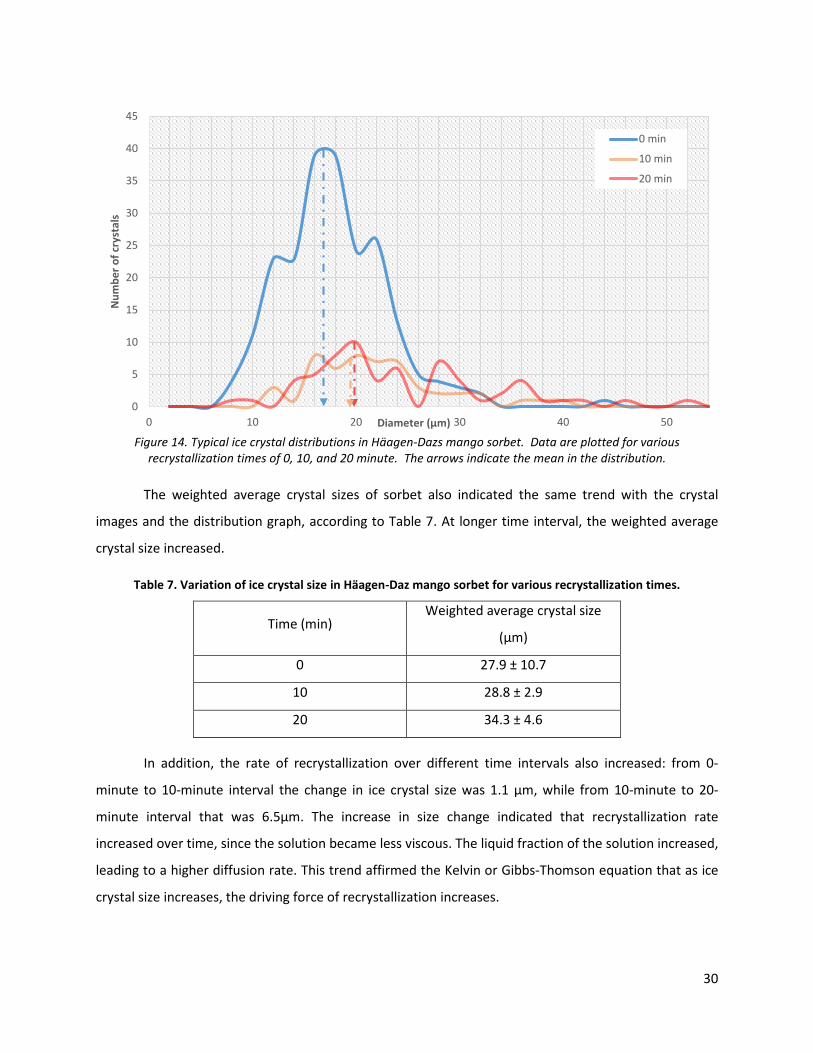
Figure 14. Typical ice crystal distributions in Häagen-Dazs mango sorbet. Data are plotted for various recrystallization times of 0, 10, and 20 minute. The arrows indicate the mean in the distribution.
The weighted average crystal sizes of sorbet also indicated the same trend with the crystal
images and the distribution graph, according to Table 7. At longer time interval, the weighted average
crystal size increased.
Table 7. Variation of ice crystal size in Häagen-Daz mango sorbet for various recrystallization times.
Time (min) Weighted average crystal size
(µm)
0 27.9 ± 10.7
10 28.8 ± 2.9
20 34.3 ± 4.6
In addition, the rate of recrystallization over different time intervals also increased: from 0-
minute to 10-minute interval the change in ice crystal size was 1.1 µm, while from 10-minute to 20-
minute interval that was 6.5µm. The increase in size change indicated that recrystallization rate
increased over time, since the solution became less viscous. The liquid fraction of the solution increased,
leading to a higher diffusion rate. This trend affirmed the Kelvin or Gibbs-Thomson equation that as ice
crystal size increases, the driving force of recrystallization increases.
30
0
5
10
15
20
25
30
35
40
45
0 10 20 30 40 50
Num
ber o
f cry
stal
s
Diameter (µm)
0 min
10 min
20 min
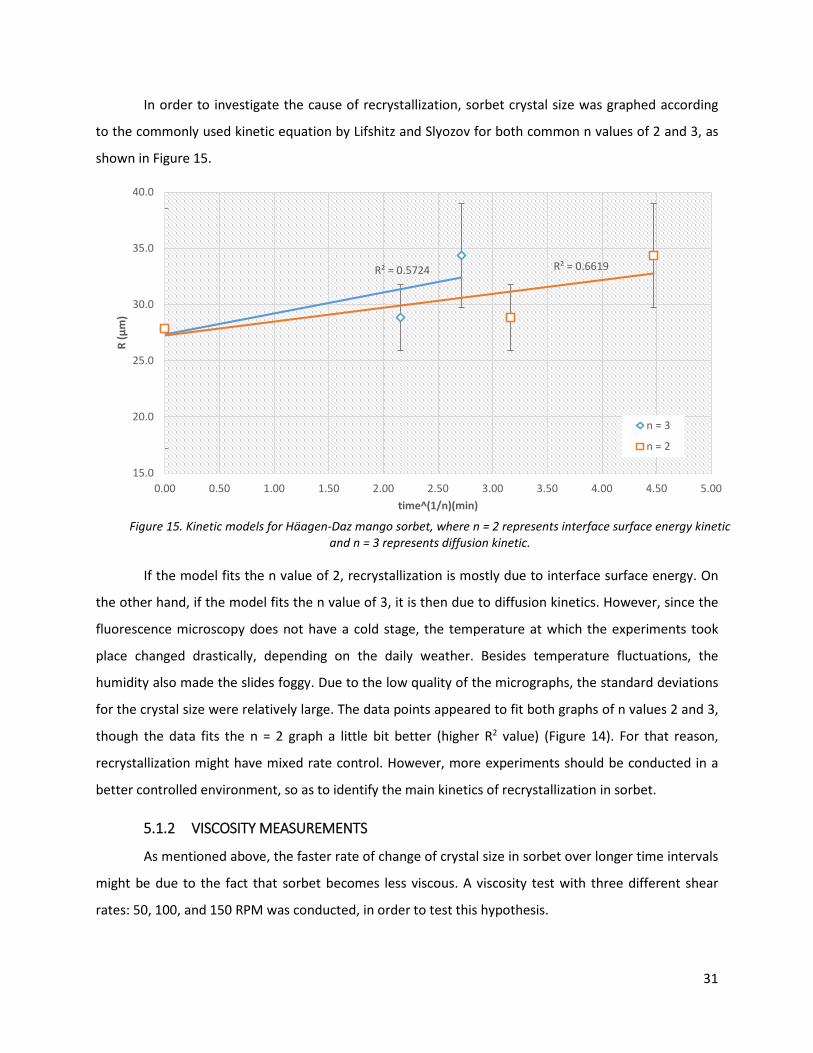
Figure 15. Kinetic models for Häagen-Daz mango sorbet, where n = 2 represents interface surface energy kinetic and n = 3 represents diffusion kinetic.
R² = 0.5724 R² = 0.6619
15.0
20.0
25.0
30.0
35.0
40.0
0.00 0.50 1.00 1.50 2.00 2.50 3.00 3.50 4.00 4.50 5.00
R (µ
m)
time^(1/n)(min)
n = 3
n = 2
In order to investigate the cause of recrystallization, sorbet crystal size was graphed according
to the commonly used kinetic equation by Lifshitz and Slyozov for both common n values of 2 and 3, as
shown in Figure 15.
If the model fits the n value of 2, recrystallization is mostly due to interface surface energy. On
the other hand, if the model fits the n value of 3, it is then due to diffusion kinetics. However, since the
fluorescence microscopy does not have a cold stage, the temperature at which the experiments took
place changed drastically, depending on the daily weather. Besides temperature fluctuations, the
humidity also made the slides foggy. Due to the low quality of the micrographs, the standard deviations
for the crystal size were relatively large. The data points appeared to fit both graphs of n values 2 and 3,
though the data fits the n = 2 graph a little bit better (higher R2 value) (Figure 14). For that reason,
recrystallization might have mixed rate control. However, more experiments should be conducted in a
better controlled environment, so as to identify the main kinetics of recrystallization in sorbet.
5.1.2 VISCOSITY MEASUREMENTS
As mentioned above, the faster rate of change of crystal size in sorbet over longer time intervals
might be due to the fact that sorbet becomes less viscous. A viscosity test with three different shear
rates: 50, 100, and 150 RPM was conducted, in order to test this hypothesis.
31
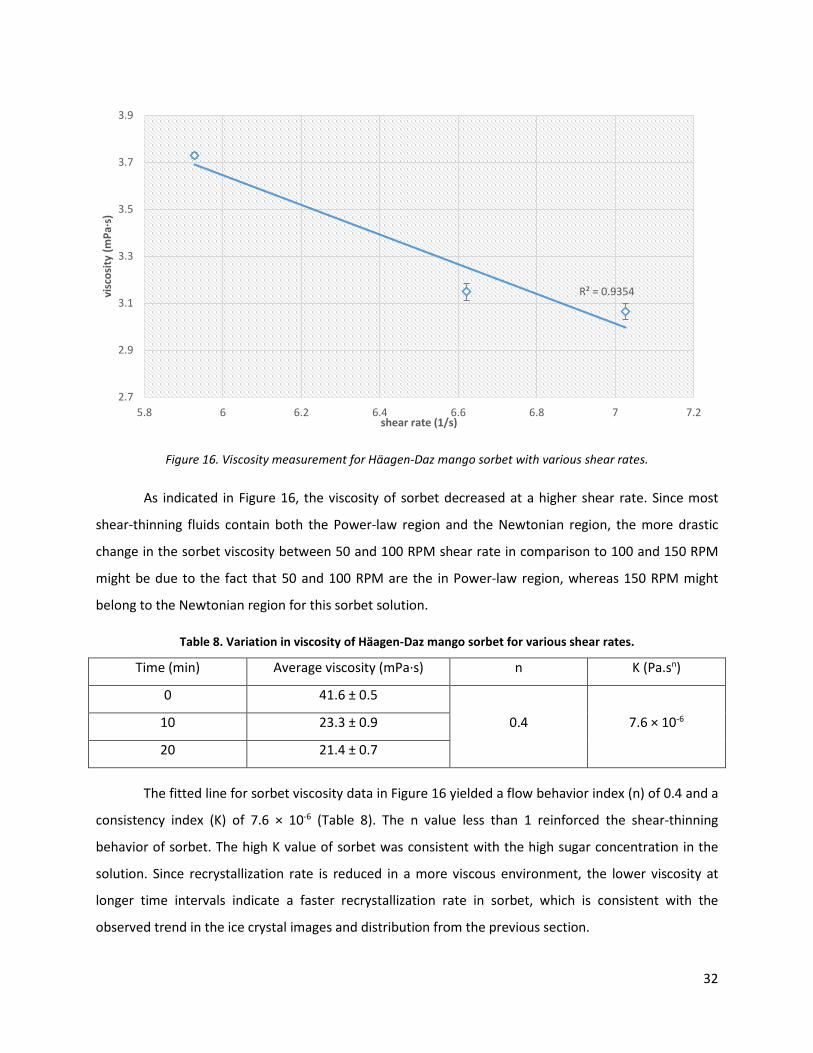
Figure 16. Viscosity measurement for Häagen-Daz mango sorbet with various shear rates.
As indicated in Figure 16, the viscosity of sorbet decreased at a higher shear rate. Since most
shear-thinning fluids contain both the Power-law region and the Newtonian region, the more drastic
change in the sorbet viscosity between 50 and 100 RPM shear rate in comparison to 100 and 150 RPM
might be due to the fact that 50 and 100 RPM are the in Power-law region, whereas 150 RPM might
belong to the Newtonian region for this sorbet solution.
Table 8. Variation in viscosity of Häagen-Daz mango sorbet for various shear rates.
Time (min) Average viscosity (mPa·s) n K (Pa.sn)
0 41.6 ± 0.5
0.4 7.6 × 10⁻⁶ 10 23.3 ± 0.9
20 21.4 ± 0.7
The fitted line for sorbet viscosity data in Figure 16 yielded a flow behavior index (n) of 0.4 and a
consistency index (K) of 7.6 × 10⁻⁶ (Table 8). The n value less than 1 reinforced the shear-thinning
behavior of sorbet. The high K value of sorbet was consistent with the high sugar concentration in the
solution. Since recrystallization rate is reduced in a more viscous environment, the lower viscosity at
longer time intervals indicate a faster recrystallization rate in sorbet, which is consistent with the
observed trend in the ice crystal images and distribution from the previous section.
R² = 0.9354
2.7
2.9
3.1
3.3
3.5
3.7
3.9
5.8 6 6.2 6.4 6.6 6.8 7 7.2
visc
osity
(mPa
∙s)
shear rate (1/s)
32
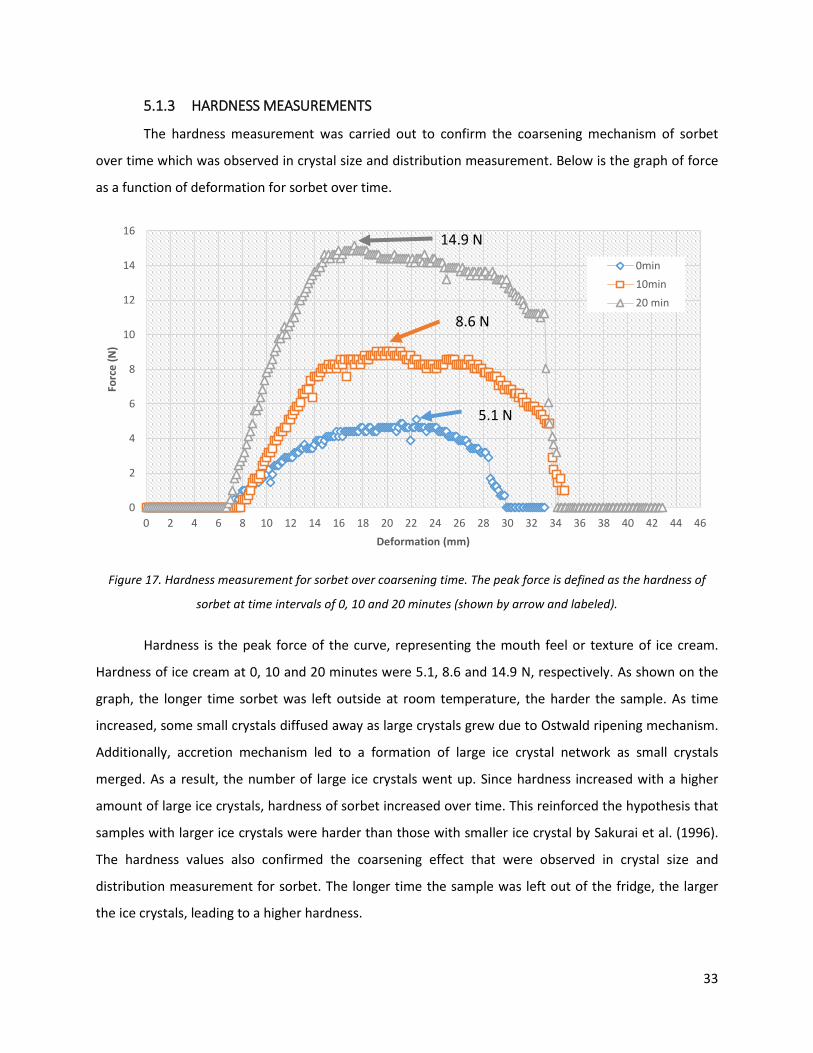
5.1.3 HARDNESS MEASUREMENTS
The hardness measurement was carried out to confirm the coarsening mechanism of sorbet
over time which was observed in crystal size and distribution measurement. Below is the graph of force
as a function of deformation for sorbet over time.
Figure 17. Hardness measurement for sorbet over coarsening time. The peak force is defined as the hardness of
sorbet at time intervals of 0, 10 and 20 minutes (shown by arrow and labeled).
Hardness is the peak force of the curve, representing the mouth feel or texture of ice cream.
Hardness of ice cream at 0, 10 and 20 minutes were 5.1, 8.6 and 14.9 N, respectively. As shown on the
graph, the longer time sorbet was left outside at room temperature, the harder the sample. As time
increased, some small crystals diffused away as large crystals grew due to Ostwald ripening mechanism.
Additionally, accretion mechanism led to a formation of large ice crystal network as small crystals
merged. As a result, the number of large ice crystals went up. Since hardness increased with a higher
amount of large ice crystals, hardness of sorbet increased over time. This reinforced the hypothesis that
samples with larger ice crystals were harder than those with smaller ice crystal by Sakurai et al. (1996).
The hardness values also confirmed the coarsening effect that were observed in crystal size and
distribution measurement for sorbet. The longer time the sample was left out of the fridge, the larger
the ice crystals, leading to a higher hardness.
0
2
4
6
8
10
12
14
16
0 2 4 6 8 10 12 14 16 18 20 22 24 26 28 30 32 34 36 38 40 42 44 46
Forc
e (N
)
Deformation (mm)
0min10min20 min
14.9 N
8.6 N
5.1 N
33
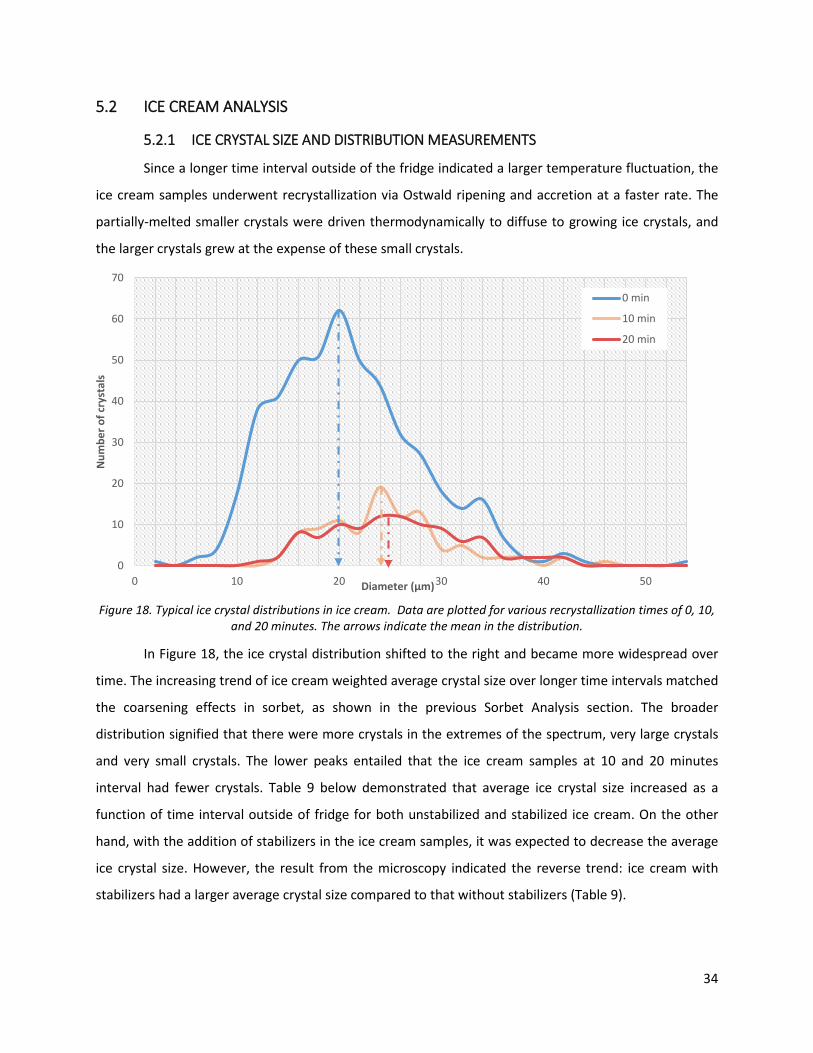
5.2 ICE CREAM ANALYSIS
5.2.1 ICE CRYSTAL SIZE AND DISTRIBUTION MEASUREMENTS
Since a longer time interval outside of the fridge indicated a larger temperature fluctuation, the
ice cream samples underwent recrystallization via Ostwald ripening and accretion at a faster rate. The
partially-melted smaller crystals were driven thermodynamically to diffuse to growing ice crystals, and
the larger crystals grew at the expense of these small crystals.
Figure 18. Typical ice crystal distributions in ice cream. Data are plotted for various recrystallization times of 0, 10, and 20 minutes. The arrows indicate the mean in the distribution.
In Figure 18, the ice crystal distribution shifted to the right and became more widespread over
time. The increasing trend of ice cream weighted average crystal size over longer time intervals matched
the coarsening effects in sorbet, as shown in the previous Sorbet Analysis section. The broader
distribution signified that there were more crystals in the extremes of the spectrum, very large crystals
and very small crystals. The lower peaks entailed that the ice cream samples at 10 and 20 minutes
interval had fewer crystals. Table 9 below demonstrated that average ice crystal size increased as a
function of time interval outside of fridge for both unstabilized and stabilized ice cream. On the other
hand, with the addition of stabilizers in the ice cream samples, it was expected to decrease the average
ice crystal size. However, the result from the microscopy indicated the reverse trend: ice cream with
stabilizers had a larger average crystal size compared to that without stabilizers (Table 9).
34
0
10
20
30
40
50
60
70
0 10 20 30 40 50
Num
ber o
f cry
stal
s
Diameter (µm)
0 min
10 min
20 min
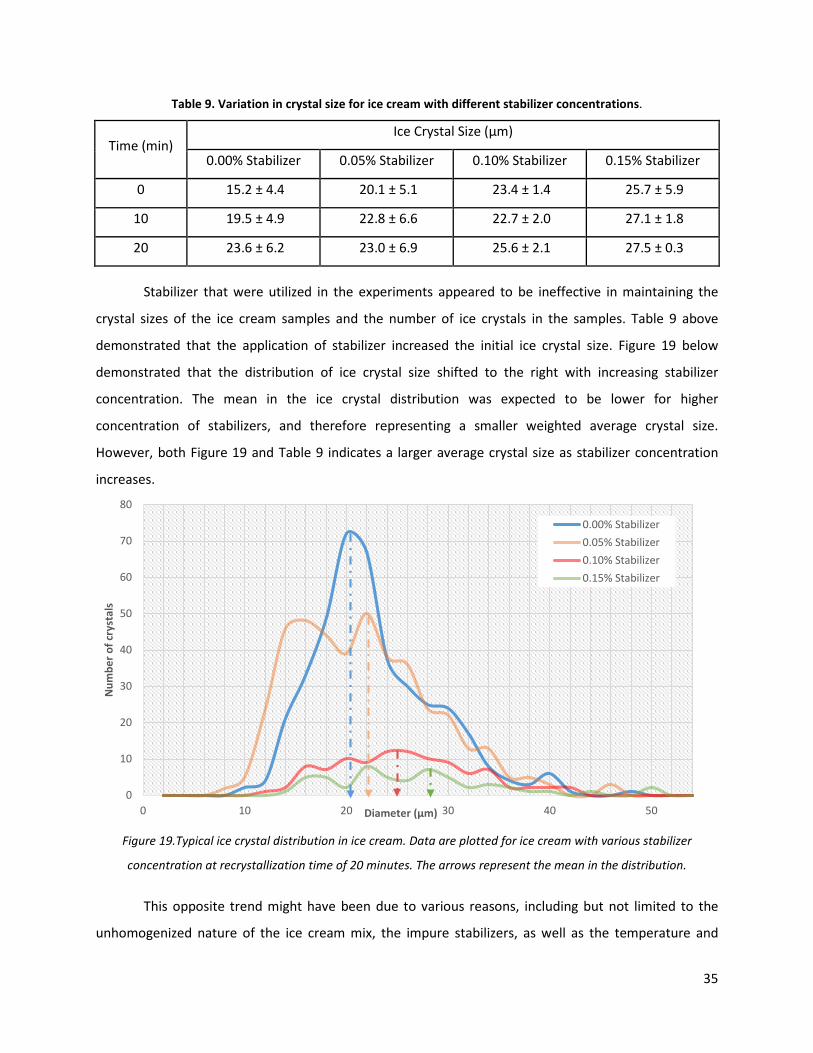
Table 9. Variation in crystal size for ice cream with different stabilizer concentrations.
Time (min) Ice Crystal Size (μm)
0.00% Stabilizer 0.05% Stabilizer 0.10% Stabilizer 0.15% Stabilizer
0 15.2 ± 4.4 20.1 ± 5.1 23.4 ± 1.4 25.7 ± 5.9
10 19.5 ± 4.9 22.8 ± 6.6 22.7 ± 2.0 27.1 ± 1.8
20 23.6 ± 6.2 23.0 ± 6.9 25.6 ± 2.1 27.5 ± 0.3
Stabilizer that were utilized in the experiments appeared to be ineffective in maintaining the
crystal sizes of the ice cream samples and the number of ice crystals in the samples. Table 9 above
demonstrated that the application of stabilizer increased the initial ice crystal size. Figure 19 below
demonstrated that the distribution of ice crystal size shifted to the right with increasing stabilizer
concentration. The mean in the ice crystal distribution was expected to be lower for higher
concentration of stabilizers, and therefore representing a smaller weighted average crystal size.
However, both Figure 19 and Table 9 indicates a larger average crystal size as stabilizer concentration
increases.
Figure 19.Typical ice crystal distribution in ice cream. Data are plotted for ice cream with various stabilizer
concentration at recrystallization time of 20 minutes. The arrows represent the mean in the distribution.
This opposite trend might have been due to various reasons, including but not limited to the
unhomogenized nature of the ice cream mix, the impure stabilizers, as well as the temperature and
35
0
10
20
30
40
50
60
70
80
0 10 20 30 40 50
Num
ber o
f cry
stal
s
Diameter (µm)
0.00% Stabilizer0.05% Stabilizer0.10% Stabilizer0.15% Stabilizer
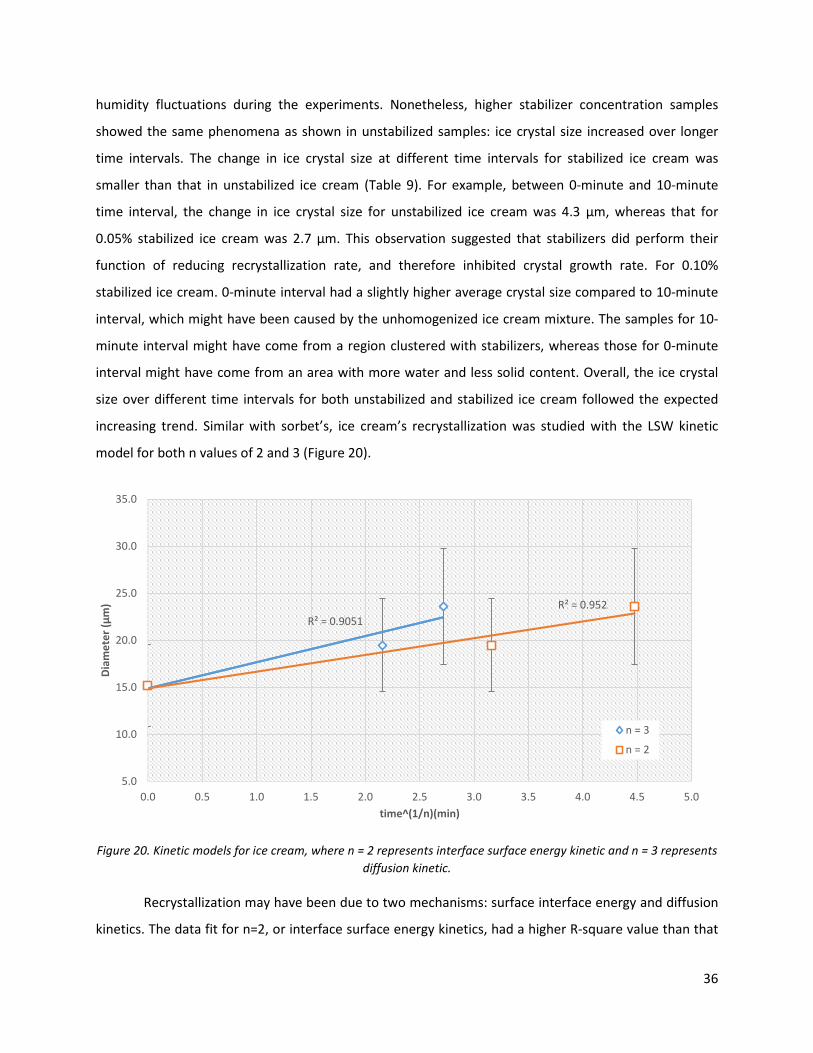
humidity fluctuations during the experiments. Nonetheless, higher stabilizer concentration samples
showed the same phenomena as shown in unstabilized samples: ice crystal size increased over longer
time intervals. The change in ice crystal size at different time intervals for stabilized ice cream was
smaller than that in unstabilized ice cream (Table 9). For example, between 0-minute and 10-minute
time interval, the change in ice crystal size for unstabilized ice cream was 4.3 μm, whereas that for
0.05% stabilized ice cream was 2.7 μm. This observation suggested that stabilizers did perform their
function of reducing recrystallization rate, and therefore inhibited crystal growth rate. For 0.10%
stabilized ice cream. 0-minute interval had a slightly higher average crystal size compared to 10-minute
interval, which might have been caused by the unhomogenized ice cream mixture. The samples for 10-
minute interval might have come from a region clustered with stabilizers, whereas those for 0-minute
interval might have come from an area with more water and less solid content. Overall, the ice crystal
size over different time intervals for both unstabilized and stabilized ice cream followed the expected
increasing trend. Similar with sorbet’s, ice cream’s recrystallization was studied with the LSW kinetic
model for both n values of 2 and 3 (Figure 20).
Figure 20. Kinetic models for ice cream, where n = 2 represents interface surface energy kinetic and n = 3 represents diffusion kinetic.
Recrystallization may have been due to two mechanisms: surface interface energy and diffusion
kinetics. The data fit for n=2, or interface surface energy kinetics, had a higher R-square value than that
R² = 0.9051R² = 0.952
5.0
10.0
15.0
20.0
25.0
30.0
35.0
0.0 0.5 1.0 1.5 2.0 2.5 3.0 3.5 4.0 4.5 5.0
Diam
eter
(µm
)
time^(1/n)(min)
n = 3
n = 2
36
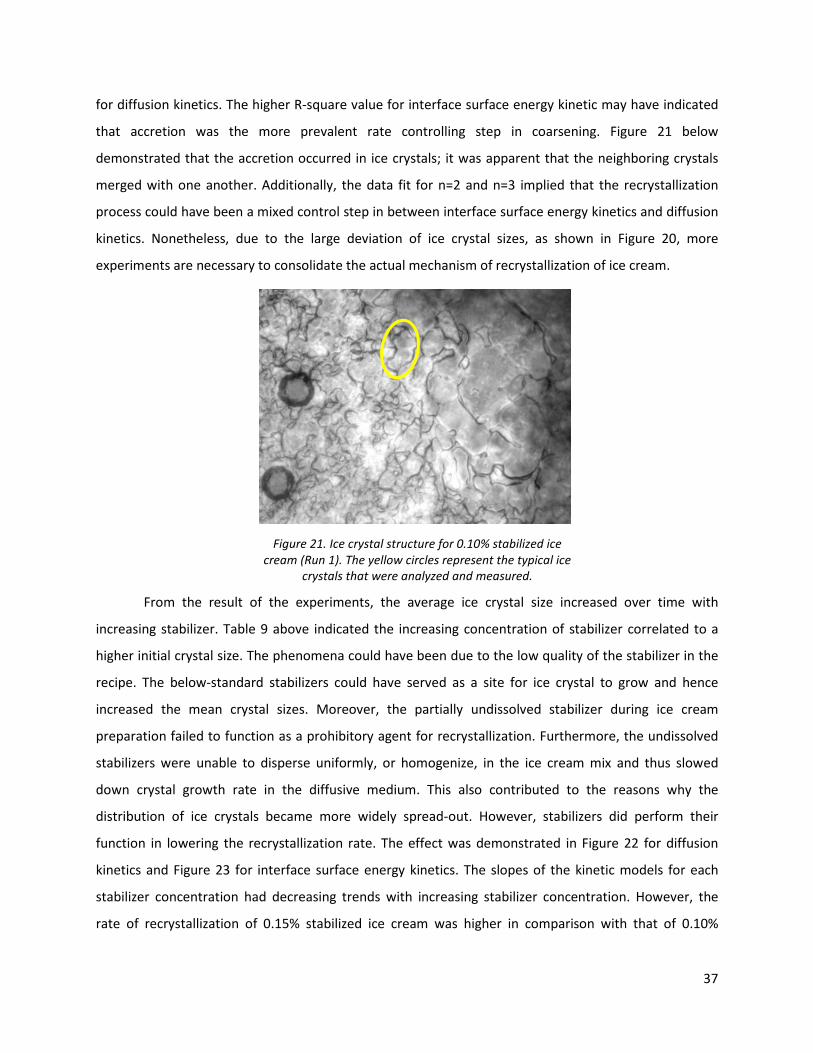
for diffusion kinetics. The higher R-square value for interface surface energy kinetic may have indicated
that accretion was the more prevalent rate controlling step in coarsening. Figure 21 below
demonstrated that the accretion occurred in ice crystals; it was apparent that the neighboring crystals
merged with one another. Additionally, the data fit for n=2 and n=3 implied that the recrystallization
process could have been a mixed control step in between interface surface energy kinetics and diffusion
kinetics. Nonetheless, due to the large deviation of ice crystal sizes, as shown in Figure 20, more
experiments are necessary to consolidate the actual mechanism of recrystallization of ice cream.
From the result of the experiments, the average ice crystal size increased over time with
increasing stabilizer. Table 9 above indicated the increasing concentration of stabilizer correlated to a
higher initial crystal size. The phenomena could have been due to the low quality of the stabilizer in the
recipe. The below-standard stabilizers could have served as a site for ice crystal to grow and hence
increased the mean crystal sizes. Moreover, the partially undissolved stabilizer during ice cream
preparation failed to function as a prohibitory agent for recrystallization. Furthermore, the undissolved
stabilizers were unable to disperse uniformly, or homogenize, in the ice cream mix and thus slowed
down crystal growth rate in the diffusive medium. This also contributed to the reasons why the
distribution of ice crystals became more widely spread-out. However, stabilizers did perform their
function in lowering the recrystallization rate. The effect was demonstrated in Figure 22 for diffusion
kinetics and Figure 23 for interface surface energy kinetics. The slopes of the kinetic models for each
stabilizer concentration had decreasing trends with increasing stabilizer concentration. However, the
rate of recrystallization of 0.15% stabilized ice cream was higher in comparison with that of 0.10%
Figure 21. Ice crystal structure for 0.10% stabilized ice cream (Run 1). The yellow circles represent the typical ice
crystals that were analyzed and measured.
37

stabilized ice cream. The reverse trend might have been an indication of an optimal concentration of
stabilizer in this particular ice cream formula. In order to achieve the lowest recrystallization rate, the
concentration of combined locust bean gum and gum was predicted to be between 0.10% and 0.15%.
Nonetheless, due to the large deviations in the obtained data, further testing is required to confirm this
hypothesis.
Figure 22. Diffusion kinetic model for ice cream at different stabilizers concentration.
Figure 23. Interface surface energy kinetic model for ice cream with different stabilizers concentration.
38
0.0
5.0
10.0
15.0
20.0
25.0
30.0
35.0
0.0 0.5 1.0 1.5 2.0 2.5 3.0
Diam
eter
(µm
)
time^(1/3)(min)
0.00% Stabilizer0.05% Stabilized0.10% Stabilizer0.15% Stabilizer
slope = 0.7
slope = 0.5
slope = 1.1
slope = 2.8
0.0
5.0
10.0
15.0
20.0
25.0
30.0
35.0
0.0 0.5 1.0 1.5 2.0 2.5 3.0 3.5 4.0 4.5 5.0
Diam
eter
(µm
)
time^(1/2)(min)
0.00% Stabilizer0.05% Stabilized0.10% Stabilizer0.15% Stabilizer
slope = 0.4
slope = 0.35slope = 0.7
slope = 1.8
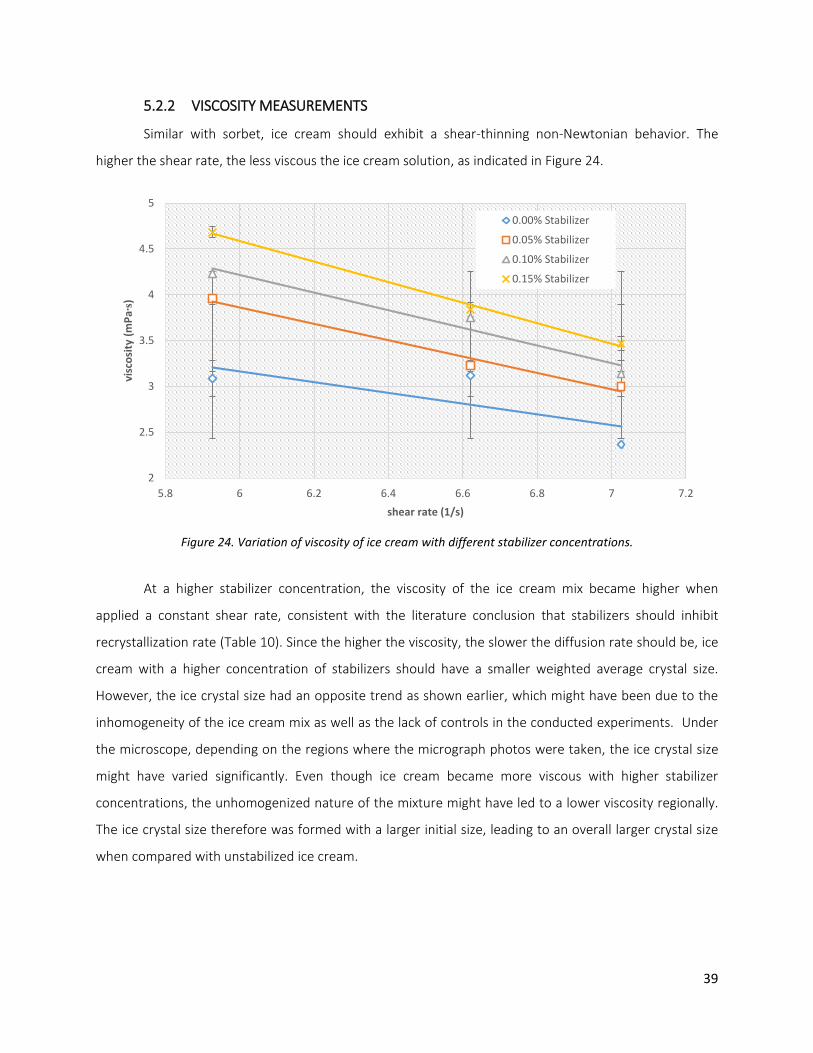
Figure 24. Variation of viscosity of ice cream with different stabilizer concentrations.
5.2.2 VISCOSITY MEASUREMENTS
Similar with sorbet, ice cream should exhibit a shear-thinning non-Newtonian behavior. The
higher the shear rate, the less viscous the ice cream solution, as indicated in Figure 24.
At a higher stabilizer concentration, the viscosity of the ice cream mix became higher when
applied a constant shear rate, consistent with the literature conclusion that stabilizers should inhibit
recrystallization rate (Table 10). Since the higher the viscosity, the slower the diffusion rate should be, ice
cream with a higher concentration of stabilizers should have a smaller weighted average crystal size.
However, the ice crystal size had an opposite trend as shown earlier, which might have been due to the
inhomogeneity of the ice cream mix as well as the lack of controls in the conducted experiments. Under
the microscope, depending on the regions where the micrograph photos were taken, the ice crystal size
might have varied significantly. Even though ice cream became more viscous with higher stabilizer
concentrations, the unhomogenized nature of the mixture might have led to a lower viscosity regionally.
The ice crystal size therefore was formed with a larger initial size, leading to an overall larger crystal size
when compared with unstabilized ice cream.
2
2.5
3
3.5
4
4.5
5
5.8 6 6.2 6.4 6.6 6.8 7 7.2
visc
osity
(mPa∙s)
shear rate (1/s)
0.00% Stabilizer
0.05% Stabilizer
0.10% Stabilizer
0.15% Stabilizer
39
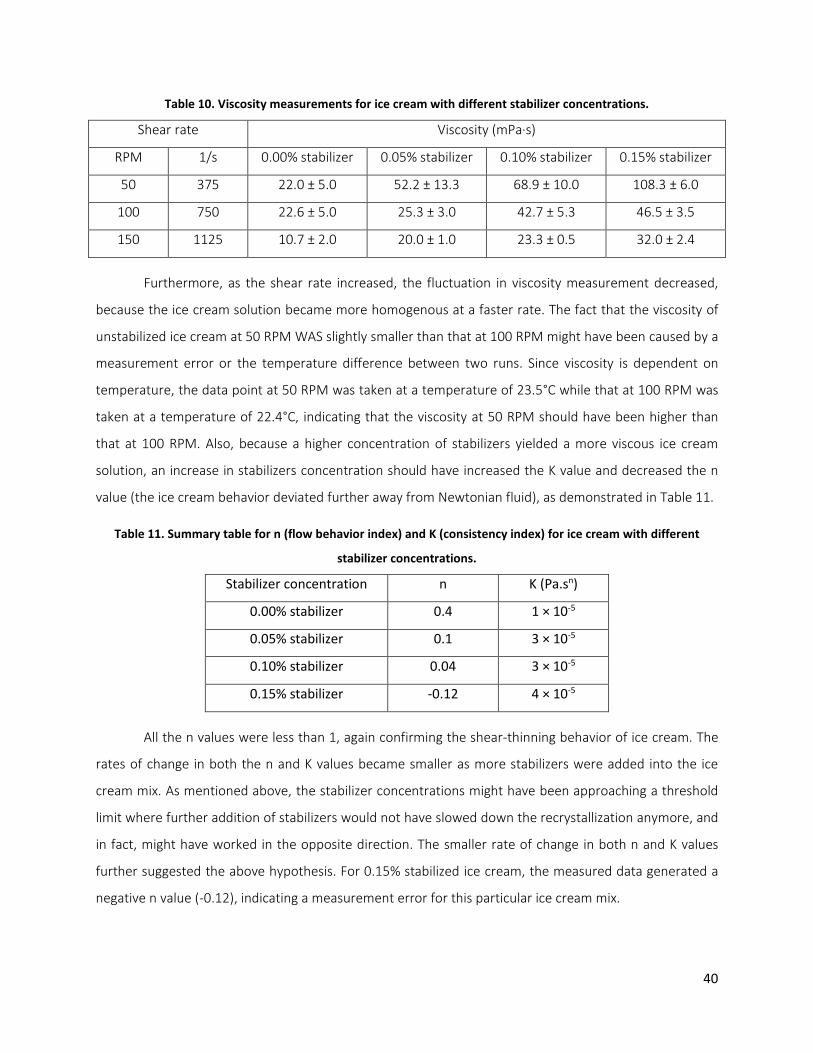
Table 10. Viscosity measurements for ice cream with different stabilizer concentrations.
Shear rate Viscosity (mPa·s)
RPM 1/s 0.00% stabilizer 0.05% stabilizer 0.10% stabilizer 0.15% stabilizer
50 375 22.0 ± 5.0 52.2 ± 13.3 68.9 ± 10.0 108.3 ± 6.0
100 750 22.6 ± 5.0 25.3 ± 3.0 42.7 ± 5.3 46.5 ± 3.5
150 1125 10.7 ± 2.0 20.0 ± 1.0 23.3 ± 0.5 32.0 ± 2.4
Furthermore, as the shear rate increased, the fluctuation in viscosity measurement decreased,
because the ice cream solution became more homogenous at a faster rate. The fact that the viscosity of
unstabilized ice cream at 50 RPM WAS slightly smaller than that at 100 RPM might have been caused by a
measurement error or the temperature difference between two runs. Since viscosity is dependent on
temperature, the data point at 50 RPM was taken at a temperature of 23.5°C while that at 100 RPM was
taken at a temperature of 22.4°C, indicating that the viscosity at 50 RPM should have been higher than
that at 100 RPM. Also, because a higher concentration of stabilizers yielded a more viscous ice cream
solution, an increase in stabilizers concentration should have increased the K value and decreased the n
value (the ice cream behavior deviated further away from Newtonian fluid), as demonstrated in Table 11.
Table 11. Summary table for n (flow behavior index) and K (consistency index) for ice cream with different
stabilizer concentrations.
Stabilizer concentration n K (Pa.sn)
0.00% stabilizer 0.4 1 × 10⁻⁵
0.05% stabilizer 0.1 3 × 10⁻⁵
0.10% stabilizer 0.04 3 × 10⁻⁵
0.15% stabilizer -0.12 4 × 10⁻⁵
All the n values were less than 1, again confirming the shear-thinning behavior of ice cream. The
rates of change in both the n and K values became smaller as more stabilizers were added into the ice
cream mix. As mentioned above, the stabilizer concentrations might have been approaching a threshold
limit where further addition of stabilizers would not have slowed down the recrystallization anymore, and
in fact, might have worked in the opposite direction. The smaller rate of change in both n and K values
further suggested the above hypothesis. For 0.15% stabilized ice cream, the measured data generated a
negative n value (-0.12), indicating a measurement error for this particular ice cream mix.
40
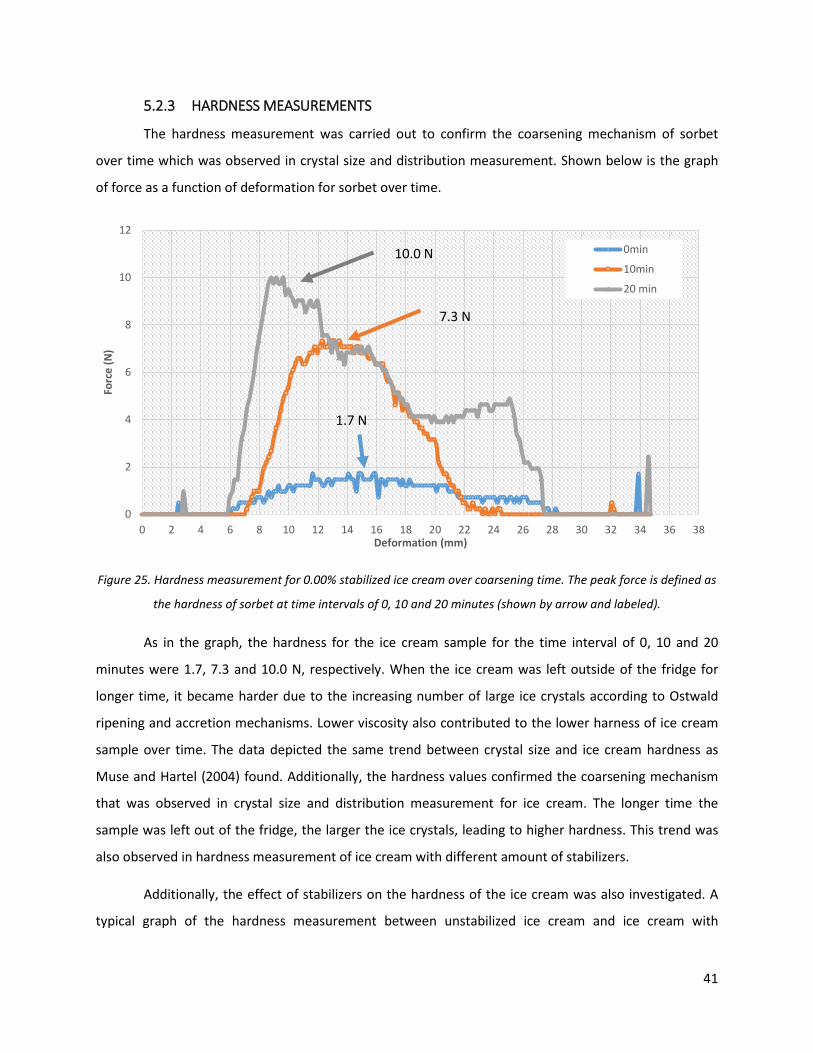
5.2.3 HARDNESS MEASUREMENTS
The hardness measurement was carried out to confirm the coarsening mechanism of sorbet
over time which was observed in crystal size and distribution measurement. Shown below is the graph
of force as a function of deformation for sorbet over time.
Figure 25. Hardness measurement for 0.00% stabilized ice cream over coarsening time. The peak force is defined as
the hardness of sorbet at time intervals of 0, 10 and 20 minutes (shown by arrow and labeled).
As in the graph, the hardness for the ice cream sample for the time interval of 0, 10 and 20
minutes were 1.7, 7.3 and 10.0 N, respectively. When the ice cream was left outside of the fridge for
longer time, it became harder due to the increasing number of large ice crystals according to Ostwald
ripening and accretion mechanisms. Lower viscosity also contributed to the lower harness of ice cream
sample over time. The data depicted the same trend between crystal size and ice cream hardness as
Muse and Hartel (2004) found. Additionally, the hardness values confirmed the coarsening mechanism
that was observed in crystal size and distribution measurement for ice cream. The longer time the
sample was left out of the fridge, the larger the ice crystals, leading to higher hardness. This trend was
also observed in hardness measurement of ice cream with different amount of stabilizers.
Additionally, the effect of stabilizers on the hardness of the ice cream was also investigated. A
typical graph of the hardness measurement between unstabilized ice cream and ice cream with
0
2
4
6
8
10
12
0 2 4 6 8 10 12 14 16 18 20 22 24 26 28 30 32 34 36 38
Forc
e (N
)
Deformation (mm)
0min
10min
20 min
10.0 N
7.3 N
1.7 N
41
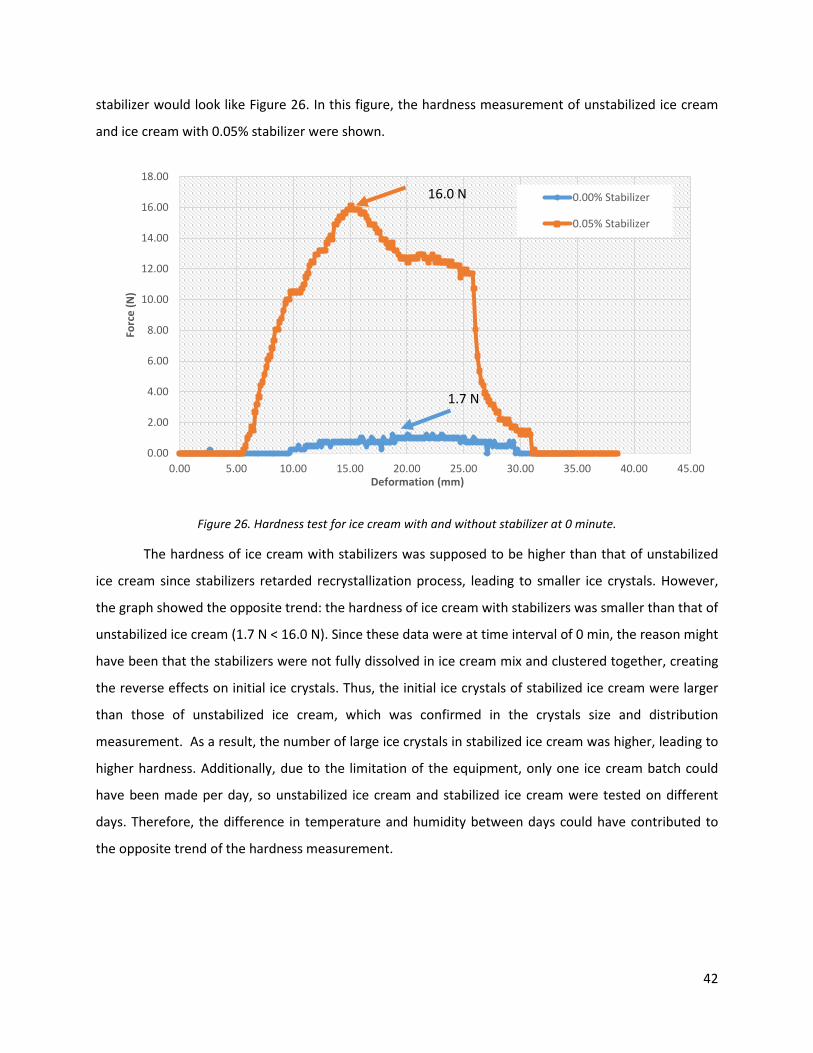
stabilizer would look like Figure 26. In this figure, the hardness measurement of unstabilized ice cream
and ice cream with 0.05% stabilizer were shown.
Figure 26. Hardness test for ice cream with and without stabilizer at 0 minute.
The hardness of ice cream with stabilizers was supposed to be higher than that of unstabilized
ice cream since stabilizers retarded recrystallization process, leading to smaller ice crystals. However,
the graph showed the opposite trend: the hardness of ice cream with stabilizers was smaller than that of
unstabilized ice cream (1.7 N < 16.0 N). Since these data were at time interval of 0 min, the reason might
have been that the stabilizers were not fully dissolved in ice cream mix and clustered together, creating
the reverse effects on initial ice crystals. Thus, the initial ice crystals of stabilized ice cream were larger
than those of unstabilized ice cream, which was confirmed in the crystals size and distribution
measurement. As a result, the number of large ice crystals in stabilized ice cream was higher, leading to
higher hardness. Additionally, due to the limitation of the equipment, only one ice cream batch could
have been made per day, so unstabilized ice cream and stabilized ice cream were tested on different
days. Therefore, the difference in temperature and humidity between days could have contributed to
the opposite trend of the hardness measurement.
0.00
2.00
4.00
6.00
8.00
10.00
12.00
14.00
16.00
18.00
0.00 5.00 10.00 15.00 20.00 25.00 30.00 35.00 40.00 45.00
Forc
e (N
)
Deformation (mm)
0.00% Stabilizer
0.05% Stabilizer
16.0 N
1.7 N
42
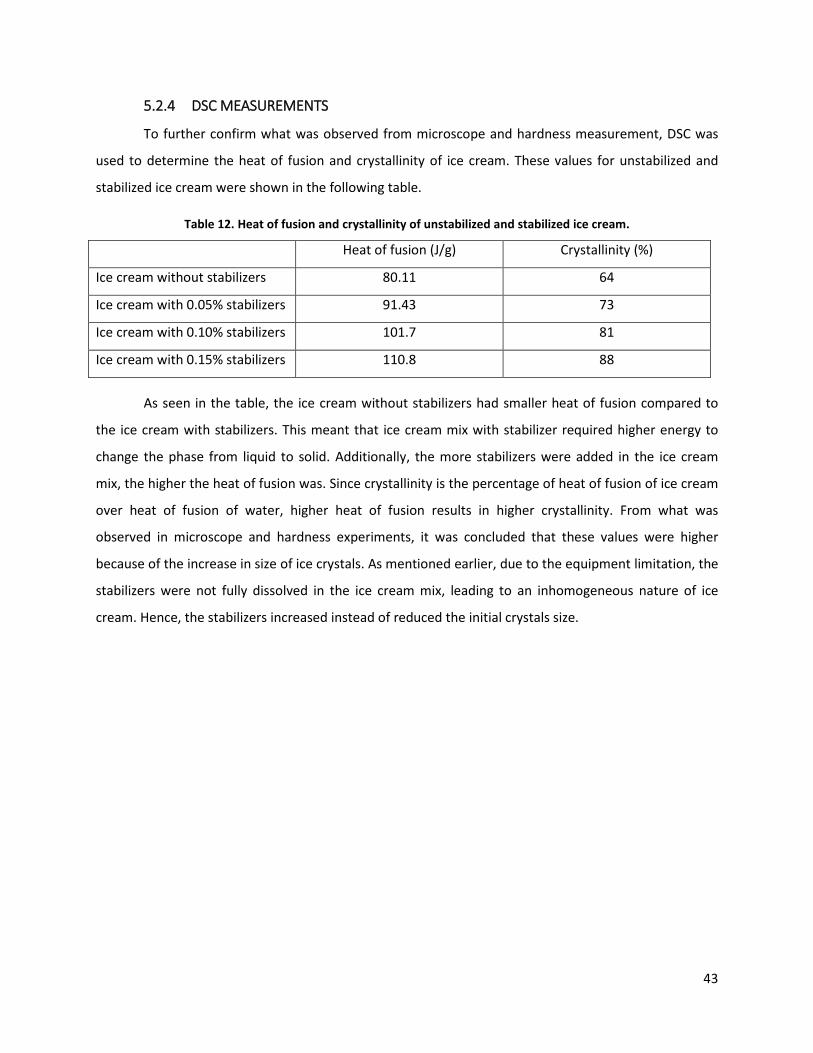
5.2.4 DSC MEASUREMENTS
To further confirm what was observed from microscope and hardness measurement, DSC was
used to determine the heat of fusion and crystallinity of ice cream. These values for unstabilized and
stabilized ice cream were shown in the following table.
Table 12. Heat of fusion and crystallinity of unstabilized and stabilized ice cream.
Heat of fusion (J/g) Crystallinity (%)
Ice cream without stabilizers 80.11 64
Ice cream with 0.05% stabilizers 91.43 73
Ice cream with 0.10% stabilizers 101.7 81
Ice cream with 0.15% stabilizers 110.8 88
As seen in the table, the ice cream without stabilizers had smaller heat of fusion compared to
the ice cream with stabilizers. This meant that ice cream mix with stabilizer required higher energy to
change the phase from liquid to solid. Additionally, the more stabilizers were added in the ice cream
mix, the higher the heat of fusion was. Since crystallinity is the percentage of heat of fusion of ice cream
over heat of fusion of water, higher heat of fusion results in higher crystallinity. From what was
observed in microscope and hardness experiments, it was concluded that these values were higher
because of the increase in size of ice crystals. As mentioned earlier, due to the equipment limitation, the
stabilizers were not fully dissolved in the ice cream mix, leading to an inhomogeneous nature of ice
cream. Hence, the stabilizers increased instead of reduced the initial crystals size.
43
6.0 CONCLUSIONS AND RECOMMENDATIONS The coarsening of sorbet and ice cream over time was clearly observed through microscopic
images. The crystals size of both sorbet and ice cream increased with increasing time that the sample
was left outside of the fridge. Since coarsening is a time-dependent process, coarsening increased with
increasing time of temperature fluctuations. Additionally, since hardness is an indirect measure of ice
crystal size, the hardness test was also conducted. At a longer time interval, hardness increased,
indicating that the size of crystals increased over time. This further confirmed the coarsening process
occurred in sorbet and ice cream. Furthermore, the weighted average crystal size over time fitted in
between interface surface energy and diffusion kinetic model, suggesting that the ice cream coarsening
effect might have been mixed control. However, due to the large standard deviations of the weighted
average crystal size, more experiments should be conducted to confirm the dominant coarsening
kinetics in this particular ice cream.
The data obtained from microscopy experiments shows that the coarsening rate of stabilized ice
cream was smaller than that of unstabilized ice cream. This implied that the combination of locust bean
gum and guar gum did reduce the coarsening rate in ice cream. Moreover, the data from viscosity
measurement also reinforced the effects of stabilizers on ice cream coarsening. Compared to
unstabilized ice cream, stabilized ice cream had a higher viscosity, and thus, inhibited crystals mobility
and decreased the diffusion rate of ice crystals. As a result, adding stabilizers in ice cream mix
diminished the coarsening rate.
Even though stabilizers carried out their function, which is to decrease coarsening rate, the ice
crystals size was observed to be larger in stabilized ice cream than in unstabilized ice cream. The main
reason could be that the stabilizers were not fully dissolved in the ice cream mix due to the equipment
limitation. As a result, even though stabilizers reduced the coarsening rate, since the initial ice crystals in
the mix were already big, the weighted average crystal size for each time interval of stabilized ice cream
were larger than that of unstabilized ice cream. Additionally, at 0 minute, the hardness was also higher
for stabilized ice cream, confirming that the initial crystal size of stabilized ice cream was larger than that
of unstabilized ice cream. Moreover, the crystallinity of stabilized ice cream was found to be higher,
which further supported this conclusion.
Hardness of sorbet was determined to higher than that of ice cream at all time intervals of 0, 10,
and 20 minutes, which is consistent with the nature of sorbet. However, sorbet average crystal size was
44
found to be smaller than that of both unstabilized and stabilized ice cream. This reverse trend might
have been due to the more controlled environment that Häagen-Dazs sorbet was manufactured in.
Since the accuracy of the data was significantly affected by the conditions of the experiments, it
is recommended to obtain data under a better controlled environments and equipment. A fluorescence
microscope with a cold stage is required for better results. Ice cream and sorbet should also be prepared
in a temperature-controlled environment to prevent temperature fluctuations. Higher quality stabilizers
should be ensured for ice cream preparation, and the ice cream solution should be better-mixed.
45
7.0 REFERENCES Adapa, S.; Schmidt, K.A.; Jeon, I.J.; Herald, T.J.; Flores, R.A. Mechanisms of ice crystallization and recrystallization in ice cream: a review. Food Reviews International 2000, 16(3), 259–271.
Arbuckle, W.S. (1986) Ice Cream (4th edn), Van Nostrand Reinhold.
Bahramparvar, Mayam, and Mostafa Mazaheri Tehrani. "Application and Functions of Stabilizers in Ice Cream." Food Reviews International 27.4 (2011): 389-407. Sciencedirect. Web. 12 Nov. 2013.
BahramParvar, M.; Razavi, S.M.A.; Haddad Khodaparast, M.H. Rheological characterization and sensory evaluation of typical soft ice cream made with selected food hydrocolloids. Food Science and Technology International 2010, 16(1), 79–88.
Ben-Yoseph, E., and R. W. Hartel. "Computer Simulation of Ice Recrystallization in Ice Cream." Journal of Food Engineering 38 (1998): 309-29. Sciencedirect. Web. 03 Dec. 2013.
Budiaman, E.R.; Fennema, O. Linear rate of water crystallization as influenced by temperature of hydrocolloid suspensions. Journal of Dairy Science 1987, 70, 534–546.
Budiaman, E.R.; Fennema, O. Linear rate of water crystallization as influenced by viscosity of hydrocolloid suspensions. Journal of Dairy Science 1987, 70, 547–554.
Donhowe, D.P., Hartel, R.W. and Bradley, R.L. (1991) ‘Determination of Ice Crystals Size Distributions in Frozen Desserts’ in J. Dairy Sci. 74, 3334-3344.
Goff, H. Douglas, and Richard W. Hartel. Ice Cream. 7th ed. New York: Springer, 2013. Web. 02 Dec. 2013.
Guven, M.; Karaca, O.B.; Kacar, A. The effects of the combined use of stabilizers containing locust bean gum and the storage time on kahramanmaras-type ice creams. International Journal of Dairy Technology 2003, 56(4), 223–228.
Hagiwara, Tadashi, and Richard Hartel. "Effect of Sweetener, Stabilizer, and Storage Temperature on Ice Recrystallization in Ice Cream." Journal of Dairy Science 79.5 (1996): 735-44. Sciencedirect. Web. 03 Dec. 2013.
Hartel, Richard W. "Ice Crystallization during the Manufacture of Ice Cream." Trends in Food Science & Technology 7.10 (1996): 315-21. Print. Berger, K.G. (1990) ‘Ice Cream’ in Food Emulsions (Larsson, K. and Stiberg, S.E. eds), pp. 367-429, Marcel Dekker.
Kaya, S.; Tekin, A.R. The effect of salep content on the rheological characteristics of a typical ice cream mix. Journal of Food Engineering 2001, 47, 59-62.
Muse, M.R.; Hartel, R.W. Ice cream structural elements that affect melting rate and hardness. Journal of Dairy Science 2004, 87, 1–10.
Pintor, A., and A. Totosaus. "Ice Cream Properties Affected by Lambda-carrageenan or Iota-carrageenan Interactions with Locust Bean Gum/carboxymethylcellulose Mixtures." Ice Cream Properties Affected by
46
Lambda-carrageenan or Iota-carrageenan Interactions with Locust Bean Gum/carboxymethylcellulose Mixtures 19.4 (2012): 1409-414. Sciencedirect. Web. 03 Nov. 2013.
Schwartzberg, H.G. (1990) ‘Freeze Concentration’ in Food Biotechnology (Schwartzberg, H.G. and Rao, M.A., eds), pp. 127-202, Marcel Dekker.
Uzomah, A.; Ahiligwo, R.N. Studies on the rheological properties and functional potentials of achi (Brachystegea eurycoma) and ogbono (Irvingia gabonesis) seed gums. Food Chemistry 1999, 67, 217–222.
47
8.0 APPENDIX
8.1 ICE CREAM FORMULATIONS
Following the ice cream formula of 10% fat, 12% milk-solids-not-fat (MSNF), 15% dextrose,
0.15% mono-diglycerides (MNG), and 0.05 to 0.15% stabilizers, the following calculations yield the
component mass for each ice cream batch of 938.39g.
𝑀𝑀𝑐𝑐𝑒𝑒𝑒𝑒 𝑙𝑙𝑜𝑜 𝑜𝑜𝑐𝑐𝑡𝑡 = (1000)(0.10) = 100𝑙𝑙
𝑀𝑀𝑐𝑐𝑒𝑒𝑒𝑒 𝑙𝑙𝑜𝑜 𝑀𝑀𝑀𝑀𝑁𝑁𝑀𝑀 = (1000)(0.12) = 120𝑙𝑙
𝑀𝑀𝑐𝑐𝑒𝑒𝑒𝑒 𝑙𝑙𝑜𝑜 𝑒𝑒𝑂𝑂𝑚𝑚𝑡𝑡𝑟𝑟𝑙𝑙𝑒𝑒𝑂𝑂 = (1000)(0.15) = 150𝑙𝑙
𝑀𝑀𝑐𝑐𝑒𝑒𝑒𝑒 𝑙𝑙𝑜𝑜 𝑀𝑀𝑁𝑁𝑀𝑀 = (1000)(0.0015) = 1.5𝑙𝑙
𝑀𝑀𝑤𝑤𝑂𝑂𝑤𝑤𝑐𝑐𝑂𝑂𝑐𝑐 𝑐𝑐𝑐𝑐𝑒𝑒𝑒𝑒 𝑙𝑙𝑜𝑜 𝑒𝑒𝑡𝑡𝑐𝑐𝑠𝑠𝑤𝑤𝑙𝑙𝑤𝑤𝑠𝑠𝑂𝑂𝑟𝑟𝑒𝑒 = (1000)(0.0005) = 0.5𝑙𝑙
𝑀𝑀𝑤𝑤𝑂𝑂𝑤𝑤𝑐𝑐𝑂𝑂𝑐𝑐 𝑐𝑐𝑐𝑐𝑒𝑒𝑒𝑒 𝑙𝑙𝑜𝑜 𝑙𝑙𝑙𝑙𝑖𝑖𝑂𝑂𝑒𝑒𝑡𝑡 𝑠𝑠𝑂𝑂𝑐𝑐𝑂𝑂 𝑙𝑙𝑂𝑂𝑐𝑐 = (0.5)(0.75) = 0.375𝑙𝑙
𝑀𝑀𝑤𝑤𝑂𝑂𝑤𝑤𝑐𝑐𝑂𝑂𝑐𝑐 𝑐𝑐𝑐𝑐𝑒𝑒𝑒𝑒 𝑙𝑙𝑜𝑜 𝑙𝑙𝑂𝑂𝑐𝑐𝑟𝑟 𝑙𝑙𝑂𝑂𝑐𝑐 = (0.5)(0.25) = 0.125𝑙𝑙
In every 15mL of heavy cream, there are 5g of fat and 1g of sugar. Since heavy cream is the only
ingredient that contributes to the fat content of the ice cream, its required volume is calculated first.
𝑉𝑉ℎ𝑒𝑒𝑒𝑒𝑒𝑒𝑒𝑒 𝑐𝑐𝑟𝑟𝑒𝑒𝑒𝑒𝑐𝑐 =(15𝑐𝑐𝑚𝑚 ℎ𝑂𝑂𝑐𝑐𝑂𝑂𝐶𝐶 𝑖𝑖𝑟𝑟𝑂𝑂𝑐𝑐𝑐𝑐)(100𝑙𝑙 𝑜𝑜𝑐𝑐𝑡𝑡)
5𝑙𝑙 𝑜𝑜𝑐𝑐𝑡𝑡= 300𝑐𝑐𝑚𝑚
Since 300mL is used for the ice cream recipe, the amount of sugar from heavy cream is then
determined.
𝑐𝑐𝑠𝑠𝑠𝑠𝑔𝑔𝑒𝑒𝑟𝑟 =(300𝑐𝑐𝑚𝑚 ℎ𝑂𝑂𝑐𝑐𝑂𝑂𝐶𝐶 𝑖𝑖𝑟𝑟𝑂𝑂𝑐𝑐𝑐𝑐)(1𝑙𝑙 𝑒𝑒𝑂𝑂𝑙𝑙𝑐𝑐𝑟𝑟)
15𝑐𝑐𝑚𝑚 ℎ𝑂𝑂𝑐𝑐𝑂𝑂𝐶𝐶 𝑖𝑖𝑟𝑟𝑂𝑂𝑐𝑐𝑐𝑐= 20𝑙𝑙
In every 23g of MSNF, there is 12g of sugar. When 120g of MSNF is used per ice cream batch,
the amount of added sugar from MSNF is calculated.
𝑐𝑐𝑠𝑠𝑠𝑠𝑔𝑔𝑒𝑒𝑟𝑟 =(120𝑙𝑙 𝑀𝑀𝑀𝑀𝑁𝑁𝑀𝑀)(12𝑙𝑙 𝑒𝑒𝑂𝑂𝑙𝑙𝑐𝑐𝑟𝑟)
23𝑙𝑙 𝑒𝑒𝑂𝑂𝑙𝑙𝑐𝑐𝑟𝑟= 62.61𝑙𝑙
Then, the total amount of dextrose to be added in each ice cream batch is as follows.
𝑐𝑐𝑑𝑑𝑒𝑒𝑑𝑑𝑑𝑑𝑟𝑟𝑜𝑜𝑠𝑠𝑒𝑒 = 150𝑙𝑙 − 20𝑙𝑙 − 62.61𝑙𝑙 = 67.39𝑙𝑙
48
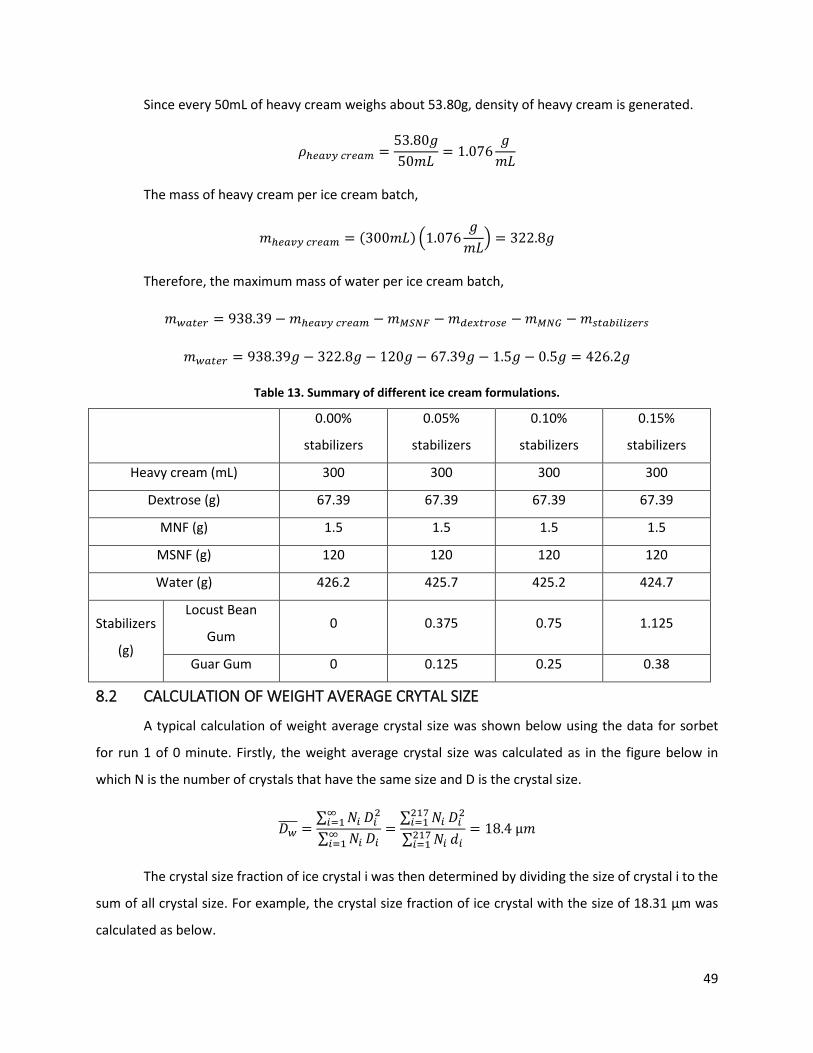
Since every 50mL of heavy cream weighs about 53.80g, density of heavy cream is generated.
𝜌𝜌ℎ𝑒𝑒𝑒𝑒𝑒𝑒𝑒𝑒 𝑐𝑐𝑟𝑟𝑒𝑒𝑒𝑒𝑐𝑐 =53.80𝑙𝑙50𝑐𝑐𝑚𝑚
= 1.076𝑙𝑙𝑐𝑐𝑚𝑚
The mass of heavy cream per ice cream batch,
𝑐𝑐ℎ𝑒𝑒𝑒𝑒𝑒𝑒𝑒𝑒 𝑐𝑐𝑟𝑟𝑒𝑒𝑒𝑒𝑐𝑐 = (300𝑐𝑐𝑚𝑚) �1.076𝑙𝑙𝑐𝑐𝑚𝑚
� = 322.8𝑙𝑙
Therefore, the maximum mass of water per ice cream batch,
𝑐𝑐𝑤𝑤𝑒𝑒𝑑𝑑𝑒𝑒𝑟𝑟 = 938.39−𝑐𝑐ℎ𝑒𝑒𝑒𝑒𝑒𝑒𝑒𝑒 𝑐𝑐𝑟𝑟𝑒𝑒𝑒𝑒𝑐𝑐 −𝑐𝑐𝑀𝑀𝑀𝑀𝑁𝑁𝑀𝑀 − 𝑐𝑐𝑑𝑑𝑒𝑒𝑑𝑑𝑑𝑑𝑟𝑟𝑜𝑜𝑠𝑠𝑒𝑒 −𝑐𝑐𝑀𝑀𝑁𝑁𝑀𝑀 −𝑐𝑐𝑠𝑠𝑑𝑑𝑒𝑒𝑠𝑠𝑖𝑖𝑠𝑠𝑖𝑖𝑠𝑠𝑒𝑒𝑟𝑟𝑠𝑠
𝑐𝑐𝑤𝑤𝑒𝑒𝑑𝑑𝑒𝑒𝑟𝑟 = 938.39𝑙𝑙 − 322.8𝑙𝑙 − 120𝑙𝑙 − 67.39𝑙𝑙 − 1.5𝑙𝑙 − 0.5𝑙𝑙 = 426.2𝑙𝑙
Table 13. Summary of different ice cream formulations.
0.00%
stabilizers
0.05%
stabilizers
0.10%
stabilizers
0.15%
stabilizers
Heavy cream (mL) 300 300 300 300
Dextrose (g) 67.39 67.39 67.39 67.39
MNF (g) 1.5 1.5 1.5 1.5
MSNF (g) 120 120 120 120
Water (g) 426.2 425.7 425.2 424.7
Stabilizers
(g)
Locust Bean
Gum 0 0.375 0.75 1.125
Guar Gum 0 0.125 0.25 0.38
8.2 CALCULATION OF WEIGHT AVERAGE CRYTAL SIZE
A typical calculation of weight average crystal size was shown below using the data for sorbet
for run 1 of 0 minute. Firstly, the weight average crystal size was calculated as in the figure below in
which N is the number of crystals that have the same size and D is the crystal size.
𝐷𝐷𝑤𝑤���� =∑ 𝑁𝑁𝑖𝑖∞𝑖𝑖=1 𝐷𝐷𝑖𝑖2
∑ 𝑁𝑁𝑖𝑖∞𝑖𝑖=1 𝐷𝐷𝑖𝑖
=∑ 𝑁𝑁𝑖𝑖217𝑖𝑖=1 𝐷𝐷𝑖𝑖2
∑ 𝑁𝑁𝑖𝑖217𝑖𝑖=1 𝑒𝑒𝑖𝑖
= 18.4 µ𝑐𝑐
The crystal size fraction of ice crystal i was then determined by dividing the size of crystal i to the
sum of all crystal size. For example, the crystal size fraction of ice crystal with the size of 18.31 µm was
calculated as below.
49
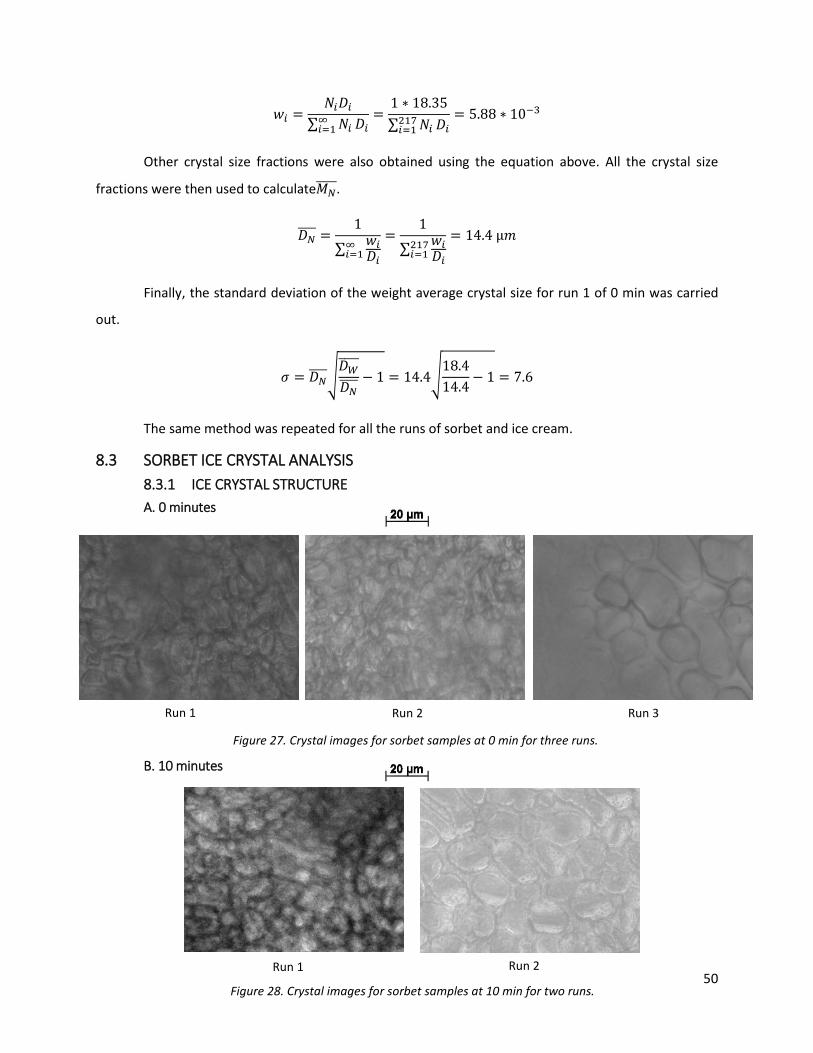
Run 1 Run 2
Figure 28. Crystal images for sorbet samples at 10 min for two runs.
𝑤𝑤𝑖𝑖 =𝑁𝑁𝑖𝑖𝐷𝐷𝑖𝑖
∑ 𝑁𝑁𝑖𝑖∞𝑖𝑖=1 𝐷𝐷𝑖𝑖
=1 ∗ 18.35∑ 𝑁𝑁𝑖𝑖217𝑖𝑖=1 𝐷𝐷𝑖𝑖
= 5.88 ∗ 10−3
Other crystal size fractions were also obtained using the equation above. All the crystal size
fractions were then used to calculate𝑀𝑀𝑁𝑁����.
𝐷𝐷𝑁𝑁���� =1
∑ 𝑤𝑤𝑖𝑖𝐷𝐷𝑖𝑖
∞𝑖𝑖=1
=1
∑ 𝑤𝑤𝑖𝑖𝐷𝐷𝑖𝑖
217𝑖𝑖=1
= 14.4 µ𝑐𝑐
Finally, the standard deviation of the weight average crystal size for run 1 of 0 min was carried
out.
𝜎𝜎 = 𝐷𝐷𝑁𝑁�����𝐷𝐷𝑊𝑊����𝐷𝐷𝑁𝑁����
− 1 = 14.4�18.414.4
− 1 = 7.6
The same method was repeated for all the runs of sorbet and ice cream.
8.3 SORBET ICE CRYSTAL ANALYSIS 8.3.1 ICE CRYSTAL STRUCTURE A. 0 minutes
B. 10 minutes
Run 1 Run 2 Run 3
Figure 27. Crystal images for sorbet samples at 0 min for three runs.
50
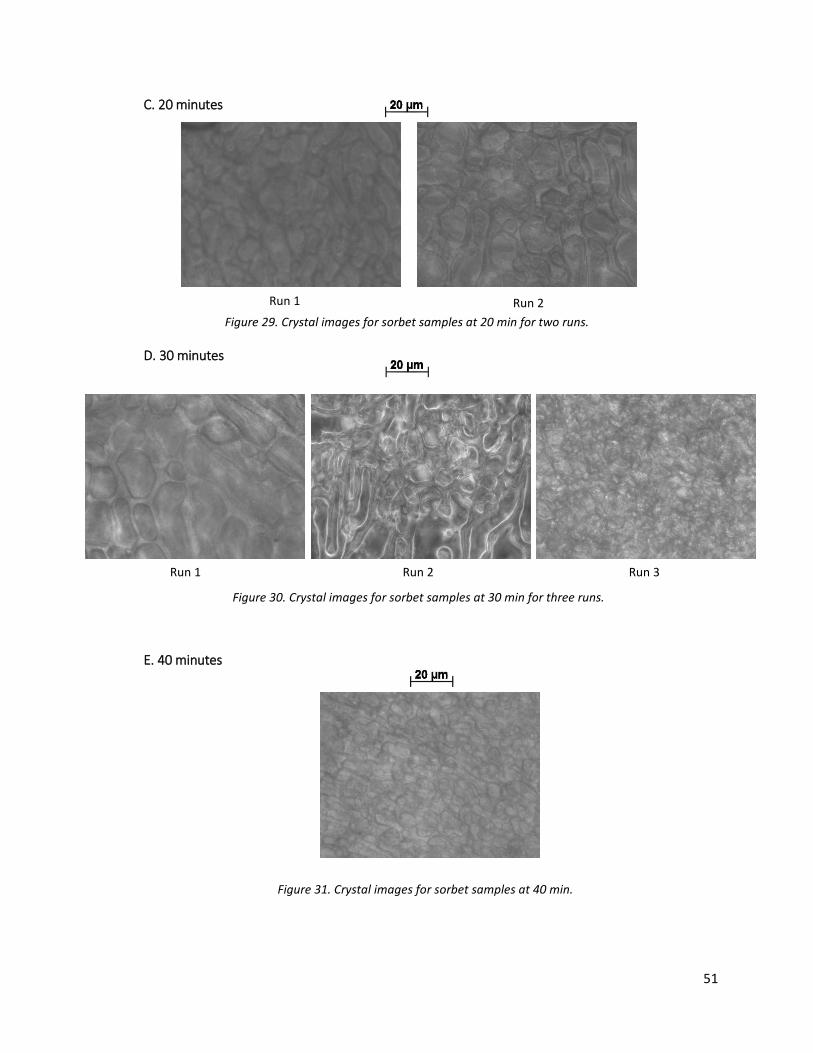
Figure 29. Crystal images for sorbet samples at 20 min for two runs.
Run 1 Run 2
Figure 31. Crystal images for sorbet samples at 40 min.
Run 1 Run 2 Run 3
Figure 30. Crystal images for sorbet samples at 30 min for three runs.
C. 20 minutes
D. 30 minutes
E. 40 minutes
51
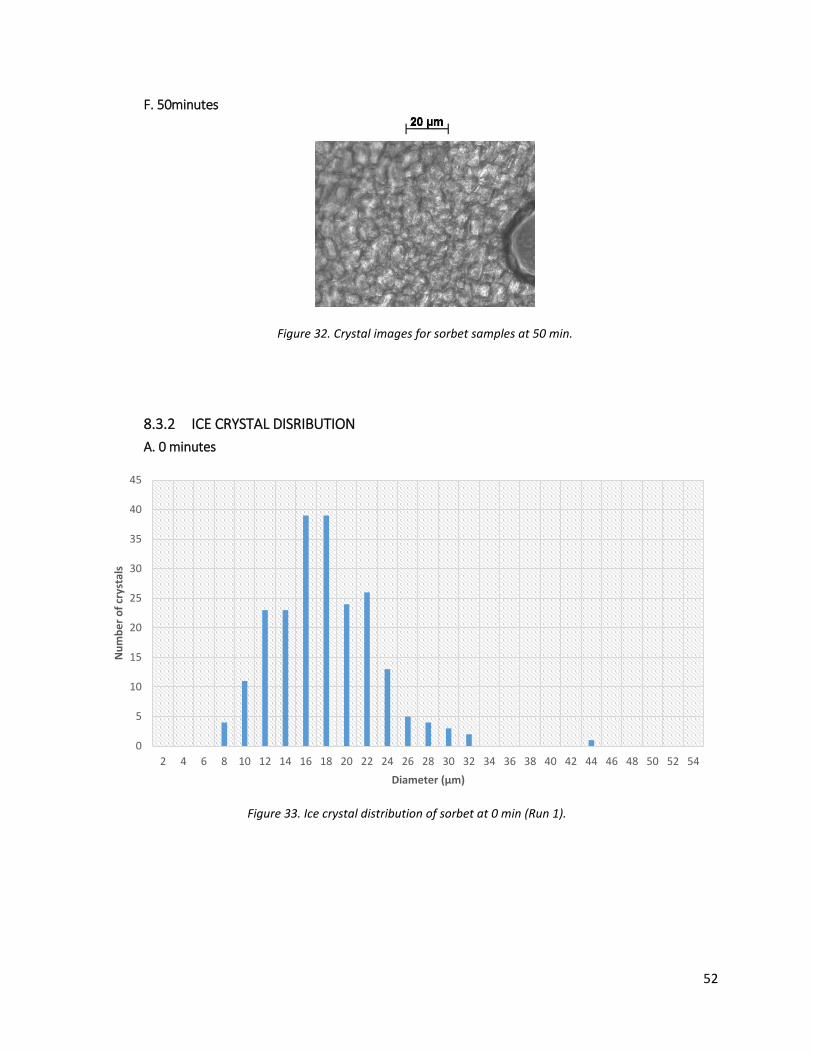
Figure 32. Crystal images for sorbet samples at 50 min.
F. 50minutes
8.3.2 ICE CRYSTAL DISRIBUTION A. 0 minutes
Figure 33. Ice crystal distribution of sorbet at 0 min (Run 1).
0
5
10
15
20
25
30
35
40
45
2 4 6 8 10 12 14 16 18 20 22 24 26 28 30 32 34 36 38 40 42 44 46 48 50 52 54
Num
ber o
f cry
stal
s
Diameter (µm)
52
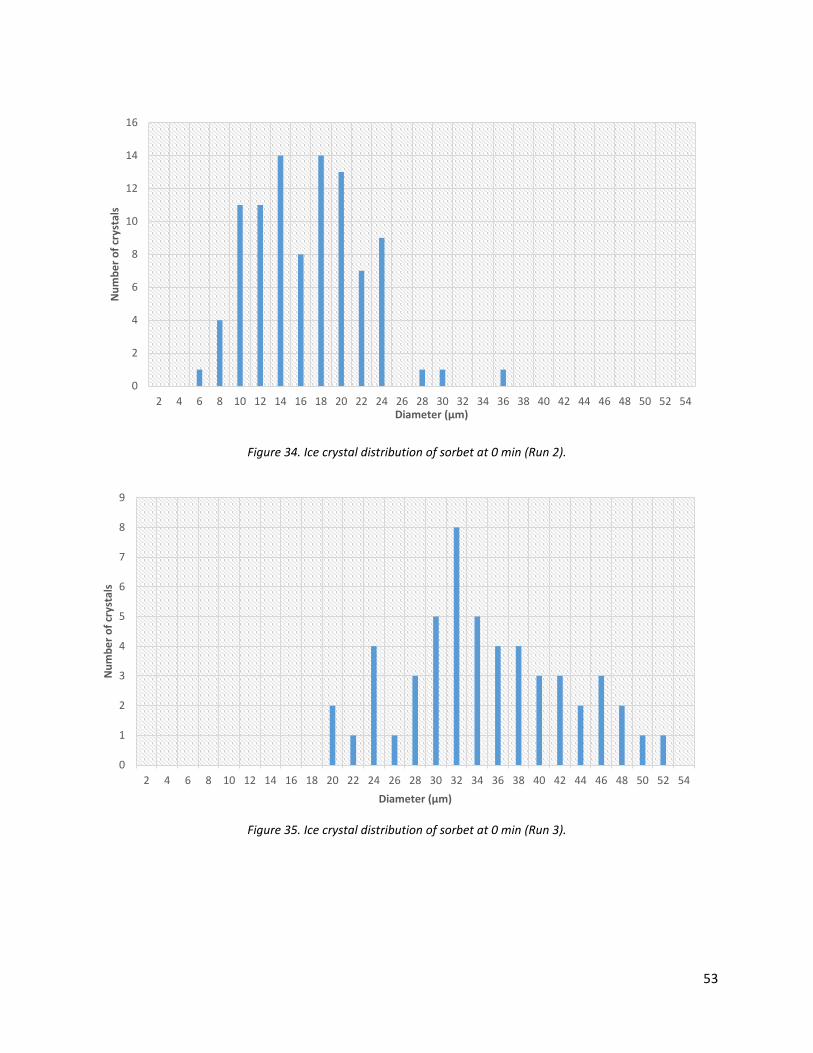
Figure 34. Ice crystal distribution of sorbet at 0 min (Run 2).
Figure 35. Ice crystal distribution of sorbet at 0 min (Run 3).
0
2
4
6
8
10
12
14
16
2 4 6 8 10 12 14 16 18 20 22 24 26 28 30 32 34 36 38 40 42 44 46 48 50 52 54
Num
ber o
f cry
stal
s
Diameter (µm)
0
1
2
3
4
5
6
7
8
9
2 4 6 8 10 12 14 16 18 20 22 24 26 28 30 32 34 36 38 40 42 44 46 48 50 52 54
Num
ber o
f cry
stal
s
Diameter (µm)
53
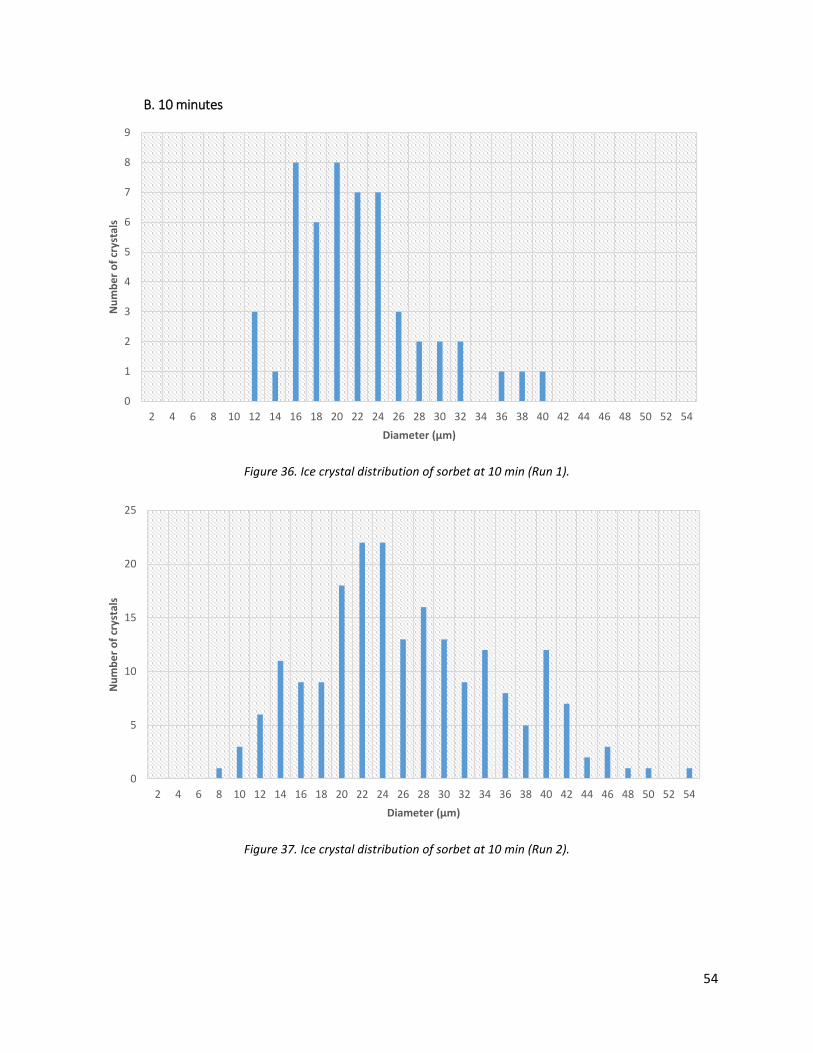
B. 10 minutes
Figure 36. Ice crystal distribution of sorbet at 10 min (Run 1).
Figure 37. Ice crystal distribution of sorbet at 10 min (Run 2).
0
1
2
3
4
5
6
7
8
9
2 4 6 8 10 12 14 16 18 20 22 24 26 28 30 32 34 36 38 40 42 44 46 48 50 52 54
Num
ber o
f cry
stal
s
Diameter (µm)
0
5
10
15
20
25
2 4 6 8 10 12 14 16 18 20 22 24 26 28 30 32 34 36 38 40 42 44 46 48 50 52 54
Num
ber o
f cry
stal
s
Diameter (µm)
54
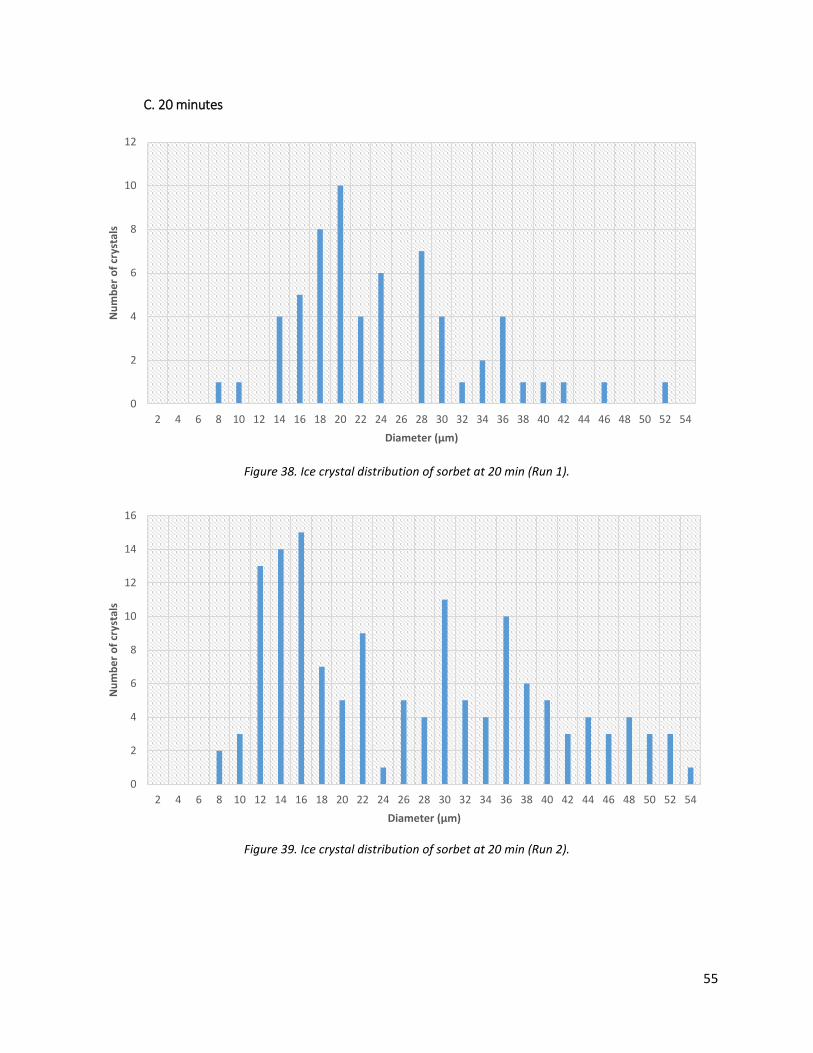
C. 20 minutes
Figure 38. Ice crystal distribution of sorbet at 20 min (Run 1).
Figure 39. Ice crystal distribution of sorbet at 20 min (Run 2).
0
2
4
6
8
10
12
2 4 6 8 10 12 14 16 18 20 22 24 26 28 30 32 34 36 38 40 42 44 46 48 50 52 54
Num
ber o
f cry
stal
s
Diameter (µm)
0
2
4
6
8
10
12
14
16
2 4 6 8 10 12 14 16 18 20 22 24 26 28 30 32 34 36 38 40 42 44 46 48 50 52 54
Num
ber o
f cry
stal
s
Diameter (µm)
55
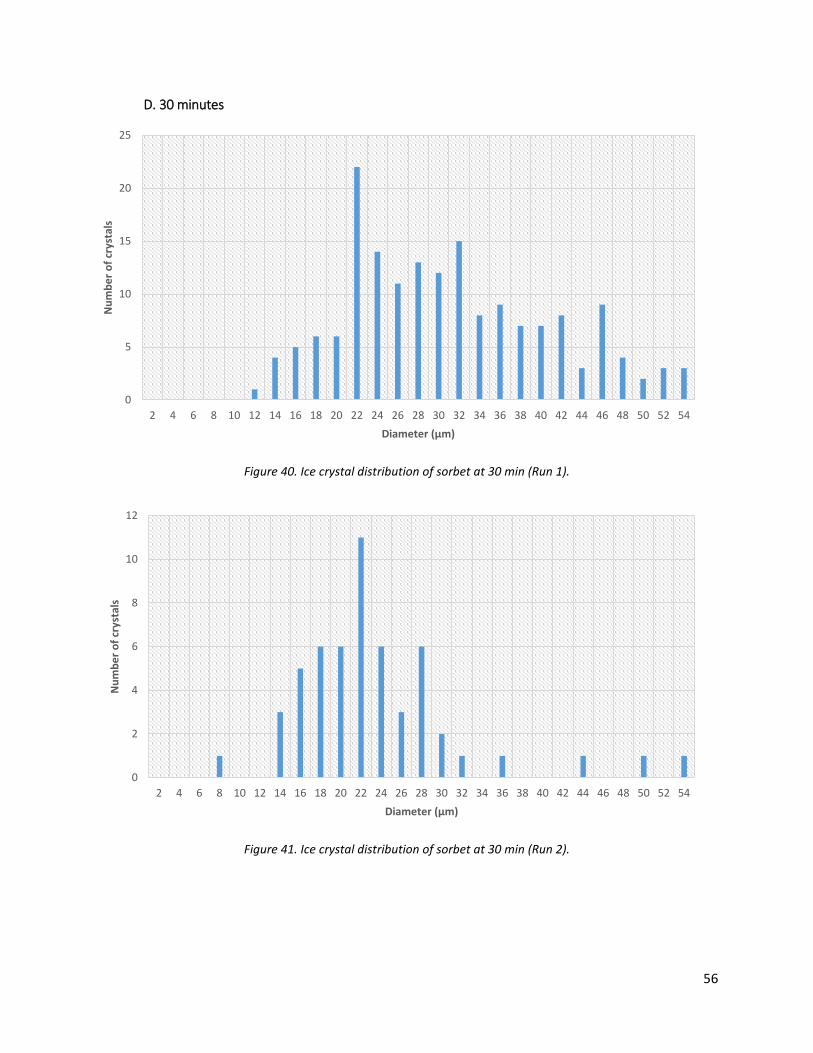
D. 30 minutes
Figure 40. Ice crystal distribution of sorbet at 30 min (Run 1).
Figure 41. Ice crystal distribution of sorbet at 30 min (Run 2).
0
5
10
15
20
25
2 4 6 8 10 12 14 16 18 20 22 24 26 28 30 32 34 36 38 40 42 44 46 48 50 52 54
Num
ber o
f cry
stal
s
Diameter (µm)
0
2
4
6
8
10
12
2 4 6 8 10 12 14 16 18 20 22 24 26 28 30 32 34 36 38 40 42 44 46 48 50 52 54
Num
ber o
f cry
stal
s
Diameter (µm)
56
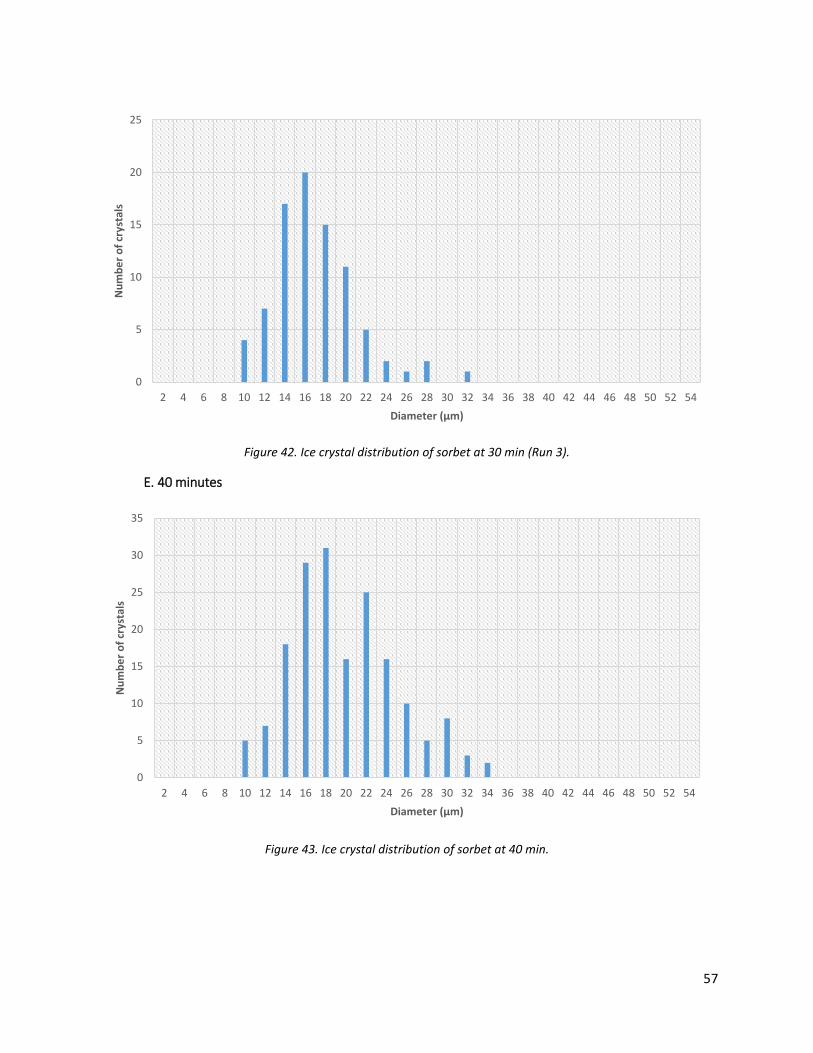
Figure 42. Ice crystal distribution of sorbet at 30 min (Run 3).
E. 40 minutes
Figure 43. Ice crystal distribution of sorbet at 40 min.
0
5
10
15
20
25
2 4 6 8 10 12 14 16 18 20 22 24 26 28 30 32 34 36 38 40 42 44 46 48 50 52 54
Num
ber o
f cry
stal
s
Diameter (µm)
0
5
10
15
20
25
30
35
2 4 6 8 10 12 14 16 18 20 22 24 26 28 30 32 34 36 38 40 42 44 46 48 50 52 54
Num
ber o
f cry
stal
s
Diameter (µm)
57
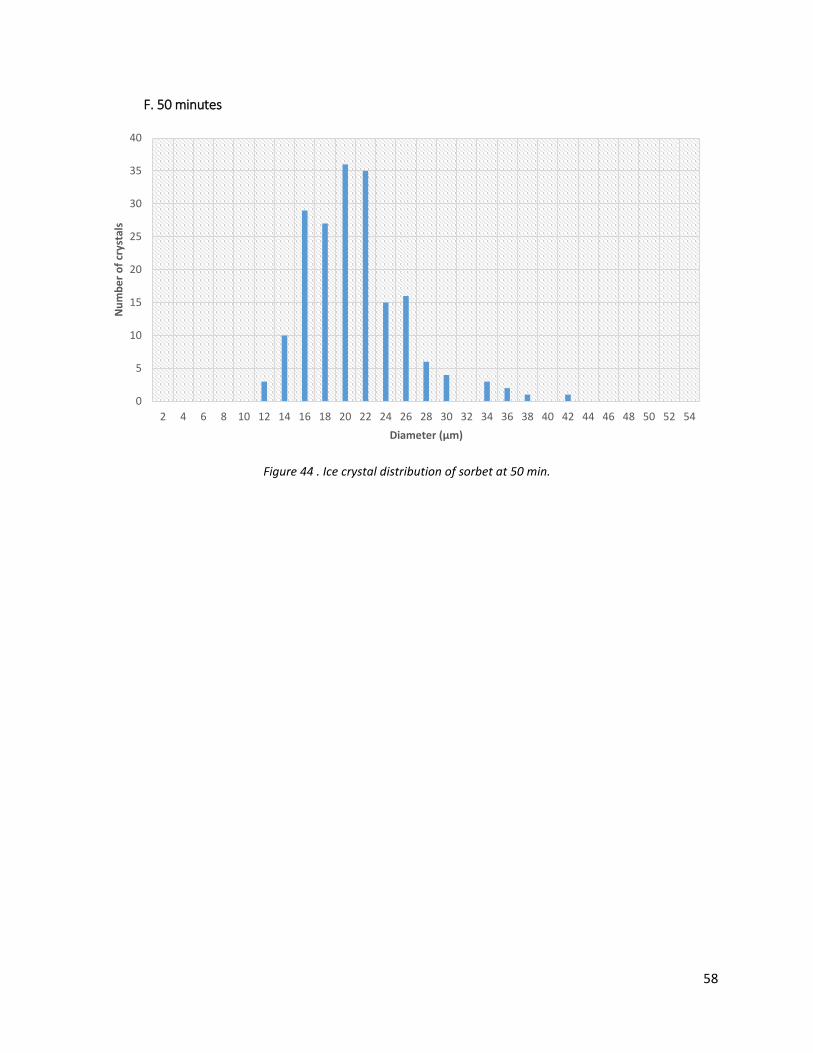
F. 50 minutes
Figure 44 . Ice crystal distribution of sorbet at 50 min.
0
5
10
15
20
25
30
35
40
2 4 6 8 10 12 14 16 18 20 22 24 26 28 30 32 34 36 38 40 42 44 46 48 50 52 54
Num
ber o
f cry
stal
s
Diameter (µm)
58
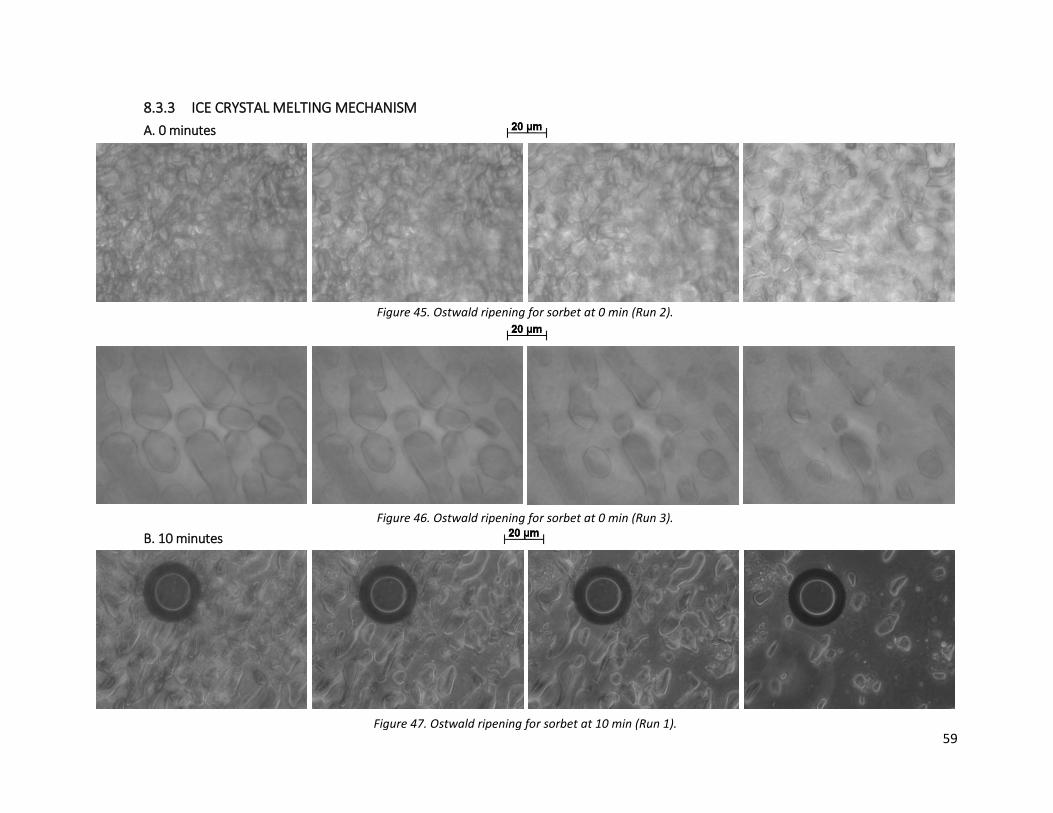
8.3.3 ICE CRYSTAL MELTING MECHANISM A. 0 minutes
B. 10 minutes
Figure 45. Ostwald ripening for sorbet at 0 min (Run 2).
Figure 46. Ostwald ripening for sorbet at 0 min (Run 3).
Figure 47. Ostwald ripening for sorbet at 10 min (Run 1). 59
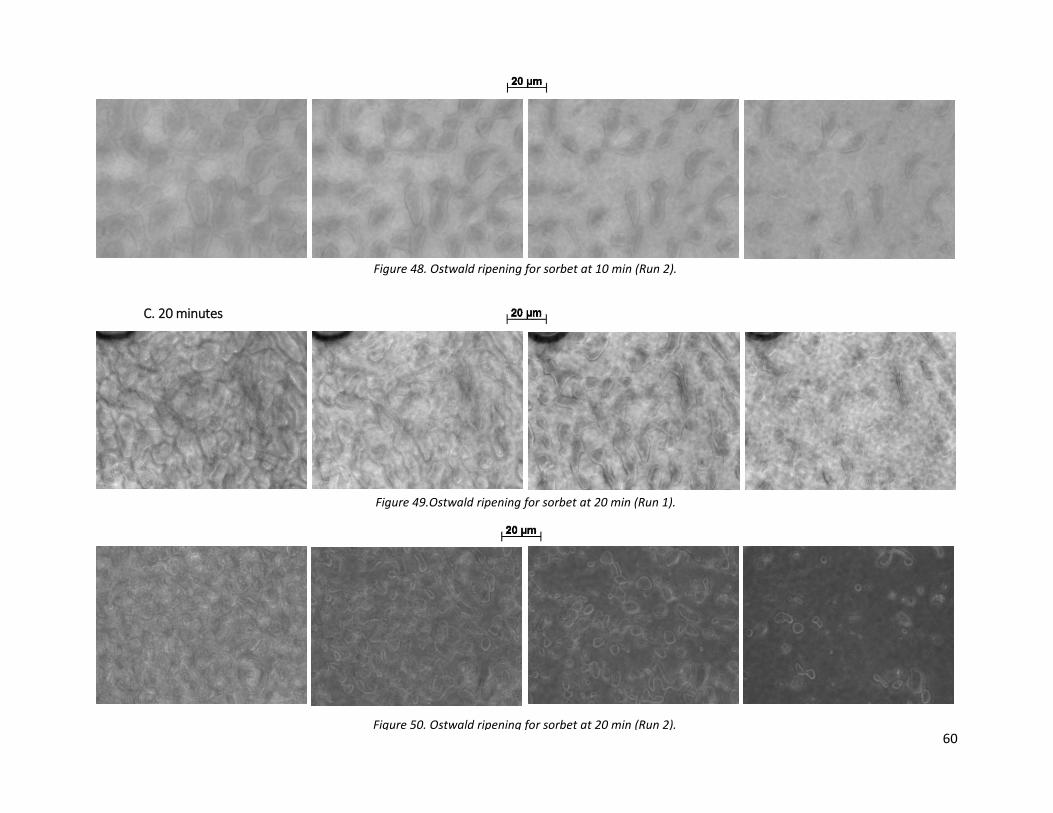
C. 20 minutes
Figure 50. Ostwald ripening for sorbet at 20 min (Run 2).
Figure 48. Ostwald ripening for sorbet at 10 min (Run 2).
Figure 49.Ostwald ripening for sorbet at 20 min (Run 1).
60
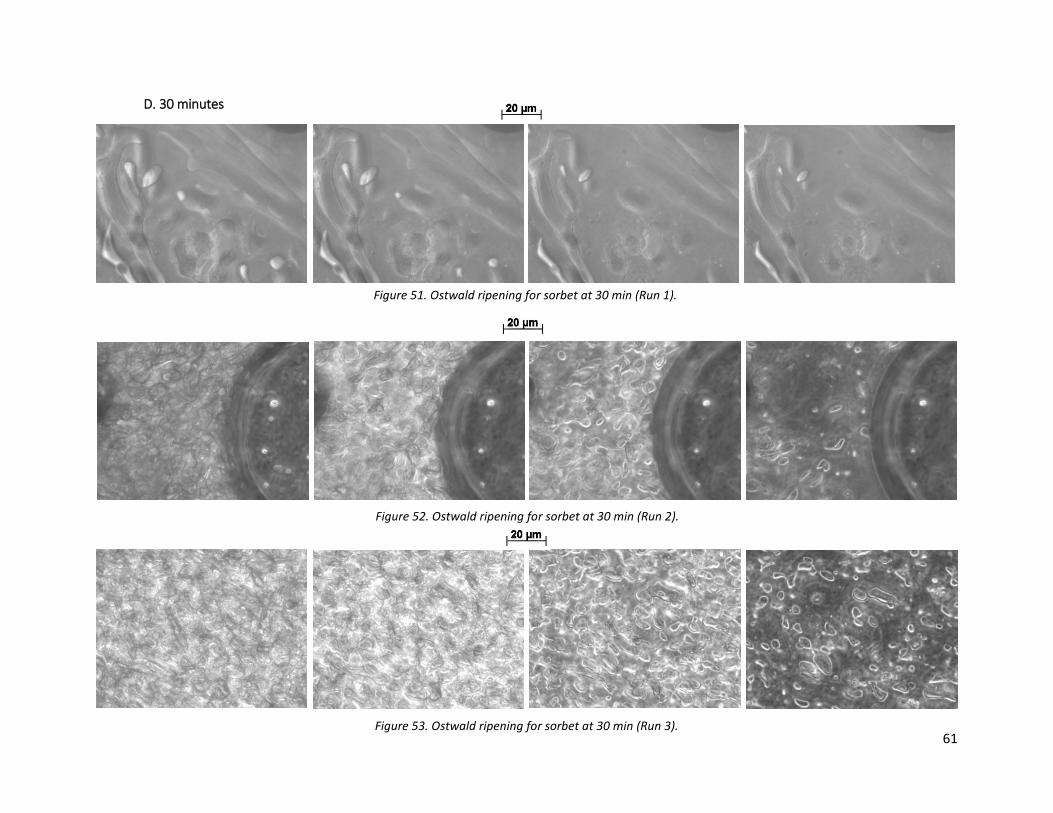
D. 30 minutes
Figure 51. Ostwald ripening for sorbet at 30 min (Run 1).
Figure 52. Ostwald ripening for sorbet at 30 min (Run 2).
Figure 53. Ostwald ripening for sorbet at 30 min (Run 3). 61
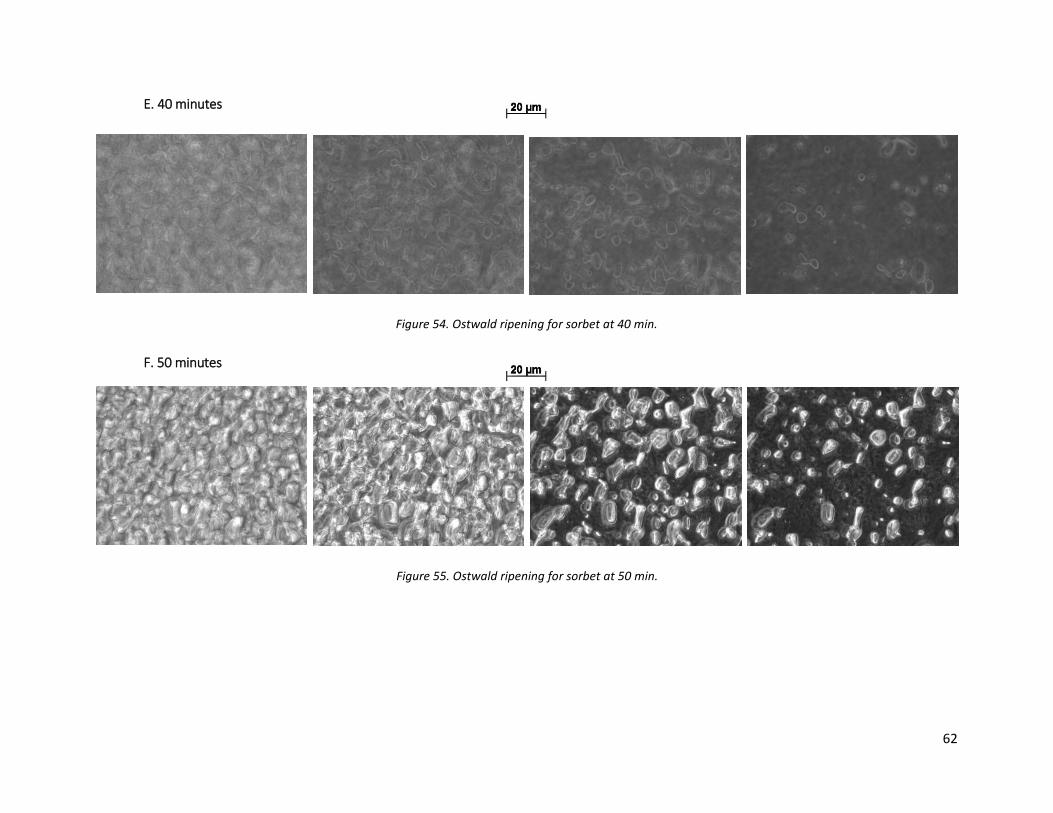
E. 40 minutes
F. 50 minutes
Figure 55. Ostwald ripening for sorbet at 50 min.
Figure 54. Ostwald ripening for sorbet at 40 min.
62
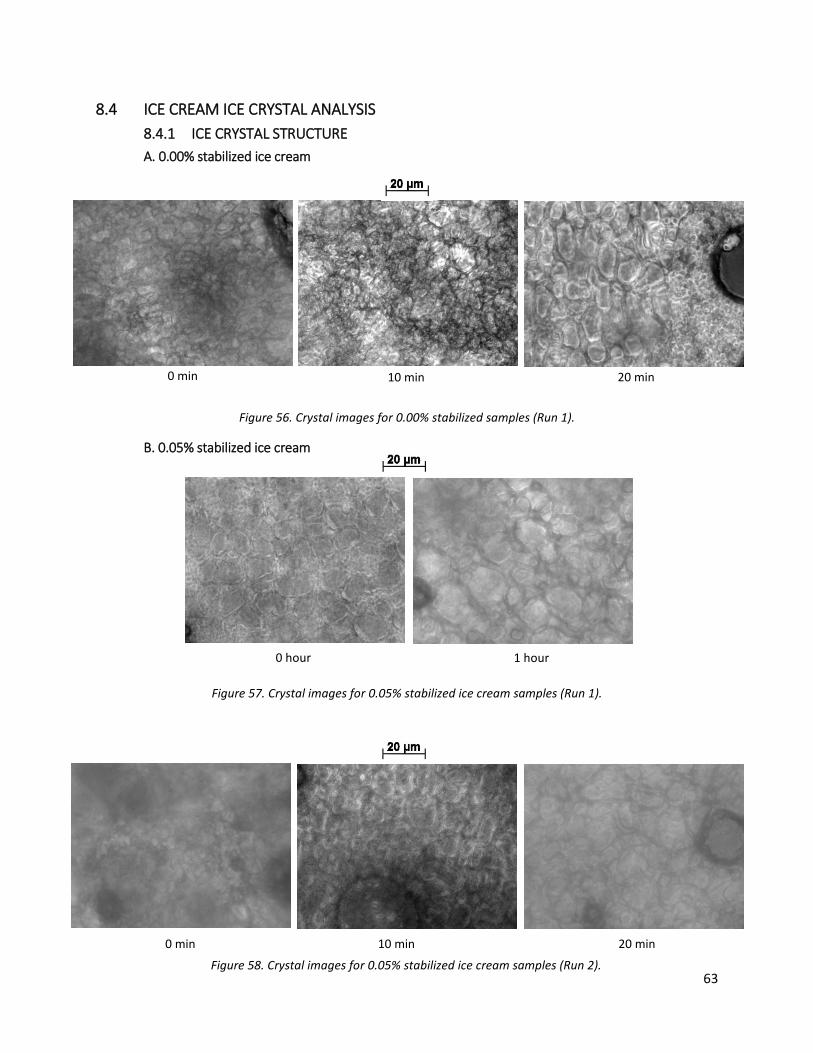
20 min 0 min 10 min
0 min 10 min 20 min Figure 58. Crystal images for 0.05% stabilized ice cream samples (Run 2).
0 hour 1 hour
8.4 ICE CREAM ICE CRYSTAL ANALYSIS 8.4.1 ICE CRYSTAL STRUCTURE A. 0.00% stabilized ice cream
Figure 56. Crystal images for 0.00% stabilized samples (Run 1).
B. 0.05% stabilized ice cream
Figure 57. Crystal images for 0.05% stabilized ice cream samples (Run 1).
63
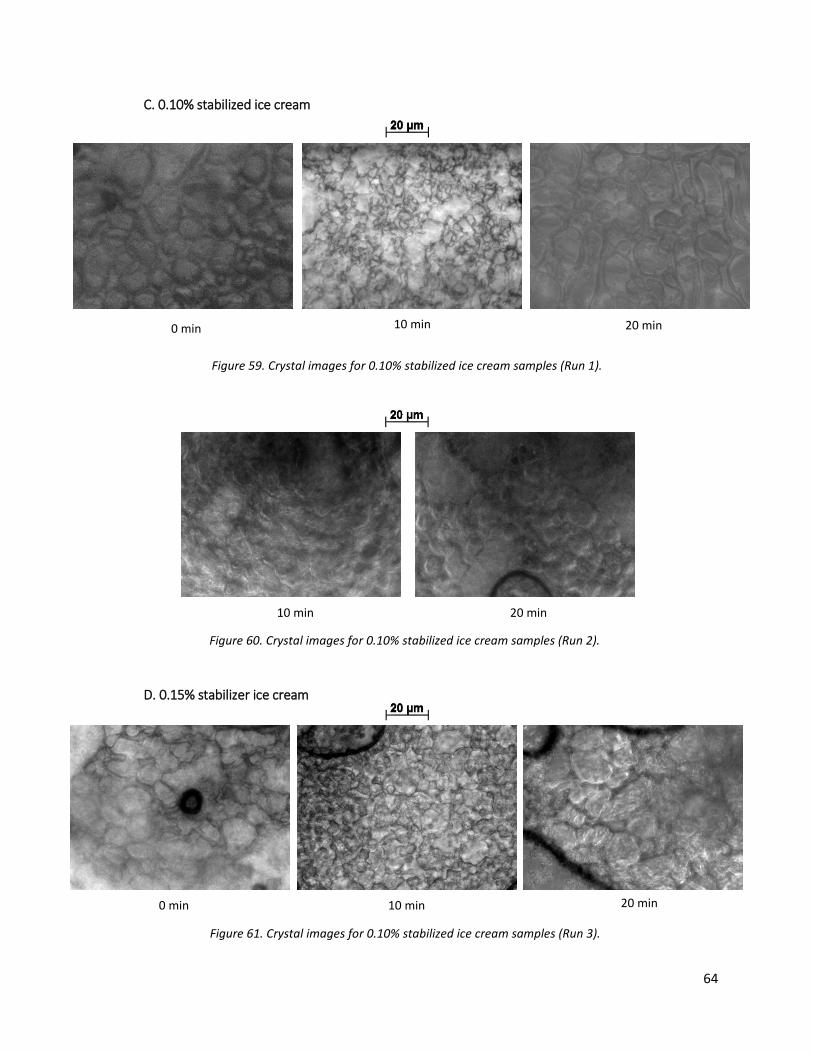
0 min 10 min 20 min
Figure 61. Crystal images for 0.10% stabilized ice cream samples (Run 3).
10 min 20 min
Figure 60. Crystal images for 0.10% stabilized ice cream samples (Run 2).
C. 0.10% stabilized ice cream
Figure 59. Crystal images for 0.10% stabilized ice cream samples (Run 1).
D. 0.15% stabilizer ice cream
0 min 10 min 20 min
64
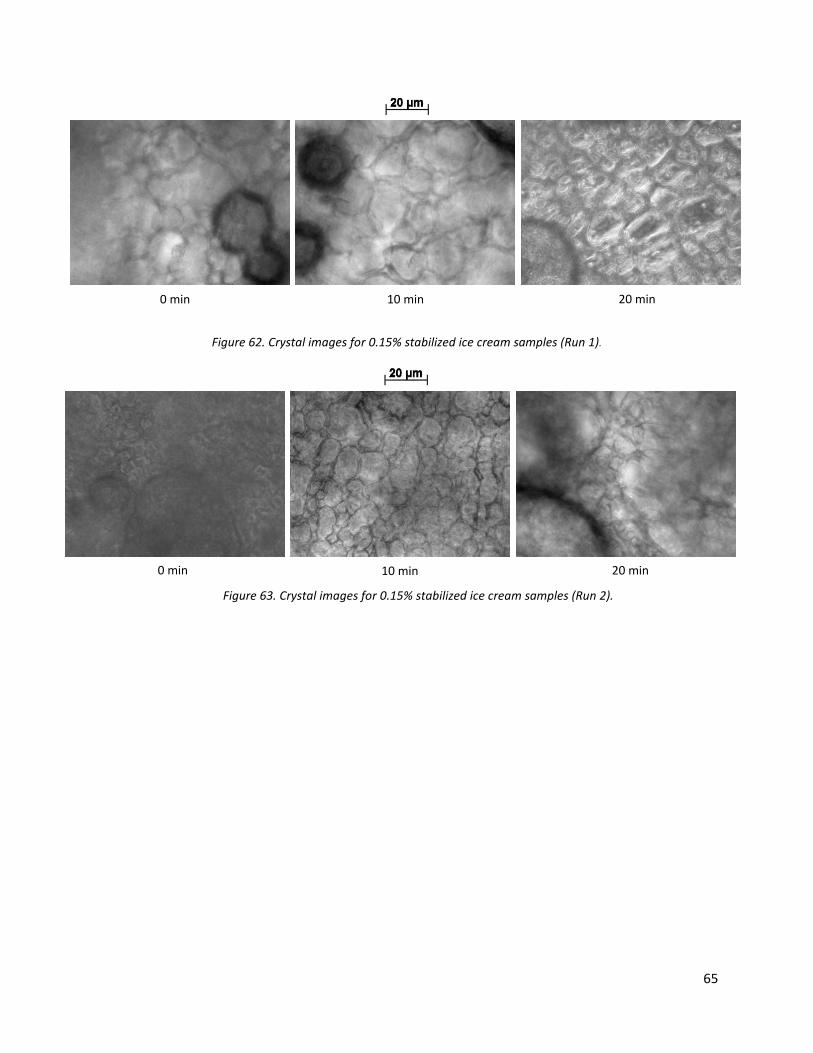
Figure 63. Crystal images for 0.15% stabilized ice cream samples (Run 2).
Figure 62. Crystal images for 0.15% stabilized ice cream samples (Run 1).
0 min 10 min 20 min
0 min 10 min 20 min
65
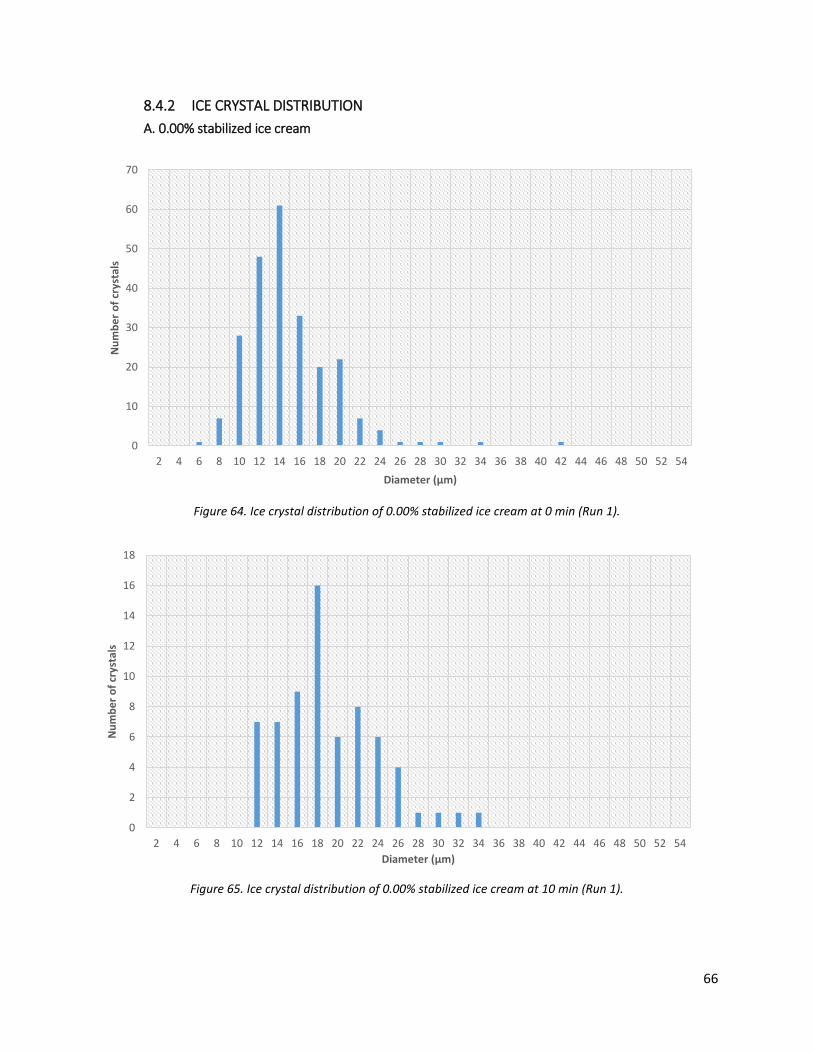
8.4.2 ICE CRYSTAL DISTRIBUTION A. 0.00% stabilized ice cream
Figure 64. Ice crystal distribution of 0.00% stabilized ice cream at 0 min (Run 1).
Figure 65. Ice crystal distribution of 0.00% stabilized ice cream at 10 min (Run 1).
0
10
20
30
40
50
60
70
2 4 6 8 10 12 14 16 18 20 22 24 26 28 30 32 34 36 38 40 42 44 46 48 50 52 54
Num
ber o
f cry
stal
s
Diameter (µm)
0
2
4
6
8
10
12
14
16
18
2 4 6 8 10 12 14 16 18 20 22 24 26 28 30 32 34 36 38 40 42 44 46 48 50 52 54
Num
ber o
f cry
stal
s
Diameter (µm)
66
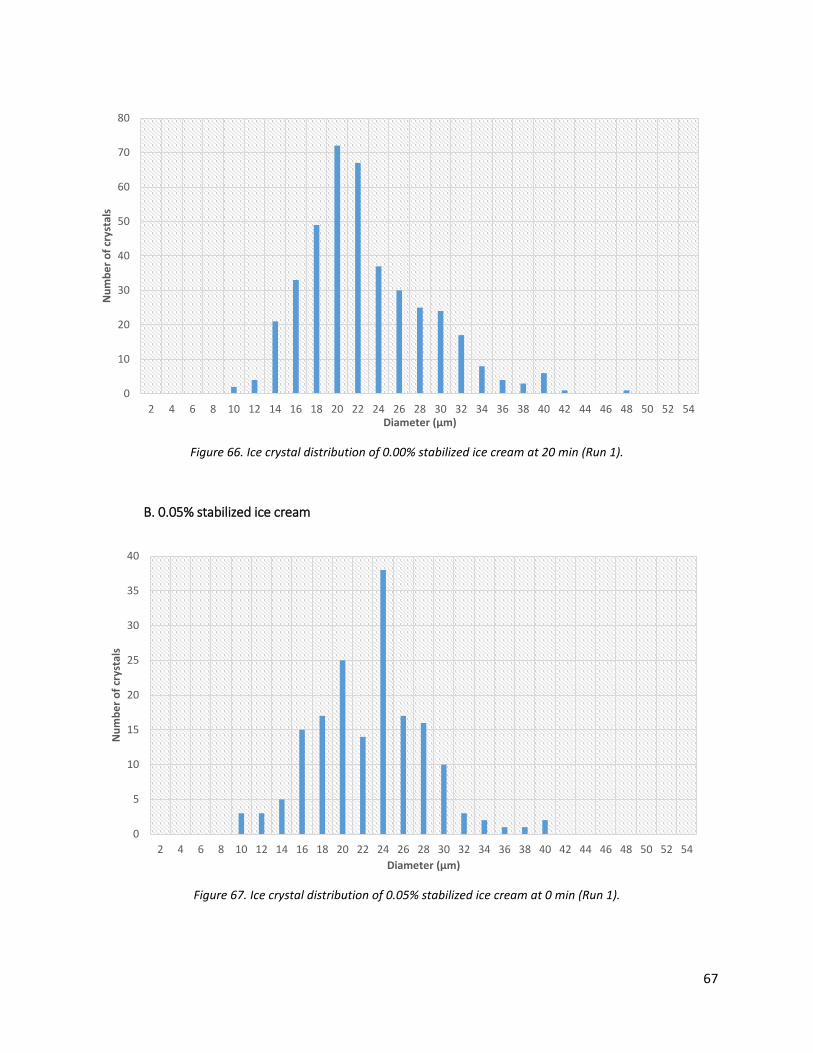
Figure 66. Ice crystal distribution of 0.00% stabilized ice cream at 20 min (Run 1).
B. 0.05% stabilized ice cream
Figure 67. Ice crystal distribution of 0.05% stabilized ice cream at 0 min (Run 1).
0
10
20
30
40
50
60
70
80
2 4 6 8 10 12 14 16 18 20 22 24 26 28 30 32 34 36 38 40 42 44 46 48 50 52 54
Num
ber o
f cry
stal
s
Diameter (µm)
0
5
10
15
20
25
30
35
40
2 4 6 8 10 12 14 16 18 20 22 24 26 28 30 32 34 36 38 40 42 44 46 48 50 52 54
Num
ber o
f cry
stal
s
Diameter (µm)
67
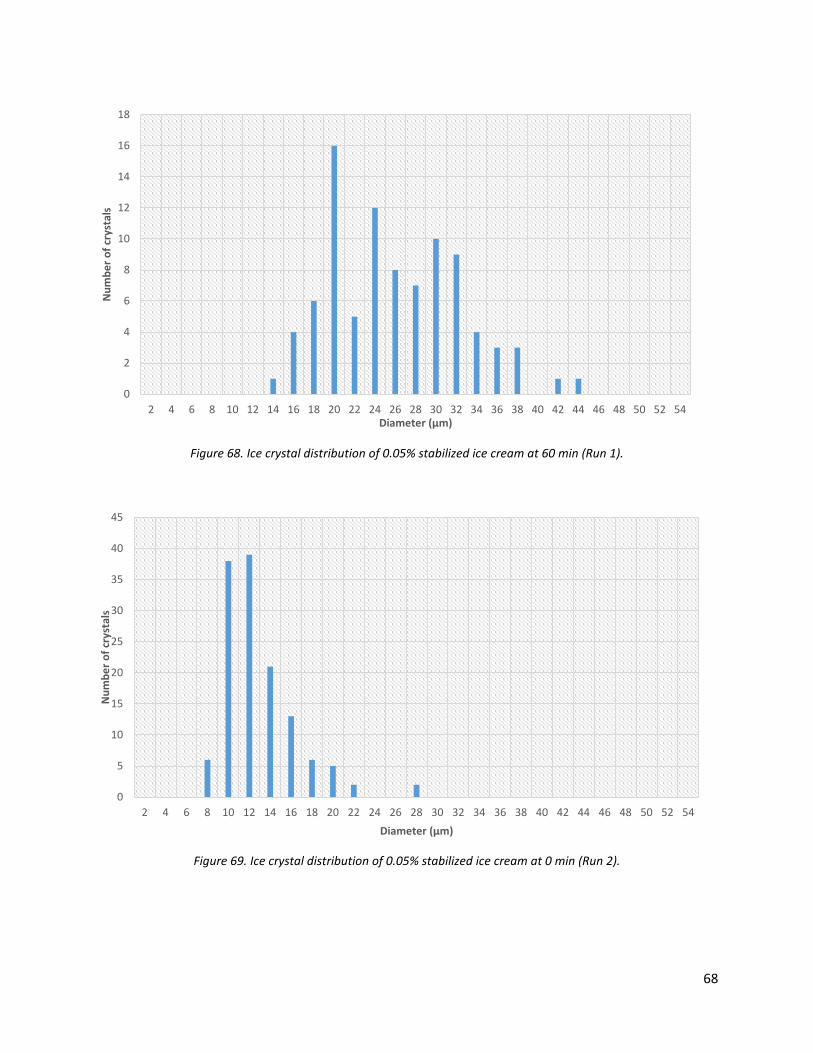
Figure 68. Ice crystal distribution of 0.05% stabilized ice cream at 60 min (Run 1).
Figure 69. Ice crystal distribution of 0.05% stabilized ice cream at 0 min (Run 2).
0
2
4
6
8
10
12
14
16
18
2 4 6 8 10 12 14 16 18 20 22 24 26 28 30 32 34 36 38 40 42 44 46 48 50 52 54
Num
ber o
f cry
stal
s
Diameter (µm)
0
5
10
15
20
25
30
35
40
45
2 4 6 8 10 12 14 16 18 20 22 24 26 28 30 32 34 36 38 40 42 44 46 48 50 52 54
Num
ber o
f cry
stal
s
Diameter (µm)
68
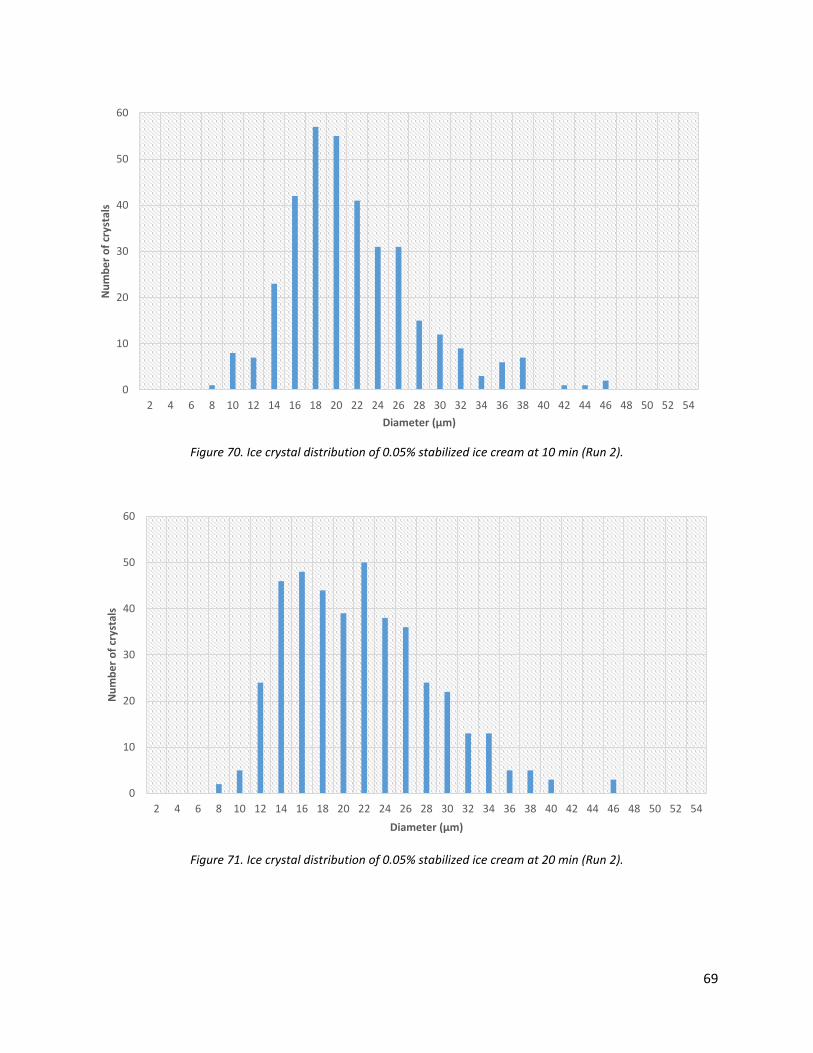
Figure 70. Ice crystal distribution of 0.05% stabilized ice cream at 10 min (Run 2).
Figure 71. Ice crystal distribution of 0.05% stabilized ice cream at 20 min (Run 2).
0
10
20
30
40
50
60
2 4 6 8 10 12 14 16 18 20 22 24 26 28 30 32 34 36 38 40 42 44 46 48 50 52 54
Num
ber o
f cry
stal
s
Diameter (µm)
0
10
20
30
40
50
60
2 4 6 8 10 12 14 16 18 20 22 24 26 28 30 32 34 36 38 40 42 44 46 48 50 52 54
Num
ber o
f cry
stal
s
Diameter (µm)
69
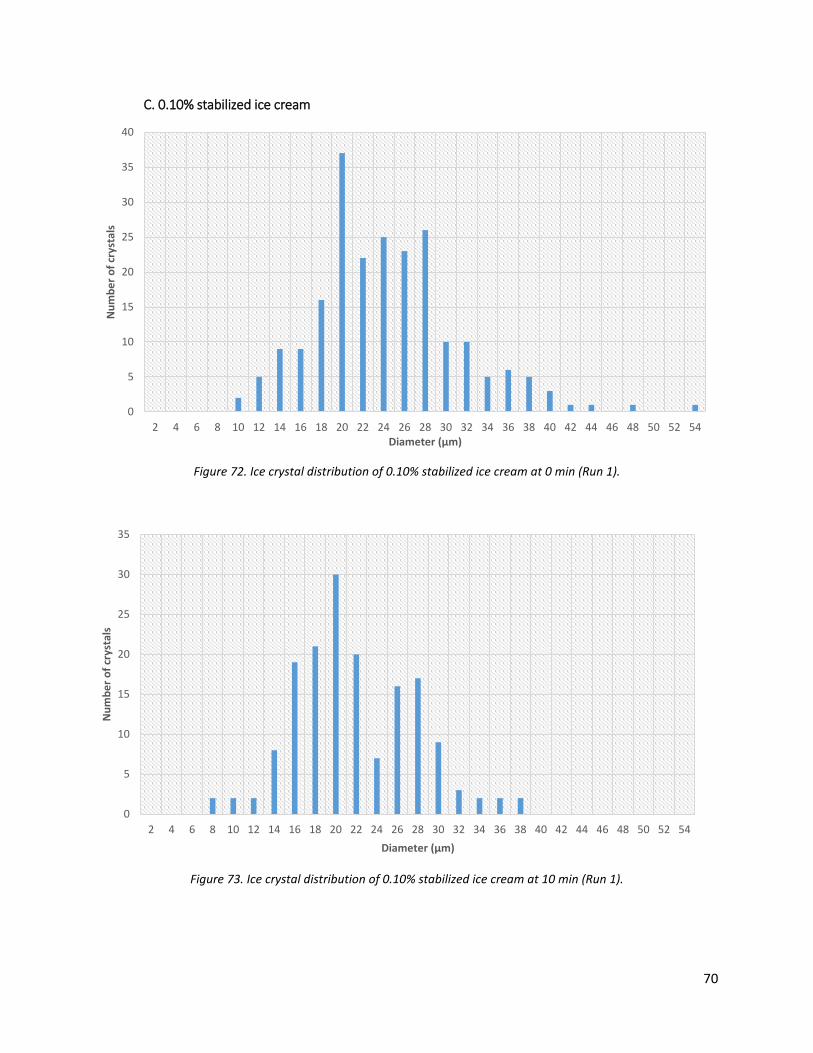
C. 0.10% stabilized ice cream
Figure 72. Ice crystal distribution of 0.10% stabilized ice cream at 0 min (Run 1).
Figure 73. Ice crystal distribution of 0.10% stabilized ice cream at 10 min (Run 1).
0
5
10
15
20
25
30
35
40
2 4 6 8 10 12 14 16 18 20 22 24 26 28 30 32 34 36 38 40 42 44 46 48 50 52 54
Num
ber o
f cry
stal
s
Diameter (µm)
0
5
10
15
20
25
30
35
2 4 6 8 10 12 14 16 18 20 22 24 26 28 30 32 34 36 38 40 42 44 46 48 50 52 54
Num
ber o
f cry
stal
s
Diameter (µm)
70
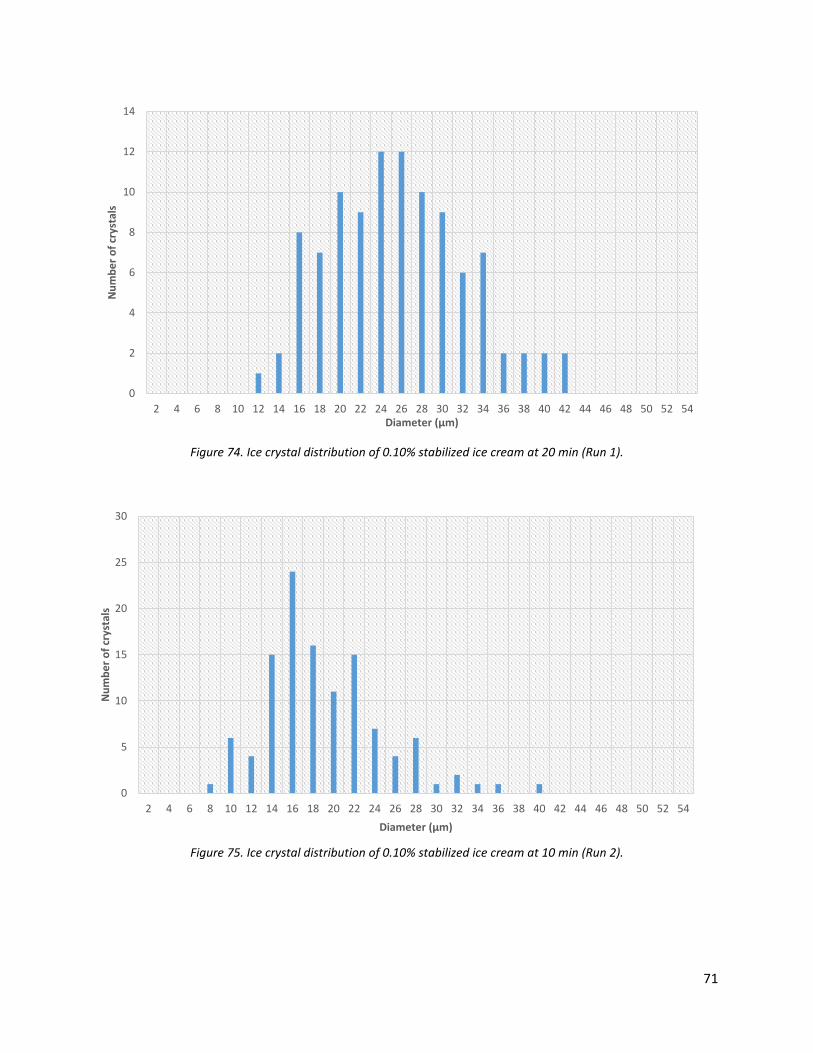
Figure 74. Ice crystal distribution of 0.10% stabilized ice cream at 20 min (Run 1).
Figure 75. Ice crystal distribution of 0.10% stabilized ice cream at 10 min (Run 2).
0
2
4
6
8
10
12
14
2 4 6 8 10 12 14 16 18 20 22 24 26 28 30 32 34 36 38 40 42 44 46 48 50 52 54
Num
ber o
f cry
stal
s
Diameter (µm)
71
0
5
10
15
20
25
30
2 4 6 8 10 12 14 16 18 20 22 24 26 28 30 32 34 36 38 40 42 44 46 48 50 52 54
Num
ber o
f cry
stal
s
Diameter (µm)
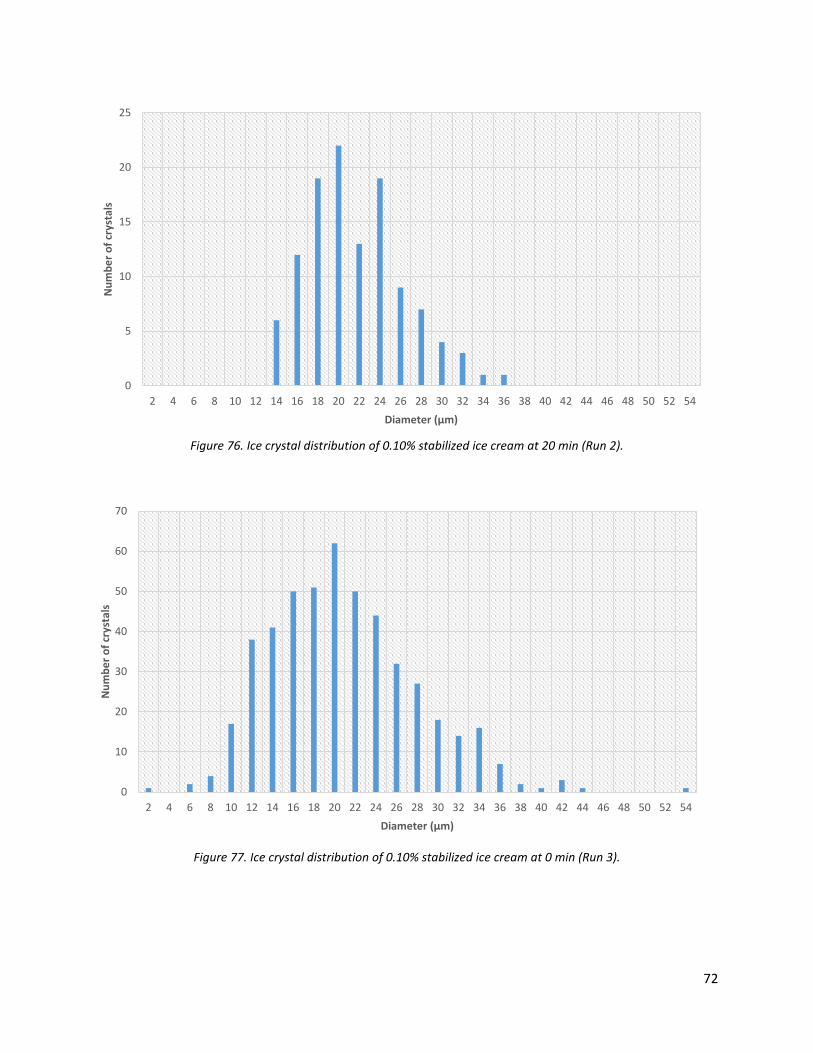
Figure 76. Ice crystal distribution of 0.10% stabilized ice cream at 20 min (Run 2).
0
5
10
15
20
25
2 4 6 8 10 12 14 16 18 20 22 24 26 28 30 32 34 36 38 40 42 44 46 48 50 52 54
Num
ber o
f cry
stal
s
Diameter (µm)
Figure 77. Ice crystal distribution of 0.10% stabilized ice cream at 0 min (Run 3).
0
10
20
30
40
50
60
70
2 4 6 8 10 12 14 16 18 20 22 24 26 28 30 32 34 36 38 40 42 44 46 48 50 52 54
Num
ber o
f cry
stal
s
Diameter (µm)
72
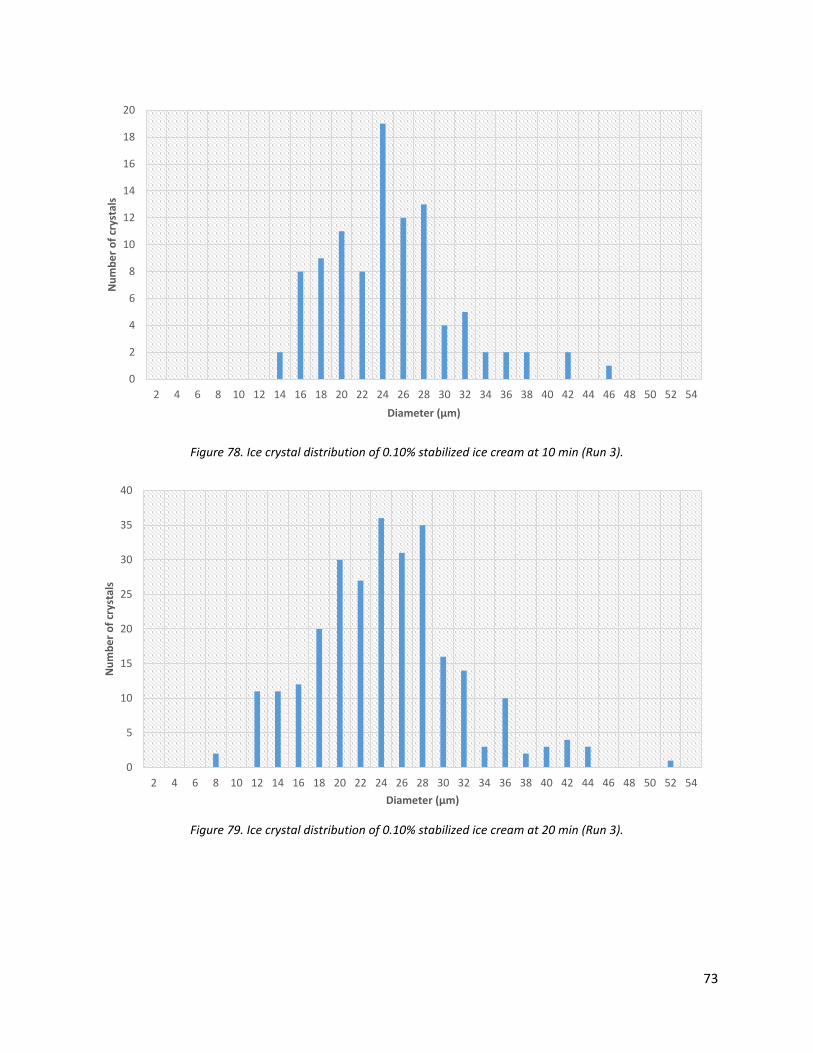
Figure 78. Ice crystal distribution of 0.10% stabilized ice cream at 10 min (Run 3).
Figure 79. Ice crystal distribution of 0.10% stabilized ice cream at 20 min (Run 3).
0
2
4
6
8
10
12
14
16
18
20
2 4 6 8 10 12 14 16 18 20 22 24 26 28 30 32 34 36 38 40 42 44 46 48 50 52 54
Num
ber o
f cry
stal
s
Diameter (µm)
0
5
10
15
20
25
30
35
40
2 4 6 8 10 12 14 16 18 20 22 24 26 28 30 32 34 36 38 40 42 44 46 48 50 52 54
Num
ber o
f cry
stal
s
Diameter (µm)
73
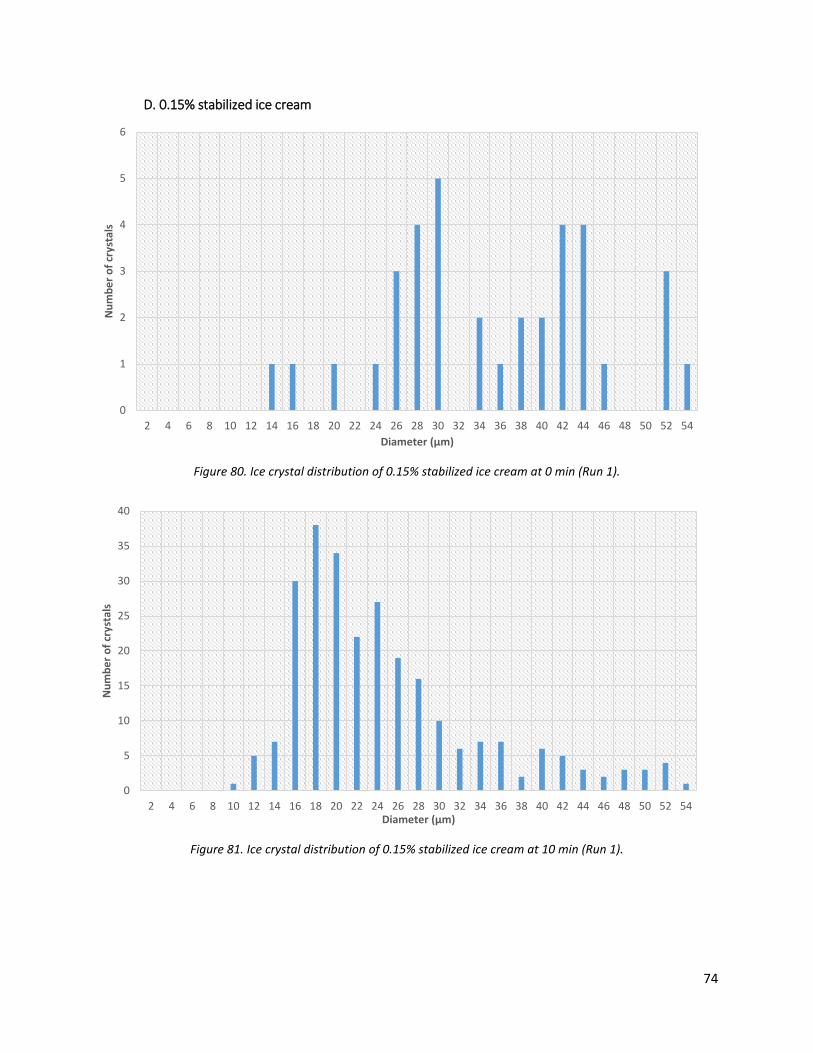
D. 0.15% stabilized ice cream
Figure 80. Ice crystal distribution of 0.15% stabilized ice cream at 0 min (Run 1).
Figure 81. Ice crystal distribution of 0.15% stabilized ice cream at 10 min (Run 1).
0
1
2
3
4
5
6
2 4 6 8 10 12 14 16 18 20 22 24 26 28 30 32 34 36 38 40 42 44 46 48 50 52 54
Num
ber o
f cry
stal
s
Diameter (µm)
0
5
10
15
20
25
30
35
40
2 4 6 8 10 12 14 16 18 20 22 24 26 28 30 32 34 36 38 40 42 44 46 48 50 52 54
Num
ber o
f cry
stal
s
Diameter (µm)
74
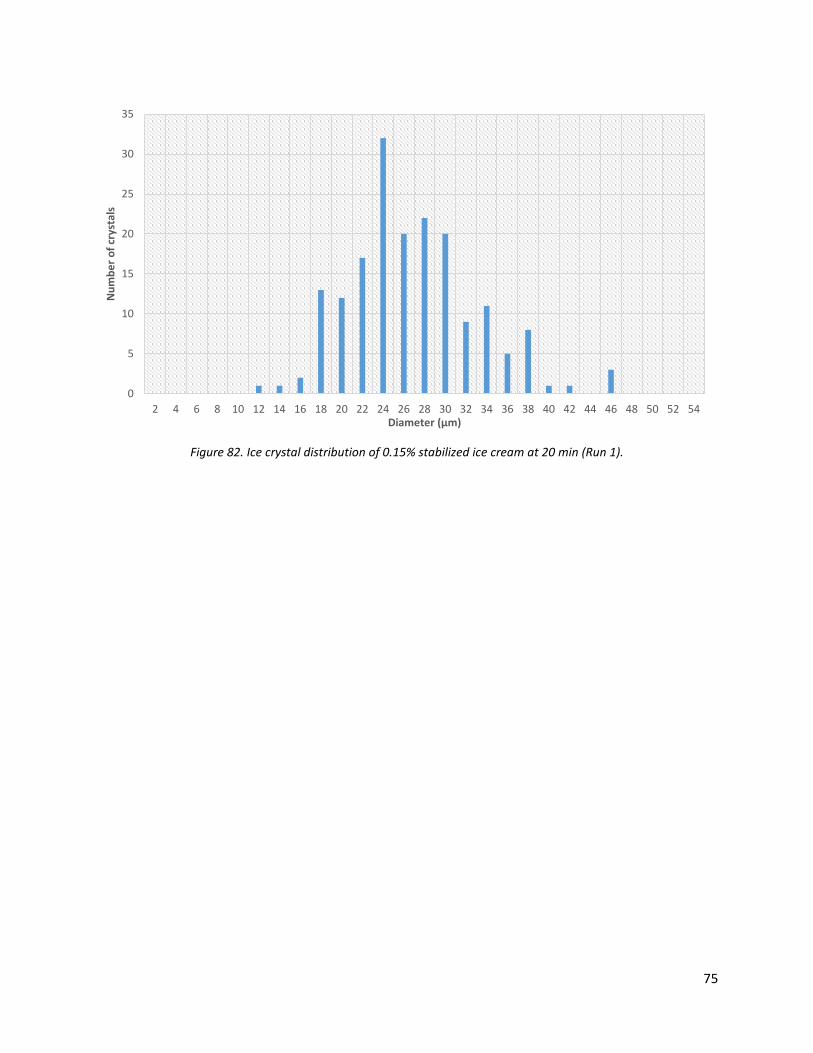
Figure 82. Ice crystal distribution of 0.15% stabilized ice cream at 20 min (Run 1).
0
5
10
15
20
25
30
35
2 4 6 8 10 12 14 16 18 20 22 24 26 28 30 32 34 36 38 40 42 44 46 48 50 52 54
Num
ber o
f cry
stal
s
Diameter (µm)
75
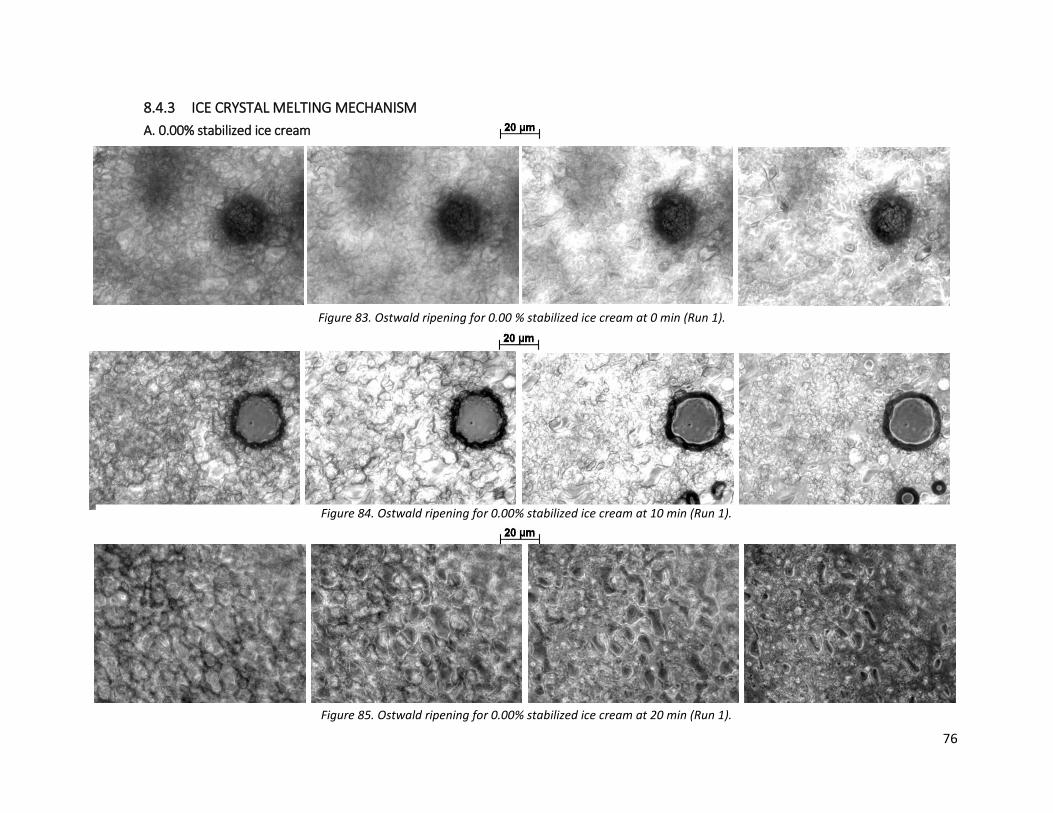
8.4.3 ICE CRYSTAL MELTING MECHANISM A. 0.00% stabilized ice cream
Figure 83. Ostwald ripening for 0.00 % stabilized ice cream at 0 min (Run 1).
Figure 84. Ostwald ripening for 0.00% stabilized ice cream at 10 min (Run 1).
Figure 85. Ostwald ripening for 0.00% stabilized ice cream at 20 min (Run 1).
76
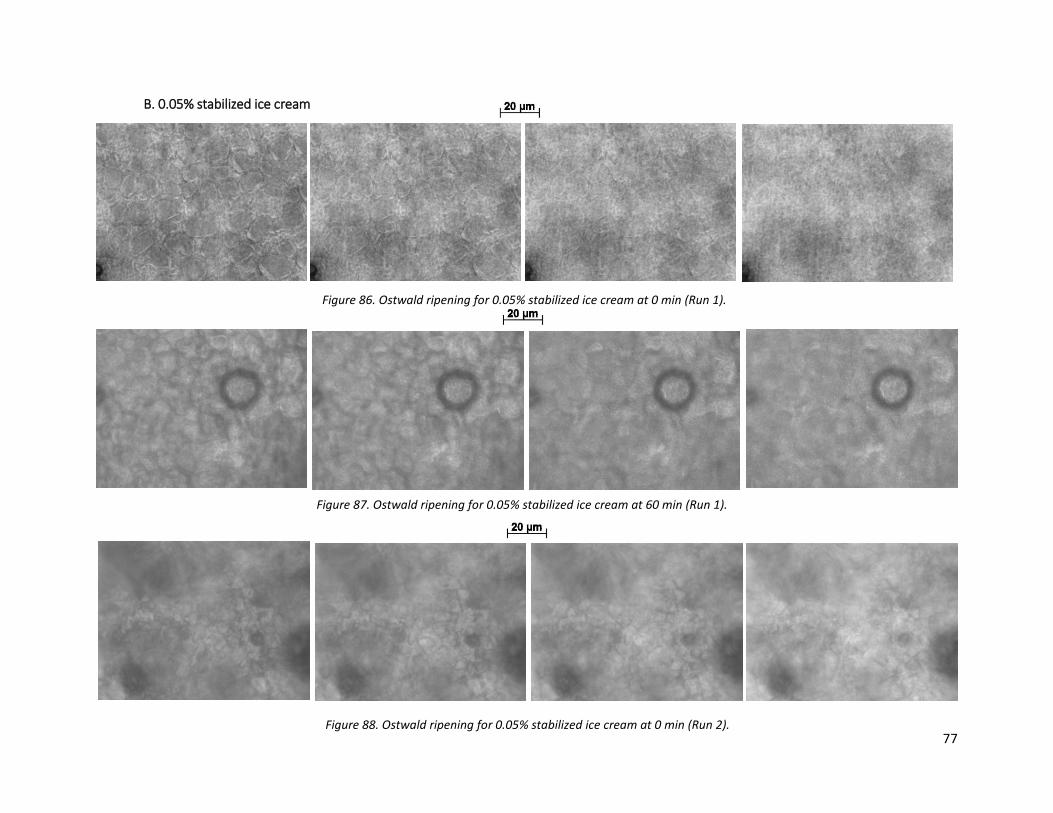
Figure 87. Ostwald ripening for 0.05% stabilized ice cream at 60 min (Run 1).
B. 0.05% stabilized ice cream
Figure 86. Ostwald ripening for 0.05% stabilized ice cream at 0 min (Run 1).
Figure 88. Ostwald ripening for 0.05% stabilized ice cream at 0 min (Run 2). 77
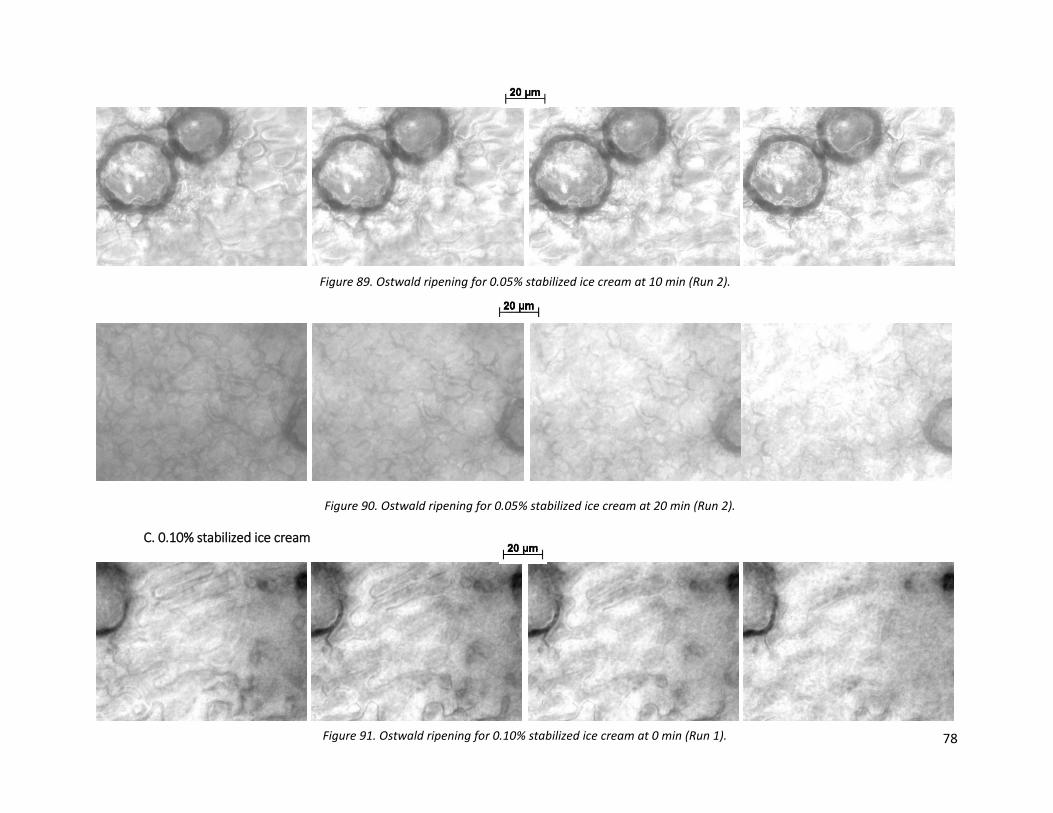
C. 0.10% stabilized ice cream
Figure 91. Ostwald ripening for 0.10% stabilized ice cream at 0 min (Run 1).
Figure 89. Ostwald ripening for 0.05% stabilized ice cream at 10 min (Run 2).
Figure 90. Ostwald ripening for 0.05% stabilized ice cream at 20 min (Run 2).
78
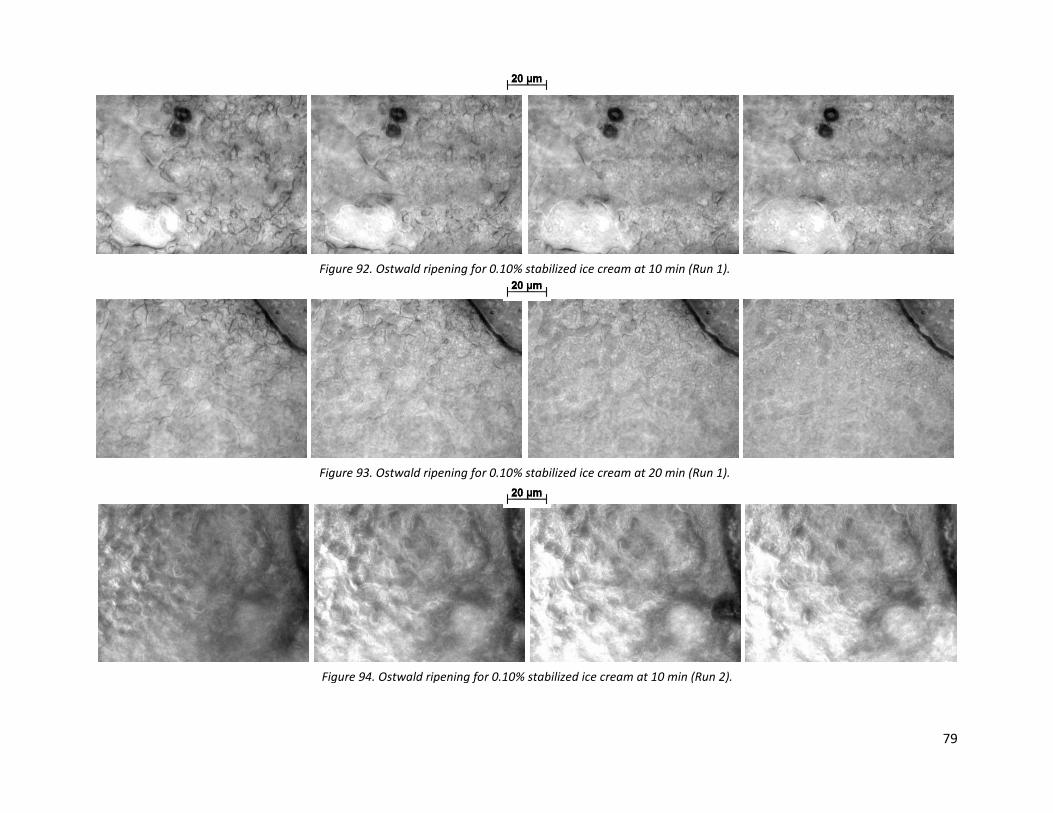
Figure 92. Ostwald ripening for 0.10% stabilized ice cream at 10 min (Run 1).
Figure 93. Ostwald ripening for 0.10% stabilized ice cream at 20 min (Run 1).
Figure 94. Ostwald ripening for 0.10% stabilized ice cream at 10 min (Run 2).
79
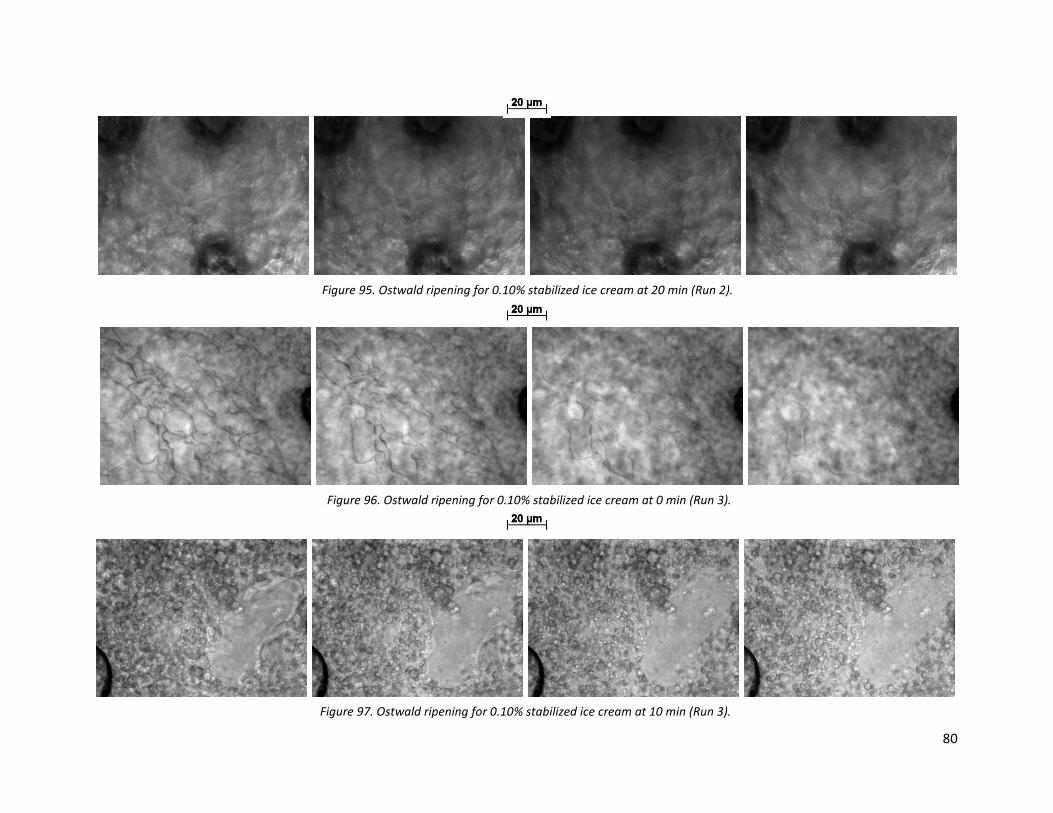
Figure 95. Ostwald ripening for 0.10% stabilized ice cream at 20 min (Run 2).
Figure 96. Ostwald ripening for 0.10% stabilized ice cream at 0 min (Run 3).
Figure 97. Ostwald ripening for 0.10% stabilized ice cream at 10 min (Run 3).
80
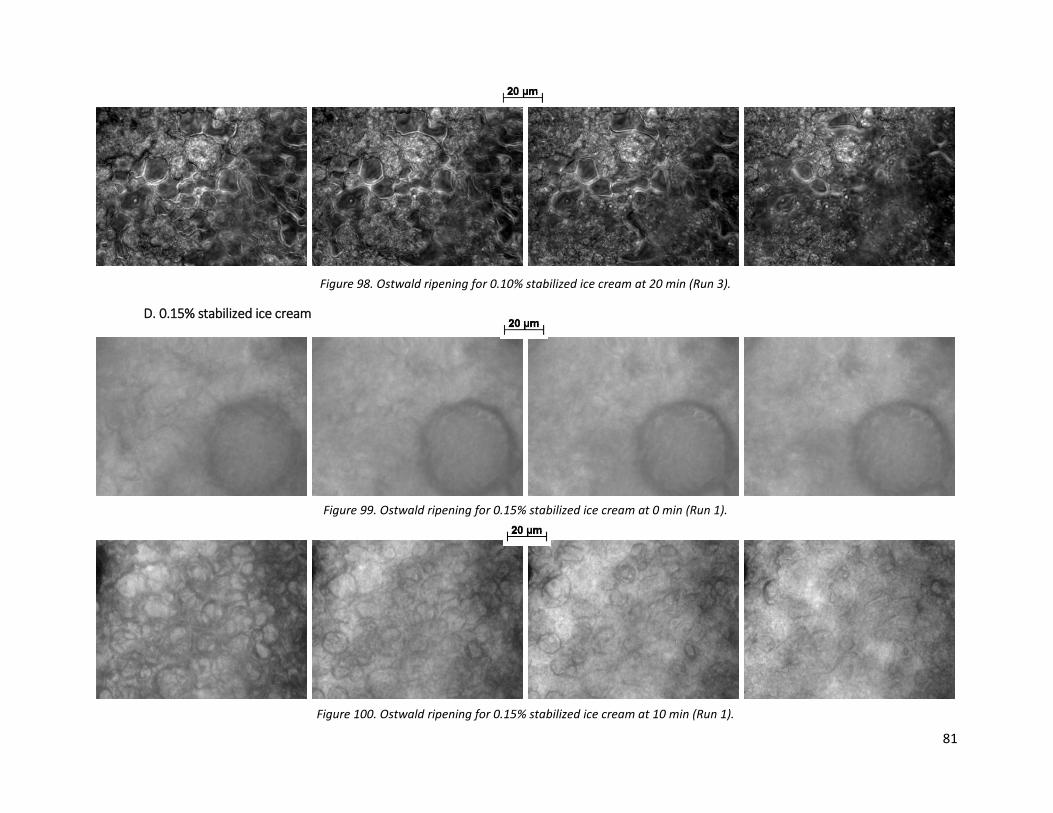
D. 0.15% stabilized ice cream
Figure 98. Ostwald ripening for 0.10% stabilized ice cream at 20 min (Run 3).
Figure 99. Ostwald ripening for 0.15% stabilized ice cream at 0 min (Run 1).
Figure 100. Ostwald ripening for 0.15% stabilized ice cream at 10 min (Run 1).
81
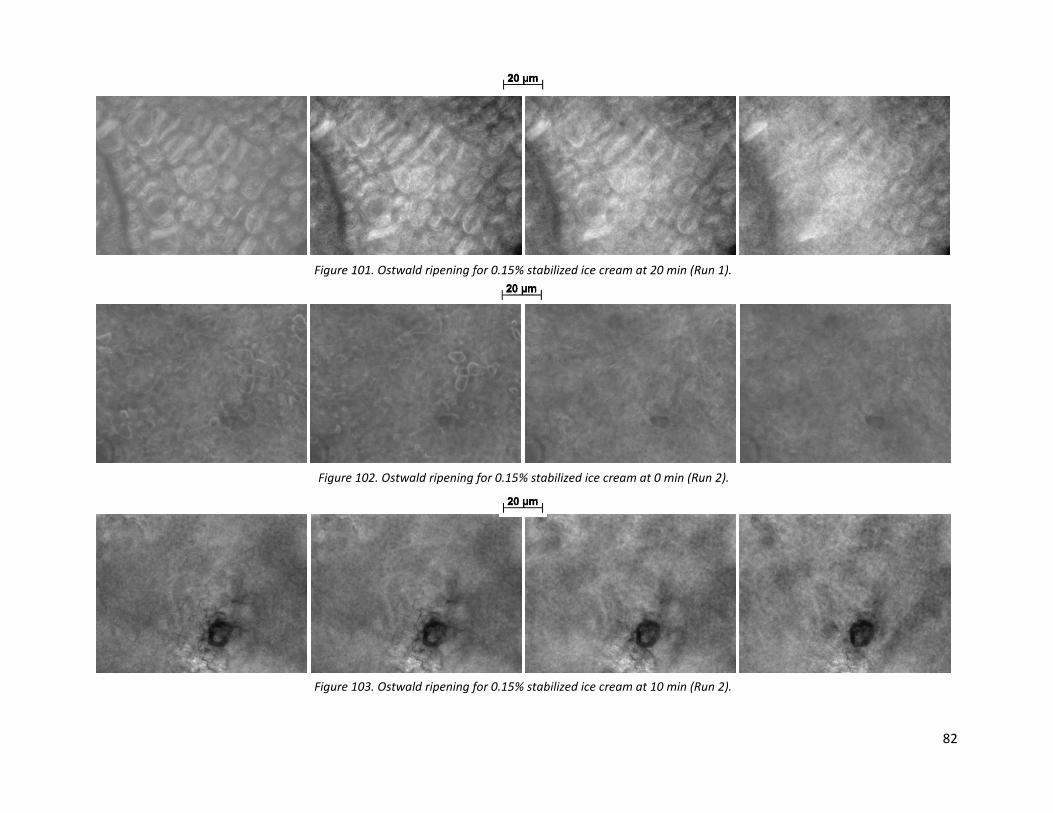
Figure 101. Ostwald ripening for 0.15% stabilized ice cream at 20 min (Run 1).
Figure 102. Ostwald ripening for 0.15% stabilized ice cream at 0 min (Run 2).
Figure 103. Ostwald ripening for 0.15% stabilized ice cream at 10 min (Run 2).
82
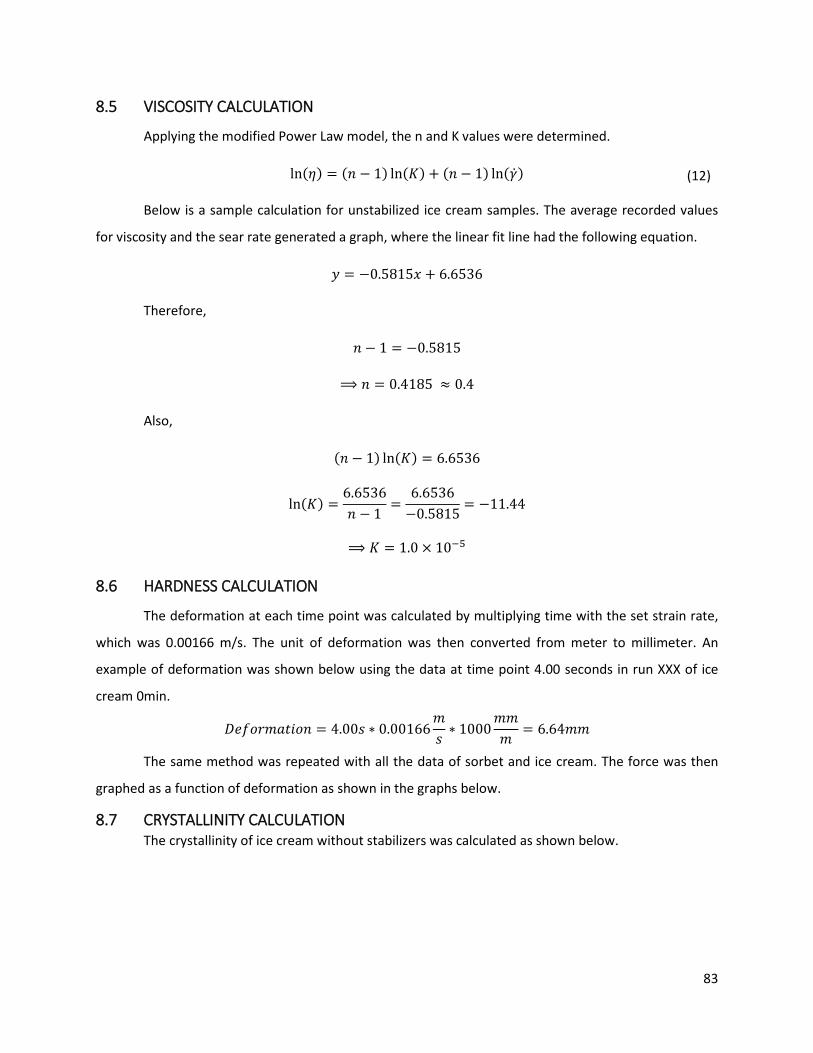
8.5 VISCOSITY CALCULATION
Applying the modified Power Law model, the n and K values were determined.
ln(𝜂𝜂) = (𝑂𝑂 − 1) ln(𝐾𝐾) + (𝑂𝑂 − 1) ln(�̇�𝛾)
Below is a sample calculation for unstabilized ice cream samples. The average recorded values
for viscosity and the sear rate generated a graph, where the linear fit line had the following equation.
𝐶𝐶 = −0.5815𝑚𝑚 + 6.6536
Therefore,
𝑂𝑂 − 1 = −0.5815
⟹ 𝑂𝑂 = 0.4185 ≈ 0.4
Also,
(𝑂𝑂 − 1) ln(𝐾𝐾) = 6.6536
ln(𝐾𝐾) =6.6536𝑂𝑂 − 1
=6.6536−0.5815
= −11.44
⟹𝐾𝐾 = 1.0 × 10⁻⁵
8.6 HARDNESS CALCULATION
The deformation at each time point was calculated by multiplying time with the set strain rate,
which was 0.00166 m/s. The unit of deformation was then converted from meter to millimeter. An
example of deformation was shown below using the data at time point 4.00 seconds in run XXX of ice
cream 0min.
𝐷𝐷𝑂𝑂𝑜𝑜𝑙𝑙𝑟𝑟𝑐𝑐𝑐𝑐𝑡𝑡𝑤𝑤𝑙𝑙𝑂𝑂 = 4.00𝑒𝑒 ∗ 0.00166𝑐𝑐𝑒𝑒∗ 1000
𝑐𝑐𝑐𝑐𝑐𝑐
= 6.64𝑐𝑐𝑐𝑐
The same method was repeated with all the data of sorbet and ice cream. The force was then
graphed as a function of deformation as shown in the graphs below.
8.7 CRYSTALLINITY CALCULATION The crystallinity of ice cream without stabilizers was calculated as shown below.
(12)
83
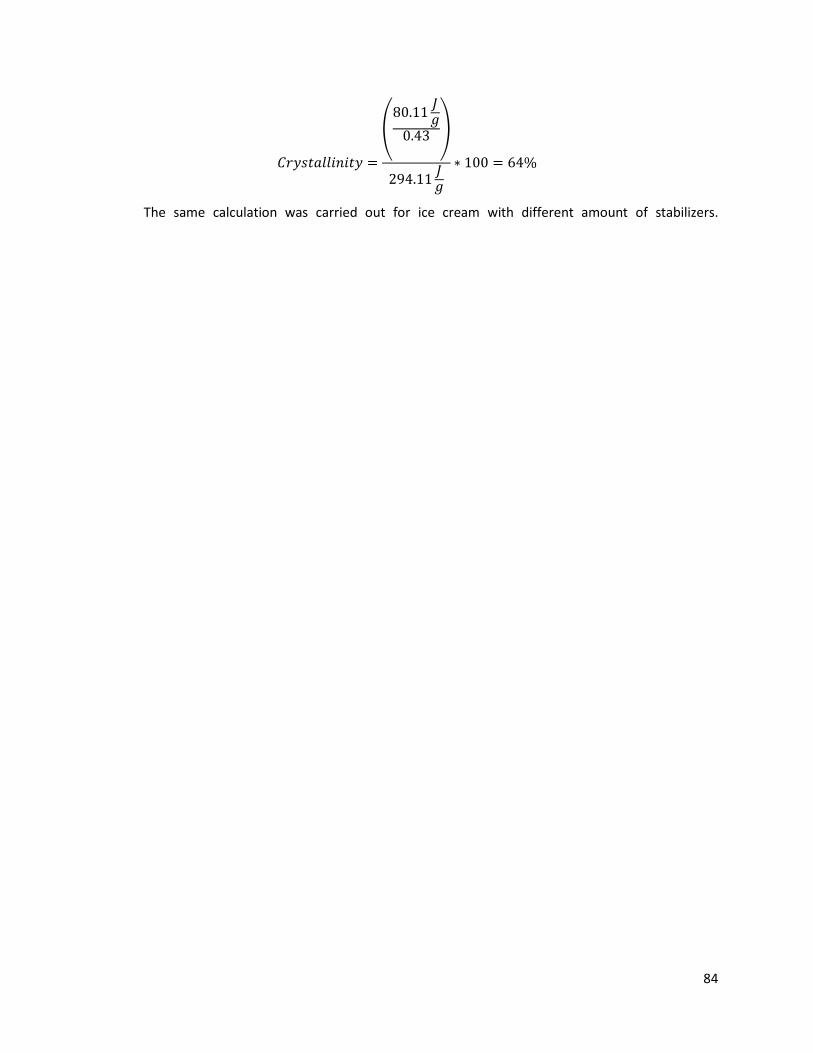
𝐶𝐶𝑟𝑟𝐶𝐶𝑒𝑒𝑡𝑡𝑐𝑐𝑙𝑙𝑙𝑙𝑤𝑤𝑂𝑂𝑤𝑤𝑡𝑡𝐶𝐶 =
�80.11 𝐽𝐽𝑙𝑙
0.43 �
294.11 𝐽𝐽𝑙𝑙∗ 100 = 64%
The same calculation was carried out for ice cream with different amount of stabilizers.
84
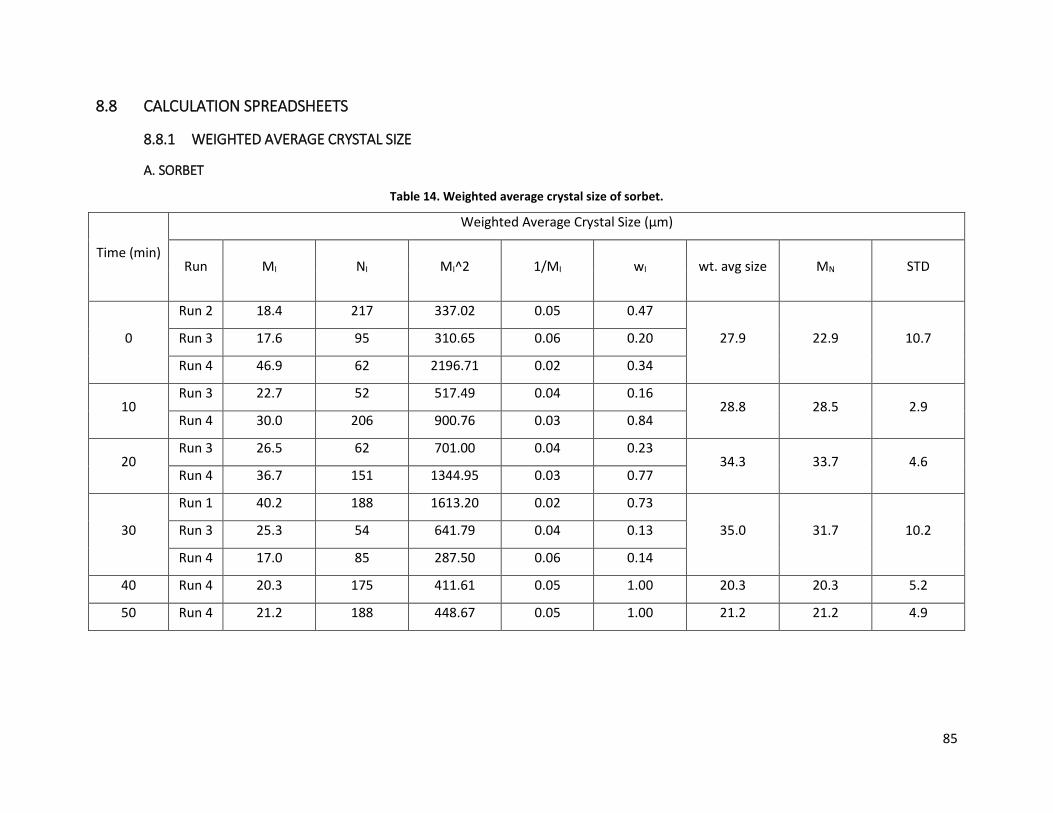
8.8 CALCULATION SPREADSHEETS
8.8.1 WEIGHTED AVERAGE CRYSTAL SIZE
A. SORBET
Table 14. Weighted average crystal size of sorbet.
Time (min)
Weighted Average Crystal Size (µm)
Run MI NI MI^2 1/MI wI wt. avg size MN STD
0
Run 2 18.4 217 337.02 0.05 0.47
27.9 22.9 10.7 Run 3 17.6 95 310.65 0.06 0.20
Run 4 46.9 62 2196.71 0.02 0.34
10 Run 3 22.7 52 517.49 0.04 0.16
28.8 28.5 2.9 Run 4 30.0 206 900.76 0.03 0.84
20 Run 3 26.5 62 701.00 0.04 0.23
34.3 33.7 4.6 Run 4 36.7 151 1344.95 0.03 0.77
30
Run 1 40.2 188 1613.20 0.02 0.73
35.0 31.7 10.2 Run 3 25.3 54 641.79 0.04 0.13
Run 4 17.0 85 287.50 0.06 0.14
40 Run 4 20.3 175 411.61 0.05 1.00 20.3 20.3 5.2
50 Run 4 21.2 188 448.67 0.05 1.00 21.2 21.2 4.9
85
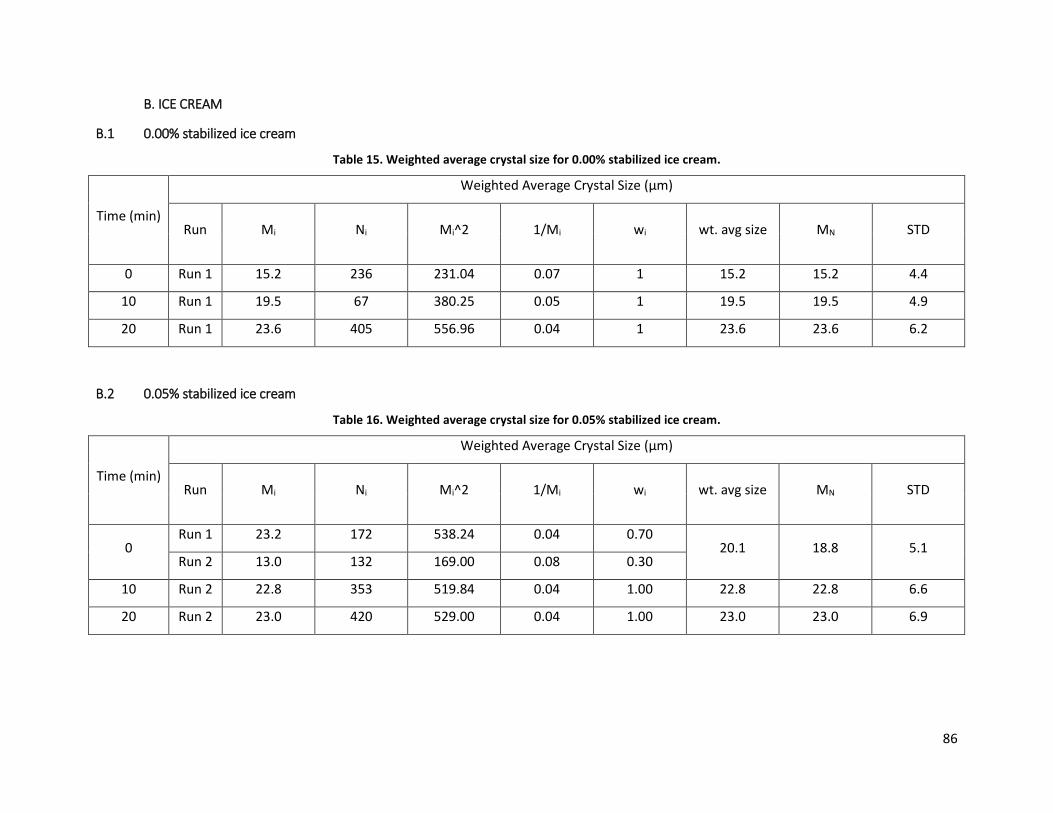
B. ICE CREAM
B.1 0.00% stabilized ice cream
Table 15. Weighted average crystal size for 0.00% stabilized ice cream.
Time (min)
Weighted Average Crystal Size (µm)
Run Mi Ni Mi^2 1/Mi wi wt. avg size MN STD
0 Run 1 15.2 236 231.04 0.07 1 15.2 15.2 4.4
10 Run 1 19.5 67 380.25 0.05 1 19.5 19.5 4.9
20 Run 1 23.6 405 556.96 0.04 1 23.6 23.6 6.2
B.2 0.05% stabilized ice cream
Table 16. Weighted average crystal size for 0.05% stabilized ice cream.
Time (min)
Weighted Average Crystal Size (µm)
Run Mi Ni Mi^2 1/Mi wi wt. avg size MN STD
0 Run 1 23.2 172 538.24 0.04 0.70
20.1 18.8 5.1 Run 2 13.0 132 169.00 0.08 0.30
10 Run 2 22.8 353 519.84 0.04 1.00 22.8 22.8 6.6
20 Run 2 23.0 420 529.00 0.04 1.00 23.0 23.0 6.9
86
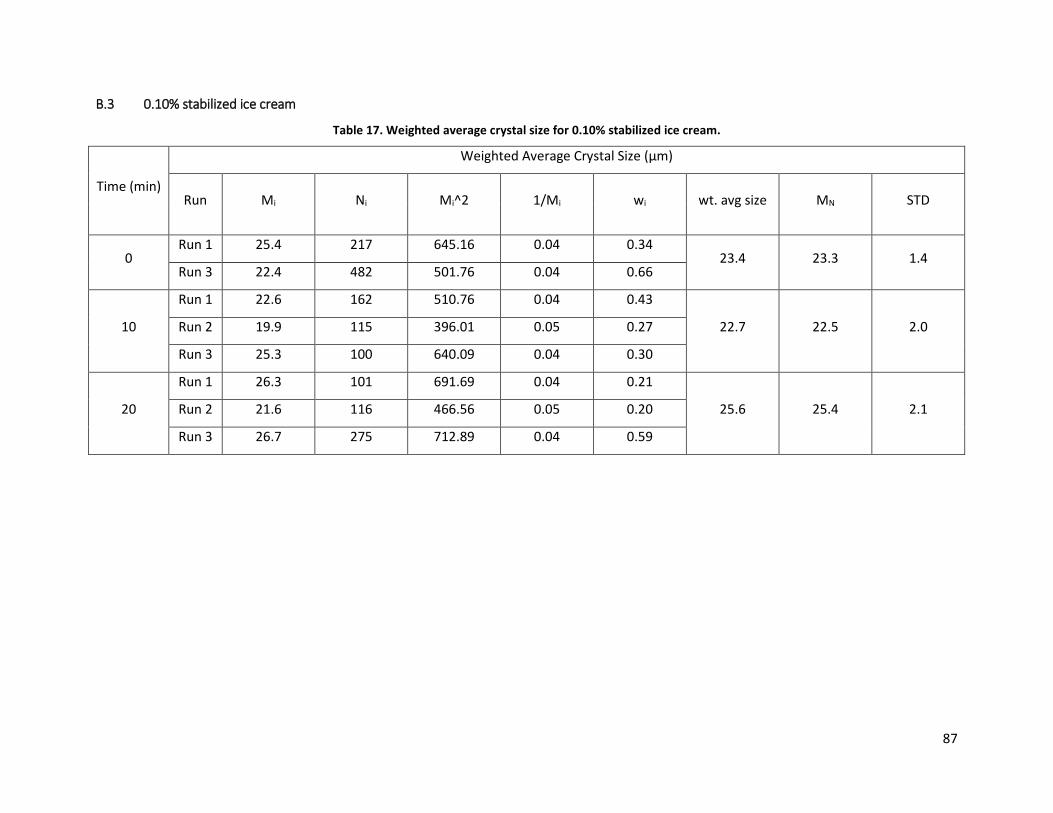
B.3 0.10% stabilized ice cream
Table 17. Weighted average crystal size for 0.10% stabilized ice cream.
Time (min)
Weighted Average Crystal Size (µm)
Run Mi Ni Mi^2 1/Mi wi wt. avg size MN STD
0 Run 1 25.4 217 645.16 0.04 0.34
23.4 23.3 1.4 Run 3 22.4 482 501.76 0.04 0.66
10
Run 1 22.6 162 510.76 0.04 0.43
22.7 22.5 2.0 Run 2 19.9 115 396.01 0.05 0.27
Run 3 25.3 100 640.09 0.04 0.30
20
Run 1 26.3 101 691.69 0.04 0.21
25.6 25.4 2.1 Run 2 21.6 116 466.56 0.05 0.20
Run 3 26.7 275 712.89 0.04 0.59
87
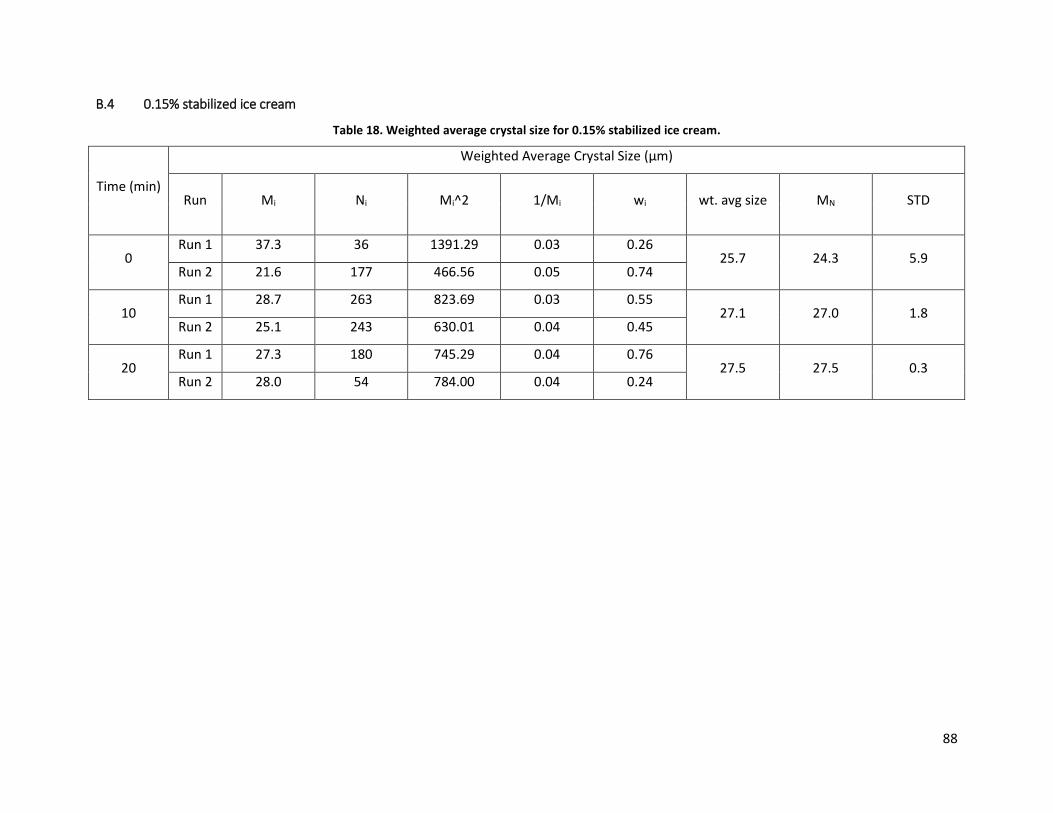
B.4 0.15% stabilized ice cream
Table 18. Weighted average crystal size for 0.15% stabilized ice cream.
Time (min)
Weighted Average Crystal Size (µm)
Run Mi Ni Mi^2 1/Mi wi wt. avg size MN STD
0 Run 1 37.3 36 1391.29 0.03 0.26
25.7 24.3 5.9 Run 2 21.6 177 466.56 0.05 0.74
10 Run 1 28.7 263 823.69 0.03 0.55
27.1 27.0 1.8 Run 2 25.1 243 630.01 0.04 0.45
20 Run 1 27.3 180 745.29 0.04 0.76
27.5 27.5 0.3 Run 2 28.0 54 784.00 0.04 0.24
88
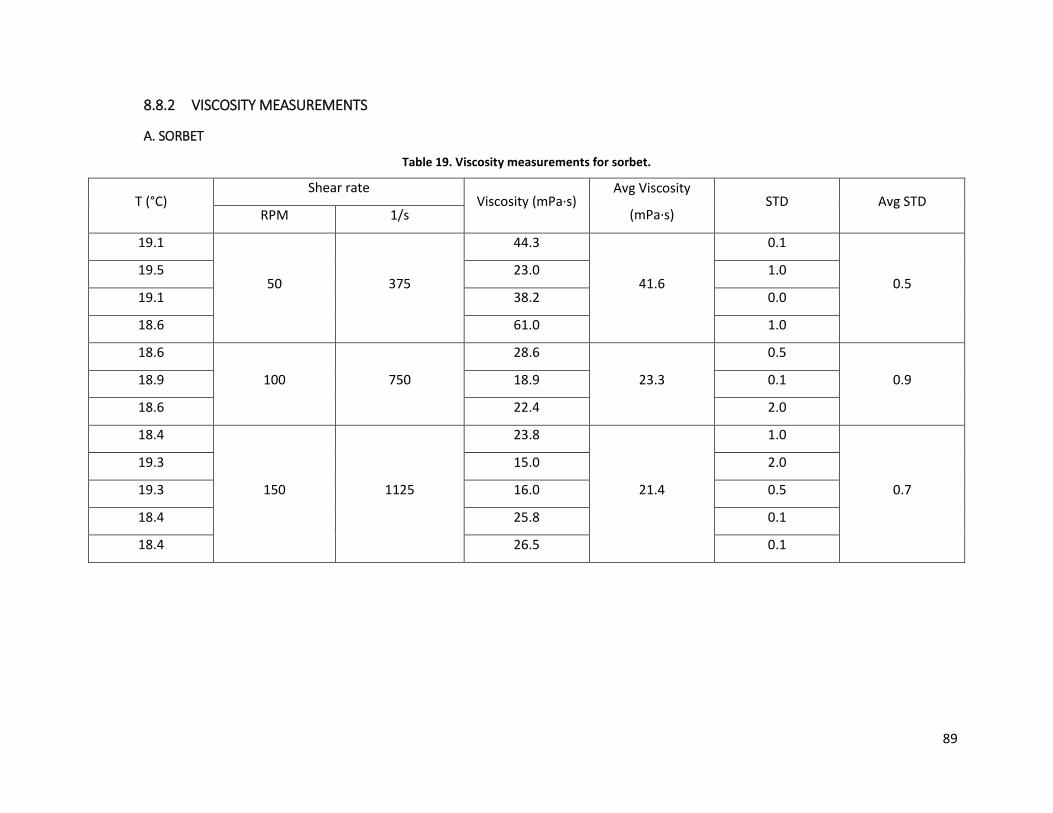
8.8.2 VISCOSITY MEASUREMENTS
A. SORBET
Table 19. Viscosity measurements for sorbet.
T (°C) Shear rate
Viscosity (mPa·s) Avg Viscosity
(mPa·s) STD Avg STD
RPM 1/s
19.1
50 375
44.3
41.6
0.1
0.5 19.5 23.0 1.0
19.1 38.2 0.0
18.6 61.0 1.0
18.6
100 750
28.6
23.3
0.5
0.9 18.9 18.9 0.1
18.6 22.4 2.0
18.4
150 1125
23.8
21.4
1.0
0.7
19.3 15.0 2.0
19.3 16.0 0.5
18.4 25.8 0.1
18.4 26.5 0.1
89
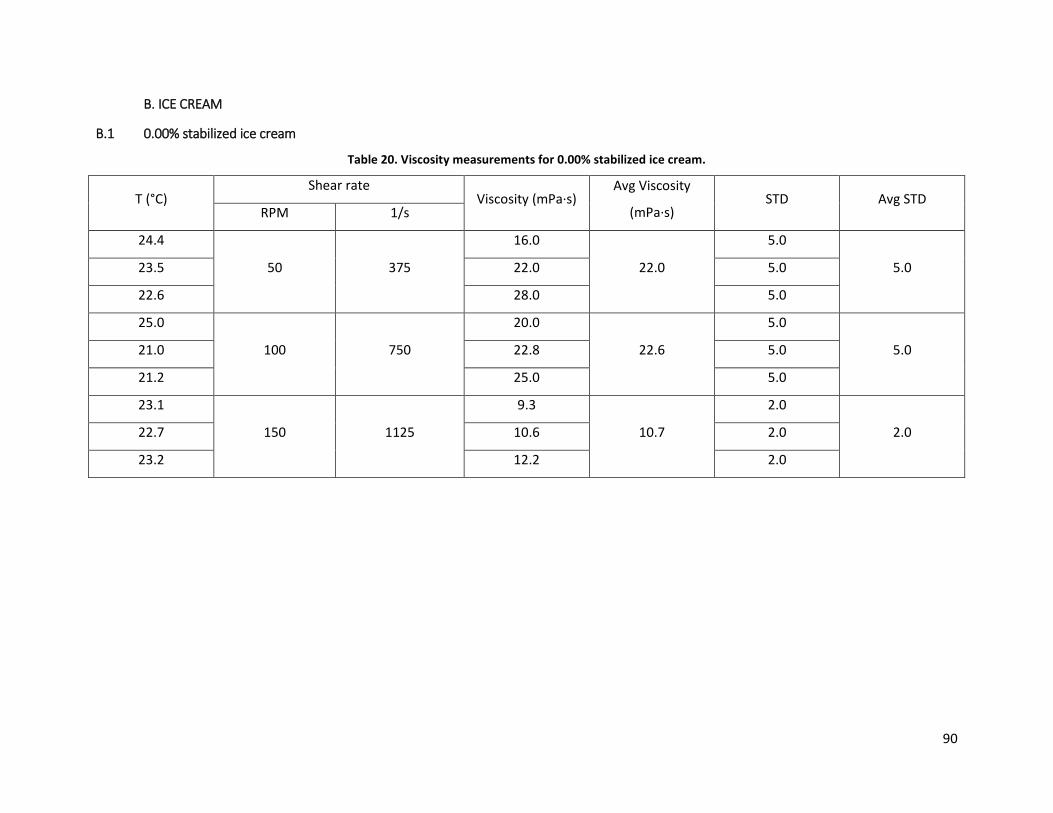
B. ICE CREAM
B.1 0.00% stabilized ice cream
Table 20. Viscosity measurements for 0.00% stabilized ice cream.
T (°C) Shear rate
Viscosity (mPa·s) Avg Viscosity
(mPa·s) STD Avg STD
RPM 1/s
24.4
50 375
16.0
22.0
5.0
5.0 23.5 22.0 5.0
22.6 28.0 5.0
25.0
100 750
20.0
22.6
5.0
5.0 21.0 22.8 5.0
21.2 25.0 5.0
23.1
150 1125
9.3
10.7
2.0
2.0 22.7 10.6 2.0
23.2 12.2 2.0
90
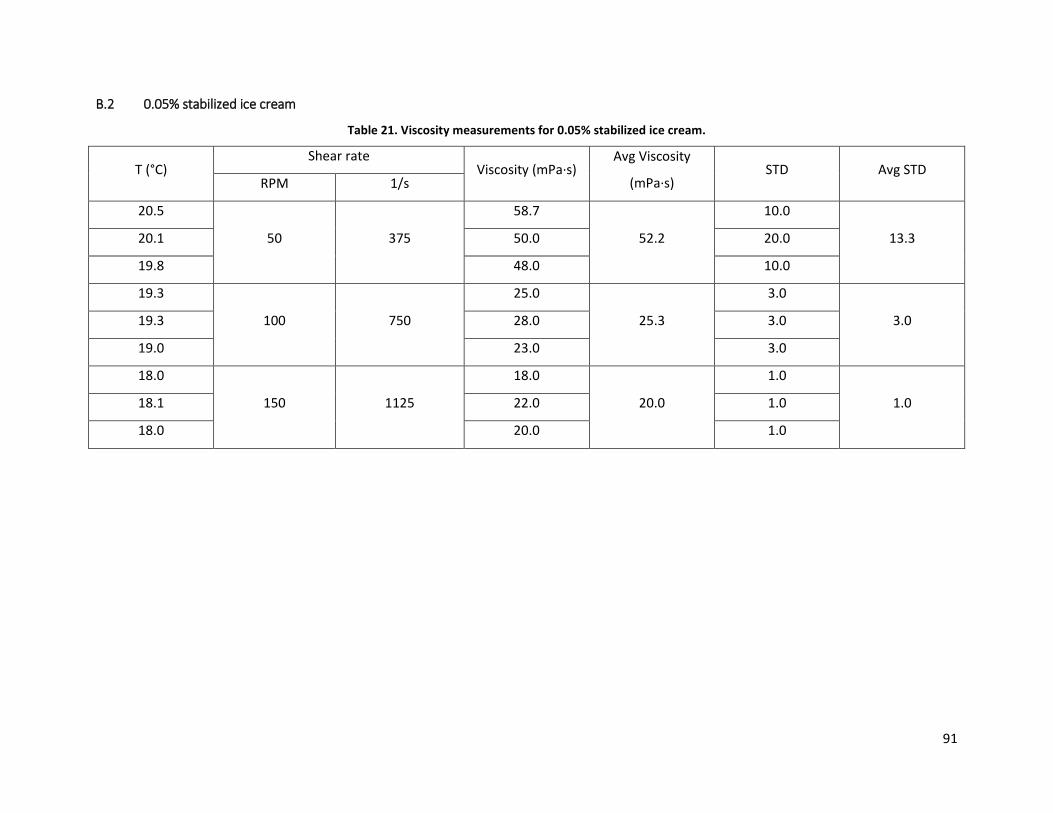
B.2 0.05% stabilized ice cream
Table 21. Viscosity measurements for 0.05% stabilized ice cream.
T (°C) Shear rate
Viscosity (mPa·s) Avg Viscosity
(mPa·s) STD Avg STD
RPM 1/s
20.5
50 375
58.7
52.2
10.0
13.3 20.1 50.0 20.0
19.8 48.0 10.0
19.3
100 750
25.0
25.3
3.0
3.0 19.3 28.0 3.0
19.0 23.0 3.0
18.0
150 1125
18.0
20.0
1.0
1.0 18.1 22.0 1.0
18.0 20.0 1.0
91
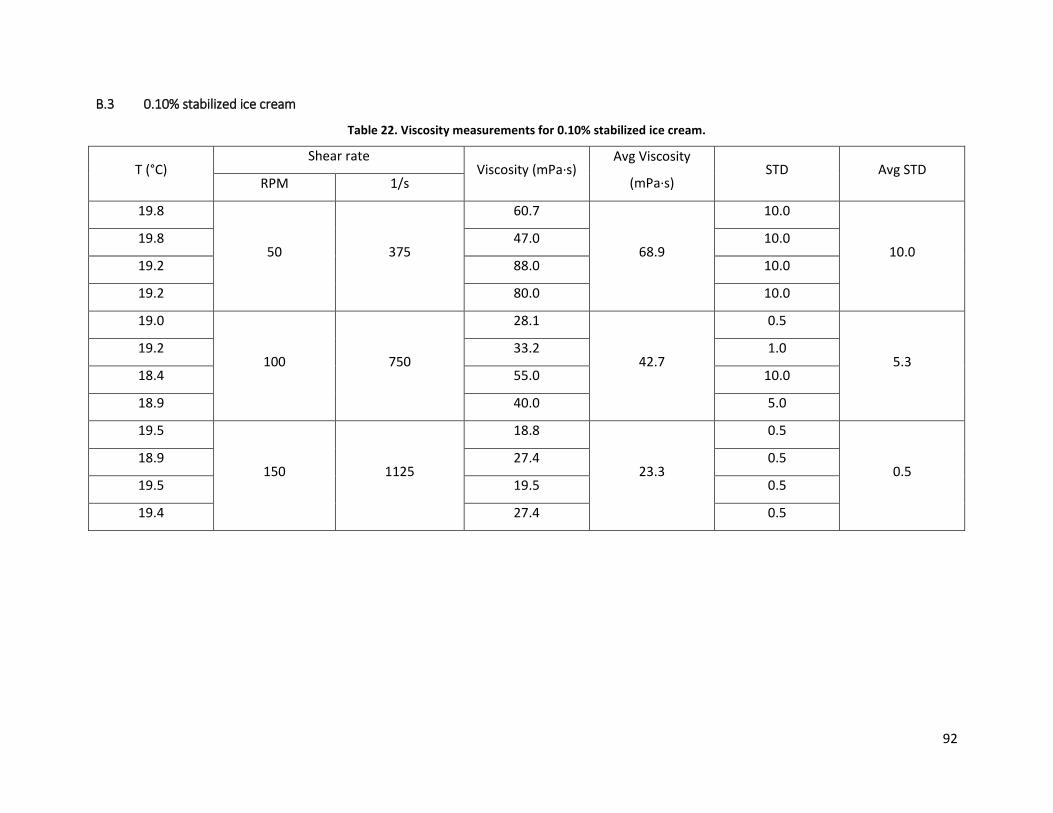
B.3 0.10% stabilized ice cream
Table 22. Viscosity measurements for 0.10% stabilized ice cream.
T (°C) Shear rate
Viscosity (mPa·s) Avg Viscosity
(mPa·s) STD Avg STD
RPM 1/s
19.8
50 375
60.7
68.9
10.0
10.0 19.8 47.0 10.0
19.2 88.0 10.0
19.2 80.0 10.0
19.0
100 750
28.1
42.7
0.5
5.3 19.2 33.2 1.0
18.4 55.0 10.0
18.9 40.0 5.0
19.5
150 1125
18.8
23.3
0.5
0.5 18.9 27.4 0.5
19.5 19.5 0.5
19.4 27.4 0.5
92
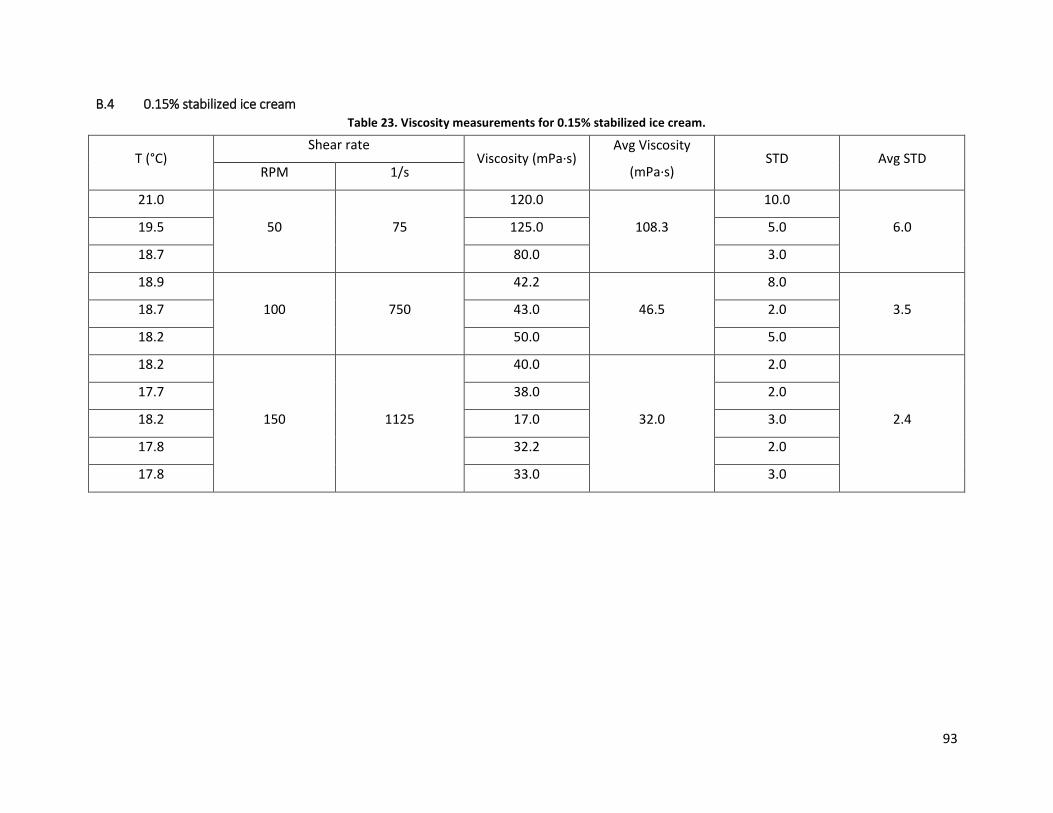
B.4 0.15% stabilized ice cream Table 23. Viscosity measurements for 0.15% stabilized ice cream.
T (°C) Shear rate
Viscosity (mPa·s) Avg Viscosity
(mPa·s) STD Avg STD
RPM 1/s
21.0
50 75
120.0
108.3
10.0
6.0 19.5 125.0 5.0
18.7 80.0 3.0
18.9
100 750
42.2
46.5
8.0
3.5 18.7 43.0 2.0
18.2 50.0 5.0
18.2
150 1125
40.0
32.0
2.0
2.4
17.7 38.0 2.0
18.2 17.0 3.0
17.8 32.2 2.0
17.8 33.0 3.0
93
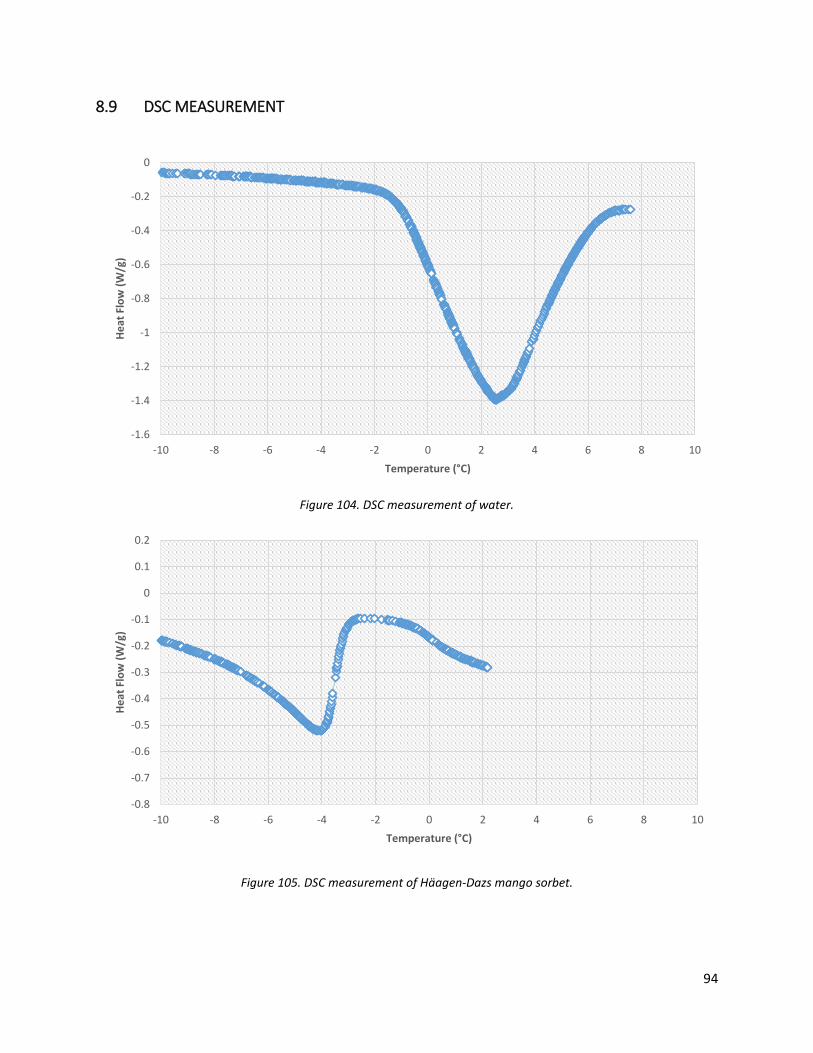
8.9 DSC MEASUREMENT
Figure 104. DSC measurement of water.
Figure 105. DSC measurement of Häagen-Dazs mango sorbet.
-1.6
-1.4
-1.2
-1
-0.8
-0.6
-0.4
-0.2
0
-10 -8 -6 -4 -2 0 2 4 6 8 10
Heat
Flo
w (W
/g)
Temperature (°C)
-0.8
-0.7
-0.6
-0.5
-0.4
-0.3
-0.2
-0.1
0
0.1
0.2
-10 -8 -6 -4 -2 0 2 4 6 8 10
Heat
Flo
w (W
/g)
Temperature (°C)
94
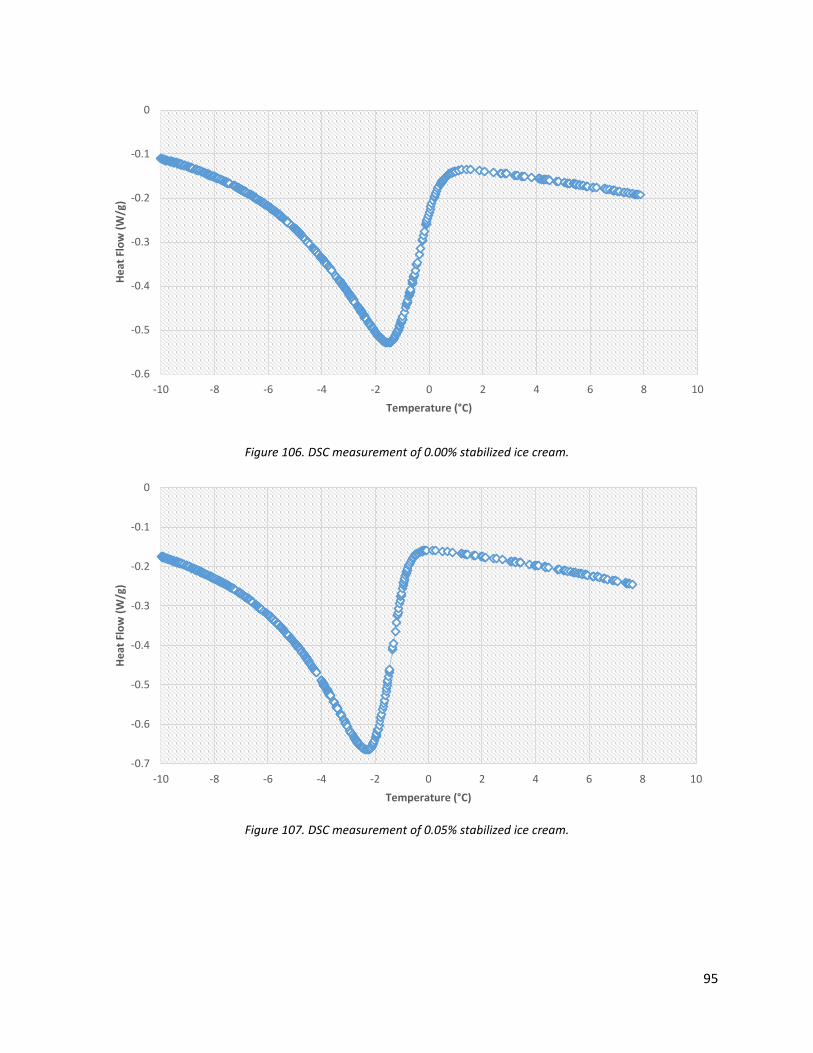
Figure 106. DSC measurement of 0.00% stabilized ice cream.
Figure 107. DSC measurement of 0.05% stabilized ice cream.
-0.6
-0.5
-0.4
-0.3
-0.2
-0.1
0
-10 -8 -6 -4 -2 0 2 4 6 8 10
Heat
Flo
w (W
/g)
Temperature (°C)
-0.7
-0.6
-0.5
-0.4
-0.3
-0.2
-0.1
0
-10 -8 -6 -4 -2 0 2 4 6 8 10
Heat
Flo
w (W
/g)
Temperature (°C)
95
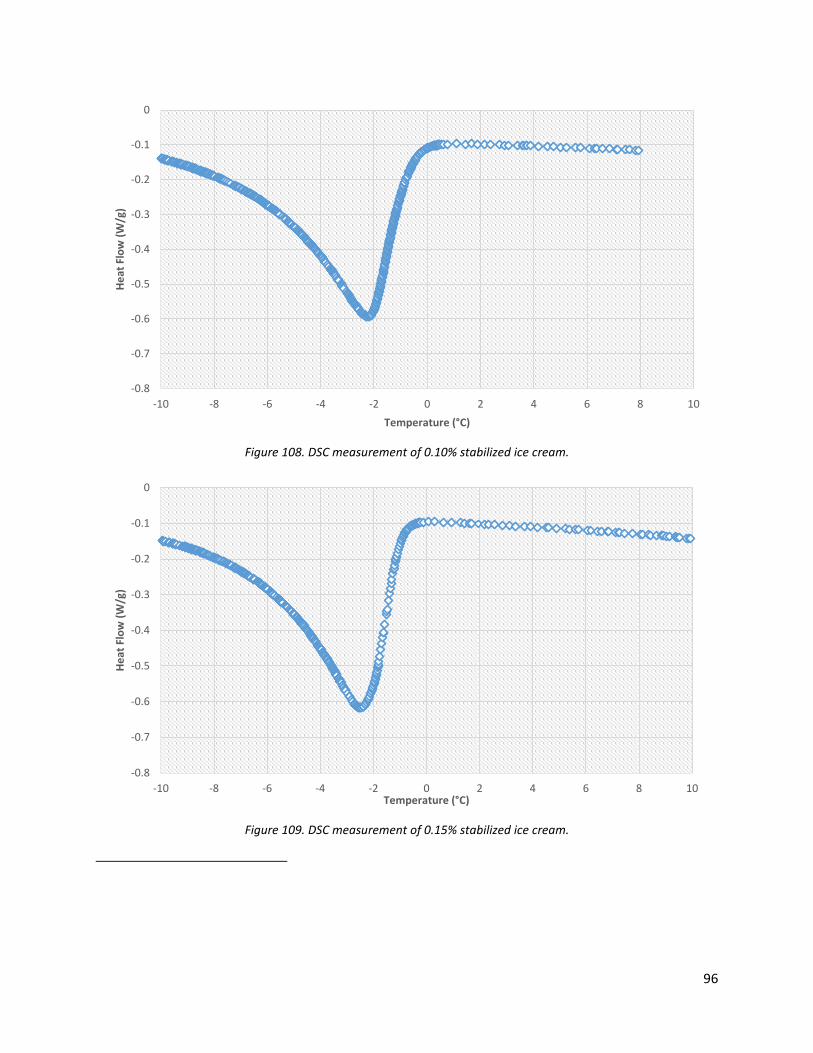
Figure 108. DSC measurement of 0.10% stabilized ice cream.
Figure 109. DSC measurement of 0.15% stabilized ice cream.
-0.8
-0.7
-0.6
-0.5
-0.4
-0.3
-0.2
-0.1
0
-10 -8 -6 -4 -2 0 2 4 6 8 10
Heat
Flo
w (W
/g)
Temperature (°C)
-0.8
-0.7
-0.6
-0.5
-0.4
-0.3
-0.2
-0.1
0
-10 -8 -6 -4 -2 0 2 4 6 8 10
Heat
Flo
w (W
/g)
Temperature (°C)
96
Related Documents


