Effect of Fracture on Bone Turnover Markers: A Longitudinal Study Comparing Marker Levels Before and After Injury in 113 Elderly Women Kaisa K Ivaska, 1 Paul Gerdhem, 1,2 Kristina Åkesson, 1 Patrick Garnero, 3 and Karl J Obrant 1 ABSTRACT: In this longitudinal, prospective, and population-based study (n = 1044), seven BTMs were assessed before and after trauma in 113 elderly women (85 with fractures). Markers were not altered in the immediate postfracture period but were clearly elevated during fracture repair. Recent fracture should thus be taken into account when markers are used in clinical practice. Introduction: Fracture may influence the levels of bone turnover markers (BTM) and have implications for their use in clinical practice. In this longitudinal, prospective, and population-based study, we assessed pre- fracture levels of BTMs and compared them with postfracture levels of the same individuals immediately after fracture and during fracture repair. This is the first study in which the effect of fracture on bone markers has been evaluated with prefracture samples available. Materials and Methods: Serum and urine were collected at the emergency unit from 85 women (77.9 ± 1.8 yr) who sustained a fracture after low-energy trauma and 28 controls (77.8 ± 2.0 yr) with similar trauma but no fracture. All were participants of the Malmö OPRA study (n 1044), and pretrauma samples were collected 1.05 ± 0.85 yr before. Bone turnover was assessed by seven different BTMs reflecting different stages of bone metabolism {C-terminal cross-linked telopeptides of type I collagen [S-CTX], S-TRACP5b, N-terminal pro- peptides of type I collagen [S-PINP], serum osteocalcin (S-OC[1–49] and S-TotalOC), urinary deoxypyridi- noline [U-DPD], and urinary osteocalcin [U-OC]}. Results: BTMs sampled within a few hours after fracture were not altered from preinjury levels. Both bone formation and bone resorption markers were, however, significantly increased 4 mo after fracture. The elevation was most pronounced after hip fracture. Bone turnover remained elevated up to 12 mo after fracture. Conclusions: We believe this study extends our knowledge on the skeletal postfracture metabolic processes. In addition, it may provide a basis for future means to monitor pharmacological intervention promoting fracture healing. J Bone Miner Res 2007;22:1155–1164. Published online on May 7, 2007; doi: 10.1359/JBMR.070505 Key words: bone turnover markers, fracture, fracture repair, longitudinal, prospective INTRODUCTION T HE RATE OF bone remodeling can be monitored quan- titatively by measuring bone turnover markers (BTMs) in serum or urine. The analytes used as bone turnover markers can be excess products from bone formation pro- cess, be released during the breakdown of matrix compo- nents, or reflect the enzymatic activity of bone cells. (1) Bone remodeling is also required for the repair process after frac- ture. Bone formation and resorption rates will increase to repair the bone defect, and the accelerated bone metabo- lism can be detected as elevated serum and urine levels of BTMs. (2–8) The elevation in BTMs may be a result of in- creased bone remodeling activity at the fractured site itself or reflect accelerated bone loss close to the fracture. (9–12) The fracture-induced changes in markers may have im- plications for the use of BTMs in clinical practice. Mark- ers may be useful in the evaluation of fracture healing and in differentiating between normal and delayed heal- ing. (2,5,13–16) Furthermore, if BTMs are influenced by a frac- ture, a recent fracture should be taken into account when markers are used in other clinical applications. Such clinical applications for BTMs may include identification of indi- viduals with high bone turnover, assessment of response to osteoporosis therapy, and prediction of fracture risk. (17) The authors state that they have no conflicts of interest. 1 Clinical and Molecular Osteoporosis Research Unit, Department of Orthopaedics, Lund University, Malmö University Hospital, Malmö, Sweden; 2 Department of Orthopaedics, Karolinska Institute, Karolinska University Hospital, Stockholm, Sweden; 3 INSERM Research Unit 664 and Synarc, Molecular Markers, Lyon, France. JOURNAL OF BONE AND MINERAL RESEARCH Volume 22, Number 8, 2007 Published online on May 7, 2007; doi: 10.1359/JBMR.070505 © 2007 American Society for Bone and Mineral Research 1155

Welcome message from author
This document is posted to help you gain knowledge. Please leave a comment to let me know what you think about it! Share it to your friends and learn new things together.
Transcript

Effect of Fracture on Bone Turnover Markers:A Longitudinal Study Comparing Marker Levels Before and After
Injury in 113 Elderly Women
Kaisa K Ivaska,1 Paul Gerdhem,1,2 Kristina Åkesson,1 Patrick Garnero,3 and Karl J Obrant1
ABSTRACT: In this longitudinal, prospective, and population-based study (n = 1044), seven BTMs wereassessed before and after trauma in 113 elderly women (85 with fractures). Markers were not altered in theimmediate postfracture period but were clearly elevated during fracture repair. Recent fracture should thusbe taken into account when markers are used in clinical practice.
Introduction: Fracture may influence the levels of bone turnover markers (BTM) and have implications fortheir use in clinical practice. In this longitudinal, prospective, and population-based study, we assessed pre-fracture levels of BTMs and compared them with postfracture levels of the same individuals immediately afterfracture and during fracture repair. This is the first study in which the effect of fracture on bone markers hasbeen evaluated with prefracture samples available.Materials and Methods: Serum and urine were collected at the emergency unit from 85 women (77.9 ± 1.8 yr)who sustained a fracture after low-energy trauma and 28 controls (77.8 ± 2.0 yr) with similar trauma but nofracture. All were participants of the Malmö OPRA study (n � 1044), and pretrauma samples were collected1.05 ± 0.85 yr before. Bone turnover was assessed by seven different BTMs reflecting different stages of bonemetabolism {C-terminal cross-linked telopeptides of type I collagen [S-CTX], S-TRACP5b, N-terminal pro-peptides of type I collagen [S-PINP], serum osteocalcin (S-OC[1–49] and S-TotalOC), urinary deoxypyridi-noline [U-DPD], and urinary osteocalcin [U-OC]}.Results: BTMs sampled within a few hours after fracture were not altered from preinjury levels. Both boneformation and bone resorption markers were, however, significantly increased 4 mo after fracture. Theelevation was most pronounced after hip fracture. Bone turnover remained elevated up to 12 mo afterfracture.Conclusions: We believe this study extends our knowledge on the skeletal postfracture metabolic processes.In addition, it may provide a basis for future means to monitor pharmacological intervention promotingfracture healing.J Bone Miner Res 2007;22:1155–1164. Published online on May 7, 2007; doi: 10.1359/JBMR.070505
Key words: bone turnover markers, fracture, fracture repair, longitudinal, prospective
INTRODUCTION
THE RATE OF bone remodeling can be monitored quan-titatively by measuring bone turnover markers (BTMs)
in serum or urine. The analytes used as bone turnovermarkers can be excess products from bone formation pro-cess, be released during the breakdown of matrix compo-nents, or reflect the enzymatic activity of bone cells.(1) Boneremodeling is also required for the repair process after frac-ture. Bone formation and resorption rates will increase torepair the bone defect, and the accelerated bone metabo-
lism can be detected as elevated serum and urine levels ofBTMs.(2–8) The elevation in BTMs may be a result of in-creased bone remodeling activity at the fractured site itselfor reflect accelerated bone loss close to the fracture.(9–12)
The fracture-induced changes in markers may have im-plications for the use of BTMs in clinical practice. Mark-ers may be useful in the evaluation of fracture healingand in differentiating between normal and delayed heal-ing.(2,5,13–16) Furthermore, if BTMs are influenced by a frac-ture, a recent fracture should be taken into account whenmarkers are used in other clinical applications. Such clinicalapplications for BTMs may include identification of indi-viduals with high bone turnover, assessment of response toosteoporosis therapy, and prediction of fracture risk.(17)The authors state that they have no conflicts of interest.
1Clinical and Molecular Osteoporosis Research Unit, Department of Orthopaedics, Lund University, Malmö University Hospital,Malmö, Sweden; 2Department of Orthopaedics, Karolinska Institute, Karolinska University Hospital, Stockholm, Sweden; 3INSERMResearch Unit 664 and Synarc, Molecular Markers, Lyon, France.
JOURNAL OF BONE AND MINERAL RESEARCHVolume 22, Number 8, 2007Published online on May 7, 2007; doi: 10.1359/JBMR.070505© 2007 American Society for Bone and Mineral Research
1155
JO702115 1155 1164 August

Fracture-induced changes in bone turnover have beenstudied by collecting a sample immediately after fractureand by continuing successive sampling to monitor changesin serum and urine levels of BTMs.(3–7,9–11,16,18–21) Theinitial sample was usually collected within 24 h after theonset of fracture,(6,7,9,10,16,19,20) but sampling a few daysafter fracture has also been used.(11,21) Because the firstsample is collected after the injury, the initial BTM valuemay already have been influenced by the fracture. The im-mediate effect of fracture on bone metabolism can only bestudied if a sample before the injury is also available. Pre-injury sampling can be achieved in experimental fracturemodels, such as tibial osteotomy, in which BTM levels canbe measured before and after the surgically induced frac-ture.(22,23) However, the ideal way to study the changes inbone turnover after fracture would be to obtain prefracturesamples from individuals before a fracture has occurred andto use them as individual reference values when a fractureis eventually sustained. This study design has, however, notbeen feasible because it requires large cohort sizes, exten-sive sample collection for reference samples, and an ex-tended prospective follow-up period for fractures.
This study is a prospective and longitudinal study of ini-tially 1044 elderly women (the Malmö OPRA study), ofwhich 113 sustained a trauma: 85 with a fracture and 28 withno fracture. We assessed changes in bone turnover usingseven different biochemical markers reflecting differentstages/processes of osteoblast and osteoclast activity. This isthe first study in which the effect of fracture on bone turn-over has been evaluated with prefracture samples available,hence allowing for extensive assessment of fracture-relatedchanges on bone metabolism.
The aim of our study was to evaluate if BTM levels werealtered immediately after fracture compared with prefrac-ture levels. In addition, we evaluated the long-term effectsof fracture on bone turnover by assessing BTMs 4 mo afterfracture (i.e., after the initial period of healing and of callusformation) and by studying bone turnover up to 1 yr afterfracture (i.e., after fracture consolidation).
MATERIALS AND METHODS
Participating women
The Malmö Osteoporosis Prospective Risk Assessment(OPRA) study is a population-based study of elderly women,all 75 yr of age at inclusion. The inclusion criteria and rea-sons for not participating have been described in detail pre-viously.(24) Briefly, 1044 women were randomly selectedfrom the population files of the city of Malmö, Sweden,between 1995 and 1999. Women were invited to follow-upvisits 1, 3, and 5 yr after inclusion. This study consists ofthose participants who were admitted to the emergencyunit of the Malmö University Hospital after a low-energytrauma and who agreed to provide serum and urine at thisoccasion. Traumas that occurred until April 2005 were in-cluded in the analysis. The time of injury was recorded asreported by the patient or the ambulance staff, and thewomen were invited to a follow-up visit 4 mo after injury.Informed consent was obtained from all participants, and
the study was in all parts approved by the local ethics com-mittee and in accordance with the Declaration of Helsinki.
During the prospective follow-up period, 129 womenwere sampled at the emergency unit. Sixteen women wereexcluded from the study. The reasons for exclusion wereno evident trauma (n � 7), minor fracture (n � 6; toeand finger fractures), breast cancer metastasized to bone(n � 1), no X-ray data available (n � 1), and no sampleavailable from the visit before the injury (n � 1). Afterexclusions, 113 women were eligible for the study (Fig. 1A).
Eighty-five women had sustained a low-energy traumafracture, 30 had hip fractures, 27 had wrist fractures, 4 hadclinical symptomatic vertebral fractures, and 24 had otherfractures, including fractures in the upper limb (other thanwrist; n � 10), the lower limb (n � 8), the ribs (n � 2), theclavicle (n � 2), and the pelvis (n � 2). The diagnosis wasbased on emergency radiographs taken at the Departmentof Radiology and verified and confirmed. Twenty-eightwomen experienced a trauma requiring referral for X-rayexamination, but without a fracture visible on the X-ray.These women served as the control group in this study. Thecontrols had sustained concussions or sprains at the hip(n � 7), foot (n � 6), back (n � 6), hand (n � 3), shoul-ders (n � 3), face (n � 1), knee (n � 1), and wrist (n � 1).One hundred eight of 113 women had sustained the injuryas a result of a low-energy trauma (fall from standing heightor lower). Four women in the fracture group were admittedto the hospital without a prior fall, and these were all symp-tomatic vertebral fractures. Detailed information on thetrauma was not available for one woman.
Serum and urine samples
Two to four serum and urine samples were collectedfrom each woman (Fig. 1B).
FIG. 1. Overview on study design. After exclusions, there were113 women eligible for the study: 85 in the fracture and 28 in thenonfracture group.
IVASKA ET AL.1156

Before injury: All women were participants of the MalmöOPRA study and had thus been sampled at baseline and atlongitudinal follow-up visits. Therefore, a preinjury samplecollected <2 yr before injury was available for all women.Nonfasting serum samples were collected from 7:50 to 11:45a.m.. Urine samples were collected as the first morningvoid, from 02:30 to 10:00 a.m.
Immediately after injury: After trauma, serum and urinesamples were collected at the emergency room (serumsamples from 1:15 a.m. to 11:30 p.m.; urine samples from12:35 a.m. to 11:40 p.m.). The majority of the women (78%)were sampled on the same day that the injury had occurredor on the day after, on average, 6.8 h after injury (range,0.7–26.4 h). Women who were sampled >2 days after injury(n � 25) were excluded when the immediate effects ofinjury were analyzed.
Four months after injury: Eighty-three women (73%) at-tended a preplanned follow-up visit 4 mo (128 ± 33 days)after fracture.
Less than 12 mo after injury: In addition to the pre-planned 4-mo samples, the longitudinal part of the OPRAstudy was used to study the long-term effect of fracture.Based on the OPRA study design, 78 women (69%) at-tended a follow-up within 1 yr after trauma. Samples of thelongitudinal part of the OPRA study were collected in anonfasting status, serum samples between 8:30 and 11:35a.m., and urine samples as the first morning void, between3:00 and 10:10 a.m. There were no statistically significantdifferences in the time of sample collection between thefracture group and the control group at any of the foursampling occasions (all p > 0.05). All serum and urinesamples throughout the study were stored at −80°C.
Measurements of BTMs
Serum TRACP 5b (S-TRACP5b) was determined withBoneTRAP solid-phase, immunofixed, enzyme activity as-say (Immunodiagnostic Systems IDS/SBA Sciences). Se-rum C-terminal cross-linked telopeptides of type I collagen(S-CTX) were determined using the Elecsys �-CrossLapsimmunoassay (Roche Diagnostics), and serum N-terminalpropeptides (S-PINP) were determined using total PINPimmunoassay (Roche Diagnostics). Serum intact osteocal-cin (S-OC[1-49]) and serum total osteocalcin (S-TotalOC)were determined by previously described protocols.(25) Uri-nary total deoxypyridinoline (U-total DPD) was measuredby liquid chromatography after acid hydrolysis of urinesamples (Bio-Rad). Urinary osteocalcin (U-OC) was ana-lyzed with a two-site assay for osteocalcin midfragments(U-MidOC) as described.(26) U-MidOC assay detects themost abundant midmolecule fragments of U-OC (spanningresidues 7–31, 7–29, 6–29, 9–31, 7–32, and 7–33). Urinaryresults were normalized for urinary creatinine determinedin accordance with the alkaline picrate (Jaffe) reaction andexpressed as ratios. Within-assay and between-assay varia-tion for the study were determined by control samples pro-vided with the assays. Within-assay variation was 1.7% forS-OC[1-49], 1.8% for S-TotalOC, 2.1% for S-PINP, 3.1%for S-TRACP5b, 1.5% for S-CTX, 1.8% for U-DPD, and3.4% for U-MidOC. Between-assay variation in control
samples was 8.0% for S-OC[1-49], 4.3% for S-TotalOC,3.0% for S-PINP, 4.6% for S-TRACP5b, 5.9% for S-CTX,<8.5% for U-DPD, and 9.7% for U-MidOC. Measurementswere performed blinded and in duplicates at the end of thestudy, and all samples from a single individual were mea-sured in the same assay to control for interassay variability.
Measurement of BMD
Areal BMD (aBMD) of the femoral neck and lumbarspine (L2–L4) was assessed by DXA (Lunar DPX-L; Madi-son, WI, USA) at the OPRA baseline visit.
Previous fractures and medications
Information on history of bone active medications andretrospectively sustained fractures was collected by a ques-tionnaire. At prospective follow-up visits 1, 3, and 5 yr afterinclusion, the women were asked whether they had sus-tained any fracture since the previous visit. All informationwas confirmed against radiological reports as described.(8)
Eighteen women had either bisphosphonate or potent es-trogen treatment at the time of at least one sample collec-tion (15 in the fracture group and 3 in the control group).More than one half of the women had throughout life sus-tained at least one fracture before the injury: 53 (62%) inthe fracture group and 15 (54%) in the nonfracture group.The latest fracture had occurred within the last 2 yr beforethe injury in 10 women (9 in the fracture group and 1 in thecontrol group).
Statistics
The Shapiro-Wilk test for normal distribution was ap-plied for BTMs, which were all non-normally distributed(SW-W < 0.95). All BTM results before injury, immediatelyafter injury, and 4 mo after injury are shown as median withinterquartile range (IQR). Wilcoxon’s signed rank test wasused to compare BTM levels before and after injury. Com-parisons between the fracture group and the control groupwere made by t-test for independent samples (age, weight,height, BMI, T-score) or by Mann-Whitney U-test (BTMs,sample collection time). A robust locally weighted regres-sion method (Lowess smoothing, stiffness 0.40) was used toshow BTM levels up to 1 yr after fracture. In the Lowessmethod, a polynomial fitting is performed to a subset ofdata in a moving fashion, giving more weight to data pointsnear the point whose response is being estimated and lessweight to data points further away. In the immediate post-fracture period, Spearman correlation was used to analyzethe association between BTM levels and time elapsed fromthe injury. Bonferroni correction for multiple comparisonscould not be used because of the dependence of BTMs oneach other. To control for multiple testing, we thereforeconsidered p < 0.01 statistically significant. We used Statis-tica 7.1 (Statsoft) for all statistical calculations.
RESULTS
Baseline characteristics
Characteristics of participating women (Fig. 1) are sum-marized in Table 1. The mean age at the time of the injury
BONE TURNOVER MARKERS AFTER FRACTURE 1157
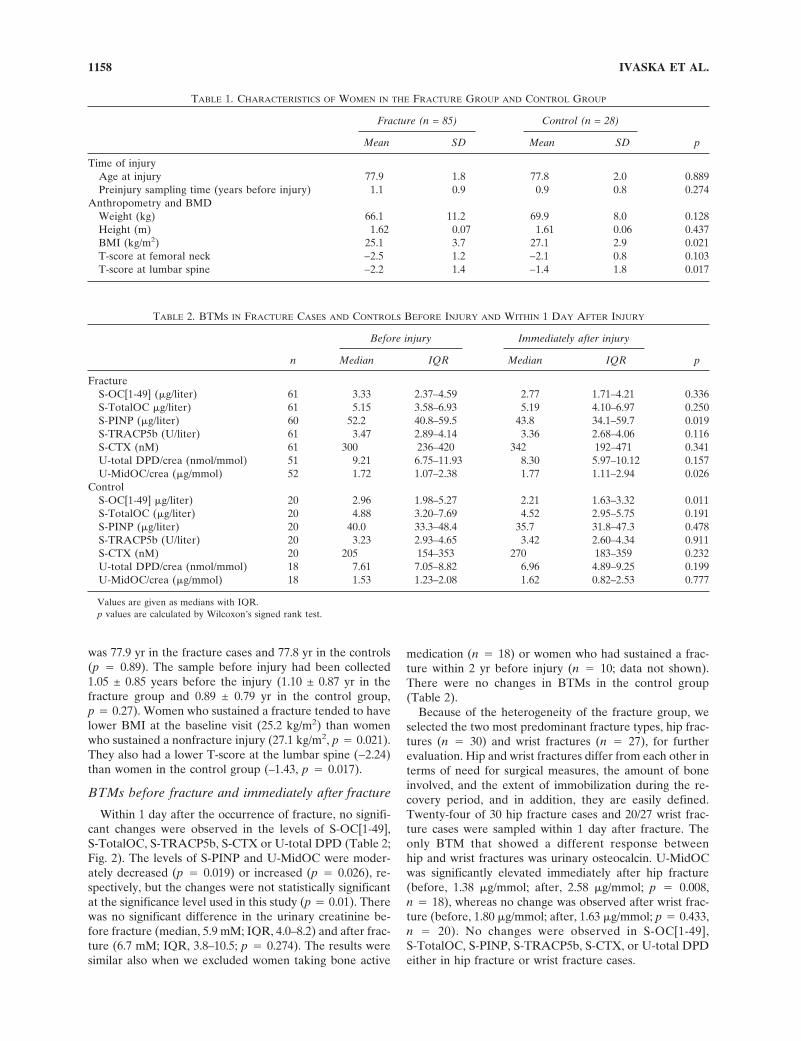
was 77.9 yr in the fracture cases and 77.8 yr in the controls(p � 0.89). The sample before injury had been collected1.05 ± 0.85 years before the injury (1.10 ± 0.87 yr in thefracture group and 0.89 ± 0.79 yr in the control group,p � 0.27). Women who sustained a fracture tended to havelower BMI at the baseline visit (25.2 kg/m2) than womenwho sustained a nonfracture injury (27.1 kg/m2, p � 0.021).They also had a lower T-score at the lumbar spine (−2.24)than women in the control group (–1.43, p � 0.017).
BTMs before fracture and immediately after fracture
Within 1 day after the occurrence of fracture, no signifi-cant changes were observed in the levels of S-OC[1-49],S-TotalOC, S-TRACP5b, S-CTX or U-total DPD (Table 2;Fig. 2). The levels of S-PINP and U-MidOC were moder-ately decreased (p � 0.019) or increased (p � 0.026), re-spectively, but the changes were not statistically significantat the significance level used in this study (p � 0.01). Therewas no significant difference in the urinary creatinine be-fore fracture (median, 5.9 mM; IQR, 4.0–8.2) and after frac-ture (6.7 mM; IQR, 3.8–10.5; p � 0.274). The results weresimilar also when we excluded women taking bone active
medication (n � 18) or women who had sustained a frac-ture within 2 yr before injury (n � 10; data not shown).There were no changes in BTMs in the control group(Table 2).
Because of the heterogeneity of the fracture group, weselected the two most predominant fracture types, hip frac-tures (n � 30) and wrist fractures (n � 27), for furtherevaluation. Hip and wrist fractures differ from each other interms of need for surgical measures, the amount of boneinvolved, and the extent of immobilization during the re-covery period, and in addition, they are easily defined.Twenty-four of 30 hip fracture cases and 20/27 wrist frac-ture cases were sampled within 1 day after fracture. Theonly BTM that showed a different response betweenhip and wrist fractures was urinary osteocalcin. U-MidOCwas significantly elevated immediately after hip fracture(before, 1.38 �g/mmol; after, 2.58 �g/mmol; p � 0.008,n � 18), whereas no change was observed after wrist frac-ture (before, 1.80 �g/mmol; after, 1.63 �g/mmol; p � 0.433,n � 20). No changes were observed in S-OC[1-49],S-TotalOC, S-PINP, S-TRACP5b, S-CTX, or U-total DPDeither in hip fracture or wrist fracture cases.
TABLE 1. CHARACTERISTICS OF WOMEN IN THE FRACTURE GROUP AND CONTROL GROUP
Fracture (n = 85) Control (n = 28)
pMean SD Mean SD
Time of injuryAge at injury 77.9 1.8 77.8 2.0 0.889Preinjury sampling time (years before injury) 1.1 0.9 0.9 0.8 0.274
Anthropometry and BMDWeight (kg) 66.1 11.2 69.9 8.0 0.128Height (m) 1.62 0.07 1.61 0.06 0.437BMI (kg/m2) 25.1 3.7 27.1 2.9 0.021T-score at femoral neck −2.5 1.2 −2.1 0.8 0.103T-score at lumbar spine −2.2 1.4 −1.4 1.8 0.017
TABLE 2. BTMS IN FRACTURE CASES AND CONTROLS BEFORE INJURY AND WITHIN 1 DAY AFTER INJURY
n
Before injury Immediately after injury
pMedian IQR Median IQR
FractureS-OC[1-49] (�g/liter) 61 3.33 2.37–4.59 2.77 1.71–4.21 0.336S-TotalOC �g/liter) 61 5.15 3.58–6.93 5.19 4.10–6.97 0.250S-PINP (�g/liter) 60 52.2 40.8–59.5 43.8 34.1–59.7 0.019S-TRACP5b (U/liter) 61 3.47 2.89–4.14 3.36 2.68–4.06 0.116S-CTX (nM) 61 300 236–420 342 192–471 0.341U-total DPD/crea (nmol/mmol) 51 9.21 6.75–11.93 8.30 5.97–10.12 0.157U-MidOC/crea (�g/mmol) 52 1.72 1.07–2.38 1.77 1.11–2.94 0.026
ControlS-OC[1-49] �g/liter) 20 2.96 1.98–5.27 2.21 1.63–3.32 0.011S-TotalOC (�g/liter) 20 4.88 3.20–7.69 4.52 2.95–5.75 0.191S-PINP (�g/liter) 20 40.0 33.3–48.4 35.7 31.8–47.3 0.478S-TRACP5b (U/liter) 20 3.23 2.93–4.65 3.42 2.60–4.34 0.911S-CTX (nM) 20 205 154–353 270 183–359 0.232U-total DPD/crea (nmol/mmol) 18 7.61 7.05–8.82 6.96 4.89–9.25 0.199U-MidOC/crea (�g/mmol) 18 1.53 1.23–2.08 1.62 0.82–2.53 0.777
Values are given as medians with IQR.p values are calculated by Wilcoxon’s signed rank test.
IVASKA ET AL.1158

To further elucidate the most immediate effects of frac-ture, we separately analyzed only those women who weresampled at the emergency unit within 12 h of injury (n � 43for fracture group and n � 14 for control group). There wasa time-dependent decrease in S-OC levels, and the decreasewas evident when >4 h had elapsed from fracture (Fig. 3).The decrease was seen in both S-OC[1-49] and S-TotalOClevels. Spearman correlation to the time elapsed fromfracture was r � −0.45 (p < 0.01) for S-OC[1-49] and r �−0.31 (p < 0.05) for S-TotalOC. The association wasmainly caused by the decreased values in hip fracture cases(r � −0.69, p < 0.01 and r � −0.52, p < 0.05, respectively)than in other fractures (r � −0.17, p > 0.05 and r � −0.11,p > 0.05, respectively). Similar time-dependent associationswere not observed for S-PINP, S-TRACP5b, S-CTX,U-total DPD, or U-MidOC in the fracture group (Fig. 3) orfor any of the BTMs in the control group (data not shown).
BTMs before fracture and 4 mo after fracture
In contrast to the immediate postfracture period, BTMswere significantly elevated 4 mo after injury in the entire
fracture group (Table 3). This was especially observed formarkers of bone formation, S-OC[1-49], S-TotalOC, andS-PINP (p < 0.001 for all), but the resorption markersS-TRACP5b, S-CTX, and U-total DPD were elevated aswell (p � 0.009, p � 0.004, and p < 0.001, respectively). Incontrast, only a modest and not statistically significantincrease was seen in urinary osteocalcin, U-MidOC(p � 0.017). The increase in formation and resorptionmarkers also remained significant when we excluded indi-viduals taking bone-active mediation (data not shown).There were no changes in BTMs in the control group(Table 3).
Eighteen of 30 hip fracture cases and 22/27 wrist fracturecases were sampled at 4 mo after fracture. The increase inmarkers at the 4-mo time-point was most pronounced in thehip fracture group. In patients with hip fracture, the percentincreases (median) were 67% (p � 0.002) for S-OC[1-49],55% (p � 0.004) for S-TotalOC, 51% (p < 0.001) forS-PINP, 19% (p � 0.004) for S-TRACP5b, and 60%(p � 0.008) for U-MidOC. S-CTX and U-total DPD werealso increased after hip fracture, but the increases did not
FIG. 2. Effect of fracture on (A) formation markers (S-OC[1-49], S-TotalOC, S-PINP), (B) resorption markers (S-CTX, S-TRACP5b,U-total DPD), and (C) urinary osteocalcin (U-MidOC) measured within 1 day after fracture. Results before and after injury are shownwith triangles, and the two time-points are connected with gray line. Solid squares connected with black line indicate median values.Unit for y axis is micrograms per liter (S-OC[1-49], S-TotalOC, S-PINP), units per liter (S-TRACP5b), nanomolar (S-CTX), nmoles permmoles (U-total DPD), or micrograms per mmole creatinine (U-MidOC). The p values between before and after fracture measure-ments were calculated using Wilcoxon’s signed rank test.
BONE TURNOVER MARKERS AFTER FRACTURE 1159

FIG. 3. Scatterplot of (A) formation markers (S-OC[1-49], S-TotalOC, S-PINP), (B) resorption markers (S-CTX, S-TRACP5b,U-total DPD), and (C) urinary osteocalcin (U-MidOC) measured within 12 h after fracture. Marker levels are shown as percentage ofprefracture levels (solid triangle, hip fracture; open triangle, other fracture), and time is shown as hours from fracture. Horizontal dottedline represents no change (0%) compared with BTM level before fracture.
TABLE 3. BTMS IN FRACTURE CASES AND CONTROLS BEFORE INJURY AND 4 MO AFTER INJURY
n
Before injury 4 months after injury
pMedian IQR Median IQR
FractureS-OC[1-49] (�g/liter) 55 3.35 2.69–4.61 4.83 3.42–6.60 <0.001S-TotalOC (�g/liter) 55 5.16 3.94–6.90 7.10 5.29–9.69 <0.001S-PINP (�g/liter) 54 53.0 41.7–60.4 67.1 44.5–92.3 <0.001S-TRACP5b (U/liter) 55 3.47 2.95–4.14 3.83 3.03–4.48 0.009S-CTX (nM) 55 300 238–453 390 257–499 0.004U-total DPD/crea (nmol/mmol) 49 8.82 6.25–12.05 10.23 8.01–14.87 <0.001U-MidOC/crea (�g/mmol) 49 1.72 0.89–2.39 1.95 1.23–2.89 0.017
ControlS-OC[1-49] (�g/liter) 20 3.00 2.15–4.39 3.37 2.88–4.56 0.232S-TotalOC (�g/liter) 20 4.88 3.29–6.76 5.11 4.39–6.65 0.391S-PINP (�g/liter) 19 41.1 33.5–48.4 44.3 34.4–53.1 0.334S-TRACP5b (U/liter) 20 3.10 2.91–3.84 3.43 3.09–4.29 0.062S-CTX (nM) 20 205 167–337 268 208–334 0.211U-total DPD/crea (nmol/mmol) 18 7.78 7.38–10.43 9.46 7.38–12.05 0.199U-MidOC/crea (�g/mmol) 18 1.30 1.00–1.83 1.73 0.88–2.91 0.048
Values are given as medians with IQR.p values are calculated by Wilcoxon’s signed rank test, and p < 0.01 is indicated in bold.
IVASKA ET AL.1160

reach statistical significance at the level used in this study(56%, p � 0.025 and 54%, p � 0.020, respectively). Inpatients with wrist fracture, the changes at 4 mo were notdifferent from the prefracture levels for any of the BTMs.
Change of BTMs 1 yr after fracture
Scatterplots were created by plotting the time from injurywith BTM results (percent change from the prefracture lev-els) from all measurements until 1 yr after fracture. A visualestimation of scatterplots revealed different patterns fordifferent markers (Fig. 4). There was an early rise inS-TRACP5b, S-CTX, and S-PINP within 2 wk after frac-ture. After an initial elevation, the level of S-TRACP5bstarted to decrease 2–3 mo after fracture and stabilizedclose to prefracture level by 5–6 mo after fracture. Thepattern was similar for S-CTX and S-PINP. The urinarymarkers U-total DPD and U-MidOC reached the highestvalue slightly later, ∼1.5 mo after fracture. The levels ofS-OC[1-49] and S-TotalOC peaked clearly later than otherBTMs and remained elevated during a longer period oftime. Most changes in BTMs seemed to take place within 6
mo after fracture, with the BTM levels remaining constantduring the latter part of the 1-yr follow-up. The levels of allBTMs (except U-total DPD) remained above the prefrac-ture level during the entire follow-up period, up to a yearafter fracture.
DISCUSSION
This is the first prospective study where preinjury levelsof BTMs have been assessed and compared with postinjurylevels of the same individual with or without fracture.BTMs sampled immediately after fracture were not signifi-cantly altered from preinjury levels. During fracture repair,most BTMs were significantly elevated several months afterfracture and remained at elevated levels up to 1 yr afterfracture.
Immediate effects of fracture
Levels of BTMs were not significantly altered immedi-ately after fracture. Samples collected within a few hours(for S-OC) or up to 1 day after fracture may thus reflect the
FIG. 4. Scatterplot of (A) formation markers (S-OC[1-49], S-TotalOC, S-PINP), (B) resorption markers (S-CTX, S-TRACP5b,U-total DPD), and (C) urinary osteocalcin (U-MidOC) up to 1 yr after fracture. Marker levels are shown as percentage of prefracturelevels (triangles), and time is shown as days from fracture. Solid line represents robust locally weighted regression line (Lowessmethod). Horizontal dotted line represents no change (0%) compared with BTM level before fracture. Individuals taking bone activemedication have been excluded. The scale on the y axis is different for different markers.
BONE TURNOVER MARKERS AFTER FRACTURE 1161

situation before trauma. Urinary OC (U-OC) seems to bean exception from this. U-MidOC levels were significantlyincreased immediately after hip fracture but not after wristfracture, suggesting that a major fracture with systemic ef-fects and engaging a significant amount of bone tissue isrequired to influence OC in urine. We did not detect sig-nificant differences in U-total DPD or in urinary creatinine.Thus, possible changes in renal filtration caused by traumaand detectable by changes in creatinine excretion are un-likely to explain the changes in U-OC. We cannot, however,exclude the possibility that severe trauma influences otheraspects in renal function, for instance the metabolism ofosteocalcin and its fragments in the kidneys.(27,28)
When hip fracture and other fractures were analyzedseparately, there seemed to be a decrease in serum OCafter hip fractures in the early postfracture period (Fig. 3).Åkesson et al.(6) have reported that, in samples collectedwithin the first 18 h after hip fracture, there was no corre-lation between the level of serum OC and the time elapsedfrom fracture. However, in that study, there were no pre-injury samples available. When we performed similar analy-sis with postfracture values of our serum OC measure-ments, we did not detect significant time dependence inS-OC[1-49] (Spearman r � −0.25, p > 0.05). However,when the prefracture level was taken into account, asignificant negative association was detected (r � −0.45,p < 0.01). Thus, if sampling is done several hours afterinjury, serum OC may already be affected. Visual inspec-tion suggests that the time-dependence effect is apparent4–5 h after hip fracture (Fig. 3). We therefore suggest thatS-OC is unaffected after trauma provided that sampling isperformed within 4 h after trauma causing a major fracturesuch as hip fracture. One explanation for the decrease inS-OC could be a trauma-related elevation in serum corti-sol.(29) The biosynthesis of OC is suppressed by glucocor-ticoids,(30) serum OC levels decrease after glucocorticoidadministration,(31) and are lower in women with recent hipfracture than in elderly controls.(32) Increase in cortisol af-ter the trauma may also explain the slight, but nonsignifi-cant, decrease observed in S-PINP soon after fracture(Table 2).(33)
Long-term effects of fracture
All bone formation and bone resorption markers weresignificantly increased 4 mo after fracture, a time-pointwhen the initial healing and callus formation is passed. Atthis time-point, the elevation was more pronounced for theformation markers. BTMs were increased particularlyafter hip fracture. Markers for collagen degradation(S-CTX, U-DPD), collagen synthesis (S-PINP), activity ofosteoclasts (S-TRACP5b), and mature bone-forming osteo-blasts (S-OC) were analyzed, enabling us to monitor theeffect of fracture on different aspects of bone remodeling.BTMs reflecting different stages/processes of osteoblastand osteoclast activity seemed to have different patternsduring fracture repair. There was an early (within a fewweeks) increase in resorption markers S-TRACP5b andS-CTX and a somewhat later rise (a few months after frac-ture) in formation markers S-OC[1-49] and S-TotalOC.
S-PINP, an index of collagen synthesis and marker of earlystages of bone formation, peaked at approximately thesame time as the resorption markers and clearly earlier thanboth S-OCs that reflect later stages of osteoblast matura-tion. The patterns for urinary OC and urinary resorptionmarker U-total DPD resembled the pattern for the serumresorption markers and S-PINP. This is in agreement withearlier findings suggesting that urinary OC may be morerelated to resorption than formation.(26,34–36)
The most pronounced changes in bone turnover occurredwithin 6 mo after fracture, whereas turnover remainedfairly constant from 6 to 12 mo. All BTMs were, however,above the prefracture level at the end of the 1-yr follow-upperiod, after fracture consolidation (except U-total DPD).This may suggest that, although the fractured skeletal siteitself is healed in terms of biomechanical resistance, theskeleton still continues to respond to fracture or fracture-induced immobilization by accelerated remodeling andmineralization of the fractured site(37) or by a general rise inbone metabolism.(38–40) Some earlier studies have sug-gested that only bone formation markers but not resorptionmarkers are elevated 6–12 mo after fracture.(10,11,20,21)
However, in the previous studies, preinjury samples for ref-erence value determination were not available, and therewas no control group of patients with trauma and no frac-ture.
Strengths of the study
The novelty of this study design is the availability of pre-fracture samples, which enabled us to compare BTM levelsbefore and after injury within each individual and the avail-ability of a control group of subjects, from the same cohort,with trauma but no fracture. When the effect of fracture onbone turnover has earlier been evaluated, the first (base-line) sample has always been collected when fracture hasalready occurred.(3–7,9–11,16,18–21) Therefore, the immediatechanges may have been missed. Another strength of ourstudy is the use of several different BTMs reflecting differ-ent aspects of bone metabolism. Other advantages are ahomogenous sample of elderly women of similar age anddetailed information on type of trauma, fracture, and medi-cation, which all reflect a clinically relevant situation.
Limitations
A disadvantage is that the nonfasting sample collection atthe emergency unit took place around the clock (24 h) toget the earliest sample possible after the fracture event.Most BTMs have a circadian rhythm and are influenced byfood intake,(41) and if the biological fluctuation is greaterthan the effect of fracture, it may have hindered us fromdetecting immediate effects on BTMs. In our cohort, thesamples before injury had been collected before noon (se-rum samples 7:50–11:45 a.m.; urine samples 2:30–10:00a.m.). However, only 21% of serum samples and 7% ofurine samples collected at the emergency unit were ob-tained within this same time frame. The predominance ofsamples collected on afternoon and evening may havecaused an underestimation of the immediate fracture effect,because most BTMs have lower levels in the afternoon.(41)
IVASKA ET AL.1162
We could have collected the emergency sample on the firstmorning after fracture. However, all patients were not ad-mitted to the hospital. Furthermore, those patients admit-ted were already receiving treatment such as fluid substitu-tion or surgery at that time-point which would also havehad an impact on BTM levels,(42) probably even greaterthan the circadian variation. Therefore, we believe that thecollection of samples as performed in this study is the op-timal way to collect postfracture samples. The longitudinalanalysis of BTMs up to 1 yr after fracture is limited by fewobservations between the fracture and 4-mo time-point andbetween the 4- and 12-mo time-points. Whereas the datafor the 0- and 4-mo time-point are clear, there are too fewdata points at the intervening period for evaluation. Wetried to take this into account by using locally weightedregression method, which creates a fit in a moving fashionfor subsets of data giving more weight to the nearest datapoints and less weight to data points further away. How-ever, the longitudinal patterns of BTMs at these time inter-vals need to be interpreted with high degree of caution.
Individual variation
The effect of fracture on BTMs was highly individual. Inaddition to the relatively small and local defect at the frac-tured site, the surgery itself may influence bone turn-over.(42) Larger bone surface and longer time to union inmajor fractures may contribute to individual differences,(43)
as may the different degree of immobilization during frac-ture repair.(8,44–46) This may partly explain why changes ofgreater magnitude were seen after hip fracture than afterupper extremity fracture. The amount of bone involved, theneed for surgical treatment, and the extent of immobiliza-tion differ in these fracture subgroups. Markers are alsoinfluenced by external factors, such as diet and physicalactivity,(41) and therefore the variability is also high inhealthy individuals. Consequently, a high degree of varia-tion can also be expected in the postfracture period. Themagnitude of response may also be dependent on the sizeof the fractured bone and its weight-bearing characteristicsor BMD.(9,10,16,21,38)
Conclusions
BTMs sampled within a few hours after fracture are notsignificantly altered from the preinjury levels. Immediatepostfracture sampling may thus provide information on thebaseline state of bone turnover of a fractured patient. Thisinformation will be a prerequisite if, in the future, wewould, by means of BTMs, be able to monitor the effects ofpharmacological interventions promoting fracture healing.This study has also provided evidence that markers aresignificantly increased during fracture repair. Ongoing frac-ture healing and postfracture immobilization clearly seemto have implications on the use of BTMs in clinical practice.Our results suggest that at least 12 mo is needed to elimi-nate the effect of a recent fracture if BTMs are used inclinical practice, particularly after lower extremity fracture.The time needed may depend on the BTM analyzed, thetype of fracture, and be different for markers of bone re-sorption and formation.
ACKNOWLEDGMENTS
The authors thank Anders Isaksson, Lund University,Sweden, for performing the CTX analysis and Elise Maus-sion, Synarc Molecular Markers, France, for the urinarytotal DPD analysis. All personnel at the emergency unit atthe Malmö University Hospital are greatly acknowledgedfor sample assessment. This work received financial supportfrom the Swedish Medical Research Council, the ResearchFoundation of Orion Corporation, Finland, and the FinnishCultural Foundation.
REFERENCES
1. Delmas PD, Eastell R, Garnero P, Seibel MJ, Stepan J 2000The use of biochemical markers of bone turnover in osteopo-rosis. Committee of Scientific Advisors of the InternationalOsteoporosis Foundation. Osteoporos Int 11(Suppl 6):S2–17.
2. Oni OO, Mahabir JP, Iqbal SJ, Gregg PJ 1989 Serum osteo-calcin and total alkaline phosphatase levels as prognostic indi-cators in tibial shaft fractures. Injury 20:37–38.
3. Obrant KJ, Merle B, Bejui J, Delmas PD 1990 Serum bone-glaprotein after fracture. Clin Orthop 258:300–303.
4. Joerring S, Jensen LT, Andersen GR, Johansen JS 1992 TypesI and III procollagen extension peptides in serum respond tofracture in humans. Arch Orthop Trauma Surg 111:265–267.
5. Joerring S, Krogsgaard M, Wilbek H, Jensen LT 1994 Collagenturnover after tibial fractures. Arch Orthop Trauma Surg113:334–336.
6. Akesson K, Vergnaud P, Delmas PD, Obrant KJ 1995 Serumosteocalcin increases during fracture healing in elderly womenwith hip fracture. Bone 16:427–430.
7. Kurdy NM, Bowles S, Marsh DR, Davies A, France M 1998Serology of collagen types I and III in normal healing of tibialshaft fractures. J Orthop Trauma 12:122–126.
8. Obrant KJ, Ivaska KK, Gerdhem P, Alatalo SL, Pettersson K,Vaananen HK 2005 Biochemical markers of bone turnover areinfluenced by recently sustained fracture. Bone 36:786–792.
9. Ingle BM, Hay SM, Bottjer HM, Eastell R 1999 Changes inbone mass and bone turnover following distal forearm fracture.Osteoporos Int 10:399–407.
10. Ingle BM, Hay SM, Bottjer HM, Eastell R 1999 Changes inbone mass and bone turnover following ankle fracture. Osteo-poros Int 10:408–415.
11. Veitch SW, Findlay SC, Hamer AJ, Blumsohn A, Eastell R,Ingle BM 2006 Changes in bone mass and bone turnover fol-lowing tibial shaft fracture. Osteoporos Int 17:364–372.
12. Obrant KJ 1984 Trabecular bone changes in the greater tro-chanter after fracture of the femoral neck. Acta Orthop Scand55:78–82.
13. Nyman MT, Paavolainen P, Forsius S, Lamberg-Allardt C 1991Clinical evaluation of fracture healing by serum osteocalcinand alkaline phosphatase. Ann Chir Gynaecol 80:289–293.
14. Kurdy NM 2000 Serology of abnormal fracture healing: Therole of PIIINP, PICP, and BsALP. J Orthop Trauma 14:48–53.
15. Herrmann M, Klitscher D, Georg T, Frank J, Marzi I, Her-rmann W 2002 Different kinetics of bone markers in normaland delayed fracture healing of long bones. Clin Chem48:2263–2266.
16. Stoffel K, Engler H, Kuster M, Riesen W 2007 Changes inbiochemical markers after lower limb fractures. Clin Chem53:131–134.
17. NCCLS 2004 Application of Biochemical Markers of BoneTurnover in the Assessment and Monitoring of Bone Diseases:Approved Guideline NCCLS Document C48-A. NCCLS,Wayne, PA, USA.
18. Leung KS, Fung KP, Sher AH, Li CK, Lee KM 1993 Plasmabone-specific alkaline phosphatase as an indicator of osteoblas-tic activity. J Bone Joint Surg Br 75:288–292.
19. Takahashi M, Kushida K, Hoshino H, Aoshima H, Ohishi T,
BONE TURNOVER MARKERS AFTER FRACTURE 1163

Inoue T 1998 Acute effects of fracture on bone markers andvitamin K. Clin Chem 44:1583–1584.
20. Ohishi T, Takahashi M, Kushida K, Hoshino H, Tsuchikawa T,Naitoh K, Inoue T 1998 Changes of biochemical markers dur-ing fracture healing. Arch Orthop Trauma Surg 118:126–130.
21. Yu-Yahiro JA, Michael RH, Dubin NH, Fox KM, Sachs M,Hawkes WG, Hebel JR, Zimmerman SI, Shapiro J, MagazinerJ 2001 Serum and urine markers of bone metabolism duringthe year after hip fracture. J Am Geriatr Soc 49:877–883.
22. Seebeck P, Bail HJ, Exner C, Schell H, Michel R, Amthauer H,Bragulla H, Duda GN 2005 Do serological tissue turnovermarkers represent callus formation during fracture healing?Bone 37:669–677.
23. Akesson K, Kakonen SM, Josefsson PO, Karlsson MK, ObrantKJ, Pettersson K 2005 Fracture-induced changes in bone turn-over: A potential confounder in the use of biochemical mark-ers in osteoporosis. J Bone Miner Metab 23:30–35.
24. Gerdhem P, Ivaska KK, Alatalo SL, Halleen JM, Hellman J,Isaksson A, Pettersson K, Vaananen HK, Akesson K, ObrantKJ 2004 Biochemical markers of bone metabolism and predic-tion of fracture in elderly women. J Bone Miner Res 19:386–393.
25. Kakonen SM, Hellman J, Karp M, Laaksonen P, Obrant KJ,Vaananen HK, Lovgren T, Pettersson K 2000 Developmentand evaluation of three immunofluorometric assays that mea-sure different forms of osteocalcin in serum. Clin Chem46:332–337.
26. Ivaska KK, Kakonen SM, Gerdhem P, Obrant KJ, PetterssonK, Vaananen HK 2005 Urinary osteocalcin as a marker of bonemetabolism. Clin Chem 51:618–628.
27. Farrugia W, Melick RA 1986 Metabolism of osteocalcin. CalcifTissue Int 39:234–238.
28. Taylor AK, Linkhart S, Mohan S, Christenson RA, Singer FR,Baylink DJ 1990 Multiple osteocalcin fragments in humanurine and serum as detected by a midmolecule osteocalcin ra-dioimmunoassay. J Clin Endocrinol Metab 70:467–472.
29. Barton RN, Weijers JW, Horan MA 1993 Increased ratesof cortisol production and urinary free cortisol excretion inelderly women 2 weeks after proximal femur fracture. Eur JClin Invest 23:171–176.
30. Heinrichs AA, Bortell R, Rahman S, Stein JL, Alnemri ES,Litwack G, Lian JB, Stein GS 1993 Identification of multipleglucocorticoid receptor binding sites in the rat osteocalcin genepromoter. Biochemistry 32:11436–11444.
31. Godschalk MF, Downs RW 1988 Effect of short-term gluco-corticoids on serum osteocalcin in healthy young men. J BoneMiner Res 3:113–115.
32. Akesson K, Vergnaud P, Gineyts E, Delmas PD, Obrant KJ1993 Impairment of bone turnover in elderly women with hipfracture. Calcif Tissue Int 53:162–169.
33. Ton FN, Gunawardene SC, Lee H, Neer RM 2005 Effects oflow-dose prednisone on bone metabolism. J Bone Miner Res20:464–470.
34. Srivastava AK, Mohan S, Singer FR, Baylink DJ 2002 A urinemidmolecule osteocalcin assay shows higher discriminatorypower than a serum midmolecule osteocalcin assay duringshort-term alendronate treatment of osteoporotic patients.Bone 31:62–69.
35. Ivaska KK, Pettersson K, Nenonen A, Uusi-Rasi K, HeinonenA, Kannus P, Vaananen HK 2005 Urinary osteocalcin is auseful marker for monitoring the effect of alendronate therapy.Clin Chem 51:2362–2365.
36. Tamm A, Kumm J, Rohtla K, Ivaska KK 2006 Urinary osteo-calcin and other markers of bone metabolism: The effect ofrisedronate therapy. Calcif Tissue Int 78(Suppl 1):S161.
37. Obrant KJ, Nilsson BE 1984 Histomorphologic changes in thetibial epiphysis after diaphyseal fracture. Clin Orthop 185:270–275.
38. Frost HM 1989 The biology of fracture healing. An overviewfor clinicians. Part I. Clin Orthop 248:283–293.
39. Einhorn TA, Simon G, Devlin VJ, Warman J, Sidhu SP, Vig-orita VJ 1990 The osteogenic response to distant skeletal in-jury. J Bone Joint Surg Am 72:1374–1378.
40. Wendeberg B 1961 Mineral metabolism of fractures of the tibiain man studied with external counting of Sr85. Acta OrthopScand Suppl 52:1–79.
41. Hannon R, Eastell R 2000 Preanalytical variability of biochemi-cal markers of bone turnover. Osteoporos Int 11(Suppl 6):S30–S44.
42. Lotz J, Gaertner T, Hahn M, Prellwitz W 1999 Collagen type Imetabolism after bone surgery. Arch Orthop Trauma Surg119:212–216.
43. Nakagawa H, Kamimura M, Takahara K, Hashidate H,Kawaguchi A, Uchiyama S, Miyasaka T 2006 Changes in totalalkaline phosphatase level after hip fracture: Comparison be-tween femoral neck and trochanter fractures. J Orthop Sci11:135–139.
44. Lueken SA, Arnaud SB, Taylor AK, Baylink DJ 1993 Changesin markers of bone formation and resorption in a bed restmodel of weightlessness. J Bone Miner Res 8:1433–1438.
45. Inoue M, Tanaka H, Moriwake T, Oka M, Sekiguchi C, SeinoY 2000 Altered biochemical markers of bone turnover in hu-mans during 120 days of bed rest. Bone 26:281–286.
46. Kim H, Iwasaki K, Miyake T, Shiozawa T, Nozaki S, Yajima K2003 Changes in bone turnover markers during 14-day 6 de-grees head-down bed rest. J Bone Miner Metab 21:311–315.
Address reprint requests to:Kaisa Ivaska, PhD
Department of OrthopaedicsMalmö University HospitalSE-20502 Malmö, Sweden
E-mail: [email protected]
Received in original form February 22, 2007; revised form April 11,2007; accepted April 27, 2007.
IVASKA ET AL.1164
Related Documents