EFFECT OF FOOD AVAILABILITY ON LONG- AND SHORT-TERM CONTROLS OF FOOD INTAKE By CLARE MARIE MATHES A THESIS PRESENTED TO THE GRADUATE SCHOOL OF THE UNIVERSITY OF FLORIDA IN PARTIAL FULFILLMENT OF THE REQUIREMENTS FOR THE DEGREE OF MASTER OF SCIENCE UNIVERSITY OF FLORIDA 2005

Welcome message from author
This document is posted to help you gain knowledge. Please leave a comment to let me know what you think about it! Share it to your friends and learn new things together.
Transcript

EFFECT OF FOOD AVAILABILITY
ON LONG- AND SHORT-TERM CONTROLS OF FOOD INTAKE
By
CLARE MARIE MATHES
A THESIS PRESENTED TO THE GRADUATE SCHOOL OF THE UNIVERSITY OF FLORIDA IN PARTIAL FULFILLMENT
OF THE REQUIREMENTS FOR THE DEGREE OF MASTER OF SCIENCE
UNIVERSITY OF FLORIDA
2005

Copyright 2005
by
Clare Marie Mathes

This document is dedicated to my family and friends who have supported me in my educational endeavors … and to those who haven’t, for giving me the motivation to
prove them wrong.

iv
ACKNOWLEDGMENTS
I would like to thank my adviser, Dr. Neil Rowland, with whom the ideas presented
in this thesis originated and who has supported me throughout my academic career. I
would like to thank Dr. Alan Spector and Dr. Jesse Dallery for agreeing to be on my
committee and for all their contributions. I would like to acknowledge and thank
Rowland lab members Kim Robertson, Cheryl Vaughan, Laura Starr, and Anaya Mitra,
and undergraduate assistants Lizzie Bassuk and Jillian Fleisher for all their support and
aid in these projects. I would also specifically like to thank Laura Starr and Greg
Perlman for assisting me in the data analysis by teaching me SPSS and Sigma Plot.

v
TABLE OF CONTENTS page
ACKNOWLEDGMENTS ................................................................................................. iv
LIST OF TABLES........................................................................................................... viii
LIST OF FIGURES ........................................................................................................... ix
ABSTRACT....................................................................................................................... xi
CHAPTER
1 INTRODUCTION ........................................................................................................1
Obesity and Public Health ............................................................................................1 Definition of Obesity ....................................................................................................1 Body Weight and Homeostasis.....................................................................................2
The Glucostatic Hypothesis...................................................................................3 The Lipostatic Hypothesis .....................................................................................3 Central Integration.................................................................................................4
Dietary Determinants of Energy Balance .....................................................................5 Oral Cues ...............................................................................................................5 Postoral Cues .........................................................................................................6 Behavioral Economics...........................................................................................7 Learned Feeding Patterns ......................................................................................8
Limits of Homeostasis ..................................................................................................8 The Influence of Availability........................................................................................9
2 EXPERIMENT 1–SPATIAL AVAILABILITY ........................................................11
Introduction and Rationale .........................................................................................11 Methods ......................................................................................................................11
Animals and Housing ..........................................................................................11 Food Conditions and Measures ...........................................................................12 Body Weight Measures .......................................................................................13 Data Analysis.......................................................................................................13
Results.........................................................................................................................14 Total Caloric Intake.............................................................................................14 Body Weight........................................................................................................14
Discussion...................................................................................................................14
vi
3 EXPERIMENT 2–TEMPORAL AVAILABILITY...................................................18
Introduction and Rationale .........................................................................................18 Methods ......................................................................................................................19
Animals and Housing ..........................................................................................19 Food Conditions and Measures ...........................................................................19 Dessert Access.....................................................................................................20 Body Weight Measures .......................................................................................21 Data Analysis.......................................................................................................21
Results.........................................................................................................................21 Total Caloric Intake.............................................................................................21 Caloric Intake from Maintenance Diet and Sugar Gel ........................................21 Body Weight........................................................................................................22
Discussion...................................................................................................................22
4 EXPERIMENT 3–MACRONUTRIENT QUALITY.................................................28
Introduction and Rationale .........................................................................................28 Methods ......................................................................................................................29
Animals, Housing, and Feeding Conditions........................................................29 Dessert Access.....................................................................................................29 Body Weight Measures .......................................................................................29 Data Analysis.......................................................................................................29
Results.........................................................................................................................30 Total Caloric Intake.............................................................................................30 Caloric Intake from Maintenance Diet and Milk Gel..........................................30 Body Weight........................................................................................................31
Discussion...................................................................................................................31
5 EXPERIMENT 4–CALORIC DENSITY ..................................................................36
Introduction and Rationale .........................................................................................36 Methods ......................................................................................................................36
Animals and Housing ..........................................................................................36 Food Conditions and Measures ...........................................................................37 Dessert Access.....................................................................................................37 Body Weight Measures .......................................................................................38 Data Analysis.......................................................................................................38
Results.........................................................................................................................39 Total Caloric Intake.............................................................................................39 Caloric Intake from Maintenance Diet and Dessert ............................................39 Body Weight........................................................................................................40
Discussion...................................................................................................................40
6 EXPERIMENT 5–PREVIOUS DESSERT EXPERIENCE AND CHOICE .............48
Introduction and Rationale .........................................................................................48
vii
Methods ......................................................................................................................48 Animals, Housing, and Feeding Conditions........................................................48 Dessert Access.....................................................................................................49 Body Weight Measures .......................................................................................49 Data Analysis.......................................................................................................49
Results.........................................................................................................................50 Total Caloric Intake.............................................................................................50 Calories from Maintenance Diet and Desserts ....................................................50 Body Weight........................................................................................................51
Discussion...................................................................................................................51
7 EXPERIMENT 6–CIRCADIAN RHYTHMS ...........................................................59
Introduction and Rationale .........................................................................................59 Methods ......................................................................................................................59
Animals and Housing ..........................................................................................59 Food Conditions and Measures ...........................................................................60 Dessert Access.....................................................................................................60 Body Weight Measures .......................................................................................61 Data Analysis.......................................................................................................61
Results.........................................................................................................................61 Total Caloric Intake.............................................................................................61 Caloric Intake from Wet Mash and Dessert ........................................................62 Body Weight........................................................................................................62 Nocturnal and Diurnal Caloric Intake .................................................................63
Discussion...................................................................................................................63
8 DISCUSSION.............................................................................................................72
Experiment 1–Spatial Availability .............................................................................72 Experiment 2–Temporal Availability .........................................................................73 Experiment 3–Temporal Availability and Protein to Calorie Ratio ...........................75 Experiment 4–Energy Density....................................................................................76 Experiment 5–Previous Experience and Choice.........................................................77 Experiment 6–Circadian Rhythms..............................................................................79 Concluding Remarks ..................................................................................................80
LIST OF REFERENCES...................................................................................................82
BIOGRAPHICAL SKETCH .............................................................................................87

viii
LIST OF TABLES
Table page 2-1 Differences in the spatial availability of maintenance diet ......................................12
3-1 Differences in the temporal availability of dessert...................................................20
5-1 Differences in the energy density of dessert ............................................................37
6-1 Differences in previous desert experience ...............................................................49
7-1 Differences in time of daily access to dessert ..........................................................60

ix
LIST OF FIGURES
Figure page 2-1 Average daily caloric intake in Experiment 1. .........................................................16
2-2 Average cumulative body weight change in Experiment 1......................................17
3-1 Average daily caloric intake in Experiment 2. .........................................................24
3-2 Average daily caloric intake from maintenance diet and sugar gel in Experiment 2. ...............................................................................................................................25
3-3 Proportion of caloric intake in Experiment 2. ..........................................................26
3-4 Average cumulative body weight change in Experiment 2......................................27
4-1 Average daily caloric intake in Experiment 3. .........................................................32
4-2 Average daily caloric intake from maintenance diet and milk gel in Experiment 3. ...............................................................................................................................33
4-3 Proportion of caloric intake in Experiment 3. ..........................................................34
4-4 Average cumulative body weight change in Experiment 3......................................35
5-1 Average daily caloric intake in Experiment 4. .........................................................42
5-2 Average caloric intake from maintenance diet and dessert in Experiment 4. ..........43
5-3 Proportion of caloric intake in week one of Experiment 4. .....................................44
5-4 Proportion of caloric intake in week two of Experiment 4. .....................................45
5-5 Proportion of caloric intake in week three of Experiment 4. ...................................46
5-6 Average cumulative body weight change in Experiment 4......................................47
6-1 Average daily caloric intake in Experiment 5. .........................................................53
6-2 Average caloric intake from maintenance diet in Experiment 5. .............................54
6-3 Average caloric intake of sugar fat whip and sugar gel in Experiment 5. ...............55

x
6-4 Proportion of caloric intake in week one of Experiment 5. .....................................56
6-5 Proportion of caloric intake in week two of Experiment 5. .....................................57
6-6 Average cumulative body weight change in Experiment 5......................................58
7-1 Average daily caloric intake in Experiment 6. .........................................................65
7-2 Average caloric intake from maintenance diet in Experiment 6. .............................66
7-3 Average caloric intake from sugar fat whip in Experiment 6. .................................67
7-4 Proportion of caloric intake in Experiment 6. ..........................................................68
7-5 Average cumulative body weight change in Experiment 6......................................69
7-6 Average nocturnal caloric intake in Experiment 6...................................................70
7-7 Average diurnal caloric intake in Experiment 6.......................................................71

xi
Abstract of Thesis Presented to the Graduate School
of the University of Florida in Partial Fulfillment of the Requirements for the Degree of Master of Science
EFFECT OF FOOD AVAILABILITY ON LONG- AND SHORT-TERM CONTROLS OF FOOD INTAKE
By
Clare Marie Mathes
December 2005
Chair: Neil E. Rowland Major Department: Psychology
In the wake of an epidemic of obesity, the factors that promote eating in excess of
metabolic need must be explored and understood if effective prevention and treatment
strategies are to be implemented. Food intake and body weight have most often been
explored within the paradigm of homeostasis, the regulation of physiological parameters
that maintain internal constancy. The literature suggests that there are oral and
postingestive effects of food, such as taste, composition, and energy density, as well as
feeding economics and learned mechanisms, which have been demonstrated to impact
and overwhelm homeostatic mechanisms and promote overconsumption. The effect of
food availability on caloric balance and compensation has not been thoroughly explored,
yet has been suggested to play a roll in the development of obesity. In a series of six
experiments using female rats, we studied the impact of different spatial, temporal, and
qualitative availabilities of food on caloric intake and body weight gain. In the first
experiment, we demonstrated that food intake and body weight gain did not increase as a

xii
function of increased spatial availability of maintenance diet. In the second experiment,
we demonstrated that uninterrupted temporal availability of a low calorie dessert
promoted increased dessert consumption compared to intermittent availability, but did
not disrupt caloric balance. In the third experiment, we demonstrated that the findings of
the previous experiment were not a function of low protein availability, as the addition of
protein to the low calorie dessert produced the same results. In the fourth experiment, we
demonstrated that the availability of a single dessert with high energy density resulted in
increased caloric intake and body weight gain, with some evidence of short- and long-
term compensatory behaviors. In the fifth experiment, we demonstrated that previous
experience with dessert increased the probability of consuming desserts in the future. In
the sixth experiment, we attempted to produce an animal model of the human
phenomenon of Night Eating Syndrome, but demonstrated that caloric intake and body
weight gain did not increase as a function of diurnal access to a high calorie dessert.
Together, these findings suggest that certain factors of availability impact food intake and
caloric balance and demonstrate the need for further studies in this area.

1
CHAPTER 1 INTRODUCTION
The work described in this thesis originated in discussions concerning impulsive
eating and the implications of overconsumption on theoretical models of body weight
homeostasis. If the short-term and long-term limits of caloric compensation are tightly
regulated, then the obesity epidemic that is sweeping most postindustrial societies would
not exist. This introduction reviews the etiology of obesity, the mechanisms and limits of
a model of homeostatic regulation of body weight, and the factors of food that mediate
intake. The literature lacks examination of the effect of food availability and
experimental protocols that explore situations of increased access to free food. We
attempted to address this issue in a series of six experiments, which comprise this thesis.
Obesity and Public Health
The high incidence of obesity in the human population has become a significant
threat to public health. Epidemiological studies in postindustrial countries show that food
intake and body weight are rising at an alarming rate (Center for Disease Control 2004,
Rudolf et al. 2004, Flegal et al. 2002, Gutierrez-Fisac et al. 2000). Obesity threatens
health and productivity (Mokadad et al. 2003, Must et al. 1999) due to its strong positive
correlations with diabetes (Chan et al. 1994), cardiovascular disease (Martins et al. 2003),
and cancer (Bianchini et al. 2002).
Definition of Obesity
Obesity, ultimately the result of an imbalance between energy input and energy
output, has been described as a multifactorial phenomenon resulting from genetic

2
predisposition either triggered or exacerbated by environmental pressures (Bray 1996).
While consuming calories in excess of physiological need might have been evolutionarily
advantageous in the unpredictable ancestral environment, the human genome has not
adapted to the conditions in modern times in which food has become readily available.
Today’s trend toward obesity can be functionally viewed as a behavioral inability to
compensate for this sudden change in the quantity and quality of food. The factors
promoting eating in excess of physiological need must be understood if effective
strategies are to be developed for the prevention and treatment of obesity.
Body Weight and Homeostasis
The genes, systems, and behaviors selected in times of lesser food availability have
been studied extensively and most often have been organized within a homeostatic
framework. Homeostasis is a term that was introduced by Cannon (1929) to describe the
means by which the body achieves the relative constancy of physiological parameters. If
body weight is a regulated variable controlled by a homeostatic mechanism, some
factor(s) derived from food must be represented by the endogenous production of signals
that can be detected by the brain and compared to some ideal or set point value dictated
by genetics. One such factor is likely to be the amount of metabolizable energy stored in
the body. The discrepancy between this hypothetical set point and energy influx and
output would produce an error signal that would increase or decrease feeding behavior
accordingly. For example, Cannon proposed that food intake is based primarily on
peripheral cues, such as contractions by the empty stomach; however, feeding behavior
usually occurs before the stomach empties fully and for this and other reasons, purely
“peripheral” accounts are inadequate. Many correlates of the body's nutritive status have
been identified and described in various theories.

3
The Glucostatic Hypothesis
Mayer (1954) hypothesized that short-term homeostatic regulation of eating was
regulated through detection of changes in blood glucose levels. Glucose in the blood
triggers the release of insulin, a pancreatic hormone that polymerizes glucose into
glycogen and stores it in the liver and muscles. Insulin crosses the blood brain barrier at
the circumventricular organs and centrally acts as a correlate of the mobilization of
energy into cells, thus reducing food intake. Support of this action can be shown with
exogenous administration, pharmacological manipulation, and genetic deficiencies (as
reviewed in Benoit et al. 2004). The glucostatic hypothesis offers an explanation of the
short-term control of glucose levels in blood, but Mayer argued that there must be means
by which changes in whole-body nutritive status could be compared to overall body
energy stores and thus, alter behavior over time. He supported a contemporaneous theory
proposing the lipostatic control of body weight to round out glucostasis.
The Lipostatic Hypothesis
Kennedy's lipostatic hypothesis (1953) addressed energy balance by advocating fat
stores as the regulated variable in the maintenance of body weight. Because adipose
tissue is distributed in many depots and these do not have known neural connections to
the brain, a circulating factor correlated with lipid stores is a necessary component for a
lipostatic mechanism. After many years of searching, leptin was identified in the 1990's
as a candidate mechanism. Leptin is secreted by adipocytes in amounts proportional to
the amount of fat stored, has receptors in key brain regions, and peripheral or central
administration of leptin has been shown to decrease food intake (reviewed in Benoit et al.
2004). The glucostatic and lipostatic hypotheses purport ways in which the peripheral

4
nutritive status of the body can be communicated to the brain, which uses the information
to alter behavior by signaling states of hunger and satiety.
Central Integration
The findings related to the glucostatic and lipostatic theories added support to
Stellar's (1954) proposal of a dual brain center located primarily in the hypothalamus that
integrates multiple factors to control motivated behaviors of which feeding is a key
example. Since then, most new findings in the field have been viewed in this construct
and it has predictive value as a model. Numerous neural pathways and associated
peptides have been discovered that support the concept of individual molecules or
systems for hunger and satiety (Bagnasco et al. 1999).
The hypothalamus is often considered the brain area most directly responsible for
integrating information about food stimuli and accommodating behavioral change.
Separate areas are associated with certain physiological states and behavior patterns. The
ventromedial nucleus of the hypothalamus (VMH) has been suggested to be a satiety
center, since rats with lesions of this area engage in hyperphagia and gain a large amount
of weight. The VMH contains receptors for a number of identified anorexigens, such as
leptin and pro-opoiomelanocortin (POMC). The lateral hypothalamus (LH) has been
suggested to be a hunger center since its destruction results in aphagia and weight loss.
The LH contains neurons that produce orexigens, such as neuropeptide Y (NPY) and
agouti-related peptide (AgRP). It has been suggested that these areas interpret cues from
food and endogenous correlates of nutritive status, integrate information concerning the
need for nutrients, and change behavior accordingly. It has been suggested that lesions of
these areas produce changes in body weight set point (Hoebel and Teitelbaum 1971).
Friedman and Stricker (1976), however, argued against the perspective of hunger and

5
satiety controlled by the brain, and postulated basic biochemical processes of energy
metabolism, especially liver function, as the foundation of food intake. This theory
rejects the need for constructs such as body weight set point and explains changes in the
food intake of VMH and LH lesioned animals as a result of disruption of lipogenesis.
None of these theories, however, address why intact animals with nutritional
excesses might still eat, although this phenomenon has been extensively reported
(Sclafani 1980, pp. 166-81). It is plausible that some variables in the environment may
promote overconsumption and overwhelm these homeostatic mechanisms. The factors of
food that influence consumption are discussed below.
Dietary Determinants of Energy Balance
Woods (1991) argued that since consuming food disturbs the internal milieu, the
body must interpret cues inherent in or caused by food to emit appropriate behavior to
maintain constancy. There are multiple aspects of food that can be detected and affect
the body. Oral and postoral factors of food, such as taste, the relative hedonic evaluation
of flavors (palatability), macronutrient composition, volume and moisture content, and
the energy density of the food (Sclafani 2004), as well as the relative cost and learned
feeding patterns affect intake. The consequences of these factors on physiological state
would need to be assessed in order to determine energy balance and alter behavior to
maintain relative constancy. Studies have been conducted addressing how these factors
influence consumption.
Oral Cues
The taste and/or texture of a consumable are the first ways the body detects the
influx of nutrients. By using experimental techniques that minimize postingestive
effects, such as brief tests, licking, sham-feeding, taste reactivity, and operant methods,

6
we can ask animals questions about what behavior certain taste stimuli elicit and evoke
(Spector 2000). Taste is often indicative of food composition and there seems to be
innate preferences for sweet and avoidance of bitter tastes. Animals will work harder in
the presence of a sweet taste that acts as a discriminative stimulus (“electronic
esophagus” preparation, Sclafani 1990 as reviewed in 2004) or when the taste acts as a
consequence of operant performance (progressive ratio breakpoints, Sclafani and Ackroff
2003). Taste independent of ingestion can cue feedback systems, such that insulin is
released when a sweet flavor is detected (cephalic insulin responses, Steffens 1976 as in
Woods 1991). Flavors can also be classically conditioned to reduce behavior, the most
potent example being that of conditioned flavor avoidance (Garcia et al. 1956). Taste is
linked to, but differs from palatability, the reward potential of an appetitive stimulus.
Flavors are conditioned as palatable due to their postingestive effects, which
demonstrates that consequences at the systemic level are able to influence behavior.
Postoral Cues
A food's taste is in part determined by its macronutrient composition, which relates
to the innate preferences influencing intake that were described above. Warwick and
Weingarten (1995) demonstrated that when contingent on a licking response requirement,
rats that were infused intragastrically with nutrients proportionally high in calories from
fat showed greater caloric intake and body weight gain than rats given nutrients high in
carbohydrates. Woods et al. (2004, 2003) advocated the role of the postingestive
consequences of the amount of fat in food. He developed a protocol in which rats were
given either a high fat or low fat diet or fed the high fat diet matched daily to the caloric
intake of the rats fed the low fat diet (since the two diets were not isocaloric). Rats fed ad
libitum high fat diet gained more weight and developed hyperleptinemia and insulin

7
resistance compared to the rats fed low fat diet. The rats which were fed high fat diet
matched to the caloric consumption of rats fed low fat diet had similar body weights to
the rats fed low fat diet, but had much greater body adiposity, suggesting that the level of
fat or the energy density of a maintenance diet affect fat deposition. Warwick et al.
argued and demonstrated (2002, 1992) that increased caloric intake and body weight gain
from high fat diets are a function of the fat content rather than the energy density. Rats
were given isocaloric diets high in either fat or carbohydrate or those diets diluted to half
the energy density. Rats given the diets high in fat, diluted or not, gained more weight
than those on the high carbohydrate diets. Lucas et al. (1989) demonstrated fat selection
and consumption as dependent on the type and form of fat and the availability of other
macro- and micronutrients. He argued that the behavior change is determined primarily
by postingestive factors and that the short-term controls of satiation and satiety are less
affected by fat than other macronutrients due to weaker feedback signals.
The macronutrient composition of a food determines its caloric density, with fat
contributing approximately 9 kcal of energy per gram (kcal/g). The water content also
influences the amount of energy within a certain portion, resulting in a high satiating
power of food with large amounts of bulk and water (Drewnowski 2004). Dry foods with
high caloric density result in the reverse, having a small effect on satiation and promoting
increased consumption. Rolls et al. (2005, 2000) demonstrated by altering the
macronutrient status and palatability of foods that human satiety and satiation are
influenced most directly by the energy density and portion size of food.
Behavioral Economics
The cost of food determines how readily and how much food is consumed. Since
food in post-industrial societies has become easily available, this may also be
8
contributing to the rise in body weight. Ackroff and Sclafani (1999) have explored this
by integrating the electronic esophagus paradigm with a foraging paradigm. In a protocol
originally conceived by Collier (1985), food procurement cost is simulated by imposing a
cost (usually a lever press) to gain access to a large amount of food. Collier found that in
a wide range of conditions and species, as cost of procurement goes up, meal frequency
goes down and mean meal size increases such that total intake is conserved except at the
highest costs. Ackroff and Sclafani (1999) showed that increasing food cost blunts rats'
responses to the changes in palatability. Collier and Johnson (2000) have also shown that
the cost of sucrose correlates with its consumption and that the relative cost of nutrients
plays a large role in food selection and intake.
Learned Feeding Patterns
The economics of food described above and the presence of circadian rhythms set a
culture of appropriate behavior concerning food. In the last century, advances in food
technology and distribution have led to an unprecedented range of food choices for most
humans, often with the foods of higher energy density being the least expensive
(Drewnowski 2004). Snacking has become a cultural norm and is prevalent in obese
humans (Berteus Forslund et al. 2005). This behavior is maintained through schedules
deemed appropriate by our verbal community, although aberrant behavior can be
conditioned (e.g., Binge Eating Disorder and Night Eating Syndrome, Tanofsky-Kraff
and Yanovski 2004).
Limits of Homeostasis
In a homeostatic system, the oral, postoral, economic, and learned cues about food
must be integrated in a way to behaviorally control the stability of body weight. It has
been demonstrated, however, that all these factors have the potential to override the
9
homeostatic controls of energy balance. This may be because in terms of “conscious
awareness” (stimuli about which one can engage in verbal behavior), the only stimuli we
utilize are those associated with the all-or-none behavioral assessment of, “eat this, don't
eat that”. The impulsive choice of responding in the presence of consumables that have
in the past resulted in pleasant oral and/or postingestive consequences will occur with a
higher probability than the choice heeding the homeostatic push of the body to remain at
a hypothetical set point. Body weight regulation seems to have evolved in a way which
ensures defense against weight levels being lower than a certain level, but predisposes
toward excess weight gain under comfortable conditions, since this, as stated previously,
would have been a survival enhancing set of behaviors.
The homeostatic model, which advocates a body weight set point and behavioral
maintenance of constancy, is incapable of addressing why humans are now in the midst
of an obesity epidemic. Bolles (1980, pp. 63-76) argued against body weight regulation,
attributing fluctuation to linear associations between environmental and physiological
factors such as palatability, satiety, storage, and cost. All these factors have been shown
to affect the body weight of even genetically homogeneous laboratory animals, the most
well known being the phenomenon of diet-induced obesity and the effect of cafeteria
diets (see Sclafani 1980 for review). New models of feeding and body weight address the
impact of the environment and include both homeostatically 'compensated' and non-
homeostatic 'uncompensated' factors (De Castro and Plunket 2002).
The Influence of Availability
The studies described in this introduction have addressed how qualitative aspects of
food and their economics affect intake and body weight gain. Relatively few studies
have explored the influence of food availability. Situations that promote increased access
10
to free food more closely model the modern postindustrial human environment, and so
manipulations of food availability may provide information on which environmental
factors disrupt caloric compensation and influence body weight. Availability has many
facets, including spatial, temporal, and qualitative aspects, none of which are mutually
exclusive. In a series of six experiments, we attempted to separate these parameters of
food availability and we explored their effect on the balance of caloric intake and the
compensatory mechanisms associated with body weight change in rats.
11
CHAPTER 2 EXPERIMENT 1–SPATIAL AVAILABILITY
Introduction and Rationale
Spatial availability can be defined as the amount of a commodity within a certain
area at a specific time. It is plausible that the amount of food in the vicinity might
influence how much is consumed at that time. Tordoff (2002) demonstrated that the
amount and location of consumables affect preference and intake in rats. In his study,
rats were provided with access to multiple fluid sources in their home cage, consisting of
either water or a sucrose solution. Some rats were given more sucrose than water sources
and some were given more water than sucrose sources. Rats provided with more sucrose
locations than water consumed more sucrose than rats provided with more water
locations than sucrose. He concluded that this shift in preference and intake was the
result of increased spatial access to an otherwise free commodity. In the first experiment,
we tested the hypothesis that increased intake as a function of increased spatial
availability would generalize to increased consumption of maintenance diet in rats.
Specifically, we hypothesized that rats presented with four jars of chow would eat more
than those with one jar of chow.
Methods
Animals and Housing
The animals used were 30 female retired breeder Sprague Dawley rats (Harlan,
Indianapolis, IN) weighing between 250 and 350 g at the start of the experiment. The
animals were housed individually in polycarbonate tub cages (48x27x20 cm) containing

12
approximately 2 cm depth of Sani-Chips bedding (Teklad, Madison, WI) in a vivarium
maintained at 22 + 2 °C. The rats were kept on a reverse light cycle (lights on from 2200
to 1000 h and off from 1000 to 2000 h) such that all procedures were conducted in the
dark, which is when rats are most active and consume the majority of their food. These
and all the animal procedures presented in this thesis were conducted in accordance with
good laboratory standards and were approved by the University of Florida Institutional
Animal Care and Use Committee prior to implementation.
Food Conditions and Measures
All rats were provided with ad libitum access to tap water and standard powdered
rat chow (Purina 5001, 3.34 kcal/g). Chow was presented in 50 ml glass jars suspended
within the home cage using a custom-made metal stirrup. Daily intakes of chow were
measured for a two week baseline phase by subtracting the remaining chow and hopper
weight from that originally presented. The jars were refilled each day at the start of the
dark cycle. Five groups of six rats were defined such that the average daily caloric intake
during the baseline phase was equivalent between groups. Following the baseline period,
the rats entered the experimental phase during which five different conditions of food
availability were studied.
Table 2-1: Differences in the spatial available of maintenance diet Group Type of maintenance diet Number of jars Where in cage 1 Standard chow 1 1 corner 2 Standard chow 4 4 corners 3 High fat diet 1 1 corner 4 High fat diet 4 4 corners 5 Both 2 of each 4 corners
Two groups of rats continued to receive the standard powdered chow, but with
different spatial availability. Group 1 was maintained on baseline conditions with one jar

13
of chow in one corner of the cage and Group 2 was provided with a jar of chow hung in
each corner of the home cage for a total of four jars of food. In order to assess if an effect
would be different based on the quality (e.g., palatability, macronutrient composition) of
the maintenance diet, a high fat diet was provided to the two other groups of rats. The
high fat diet consisted of two parts powdered chow mixed with one part softened
vegetable shortening (estimated to yield approximately 5.24 kcal/g), a combination
known to be highly palatable to rats and to promote weight gain (Corbit and Stellar
1964). Group 3 was given one jar of high fat diet and Group 4 provided with four jars of
high fat diet. The final group received two jars of standard chow and two jars of high fat
diet (Group 5). The experimental phase lasted three weeks, during which food intake was
measured daily. Data were excluded from analysis if upon visual inspection spillage
appeared to be greater than 5 g.
Body Weight Measures
Body weight was measured twice weekly in the experimental phase. Cumulative
body weight gain was calculated by subtracting the last body weight measurement taken
during the baseline period from those taken throughout the experimental phase.
Data Analysis
Daily caloric intake and change in body weight of each rat were calculated. This
was then averaged between rats within a single group over each week. Between group
analyses were assessed using SPSS (SPSS, Chicago, IL) one-way ANOVAs and Tukey
posthoc tests with a significance criteria of p<0.05.

14
Results
Total Caloric Intake
Figure 2-1 shows the total caloric intake of the five groups by experimental week
and compared to baseline consumption. Group differences in caloric intake were
observed in experimental weeks 2 and 3. Rats in Groups 1 and 2, which were given
either one or four jars of standard powdered chow, respectively, consumed more calories
than those in Groups 3 and 4, which were given either one or four jars of high fat diet,
respectively (Week 2: F(4,29)=5.934, p<0.01; Week 3: F(4,29)=7.076, p<0.01). Rats in
Group 5, which were given two jars of each maintenance diet type consumed exclusively
high fat diet and showed no difference in caloric intake from Groups 3 and 4. Total
caloric intake did not vary as a function of the number of jars for either type of
maintenance diet.
Body Weight
Figure 2-2 shows the average cumulative body weight gain from baseline of the
five groups by experimental week. Those groups given high fat diet (Groups 3, 4, and 5)
gained more weight than those given standard powdered chow (Groups 1 and 2) in each
experimental week (Range of F's: F(4,29)=9.405-3.931, all p's<0.01). Body weight gain
did not vary as a function of the number of jars for either type of maintenance diet.
Discussion
Based on results of Tordoff’s study (2002), which showed that consumption of a
sucrose solution was greater when it was presented in greater proportions, we
hypothesized that the caloric intake of maintenance diet and body weight would increase
as a function of increased spatial availability, such that rats given four jars of any diet
type would consume more calories and gain more weight than those given one jar of that
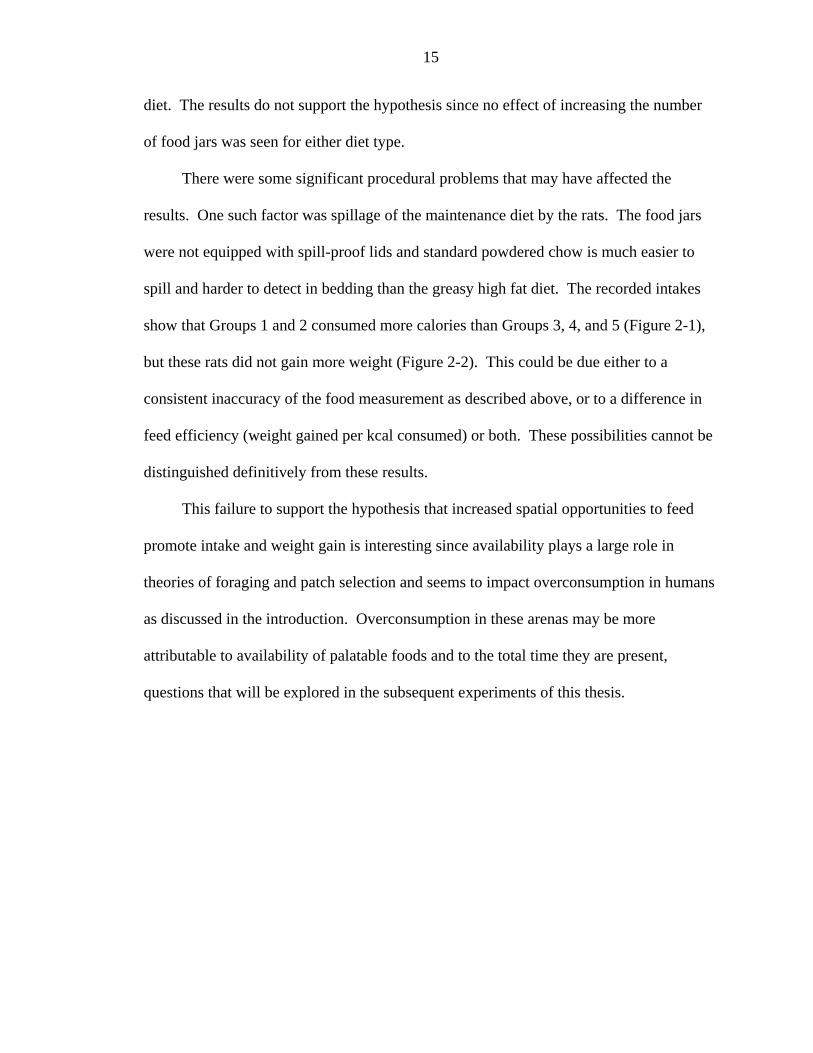
15
diet. The results do not support the hypothesis since no effect of increasing the number
of food jars was seen for either diet type.
There were some significant procedural problems that may have affected the
results. One such factor was spillage of the maintenance diet by the rats. The food jars
were not equipped with spill-proof lids and standard powdered chow is much easier to
spill and harder to detect in bedding than the greasy high fat diet. The recorded intakes
show that Groups 1 and 2 consumed more calories than Groups 3, 4, and 5 (Figure 2-1),
but these rats did not gain more weight (Figure 2-2). This could be due either to a
consistent inaccuracy of the food measurement as described above, or to a difference in
feed efficiency (weight gained per kcal consumed) or both. These possibilities cannot be
distinguished definitively from these results.
This failure to support the hypothesis that increased spatial opportunities to feed
promote intake and weight gain is interesting since availability plays a large role in
theories of foraging and patch selection and seems to impact overconsumption in humans
as discussed in the introduction. Overconsumption in these arenas may be more
attributable to availability of palatable foods and to the total time they are present,
questions that will be explored in the subsequent experiments of this thesis.

16
Effect of 4 versus 1 jar of standard or high fat maintenance dieton average daily caloric intake
Phase of Study
BLW EW1 EW2 EW3
Dai
ly C
alor
ic In
take
0
20
40
60
80
100
120
140
Group 1 -- 1 jar of standard maintenance dietGroup 2 -- 4 jars of standard maintenance dietGroup 3 -- 1 jar of high fat maintenance dietGroup 4 -- 4 jars of high fat maintenance dietGroup 5 -- 2 jars of each type of diet
Figure 2-1: Average daily caloric intake in Experiment 1 (shown in bars and vertical lines
represent SEM in this and all figures) of the five groups (shown in legend) by experimental week (EW) and compared to the average intake over two weeks of baseline conditions (BLW), in which all rats had ad libitum access to one jar of standard maintenance diet. In EW2&3, Group 1 and 2 consumed more calories than Groups 3, 4, or 5.

17
Effect of 4 versus 1 jar of standard or high fat maintenance dieton body weight change
Phase of Study
EW1S EW1E EW2S EW2E EW3S EW3E
Bod
y W
eigh
t Cha
nge
-40
-20
0
20
40
Group 1 -- 1 jar of standard maintenance dietGroup 2 -- 4 jars of standard maintenance dietGroup 3 -- 1 jar of high fat maintenance dietGroup 4 -- 4 jars of high fat maintenance dietGroup 5 -- 2 jars of each diet type
Figure 2-2: Average cumulative body weight change in Experiment 1 of the five groups
(shown in legend) by experimental week (EW) calculated by subtracting the last body weight measurement of baseline conditions from body weight measurements during the three experimental weeks. Body weight was measured twice during each EW and each measurement is denoted as either S=start, beginning of the week or E=end, last day of the week. No significant differences were seen between groups.

18
CHAPTER 3 EXPERIMENT 2–TEMPORAL AVAILABILITY
Introduction and Rationale
In the previous experiment, we explored the role of spatial availability in food
consumption. Another aspect of availability is that of temporal opportunity. Temporal
availability can be defined as the number of times a commodity is available and the mean
time it is present at each appearance. Temporal and spatial availability are not mutually
exclusive, but based on the null findings of the previous experiment, when a commodity
is present may have more impact than where or how much.
Snacking is positively related to energy intake and one of the most predictive
correlates of obesity (Berteus Forslund et al. 2005). In a typical modern American home
or workplace, people are constantly bombarded with opportunities to consume palatable
food outside of normal meal taking. Opportunity to consume extra calorie sources may
impact overconsumption more so than increased ingestion during meals. This can be
explored in rats through the use of a dessert protocol in which rats are given free access
to a palatable snack in addition to ad libitum maintenance diet. We hypothesized that
giving rats a palatable extra calorie source would result in increased daily caloric intake
and subsequent body weight gain.
The temporal dimensions of snack presentation may play a role in consumption of
the snack and the meals taken after it. The phenomenon of sensory specific satiety is said
to have occurred if intake and/or ratings of food that has been consumed recently are
lower compared to new foods (Rolls et al. 1981). This has been explored extensively in

19
terms of food variety (Raynor and Epstein 2001), but very little in relation to food
availability. If dessert access is uninterrupted, sensory specific satiety may occur quickly
and intake may decrease and stop after an initial period of consumption. Intermittent or
variable access may override this and the “novel” treat may be consumed equally at each
presentation. Uninterrupted presentation of dessert may facilitate compensation of the
extra calories, while intermittent access may impede this. We hypothesized that rats
given intermittent access to dessert would consume more dessert compared to rats given
uninterrupted access to dessert. We also hypothesized that the former group would not as
accurately compensate these extra calories by reducing intake of maintenance diet and
thus display increased daily caloric intake and body weight gain.
Methods
Animals and Housing
The animals used in this study were 24 of the 30 rats from experiment 1 (the six
rats that consistently spilled chow were excluded). The rats were maintained in the
housing conditions previously described.
Food Conditions and Measures
All rats were provided with ad libitum access to one jar of standard powdered rat
chow as in the baseline phase of experiment 1. Baseline intake was calculated for three
days prior to study and these data were used to define four groups of six rats such that the
average daily caloric intake was equivalent between groups.
In the two weeks of the experimental phase, rats in Groups 1 and 2 were
maintained on one jar of standard powdered chow and Groups 3 and 4 on one jar of the
high fat diet used in experiment 1. Food intake was measured daily and maintenance diet

20
was refilled daily at the start of the dark cycle. Data were excluded from analysis if upon
visual inspection spillage appeared to be greater than 5 g.
Dessert Access
The extra calorie source in this experiment was a sugar gel made by dissolving 60 g
of white sugar and 10 g gelatin in 1000 ml of tap water (estimated to yield approximately
0.31 kcal/g). The solution was poured into 50 ml glass jars, covered, and allowed to
solidify in a refrigerator overnight. The jar of sugar gel was then attached to a metal
stirrup and suspended in a corner of the home cage. The effect of evaporation of the
sugar gel was measured prior to the experiment and since there was little effect, it was
not considered in the analysis.
Table 3-1: Differences in the temporal availability of dessert Group Maintenance diet Presentation of Sugar Gel across 8 h at Night 1 Standard chow Uninterrupted 2 Standard chow Intermittent 3 High fat diet Uninterrupted 4 High fat diet Intermittent
Groups 1 and 3 had uninterrupted nocturnal access to the sugar gel from 1000 h to
1800 h seven days a week during the experimental phase. Rats in Groups 2 and 4 were
provided with sugar gel during the same 8 h time interval, but in a series of four 30-
minute sessions every 2 h (sugar gel access from 1000 h – 1030 h, 1230 h – 1300 h, 1500
h – 1530 h, and 1730 h – 1800 h) for a total of 2 h of access. Daily intake of sugar gel
was measured by subtracting the weight of the remaining gel and hopper from that
originally presented. All jars of sugar gel were observed at the time of the third session
and if greater than or equal to 40 g of gel had been consumed by that time, that rat
received a new 50 ml jar of sugar gel.
21
Body Weight Measures
Body weight was measured twice weekly during the experimental phase.
Cumulative body weight gain was calculated by subtracting the last body weight
measurement taken during the baseline period from those measured during the
experimental phase.
Data Analysis
Daily intakes of sugar gel, maintenance diet, and total calories, as well as change in
body weight of each rat were calculated. These measures were then averaged between
rats within a single group over a week. Between group analyses were assessed using
SPSS (SPSS, Chicago, IL) one-way ANOVAs and Tukey posthoc tests with a
significance criterion of p<0.05. One rat from Group 1 was excluded from analysis due
to extremely low gel consumption.
Results
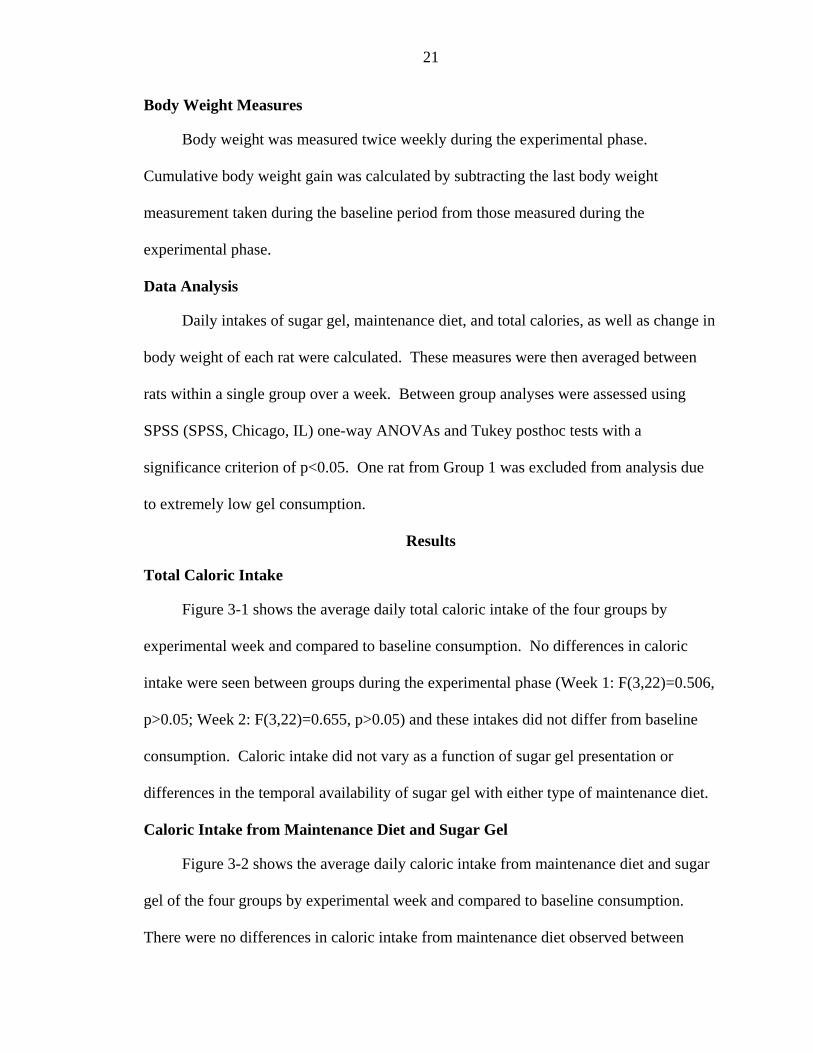
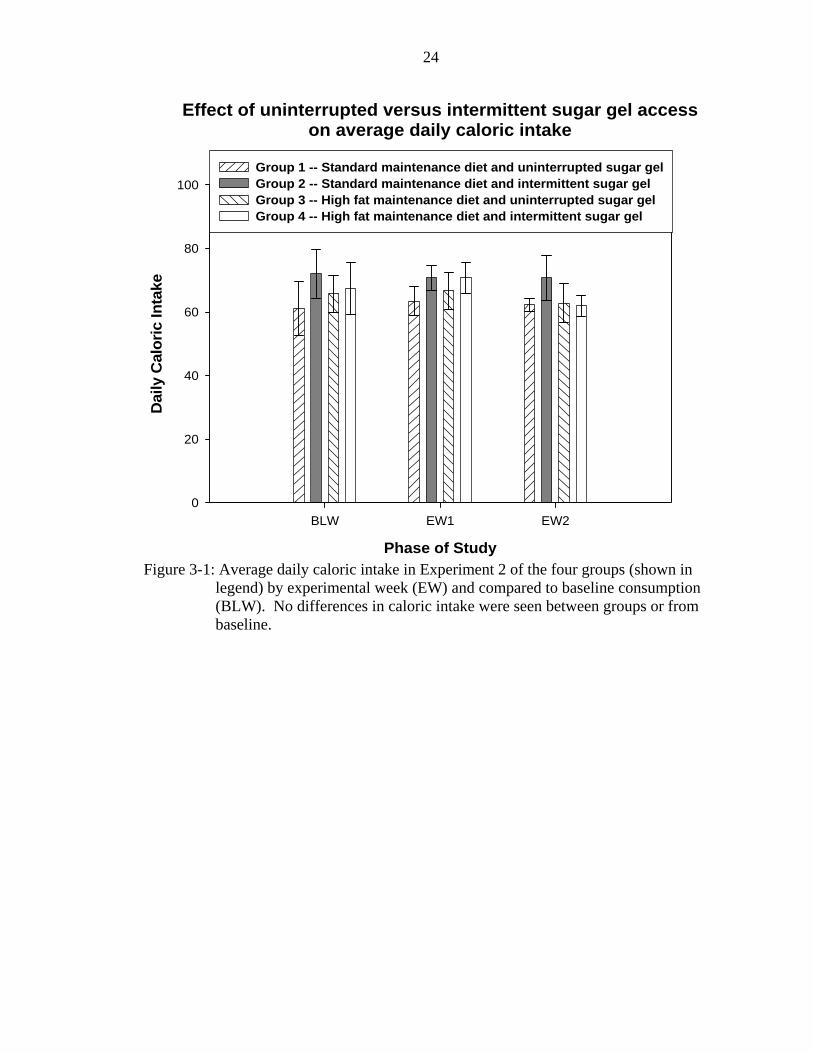
Total Caloric Intake
Figure 3-1 shows the average daily total caloric intake of the four groups by
experimental week and compared to baseline consumption. No differences in caloric
intake were seen between groups during the experimental phase (Week 1: F(3,22)=0.506,
p>0.05; Week 2: F(3,22)=0.655, p>0.05) and these intakes did not differ from baseline
consumption. Caloric intake did not vary as a function of sugar gel presentation or
differences in the temporal availability of sugar gel with either type of maintenance diet.
Caloric Intake from Maintenance Diet and Sugar Gel
Figure 3-2 shows the average daily caloric intake from maintenance diet and sugar
gel of the four groups by experimental week and compared to baseline consumption.
There were no differences in caloric intake from maintenance diet observed between

22
groups during either experimental week (Week 1: F(3,22)=1.861, p>0.05; Week 2:
F(3,22)=1.505, p>0.05) and these intakes did not differ from baseline consumption.
There were, however, differences seen in average caloric intake from sugar gel between
groups during both experimental weeks (Week 1: F(3,22)=9.066, p<0.01, Week 2:
F(3,22)=7.163, p<0.01). Tukey tests showed that Group 1, which had uninterrupted
access to sugar gel in conjunction with standard maintenance diet, consumed more sugar
gel than Groups 3 and 4, which were given sugar gel in conjunction with high fat
maintenance diet.
Figure 3-3 shows the proportion of calories from maintenance diet and sugar gel
averaged over the two experimental weeks and compared to baseline caloric intake from
standard chow. In all groups, the extra calories consumed from sugar gel were accurately
compensated through the slight reduction in the intake of maintenance diet.
Body Weight
Figure 3-4 shows the cumulative body weight change from baseline of the four
groups by experimental week. There were no differences in body weight change from
baseline or between groups (range of F's: F(3,22)=0.925-0.706, all p's>0.05).
Discussion
Based on human data that suggest snacking to be predictive of obesity (Berteus
Forslund et al. 2005), we hypothesized that providing rats with free access to a sugar gel
dessert would increase total caloric intake and body weight. This dessert is palatable,
evidenced by rats' high and immediate consumption of the preparation. The results do
not support the hypothesis, but rather demonstrate the ability of rats to compensate for
these extra calories by slightly reducing chow intake, thereby defending their baseline
23
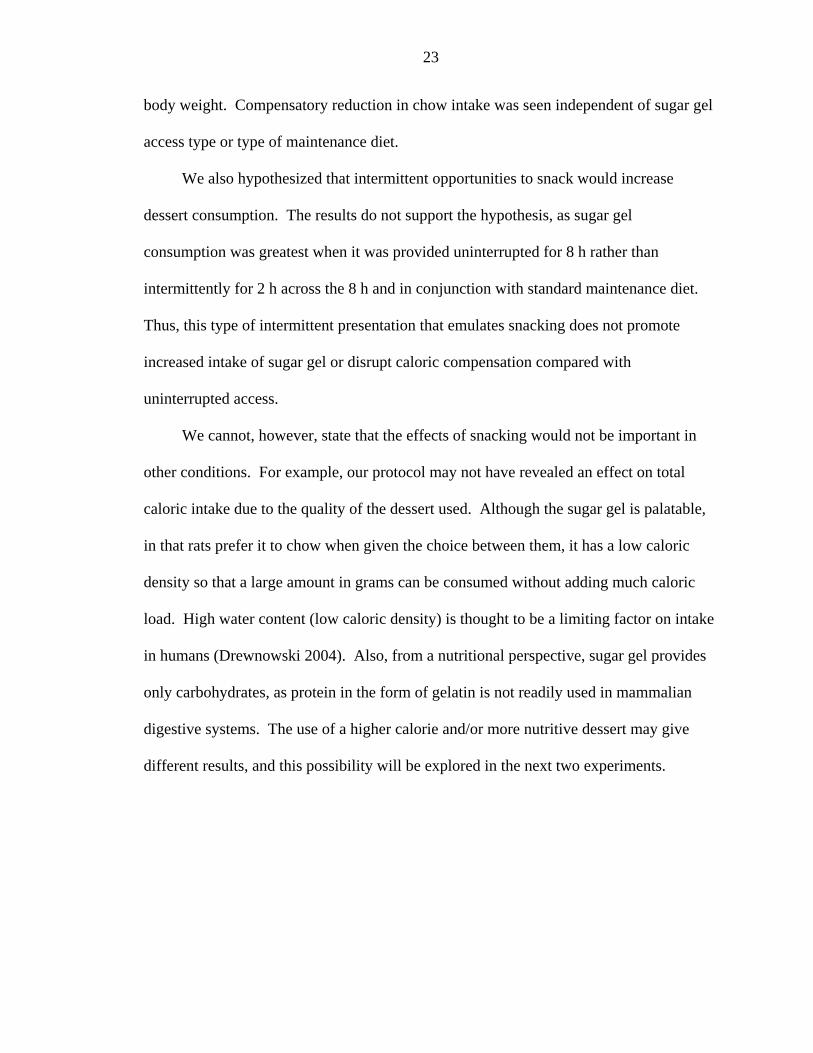
body weight. Compensatory reduction in chow intake was seen independent of sugar gel
access type or type of maintenance diet.
We also hypothesized that intermittent opportunities to snack would increase
dessert consumption. The results do not support the hypothesis, as sugar gel
consumption was greatest when it was provided uninterrupted for 8 h rather than
intermittently for 2 h across the 8 h and in conjunction with standard maintenance diet.
Thus, this type of intermittent presentation that emulates snacking does not promote
increased intake of sugar gel or disrupt caloric compensation compared with
uninterrupted access.
We cannot, however, state that the effects of snacking would not be important in
other conditions. For example, our protocol may not have revealed an effect on total
caloric intake due to the quality of the dessert used. Although the sugar gel is palatable,
in that rats prefer it to chow when given the choice between them, it has a low caloric
density so that a large amount in grams can be consumed without adding much caloric
load. High water content (low caloric density) is thought to be a limiting factor on intake
in humans (Drewnowski 2004). Also, from a nutritional perspective, sugar gel provides
only carbohydrates, as protein in the form of gelatin is not readily used in mammalian
digestive systems. The use of a higher calorie and/or more nutritive dessert may give
different results, and this possibility will be explored in the next two experiments.
24
Effect of uninterrupted versus intermittent sugar gel accesson average daily caloric intake
Phase of Study
BLW EW1 EW2
Dai
ly C
alor
ic In
take
0
20
40
60
80
100Group 1 -- Standard maintenance diet and uninterrupted sugar gelGroup 2 -- Standard maintenance diet and intermittent sugar gelGroup 3 -- High fat maintenance diet and uninterrupted sugar gelGroup 4 -- High fat maintenance diet and intermittent sugar gel
Figure 3-1: Average daily caloric intake in Experiment 2 of the four groups (shown in
legend) by experimental week (EW) and compared to baseline consumption (BLW). No differences in caloric intake were seen between groups or from baseline.

25
Effect of uninterrupted versus intermittent access to sugar gelon caloric intake from maintenance diet and sugar gel
Phase of Study
BLW MD EW1 MD EW2 MD EW1 SG EW2 SG
Dai
ly C
alor
ic In
take
0
20
40
60
80
100Group 1 -- Standard maintenance diet and uninterrupted sugar gelGroup 2 -- Standard maintenance diet and intermittent sugar gelGroup 3 -- High fat maintenance diet and uninterrupted sugar gelGroup 4 -- High fat maintenance diet and intermittent sugar gel
Figure 3-2: Average daily caloric intake from maintenance diet (MD) and sugar gel (SG)
in Experiment 2 of the four groups (shown in legend) by experimental week (EW) and compared to baseline consumption (BLW). No differences in MD consumption were seen between groups. Group 1 consumed more SG than groups 3 and 4 in both experimental weeks.

26
Effect of uninterrupted versus intermittent sugar gel accesson average caloric intake from maintenance diet and sugar gel
BL G1 G2 G3 G4
Dai
ly C
alor
ic In
take
0
20
40
60
80
100Maintenance diet: 3.34 (G1&2) or 5.24 (G3&4) kcal/gSugar Gel: 0.31 kcal/g
Figure 3-3: Proportion of caloric intake in Experiment 2 from maintenance diet and sugar
gel by group (G, see legend of Figure 3-2 for description) averaged over the two experimental weeks and compared to the overall average baseline (BL) intake from standard maintenance diet.
27
Effect of uninterrupted versus intermittent sugar gel accesson body weight change
Phase of Study
EW1S EW1E EW2S EW2E
Bod
y W
eigh
t Cha
nge
-15
-10
-5
0
5
10
15
Group 1 -- Standard maintenance diet and uninterrupted sugar gelGroup 2 -- Standard maintenance diet and intermittent sugar gelGroup 3 -- High fat maintenance diet and uninterrupted sugar gelGroup 4 -- High fat maintance diet and intermittent sugar gel
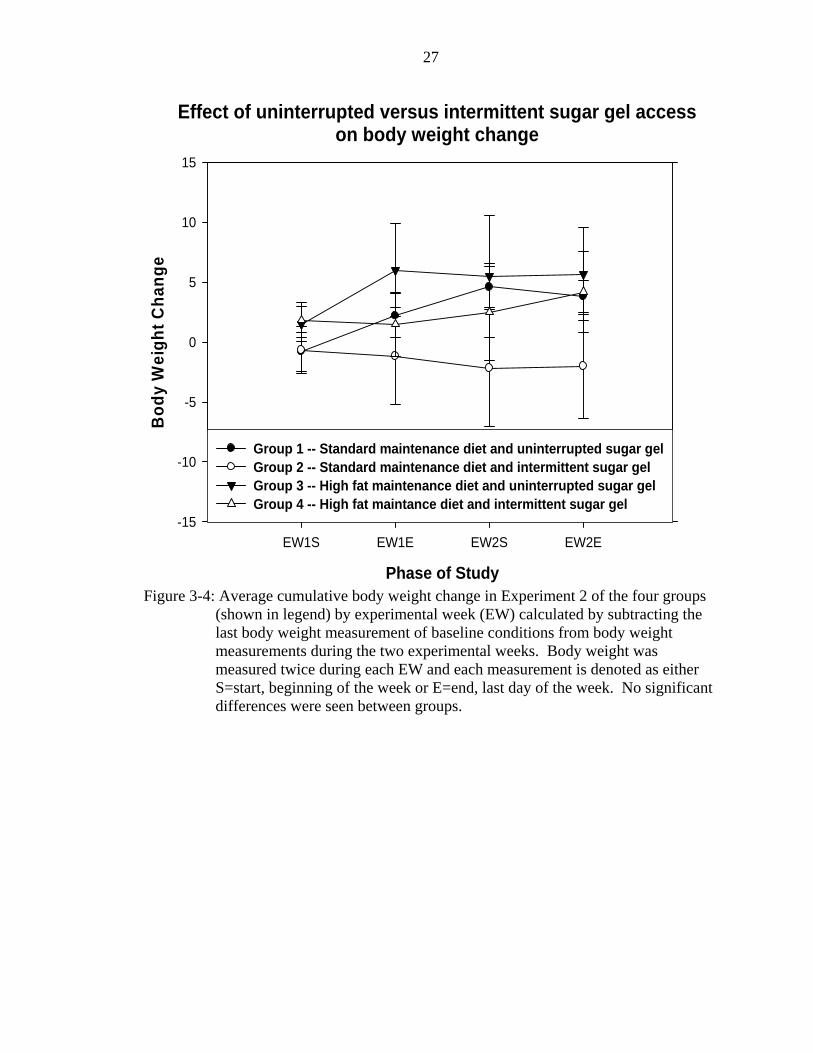
Figure 3-4: Average cumulative body weight change in Experiment 2 of the four groups
(shown in legend) by experimental week (EW) calculated by subtracting the last body weight measurement of baseline conditions from body weight measurements during the two experimental weeks. Body weight was measured twice during each EW and each measurement is denoted as either S=start, beginning of the week or E=end, last day of the week. No significant differences were seen between groups.

28
CHAPTER 4 EXPERIMENT 3–MACRONUTRIENT QUALITY
Introduction and Rationale
We hypothesized in experiment 2 that caloric intake would increase as a function of
access to a sugar gel dessert. This was not seen, possibly due to a ceiling effect resulting
from the low protein to calorie ratio of the sugar gel. Protein to calorie ratio is the
measure of the amount of calories consumed from protein compared to total caloric
intake. This must be maintained at a stable level for survival. When rats are given the
choice to eat from individual sources of different macronutrients, they select a protein to
calorie ratio necessary for survival (Abraham et al. 1961, as in Pol and den Hartog 1966).
Also, when the protein source is restricted, rats will consume separate sources of other
macronutrients only such that approximately 8% of their calories are from protein (Pol
and den Hartog 1966). Consumption of extra calorie sources may dilute the protein to
calorie ratio of total consumption, posing a rate-limiting determinant of consumption of a
dessert and may have been an influence on the results of experiment 2. Thus, the
methods of experiment 2 were repeated with a dessert containing a protein content
similar to that of chow, which has approximately 23% of its total calories in the form of
protein. We hypothesized that the higher protein content of the gel would allow higher
intakes of the dessert than were observed in experiment 2, and so might be more likely to
reveal an increased overall caloric intake. This increased intake might show a greater
consumption with intermittent compared with uninterrupted dessert access.

29
Methods
Animals, Housing, and Feeding Conditions
Experiment 3 began one week following experiment 2. All rats from experiment 2
were used in this study and housed as described in experiment 2. The rats were kept in
the same groups and were fed the same type and amount of maintenance diet as in
experiment 2. Since consumption and body weight did not change within experiment 2,
no reassessment of baseline consumption was performed and all comparisons were made
against the measures of baseline intake from experiment 2.
Dessert Access
In order to increase the protein to calorie ratio of the dessert, a sweetened milk gel
was used instead of the sugar gel. The milk gel was made from 30 g white sugar, 30 g
powdered milk, and 10 g gelatin dissolved in 1000 ml tap water. This composition is
isocaloric to sugar gel (yielding approximately 0.31 kcal/g) but with a protein to calorie
ratio similar to that of standard maintenance diet (approximately 20%). This solution was
then poured into 50 ml glass jars and allowed to set overnight. The milk gel was
presented to the groups of rats as described in experiment 2.
Body Weight Measures
Body weight was measured twice weekly during the experimental phase.
Cumulative body weight gain was calculated by subtracting the last body weight
measured during the baseline period from those taken during the experimental phase.
Data Analysis
Daily milk gel intake, maintenance diet intake, and total caloric intake, as well as
change in body weight for each rat were calculated. These measures were then averaged
between rats within a single group over each week. Between group analysis was assessed
30
using SPSS (SPSS, Chicago, IL) one-way ANOVAs and Tukey posthoc tests with a
significance criterion of p<0.05. One rat from Group 1 was excluded from analysis due
to extremely low milk gel consumption and two rats from Group 2 were excluded due to
excessive spillage of maintenance diet.
Results
Total Caloric Intake
Figure 4-1 shows the average daily caloric intake of the four groups by
experimental week and compared to baseline consumption. No differences in caloric
intake were seen between groups (Week 1: F(3,20)=1.670, p>0.05; Week 2:
F(3,22)=0.160, p>0.05). Caloric intake did not vary as a function of milk gel
presentation or differences in the temporal availability of milk gel with either type of
maintenance diet.
Caloric Intake from Maintenance Diet and Milk Gel
Figure 4-2 shows the caloric intake from maintenance diet and milk gel of the four
groups by experimental week and compared to baseline consumption of maintenance
diet. No differences between groups were seen in caloric intake from maintenance diet
during either experimental week (Week 1: F(3,20)=2.892, p>0.05; Week 2:
F(3,20)=0.898, p>0.05). Differences were seen between groups in caloric intake from
milk gel during both weeks of the experimental phase (Week 1: F(3,20)=13.814, p<0.01,
Week 2: F(3,20)=16.456, p<0.01). Tukey tests showed that Group 1, which was given
uninterrupted access to milk gel in conjunction with standard maintenance diet,
consumed more milk gel than Groups 3 and 4, which had milk gel access in conjunction
with the high fat maintenance diet.

31
Figure 4-3 shows the proportion of calories from maintenance diet and milk gel
averaged over the two experimental weeks and compared to baseline consumption. In all
groups the extra calories consumed from milk gel were accurately compensated through
the slight reduction in the intake of maintenance diet.
Body Weight
Figure 4-4 shows cumulative body weight change from baseline of the four groups
during the experimental weeks. There were no differences in body weight change from
baseline or between groups (range of F's: F(3,20)=0.612-0.070, all p's>0.05).
Discussion
We hypothesized that access to milk gel would increase caloric intake and/or
dessert intake compared to either baseline conditions or to the sugar gel access used in
experiment 2, and that intake would vary as a function of the timing of access to the
dessert. The results do not support the hypotheses because caloric intake in baseline and
experimental phases were statistically equivalent and no differences were observed
between groups. These data demonstrate that the results of experiment 2 generalize to
isocaloric desserts that have higher protein content. These results may be due to the high
protein to calorie ratio in standard maintenance diet and different results may be seen in
protocols exploring protein deficiency. This low caloric density may be a limiting factor
on consumption and diminish the probability of observing net overconsumption. Thus, in
the next experiment, we examine the effect of a high caloric density dessert.

32
Effect of uninterrupted versus intermittent access to milk gelon average total caloric intake
Phase of Study
BLW EW1 EW2
Dai
ly C
alor
ic In
take
0
20
40
60
80
100
Group 1 -- Standard maintenance diet and uninterrupted milk gelGroup 2 -- Standard maintenance diet and intermittent milk gelGroup 3 -- High fat mainteance diet and uninterrupted milk gelGroup 4 -- High fat maintenance diet and intermittent milk gel
Figure 4-1: Average daily caloric intake in Experiment 3 of the four groups (shown in
legend) by experimental week (EW) and compared to baseline conditions (BLW), during which all rats had access to standard maintenance diet only. No differences were seen between groups.

33
Effect of uninterrupted versus intermittent milk gel accesson average caloric intake from maintenance diet and milk gel
Phase of Study
BLW MD EW1 MD EW2 MD EW1 MG EW2 MG
Dai
ly C
alor
ic In
take
0
20
40
60
80
100Group 1 -- Standard maintenance diet and uninterrupted milk gelGroup 2 -- Standard maintenance diet and intermittent milk gelGroup 3 -- High fat maintenance diet and uninterrupted milk gelGroup 4 -- High fat maintenance diet and intermittent milk gel
Figure 4-2: Average daily caloric intake from maintenance diet (MD) and milk gel (MG)
in Experiment 3 of the four groups (shown in legend) by experimental week (EW) and compared to baseline conditions (BLW) in which rats had access to standard MD only. No differences in intake from MD were seen between groups. Group 1 ate more MG than Groups 3 and 4 in both experimental weeks.

34
Effect of uninterrupted versus intermittent milk gel accesson average caloric intake from maintenance diet and milk gel
BLW G1 G2 G3 G4
Dai
ly C
alor
ic In
take
0
20
40
60
80
100Maintenance diet: 3.34 (G1&2) or 5.24 (G3&4) kcal/gMilk Gel: 0.31 kcal/g
Figure 4-3: Proportion of caloric intake in Experiment 3 from maintenance diet and milk
gel averaged over the two experimental weeks and compared to average baseline (BLW) consumption of standard maintenance diet.

35
Effect of uninterrupted versus intermittent milk gel accesson body weight change
Phase of Study
EW1S EW1E EW2S EW2E
Bod
y W
eigh
t Cha
nge
-15
-10
-5
0
5
10
15
Group 1 -- Standard maintenance diet and uninterrupted milk gelGroup 2 -- Standard maintenance diet and intermittent milk gelGroup 3 -- High fat maintenance diet and uninterrupted milk gelGroup 4 -- High fat maintenance diet and intermittent milk gel
Figure 4-4: Average cumulative body weight change in Experiment 3 of the four groups
(shown in legend) by experimental week (EW) calculated by subtracting the last body weight measurement of baseline conditions from body weight measurements during the two experimental weeks. Body weight was measured twice during each EW and each measurement is denoted as either S=start, beginning of the week or E=end, last day of the week. No significant differences were seen between groups.
36
CHAPTER 5 EXPERIMENT 4–CALORIC DENSITY
Introduction and Rationale
In the previous two experiments, we explored the effect of increased temporal
availability of a palatable dessert on total caloric intake. Consumption of neither the
sugar gel nor the milk gel promoted an increase in total caloric intake, but rather the extra
calories were compensated by a slight reduction in intake of maintenance diet. Since the
protein to calorie ratio of the dessert did not seem to influence the outcome, intake may
have been regulated and caloric balance maintained as a function of the low energy
density of the dessert (de Castro 2005). The snacks that humans prefer and report as
palatable are typically high in caloric density, with most of the calories from fat (Berteus
Forslund et al. 2005). Thus, a dessert protocol utilizing a high calorie snack may promote
overconsumption of the snack and allow for the exploration of the parameters of
compensation. We hypothesized that rats given a dessert of high caloric density would
consume more total calories, with proportionally more calories from dessert and less
from maintenance diet than rats given sugar gel or no dessert access and compared to
baseline consumption of maintenance diet.
Methods
Animals and Housing
New animals were used in this study. The animals used were 24 female Sprague
Dawley rats (Harlan, Indianapolis, IN) weighing between 250 and 350 g at the start of the
experiment. The animals were housed in conditions described for the previous

37
experiments. The rats were maintained on a reverse light cycle with lights on from 2100
to 0900 h and off from 0900 to 2100 h, such that all procedures were conducted in the
dark when rats are most active.
Food Conditions and Measures
All rats were provided with ad libitum access to tap water and a wet mash of equal
parts Purina 5001 powdered rat chow and tap water (yielding approximately 1.67 kcal/g).
This was presented in 50 ml glass jars equipped with spill-proof lids and suspended
within the home cage on metal stirrups. Wet mash and lids were used to prevent spillage
and associated measurement error, which may have occurred in the previous experiments.
To establish baseline consumption, daily food intake was measured for one week by
subtracting the remaining wet mash and hopper weight from that originally presented.
Clean jars of fresh wet mash were presented each day at the start of the dark cycle. Three
groups of eight rats were defined such that the average daily caloric intake was equivalent
between groups. All rats continued to have ad libitum access to wet mash and food
intake was measured daily during the three weeks of the experimental phase. Food intake
was also measured for a week following the experimental phase.
Dessert Access
Table 5-1: Differences in the energy density of dessert Group Maintenance Diet Dessert Presented Uninterrupted for 8 h at Night 1 Wet mash none 2 Wet mash Low calorie (sugar gel, 0.31 kcal/g) 3 Wet mash High calorie (sugar fat whip, 7.35 kcal/g)
Group 1 was maintained on baseline conditions and had no access to any dessert
during the experimental phase. Group 2 received uninterrupted 8 h nocturnal access

38
(0900 h to 1700 h) to the sugar gel used in experiment 2, which served as the low calorie
snack, yielding approximately 0.31 kcal/g. Group 3 received the same uninterrupted 8 h
nocturnal access to a “sugar fat whip”, which consisted of two parts of softened vegetable
shortening blended with one part white sugar and served as the high calorie snack,
yielding approximately 7.35 kcal/g. Both desserts were presented in 50 ml glass jars
attached to a metal stirrup and suspended within the home cage. Uninterrupted dessert
access was used since this had promoted the greatest consumption in experiments 2 and
3. Since most rats in Group 2 ate all 50 g of the sugar gel originally presented, a new jar
of gel was put on at 1400 h. Conversely, since the most sugar fat whip consumed by any
rat in Group 3 was 15 g, only 25 g of sugar fat whip was presented daily to prevent
wastage. Intake of dessert was measured daily for the three weeks of the experimental
phase.
Body Weight Measures
Body weight was measured twice weekly during the experimental phase and the
week following the termination of the experimental phase. Cumulative body weight gain
was calculated by subtracting the last body weight measurement taken during the baseline
period from those taken during the experimental phase.
Data Analysis
Daily intakes of dessert, wet mash, and total calories, as well as change in body
weight for each rat were calculated. These were then averaged between rats within a
single group for each week. Between group analysis was assessed using SPSS (SPSS,
Chicago, IL) one-way ANOVAs and Tukey posthoc tests with a significance criterion of
p<0.05.

39
Results
Total Caloric Intake
Figure 5-1 shows the total caloric intake of the three groups by experimental week
and compared to total consumption in the one week of baseline and one week following
the experimental phase, during both of which rats were given only wet mash. Differences
between groups were seen in the first and second experimental weeks and in the week
following the experimental phase (Week 1: F(2,23)=35.149, p<0.01; Week 2:
F(2,23)=5.297, p<0.05; Reestablishment of baseline conditions: F(2,23)=40.858, p<0.01),
but were not seen in the third experimental week (F(2,23)=1.214, p>0.05). Tukey tests
showed that Group 3, which had sugar fat whip access, consumed significantly more total
calories in the first and second experimental weeks compared to Groups 1 and 2, which
had no dessert or sugar gel access, respectively. Groups 1 and 2 ate significantly more
calories during the week following experimental conditions than Group 3.
Caloric Intake from Maintenance Diet and Dessert
Figure 5-2 shows the average caloric intake from wet mash by experimental week
and compared to the wet mash consumption of the one week of baseline and the week
following the experimental weeks. Differences in wet mash consumption between
groups were seen in all the experimental weeks and during the week following the
experimental conditions (Experimental week range of F's: F(2,23)=33.494-196.844, all
p's <0.001; Reestablishment of baseline conditions: F(2,23)=40.858, p<0.01). Tukey
tests showed that Groups 1 and 2 consumed significantly more calories from wet mash
than Group 3 during experimental week 1 and in the week following the experimental
phase. Group 1 consumed more wet mash than Group 2, which consumed more than
Group 3 in experimental weeks 2 and 3.

40
Figure 5-2 also shows the average caloric intake from dessert by experimental
week. Differences in caloric intake from dessert were seen in all three experimental
weeks between all three groups (range of F's: F(2,23)=251.752-435.739, all p's <0.01).
Group 3 ate significantly more calories from dessert than Group 2, which in turn
consumed more calories than zero (Group 1). Figures 5-3, 5-4, and 5-5 show the
proportions of caloric intake from wet mash and dessert for each of the three
experimental weeks compared to the wet mash intake during the one week of baseline.
Body Weight
Figure 5-6 shows the average cumulative change in body weight of the groups from
the last day of baseline by experimental week and the week following termination of the
experimental phase. All points between groups were significantly different during the all
three of the experimental weeks (range of F's: F(2,23)=39.309-82.811, all p's<0.01) and
the following week (F(2,23)=6.979, p<0.01). Group 3 increased in body weight from
baseline and gained more weight than and Groups 1 and 2, which did not deviate from
baseline.
Discussion
Based on human studies that suggest energy density to be a key factor in increased
caloric intake, we hypothesized that providing rats with a high calorie dessert would
promote greater total caloric intake compared to rats given no dessert or access to the low
calorie sugar gel used in experiment 2. The data support our hypothesis by showing that
total caloric intake was greater in the group given high caloric density dessert compared
to the low caloric density or the no dessert control group.
Although total caloric consumption increased with access to the dessert of high
caloric density, some compensatory behavior was seen. Rats given access to sugar fat

41
whip ate fewer calories from wet mash than rats given sugar gel or no dessert. However,
this reduction in wet mash intake did not offset the calories consumed from the sugar fat
whip and so net caloric intake was substantially increased. This is similar to eating
patterns seen in humans in which the consumption of high calorie snacks does not
promote smaller meals (Berteus Forslund et al. 2005).
The caloric intake of rats given dessert of high caloric density declined over the
experimental weeks, and in the following week of no dessert access, intake of wet mash
was comparatively low. This is similar to the hypophagia and weight loss reported in rats
following experimental overfeeding (Keesey 1989). A similar phenomenon may occur in
humans, who show some compensation for snacks when measured over a two day span
(de Castro 2005). This suggests that although short-term controls of body weight may be
overwhelmed in conditions promoting overconsumption, long-term controls may
facilitate a settling point of intake and body weight when the environment changes.
This preliminary study does not separate and address the differences in the
palatability and macronutrient composition of the desserts, which may be partly
responsible for the overconsumption and weight gain. These issues are difficult to
separate in part because the maximum caloric density of a high carbohydrate snack is
often only one-half that of a high fat snack. It would be interesting to develop diets for
rats in which all the dietary components are equated and compared, as done by Rolls et
al. (2005) in humans; however, this endeavor is beyond the scope of this thesis.
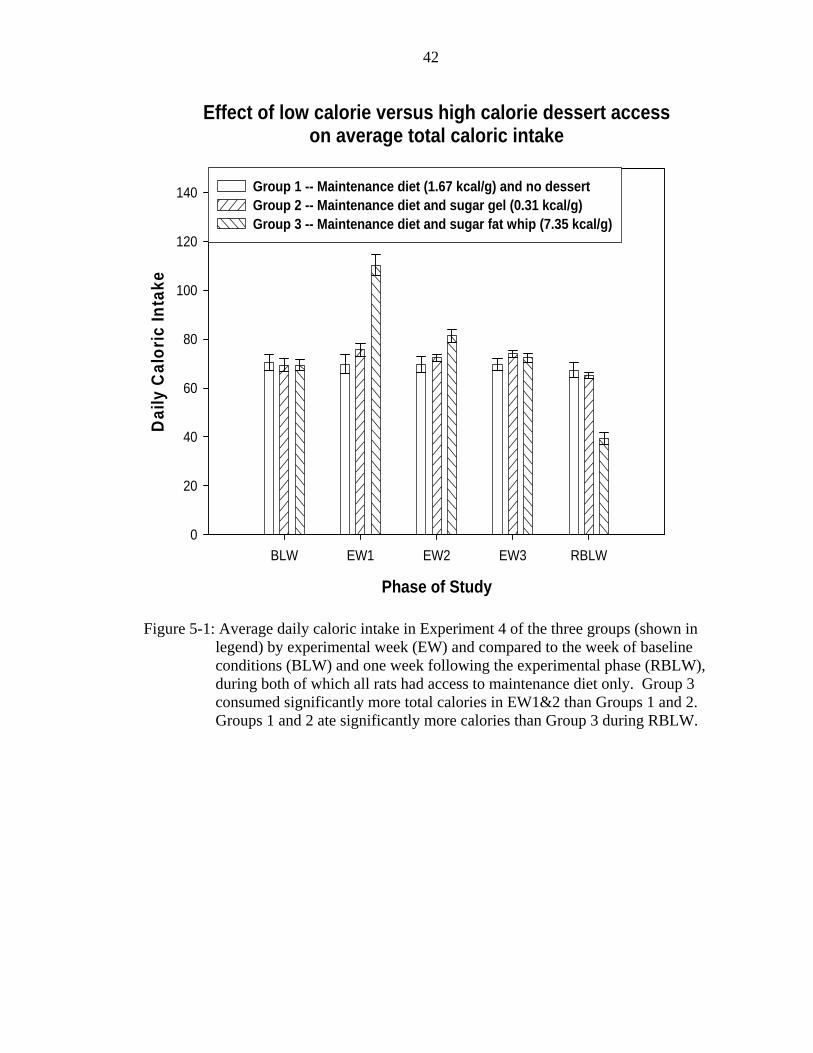
42
Effect of low calorie versus high calorie dessert accesson average total caloric intake
Phase of Study
BLW EW1 EW2 EW3 RBLW
Dai
ly C
alor
ic In
take
0
20
40
60
80
100
120
140 Group 1 -- Maintenance diet (1.67 kcal/g) and no dessertGroup 2 -- Maintenance diet and sugar gel (0.31 kcal/g)Group 3 -- Maintenance diet and sugar fat whip (7.35 kcal/g)
Figure 5-1: Average daily caloric intake in Experiment 4 of the three groups (shown in
legend) by experimental week (EW) and compared to the week of baseline conditions (BLW) and one week following the experimental phase (RBLW), during both of which all rats had access to maintenance diet only. Group 3 consumed significantly more total calories in EW1&2 than Groups 1 and 2. Groups 1 and 2 ate significantly more calories than Group 3 during RBLW.

43
Effect of low calorie versus high calorie dessert accesson average caloric intake from maintenance diet and dessert
Phase of Study
BLW
MD
EW
1 M
D
EW
2 M
D
EW
3 M
D
RB
LW M
D
EW
1 D
EW
2 D
EW
3 D
Dai
ly C
alor
ic In
take
0
20
40
60
80
100
120
140 Group 1 -- Maintenance diet (1.67 kcal/g) and no dessertGroup 2 -- Maintenance diet and sugar gel (0.31 kcal/g)Group 3 -- Maintenance diet and sugar fat whip (7.35 kcal/g)
Figure 5-2: Average caloric intake from maintenance diet (MD) and dessert (D) in
Experiment 4 of the three groups (shown in legend) by experimental week (EW) and compared to the week of baseline (BLW) and a week following the experimental phase (RBLW), during both of which all rats had access to MD only. Groups 1 and 2 consumed significantly more calories from MD than Group 3 during EW1 and RBLW and Group 1 consumed more MD than Group 2, which consumed more than Group 3 in EW2&3. Group 3 ate significantly more D than Group 2, which consumed more calories than Group 1 during all EW.

44
Effect of low calorie versus high calorie dessert access on distribution of caloric intake from maintenance diet and dessert --
week 1
BLW G1 G2 G3
Cal
orie
s (k
cal)
0
20
40
60
80
100
120
140 Maintenance diet: 1.67 kcal/gDessert: 0.31 (G2) or 7.35 (G3) kcal/g
Figure 5-3: Proportion of caloric intake in week one of Experiment 4 from dessert and
maintenance diet compared to baseline (BLW) measures.

45
Effect of low calorie versus high calorie dessert accesson distribution of caloric intake from maintenance diet and dessert --
week 2
BLW G1 G2 G3
Dai
ly C
alor
ic In
take
0
20
40
60
80
100
120
140 Maintenance diet: 1.67 kcal/gDessert: 0.31 (G2) or 7.35 (G3) kcal/g
Figure 5-4: Proportion of caloric intake in week two of Experiment 4 from dessert and
maintenance diet compared to baseline (BLW) measures.
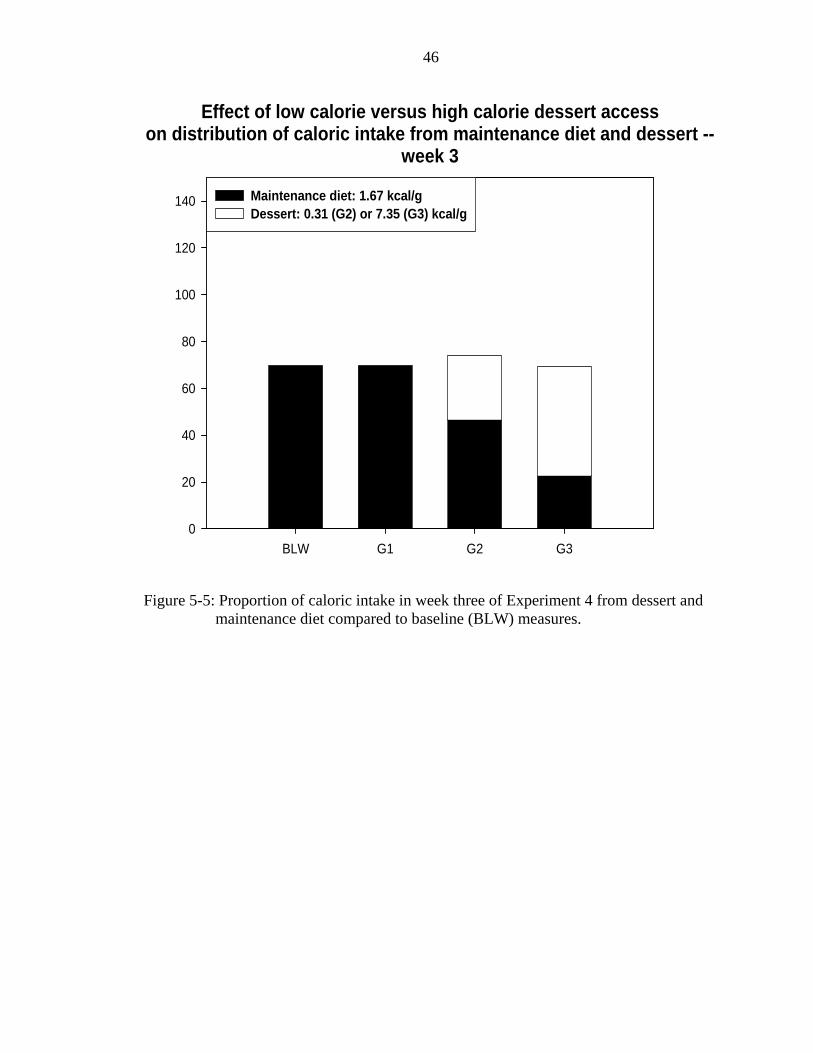
46
Effect of low calorie versus high calorie dessert accesson distribution of caloric intake from maintenance diet and dessert --
week 3
BLW G1 G2 G30
20
40
60
80
100
120
140 Maintenance diet: 1.67 kcal/g Dessert: 0.31 (G2) or 7.35 (G3) kcal/g
Figure 5-5: Proportion of caloric intake in week three of Experiment 4 from dessert and
maintenance diet compared to baseline (BLW) measures.

47
Effect of low calorie versus high calorie dessert accesson body weight change
EW1 EW2 EW3 RBLW
Bod
y W
eigh
t Cha
nge
-60
-40
-20
0
20
40
60
Group1 -- Maintenance diet (1.67 kcal/g) and no dessertGroup 2 -- Maintenance diet and sugar gel (0.31 kcal/g)Group 3 -- Maintenance diet and sugar fat whip (7.35 kcal/g)
Figure 5-6: Average cumulative body weight change in Experiment 4 of the three groups
(shown in legend) by experimental week (EW) and the week following the experimental phase (RBLW), during which all rats had access to maintenance diet only. Cumulative change is calculated by subtracting the last body weight measurement of baseline conditions from body weight measurements during the three EW. Group 3 increased in body weight more than Group 1 or 2, which did not deviate from baseline.

48
CHAPTER 6 EXPERIMENT 5–PREVIOUS DESSERT EXPERIENCE AND CHOICE
Introduction and Rationale
The behavioral strategy of selecting food based on previous experience with the
positive and negative consequence of consuming it has been shown in a multitude of
species (Darmaillacq et al. 2004, Leathwood and Ashley 1983). Organisms must have
the ability to alter consummatory behavior in response to alterations in the environment
in order to maximize feeding efficiency. Previous exposure to different desserts may
affect selection and promote overconsumption when presented with access to different
types of dessert. We hypothesized that rats previously exposed to any type of dessert
would consume more of both types of dessert than those rats never having had dessert
experience.
Methods
Animals, Housing, and Feeding Conditions
All 24 rats from experiment 4 were used in this study and maintained in the same
housing conditions and groups. All rats had ad libitum access to tap water and wet mash
as in experiment 4. Experiment 5 began immediately after the week of reestablishment
of baseline conditions following the termination of the experimental phase of experiment
4 and so these consumption measures were used as the standard intakes for comparison.
Daily food intake was measured for the two weeks of the experimental phase and for two
weeks following the termination of the experimental phase, during which all rats were
given wet mash only.

49
Dessert Access
Table 6-1: Differences in previous desert experience Group Previous Dessert
Experience Desserts Available Uninterrupted for 8 h at Night
Maintenance Diet
1 none Sugar gel and sugar fat whip Wet mash 2 Sugar gel Sugar gel and sugar fat whip Wet mash 3 Sugar fat whip Sugar gel and sugar fat whip Wet mash
All rats were given daily uninterrupted 8 h nocturnal access to both the sugar gel
and sugar fat whip used in experiment 4. Both desserts were presented together in the
same manner described in experiment 4. Intake of each dessert was measured daily for
the two weeks of the experimental phase.
Body Weight Measures
Body weight was measured twice weekly during the experimental phase and during
the week following termination of the experimental phase. Cumulative body weight gain
was calculated by subtracting the last body weight measurement taken during the baseline
period from those taken during the experimental phase and the following week.
Data Analysis
Daily intake of each of the desserts, maintenance diet, and the total calories, as well
as change in body weight for each rat were calculated. This was then averaged between
rats within a single group for each week. Between group analysis was assessed using
SPSS (SPSS, Chicago, IL) one-way ANOVAs and Tukey posthoc tests with a
significance criterion of p<0.05. One rat from Group 4 died and so was excluded from
analysis.

50
Results
Total Caloric Intake
Figure 6-1 shows the average daily total caloric intake of the three groups by
experimental week and compared to baseline and the averaged two weeks of measures
following termination of the experimental phase, during both of which all rats had access
to wet mash only. Differences were seen between the groups in the week of baseline
(F(2,22)=40.858, p<0.01), the first experimental week (F(2,22)=7.944, p<0.01), and
second experimental week (F(2,22)=4.356, p<0.05). Tukey tests showed that in baseline
and experimental week 1, Group 1 and 2, which had no dessert experience or experience
with sugar gel, respectively, consumed significantly more calories than Group 3, which
had experience with sugar fat whip. Group 2 consumed more calories than Group 3 in
experimental week 2.
Calories from Maintenance Diet and Desserts
Figure 6-2 shows the average daily maintenance diet intake of the three groups by
week and compared to baseline and the average of two weeks following the experimental
weeks. Differences were seen between the groups in baseline only (F(2,22)=40.858,
p<0.01), with Groups 1 and 2 consuming significantly more wet mash than Group 3.
Figure 6-3 shows the average daily intake of sugar gel and sugar fat whip of the
three groups by experimental week. Differences in sugar fat whip consumption were
seen between groups in the second experimental week (F(2,22)=4.074, p<0.05), with
Group 2 consuming significantly more than Group 3 (this was also the trend in week 1,
but p=0.064). Differences in sugar gel consumption were seen between the groups in
both experimental weeks (Week 1: F(2,22)=18.033, p<0.01; Week 2: F(2,22)=5.458,
p=0.013). In the first experimental week, Groups 2 and 3 consumed more calories from

51
sugar gel than Group 1. In the second experimental week, Group 2 consumed more sugar
gel than Group 1. Figures 6-4 and 6-5 show the proportion of caloric intake from wet
mash and each type of dessert during each of the experimental weeks and compared to
the consumption of wet mash in the week of baseline and the week following the
experimental phase.
Body Weight
Figure 6-6 shows the group average cumulative change in body weight from the
last day of baseline by experimental week and for the two weeks following the
termination of the experimental phase. All points between groups were significantly
different (range of F's: F(2,22)=8.224-22.187, all p's <0.01). During the first
experimental week, Group 2 gained more weight than Group 3. In the second
experimental week and the following week, both Groups 1 and 2 gained more weight
than Group 3.
Discussion
Based on animal data that suggest food intake is affected by previous experience
with it, we hypothesized that rats that had previously had access to either sugar gel or
sugar fat whip would consume larger quantities of each dessert than those rats which had
never experienced either dessert. The raw data did not support this hypothesis since rats
previously given no dessert or sugar gel (Groups 1 and 2) tended to eat more total
calories than those previously given sugar fat whip (Group 3). All three groups ate
similar amounts of wet mash during the experimental weeks. Group 2 and 3 tended to
consume more sugar gel than Group 1, but Group 2 tended to consume more sugar fat
whip than Group 3. Groups 1 and 2 gained more weight than Group 3 during the
experimental weeks, which corresponds with the data observed for total caloric intake.

52
Interpretation of these data is difficult since differences in intake were seen in the
baseline conditions, making comparisons of the absolute data inadequate. When total
calories are converted to percentages from baseline, Groups 2 and 3 consumed more
calories from baseline (145% and 195%, respectively) than Group 1 (133%), supporting
the hypothesis. During the experimental phase, Group 1 consumed approximately 67%
of their calories from dessert, whereas Groups 2 and 3 consumed approximately 74% of
their calories from dessert. This difference, while not significant, suggests that previous
dessert experience may have a small effect on consumption. Also, during the two weeks
following the experimental period, Group 1 and 2 consumed less chow than baseline
(80%), similar to the compensatory behavior of Group 3 in experiment 4 (57%). During
this time, Group 3 continued to consume 125% compared to baseline intake. This may
suggest dysregulation of the long-term controls of feeding when repeatedly presented
with desserts. Results may have been different if more time had been allowed between
this experiment and the preceding one; however, extra time also could have interfered
with the memory of the postingestive effects of the desserts.

53
Effect of previous dessert experienceon choice and consumption of maintenance diet and multiple desserts --
average total caloric intake
Phase of Study
BLW EW1 EW2 RBLW
Dai
ly C
alor
ic In
take
0
20
40
60
80
100
120
140 Group 1 -- no previous dessert experienceGroup 2 -- previous experience with sugar gelGroup 3 -- previous experience with sugar fat whip
Figure 6-1: Average daily caloric intake in Experiment 5 of the three groups (shown in
legend) by experimental week (EW) and compared to a week of baseline conditions (BLW) and the two weeks (averaged together) following the termination of the experimental phase (RBLW), during both of which all rats had access to maintenance diet only. Group 1 and 2 consumed more calories than Group 3 in BLW and EW1, and Group 2 consumed more calories than Group 3 in EW2.

54
Effect of previous dessert experienceon choice and consumption of maintenance diet and multiple desserts --
average caloric intake from maintenance diet
Phase of Study
BLW EW1 EW2 RBLW
Dai
ly C
alor
ic In
take
0
20
40
60
80
100
120
140 Group 1 -- no previous dessert experienceGroup 2 -- previous experience with sugar gelGroup 3 -- previous experience with sugar fat whip
Figure 6-2: Average caloric intake of maintenance diet in Experiment 5 of the three
groups (shown in legend) by experimental week (EW) and compared to a week of baseline (BLW) and two weeks (averaged together) following the termination of the experimental phase (RBLW), during both of which all rats had access to maintenance diet only. Groups 1 and 2 consumed more maintenance diet than Group 3 in BLW.

55
Effect of previous dessert experienceon choice and consumption of maintenance diet and multiple desserts --
caloric intake of desserts
Phase of Study
EW1 SFW EW2 SFW EW1 SG EW2 SG
Dai
ly C
alor
ic In
take
0
20
40
60
80
100
120
140 Group 1 -- no previous dessert experienceGroup 2 -- previous experience with sugar gel Group 3 -- previous sugar experience with fat whip
Figure 6-3: Average caloric intake of sugar fat whip (SFW) and sugar gel (SG) in
Experiment 5 by the three groups (shown in legend) by experimental week (EW). In EW2, Group 2 consumed more SFW than Group 3. In EW1, Groups 2 and 3 consumed more SG than Group 1. In EW2, Group 2 consumed more SG than Group 1.

56
Effect of previous dessert experienceon choice and consumption of maintenance diet and multiple desserts --
distribution of caloric intake from dessert and maintenance diet -- week 1
Phase of Study
G1 G2 G3
Dai
ly C
alor
ic In
take
0
20
40
60
80
100
120
140 Maintenance diet: 1.67 kcal/gSugar fat whip: 7.35 kcal/gSugar gel: 0.31 kcal/g
Figure 6-4: Proportion of caloric intake in week one of Experiment 5 from maintenance
diet, sugar fat whip, and sugar gel of the three groups (G, see legend for Figure 6-3).

57
Effect of previous dessert experienceon choice and consumption of maintenance diet and multiple desserts --
distribution of caloric intake from maintenance diet and dessert --week 2
Phase of Study
G1 G2 G3
Dai
ly C
alor
ic In
take
0
20
40
60
80
100
120
140 Maintenance diet: 1.67 kcal/gSugar fat whip: 7.35 kcal/gSugar gel: 0.31 kcal/g
Figure 6-5: Proportion of caloric intake in week two of Experiment 5 from maintenance
diet, sugar fat whip, and sugar gel of the three groups (G, see legend for Figure 6-3).
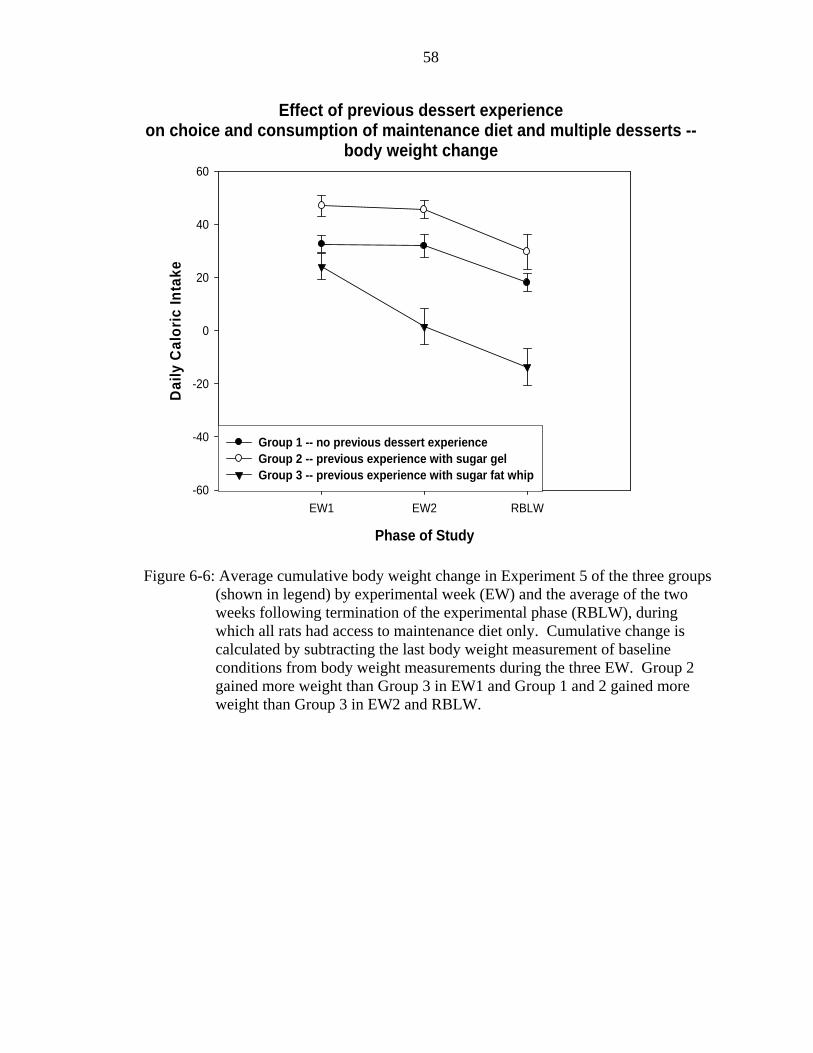
58
Effect of previous dessert experienceon choice and consumption of maintenance diet and multiple desserts --
body weight change
Phase of Study
EW1 EW2 RBLW
Dai
ly C
alor
ic In
take
-60
-40
-20
0
20
40
60
Group 1 -- no previous dessert experienceGroup 2 -- previous experience with sugar gel Group 3 -- previous experience with sugar fat whip
Figure 6-6: Average cumulative body weight change in Experiment 5 of the three groups
(shown in legend) by experimental week (EW) and the average of the two weeks following termination of the experimental phase (RBLW), during which all rats had access to maintenance diet only. Cumulative change is calculated by subtracting the last body weight measurement of baseline conditions from body weight measurements during the three EW. Group 2 gained more weight than Group 3 in EW1 and Group 1 and 2 gained more weight than Group 3 in EW2 and RBLW.

59
CHAPTER 7 EXPERIMENT 6–CIRCADIAN RHYTHMS
Introduction and Rationale
Another aspect of availability concerns the circadian rhythms of appetitive
processes. Night Eating Syndrome (NES) is a human clinical phenomenon that illustrates
the effect of food eaten outside of normal consummatory rhythms (Stunkard et al. 2005).
Individuals with NES show non-normative eating patterns and gain a considerable
amount of weight by consuming large amounts of snack foods at night and early morning
(Tanofsky-Kraff and Yanovski 2004). This suggests that a snack consumed during the
normal period of food consumption may be more readily compensated than a snack eaten
outside the normal period of food consumption. This phenomenon may generalize to rat
behavior and represent some aspects of this clinical disorder through use of a protocol in
which a palatable dessert is presented at the start of the light cycle. We hypothesized that
rats given diurnal access to dessert (during the light cycle when rats are not very active;
analogous to human nighttime) would consume more dessert and overall calories as well
as gain more weight than rats given nocturnal dessert access (during the dark cycle when
rats are active and feeding; analogous to human daytime).
Methods
Animals and Housing
The animals used were 11 female Sprague Dawley rats (Harlan, Indianapolis, IN)
weighing between 250 and 325 g at the start of the experiment. All rats were caged as
previously described. One group of five rats was housed in a vivarium with lights on

60
from 0800 h to 2000 h and the other group of six rats was housed in a vivarium with
lights on from 2100 h to 0900 h. Both vivaria were maintained at 22 + 2 °C.
Food Conditions and Measures
All rats were provided with ad libitum access to tap water and wet mash as
previously described in experiment 4. Fresh wet mash in clean jars was presented daily
at the start of the dark cycle. Food intake was calculated at 0, 12, and 24 h by subtracting
the weight of the remaining wet mash from that originally presented. Baseline food
intake was measured for one week prior to study and the rats were divided into two
groups (Group 1: n=5 and Group 2: n=6) such that average daily caloric intake was
equivalent between the two groups. Daily food intake was measured for two weeks
during the experimental phase and for two weeks following termination of the
experimental phase, during which rats had access to wet mash only.
Dessert Access
Table 7-1: Differences in the time of daily access to dessert Group Maintenance Diet Dessert Available Uninterrupted for 4 h 1 Wet mash Diurnally at lights on 2 Wet mash Nocturnally at lights off
During the experimental phase, all rats were provided daily with 4 h access to 15 g
of sugar fat whip, which was presented as in experiment 4. The start of dessert access
depended on the light cycle of the vivarium that each group of rats was in. Rats in Group
1 had diurnal dessert access beginning at 0800 h at the onset of lights on and rats in
Group 2 had nocturnal dessert access beginning at 0900 h at the onset of lights off.
Dessert was removed 4 h later (1200 h for Group 1 and 1300 h for Group 2) and intake
calculated by subtracting the weight of the remaining dessert from that originally
presented. Daily intake was measured for two weeks.

61
Body Weight Measures
Body weight was measured three times weekly during the experimental phase and
the two weeks following termination of the experimental phase. Cumulative body weight
gain was calculated by subtracting the last body weight measurement taken during the
baseline phase from those taken during the experimental phase and the week following.
Data Analysis
Daily intake of sugar fat whip, wet mash, and the total calories, as well as change in
body weight for each rat were calculated. This was then averaged between rats within a
single group for each week. Between group and condition analysis was assessed using
SPSS (SPSS, Chicago, IL) one-way ANOVAs with a significance criterion of p<0.05.
Results
Total Caloric Intake
Figure 7-1 shows the average daily total caloric intake of the two groups by
experimental week and compared to the consumption of wet mash in baseline and the
average of the two weeks following the termination of the experimental phase.
Consumption was significantly different between baseline, experimental, and the
reestablishment of baseline conditions (F(3,40)=68.284, P<0.01), with rats consuming
approximately 27% more calories in the first experimental week and approximately 15%
more in the second compared to baseline consumption. Although access to dessert
increased caloric intake, whether access to dessert was nocturnal or diurnal had no robust
effect on total caloric intake (Week 1: F(1,10)=1.589, p>0.05; Week 2: F(1,10)=2.089,
p>0.05).

62
Caloric Intake from Wet Mash and Dessert
Figure 7-2 shows calories from wet mash consumed by the two groups by
experimental week and compared to the consumption of wet mash in the week of baseline
and the average of the two weeks following termination of the experimental phase. In
both groups, calories from wet mash fell to approximately 48% of baseline consumption
in the first experimental week and approximately 54% in the second. This compensatory
reduction in wet mash intake was insufficient to offset the large intakes from sugar fat
whip and so intakes were elevated relative to consumption of wet mash during the week
of baseline (F(3,40)=91.000, p<0.01). There were no significant differences between the
diurnal and nocturnal access groups in the number of calories consumed from wet mash
(Week 1: F(1,10)=0.668, Week 2: F(1,10)=0.050, p>0.05).
Figure 7-3 shows calories consumed from dessert by the groups by experimental
week. On average, rats consumed calories from dessert in amounts equivalent to
approximately 79% of total daily calories consumed in baseline. The amount of dessert
eaten during the two weeks was different (F(2,30)=116.847, p<0.01), but no differences
were seen between the diurnal and nocturnal access groups (Week 1: F(1,10)=0.412,
Week 2: F(1,10)=1.115, p>0.05), with more eaten in the first experimental week.
Figure 7-4 shows the proportion of calories consumed from wet mash and dessert
averaged over the experimental weeks and compared to consumption of wet mash in the
week of baseline and the average of the two weeks following termination of the
experimental phase.
Body Weight
Figure 7-5 shows cumulative change in body weight from the last day of baseline
of the groups by experimental week and the two weeks following termination of the

63
experimental phase. By the end of the first experimental week, rats in both groups had
gained an average of 26.2 g, and an average of 29.7 g by the end of the second
experimental week. This is significantly different from baseline, but body weight
changes were not robustly different between groups (only the first assessment of body
weight change showed difference, F(1,10)=11.025, p<0.01; end of week 2:
F(1,10)=4.940, p>0.05), and thus no reliable effect on body weight gain as a function of
nocturnal and diurnal dessert access was observed.
Nocturnal and Diurnal Caloric Intake
Figures 7-6 and 7-7 show the average caloric intake of the two groups during the
dark and light cycle, respectively, by experimental week and compared to the wet mash
consumption in the week of baseline and the average of the two weeks following
termination of the experimental phase. In baseline conditions, all rats consumed
approximately 89% of their daily calories during the dark cycle; however, when provided
with a dessert, feeding patterns shifted significantly (nocturnal intake: F(3,40)=2.495,
p=0.074; diurnal intake: F(3,40)=4.037, p=0.013). Rats given diurnal dessert access
(Group 1) consumed only an average of 35% of total calories nocturnally. Group 1
consumed their remaining calories during the light cycle and nearly all of these diurnal
calories were from dessert. This was significantly different from the nocturnal intake of
those rats given nocturnal dessert access (Group 2), which consumed approximately 96%
of their calories nocturnally (Week 1: F(1,10)=139.458, Week 2: F(1,10)=146.557,
p<0.01).
Discussion
Based on clinical reports of NES, in which calories in addition to meals are
consumed in large amounts late at night or very early in the morning, resulting in

64
tremendous body weight gain in humans (Stunkard et al. 2005), we hypothesized that rats
with diurnal access to a dessert, shown previously to result in weight gain in rats, would
consume more calories and/or gain more weight compared to rats given nocturnal dessert
access. This hypothesis was not supported by the data. Although access to sugar fat
whip resulted in an increase in caloric intake compared to baseline, rats given either
nocturnal or diurnal access to this dessert consumed similar amounts and gained similar
amounts of weight. This suggests that, in rats, circadian periodicity of caloric intake does
not affect body weight as it has been suggested to affect the body weight of humans with
NES.
There are, of course, many differences between this rat model of NES and human
behavior. Although NES is not currently classified as an eating disorder by the DSM-IV-
TR, it is similar to Binge Eating Disorder, which is associated with anxiety caused by the
recurring dysfunctional eating behaviors (Tanofsky-Kraff and Yanovski 2004). The
distress associated with nighttime eating may facilitate the perpetuation of this behavior
and be a large component of the weight gain seen in these individuals. This was not
assessed in the rats and presumably is not a factor affecting rats' consumption. Also, the
rats had ad libitum access to maintenance diet whereas individuals with NES tend to
engage in non-normative meal taking as well as night eating. Arranging rat meals and
snack access in bouts analogous to human patterns and adding a type of chronic
processive stressor may produce different results that would more closely model NES.

65
Effect of noctural versus diurnal access to a high fat desserton average daily total caloric intake
Phase of Study
BLW EW1 EW2 RBLW
Dai
ly C
alor
ic In
take
0
20
40
60
80
100
120Group 1 -- Diurnal access to sugar fat whip (7.35 kcal/g)Group 2 -- Nocturnal access to sugar fat whip
Figure 7-1: Average daily caloric intake in Experiment 6 of the two groups (shown in
legend) by experimental week (EW) and compared to a week of baseline (BLW) and the two weeks (averaged together) following the termination of the experimental phase (RBLW), during both of which all rats had access to maintenance diet only. There were no differences seen between groups.

66
Effect of nocturnal versus diurnal dessert presentationon average caloric intake from maintenance diet
Phase of Study
BLW EW1 EW2 RBLW
Dai
ly C
alor
ic In
take
0
20
40
60
80
100
120 Group 1 -- Diurnal access to sugar fat whip (7.35 kcal/g)Group 2 -- Nocturnal access to sugar fat whip
Figure 7-2: Average caloric intake from maintenance diet in Experiment 6 of the two
groups (shown in legend) by experimental week (EW) and compared to a week of baseline (BLW) and the two weeks (averaged together) following the termination of the experimental phase (RBLW), during both of which all rats had access to maintenance diet only. There were no differences seen between groups.

67
Effect of noctural versus diurnal access to desserton average caloric intake from dessert
Phase of Study
EW1 EW2
Dai
ly C
alor
ic In
take
0
20
40
60
80
100
120 Group 1 -- Diurnal access to sugar fat whip (7.35 kcal/g)Group 2 -- Noctural access to sugar fat whip
Figure 7-3: Average caloric intake from sugar fat whip in Experiment 6 of the two groups
(shown in legend) by experimental week (EW). There were no differences seen between groups.
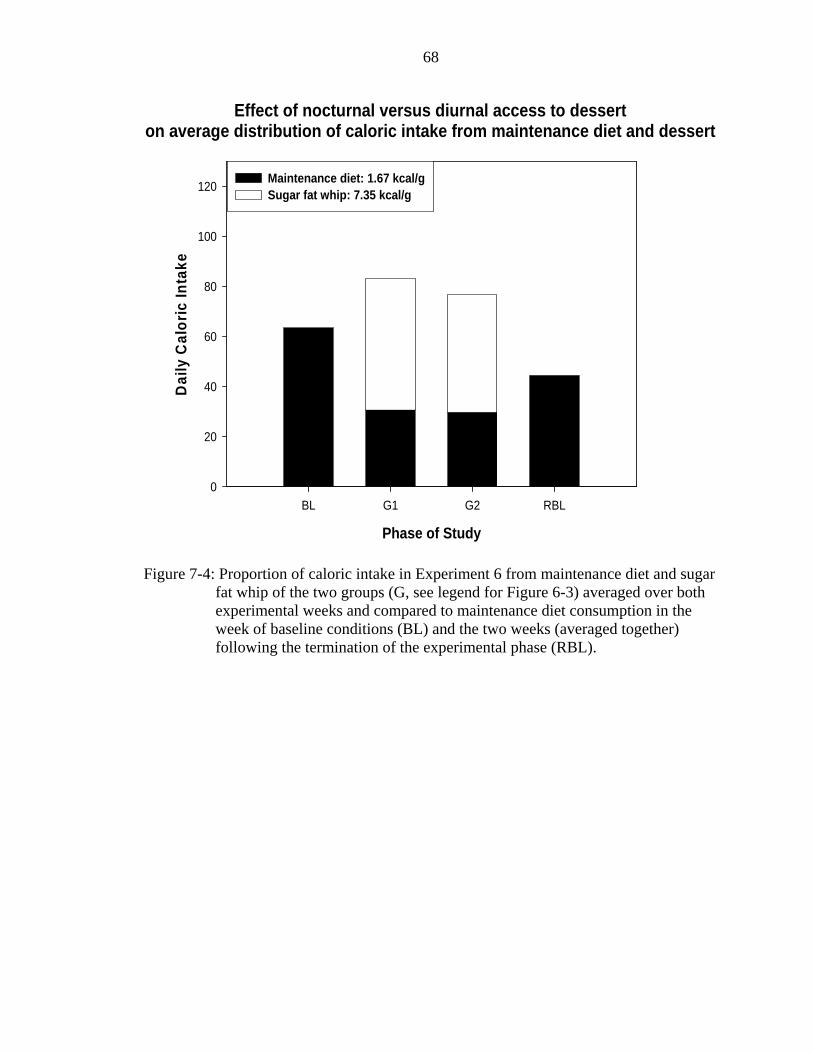
68
Effect of nocturnal versus diurnal access to desserton average distribution of caloric intake from maintenance diet and dessert
Phase of Study
BL G1 G2 RBL
Dai
ly C
alor
ic In
take
0
20
40
60
80
100
120 Maintenance diet: 1.67 kcal/gSugar fat whip: 7.35 kcal/g
Figure 7-4: Proportion of caloric intake in Experiment 6 from maintenance diet and sugar
fat whip of the two groups (G, see legend for Figure 6-3) averaged over both experimental weeks and compared to maintenance diet consumption in the week of baseline conditions (BL) and the two weeks (averaged together) following the termination of the experimental phase (RBL).

69
Effect of noctural versus diurnal dessert presentationon cumulative body weight change
Phase of Study
EW
1S
EW
1M
EW
1E
EW
2S
EW
2M
EW
2E
RB
LW1S
RB
LW1E
RB
LW2S
RB
LW2E
Bod
y W
eigh
t Cha
nge
-40
-20
0
20
40
Group 1 -- Diurnal access to sugar fat whip (7.35 kcal/g)Group 2 -- Nocturnal access to sugar fat whip
Figure 7-5: Average cumulative body weight change in Experiment 6 of the two groups
(shown in legend) by experimental week (EW) and the two weeks following termination of the experimental phase (RBLW). Cumulative body weight change is calculated by subtracting the last body weight measurement of baseline conditions from body weight measurements during the three EW. Body weight was measured three times during each EW and RBLW and each measurement is denoted as either S=start (at beginning of the week), M=middle (in the middle of the week), or E=end (last day of the week). No significant differences were seen between groups in the EW, but there were differences in RBLW between groups.

70
Effect of noctural versus diurnal access to desserton average nocturnal total caloric intake
Phase of StudyBL EW1 EW2 RBL
Dai
ly C
alor
ic In
take
0
20
40
60
80
100
120 Group 1 -- Diurnal access to sugar fat whip (7.35 kcal/g)Group 2 -- Nocturnal access to sugar fat whip
Figure 7-6: Average nocturnal caloric intake in Experiment 6 of the two groups (shown in
legend) by experimental week (EW) and compared to a week of baseline (BLW) and the two weeks (averaged together) following the termination of the experimental phase (RBLW), during both of which all rats had access to maintenance diet only. Group 2 consumed more calories in the dark cycle than Group 1.
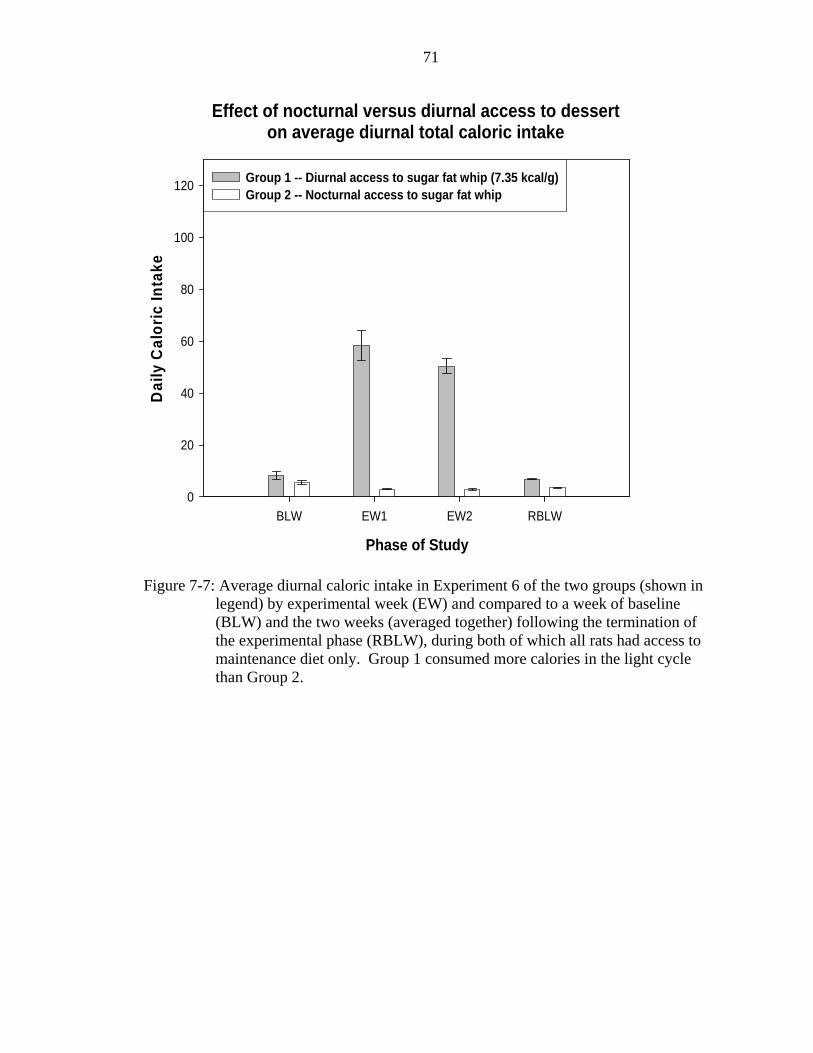
71
Effect of nocturnal versus diurnal access to desserton average diurnal total caloric intake
Phase of Study
BLW EW1 EW2 RBLW
Dai
ly C
alor
ic In
take
0
20
40
60
80
100
120 Group 1 -- Diurnal access to sugar fat whip (7.35 kcal/g)Group 2 -- Nocturnal access to sugar fat whip
Figure 7-7: Average diurnal caloric intake in Experiment 6 of the two groups (shown in
legend) by experimental week (EW) and compared to a week of baseline (BLW) and the two weeks (averaged together) following the termination of the experimental phase (RBLW), during both of which all rats had access to maintenance diet only. Group 1 consumed more calories in the light cycle than Group 2.
72
CHAPTER 8 DISCUSSION
The global aim of this thesis was to discuss which factors in the environment
promote eating in excess of physiological need and how this is compensated within a
homeostatic system. The literature pertaining to homeostatic models of body weight and
its limits and studies demonstrating the effect of food quality on intake were reviewed.
The effect of availability has not yet been thoroughly explored although increased access
to palatable food has been touted as the culprit of the obesity epidemic. This series of six
experiments attempted to address the effects of increased spatial, temporal, and
qualitative availability on the compensatory nature of caloric intake and body weight gain
in female rats.
Experiment 1–Spatial Availability
In our first experiment, we attempted to extend Tordoff's (2002) findings that the
amount and location of sucrose access compared to water access affects preference and
intake to the situation of increased spatial availability of maintenance diet. We observed
no effect on caloric intake or body weight as a function of increasing the amount of jars
of maintenance diet provided to rats, and this was independent of the quality of the
maintenance diet provided. This does not refute Tordoff's findings, but suggests that the
effect he demonstrated either doesn't generalize to maintenance diet or that this protocol
(and the problems encountered in it) is not capable of showing an effect of the increased
spatial availability of maintenance diet.
73
This failure to support the hypothesis is in conflict with a review by Wansink
(2004), which argues that highly visible food promotes hunger and that portion sizes and
amount of food available set the norms of how much to eat. This could be the result of
verbal behavior in humans, in which ratings of hunger is set contingent on the amount of
food presented rather than from internal cues. This obviously can not be assessed in a rat
model. Wansink also suggests that the salience of a constantly available consumable may
decrease with time and that differences in temporal, rather than spatial, availability may
have a more robust effect on food intake and body weight.
Rolls et al. (2005) argued that external cues of availability such as portion size do
influence intake, but that this is only important in the context of energy density. If foods
with a high energy density are consumed in excess due to increased availability, body
weight will increase. Snacking on palatable foods has been demonstrated to be the best
predictor of obesity (Berteus Forslund et al. 2005) and thus, protocols representing the
increased availability of extra calorie sources may more completely demonstrate the
effect of availability on caloric intake body weight gain in rats. These issues were
addressed in the subsequent experiments.
Experiment 2–Temporal Availability
Through the use of a dessert protocol in which a sugar gel was presented for either
an uninterrupted period or intermittently over that period, we explored the effect of the
facets of temporal availability of a palatable calorie source in addition to maintenance
diet on caloric intake and body weight gain in rats. We observed that the intake of a
sugar gel was greater when available for an uninterrupted 8 h period in conjunction with
a standard maintenance diet than when sugar gel was available intermittently for a total of
2 h across the 8 h session or presented in conjunction with a more palatable, high fat

74
maintenance diet. Regardless of the amount of dessert consumed, the calories from sugar
gel were compensated by a reduction in the intake of maintenance diet across all the
groups such that all the rats continued to consume the amount of calories they had when
given maintenance diet only in baseline conditions.
The data failed to support the hypothesis that intermittent access to a dessert would
increase its reinforcing saliency and diminish sensory specific satiety compared to
uninterrupted access, an argument suggested by Rolls et al. (1981) and Wansink (2004).
This suggests that the sugar gel may have a long-term acceptability (Vickers 1999) and
thus, not be prone to the effects of sensory specific satiety, or that with a single
consumable, availability does not affect the intake parameters concerning reinforcing
saliency or sensory specific satiety.
These data are interesting in relation to Corwin and Buda-Levin's (2004)
demonstration of binge-eating patterns, increased caloric intake, and body weight gain in
rats presented with vegetable shortening every other day compared to those given daily
access. This suggests that temporal availability does influence intake, but perhaps only
across days and with a high calorie snack. A different effect may have been observed
with the use of a dessert of higher caloric density in this protocol, an issue discussed
below.
The failure to support the hypothesis of an increase in caloric intake as a function
of dessert access is surprising since snacks are touted as driving the obesity epidemic
(Berteus Forslund et al. 2005); however, the snacks most often consumed by humans are
usually much higher in fat and energy density than the sugar gel used in this protocol.
The rats ate a large amount of the sugar gel, but at a caloric density of approximately 0.31

75
kcal/g (compared to maintenance diets of 3.34 or 5.24 kcal/g), large intakes of this
diluted diet wouldn't have much impact on total daily calories. As mentioned above,
Rolls et al. (2005) argue that energy density of foods is the most potent influence of body
weight gain and Drewnowski (2004) supports this by proposing that the water content of
food is indicative of its satiating power.
Intake of the sugar gel could also have been limited by its low protein to calorie
ratio relative to maintenance diet. Pol and den Hartog (1966) reported that even when
food deprived, rats will self-manage the selection of different macronutrient sources such
that approximately 8% of their calories are from protein. This exclusively carbohydrate
sugar gel may have set a ceiling of consumption that along with the low energy density
was unable to demonstrate the effect of dessert consumption on calorie balance. The
effect of dessert protein to calorie ratio was addressed in the next experiment, and dessert
energy density was explored in experiment 4.
Experiment 3–Temporal Availability and Protein to Calorie Ratio
The same pattern of dessert and maintenance diet consumption as in the sugar gel
protocol of experiment 2 was seen with uninterrupted or intermittent milk gel access.
The addition of protein to the low calorie dessert did not seem to have any effect on gel
consumption or maintenance diet compensation, but rather shows that the results of
experiment 2 generalize somewhat to isocaloric desserts of different macronutrient
quality. The protein to calorie ratio of food consumed may not be as influential a
determinant of food choice in situations of increased access to free food as it is in those
of deprivation. However, the low caloric density of the dessert is still an unresolved
factor since the 0.31 kcal/g gels seem to be incapable of increasing caloric intake from
baseline values. This prompted us to use a high calorie dessert, and the next experiment

76
addressed the effect of access to a high fat dessert of high caloric density compared to
sugar gel or no dessert on intake, compensation, and body weight.
Experiment 4–Energy Density
In this experiment, we observed that access to a dessert of high caloric density,
sugar fat whip, resulted in higher total caloric intake, dessert intake, and body weight
gain than rats given access to the lower density sugar gel or no dessert. Although intake
of maintenance diet was lower in rats given sugar fat whip than rats given sugar gel, this
compensation did not allow for maintenance of caloric balance. These findings are in
line with the arguments of Rolls et al. (2005) presented above and with those of de Castro
(2005), who demonstrated in humans that the greater the energy density of food
consumed, the greater the short-term caloric intake.
This study is an initial demonstration that caloric intake and body weight can be
influenced by access to a single optional calorie source. It is difficult, however, to
separate the effect of energy density from that of macronutrient content, especially that of
fat. The influence of fat and palatability are discussed in the introduction, and it has been
suggested that fat is not as satiating as carbohydrates or protein. The combinations of
macronutrients that make up a food also influence its palatability, which has also been
demonstrated to have a positive relationship with intake (as discussed in the
introduction). It would be interesting to implement comparisons of different desserts
representing the spectrum of combinations of energy density, macronutrient composition,
and palatability for long-term studies in rats as Rolls has done in short-term human
studies, but that task is beyond the scope of these studies.
These data also imply some means of long-term compensatory behavior and
regulation of body weight. The rats who gained weight on sugar fat whip showed lower

77
maintenance diet intake throughout the periods of dessert access and this continued
throughout the weeks following during which only maintenance diet was available.
Sugar fat whip intake decreased through the three experimental weeks, leveling by the
third week to the caloric intake seen in the rats given sugar gel. In the weeks following
termination of the experimental phase, the rats previously given sugar fat whip lost
weight and approached the body weights of the other groups of rats. This may be
indicative of increased leptin levels in response to increase in body adiposity, which
would then decrease subsequent food intake while maintaining a new body weight.
Since eating foods of a higher caloric density increases feeding efficiency, it is
possible that information regarding energy density can be defined and used to aid future
food selection and consumption. Since we had rats with different histories of dessert
access, it seemed ideal to assess the effect of prior experience with desserts of different
densities or no dessert at all on calorie selection from maintenance diet and both forms of
dessert.
Experiment 5–Previous Experience and Choice
In this study, we assessed the effect of previous experience with neither or either of
one of two desserts of different caloric densities on choice and consumption of the two
desserts when presented together and on subsequent compensation of maintenance diet
intake. Since baseline intakes were not equivalent between groups at the start of the
experiment, the results of this study are somewhat difficult to interpret. The differences
in baseline intake between groups was the result of decreased consumption of
maintenance diet of the rats previously given sugar fat whip, which may be indicative of
differences in production and effect of long-term correlates of body fat. When the results
are examined in terms of change in caloric intake from baseline, the rats that had

78
experience with sugar fat whip consumed more total calories than those with sugar gel
experience, which consumed more than the rats with no previous dessert experience. The
rats that had experience with either of the desserts also tended to eat more of both
desserts (significant for sugar gel but not sugar fat whip).
This is in line with Ramirez's (1991) study in rats, which demonstrated that
previous experience with bitter tastes reduces rejection of maintenance diet containing
sucrose octaacetate (a substance reported by humans to be bitter), and Darmaillacq et
al.’s (2004) study in cuttlefish, which suggested that prey preferences were determined by
early feeding experience. Leathwood and Ashley (1983) argue that learning from
previous food selection is a key component of both the metabolic and behavioral
mechanisms that promote adaptive eating in the prevailing environment. It would be
evolutionarily advantageous for animals to consume large quantities of familiar foods
that had previously been associated with positive oral and postingestive consequences
when they were readily available. The modern postindustrial food environment of
humans promotes experience with an abundance of different foods, possibly priming
future overconsumption.
Previous experience with food may also have implications for the acquisition and
maintenance of eating disorders, although the literature is not clear. Neudeck et al.
(2001) demonstrated that when presented with a high calorie 'forbidden food' two days in
a row, bulimic women rated urges to binge at a lower level on the second day compared
to the first. Jansen (1998) argues that the uncontrolled eating in binge eating disorder
(BED) is under the stimulus control of familiar cues, similar to drug addiction, and that
exposure to previously learned cues causes an increase in binge eating behavior. As

79
previously mentioned, Corwin and Buda-Levin (2004) has demonstrated the effect of
availability on binge eating in rats. Binge eating and perhaps overconsumption in general
seem to be influenced by multiple factors, including temporal opportunities and previous
experience. It was this that prompted our next experiment which explored the impact of
availability on the circadian metabolic rhythms of feeding in an attempt to delineate a
model of an eating disorder similar to binge eating -- night eating syndrome (NES), in
which humans gain a considerable amount of weight by consuming excess calories at
times of typical inactivity and sleep (Stunkard et al. 2005).
Experiment 6–Circadian Rhythms
In this study, rats were given access to sugar fat whip either at the onset of the dark
cycle, during which rats are active and consume the majority of their daily intake, or at
the onset of the light cycle, during which rats are inactive and consume very little food, in
an attempt to model the increased caloric intake and body weight gain seen in NES.
Although all the rats consumed more calories and gained weight when provided access to
sugar fat whip compared to baseline (as seen in experiment 4), there were no differences
as a function of the periodicity of dessert access. Rats given sugar fat whip during the
light cycle consumed a large amount of dessert and the majority of their daily calories
during their “nighttime”, but showed compensatory decrease of maintenance diet intake
such that total daily intake and body weight did not differ from rats given sugar fat whip
during the dark cycle.
These results are interesting in light of a study by Walls et al. (1991), which
suggests that compensatory decreases in oral food intake in the presence of intravenous
administration of nutrients are more accurate when the nutrients are presented nocturnally
than when presented diurnally. Walls makes the argument that this is due to the
80
association of gut-related signals that are present when rats normally feed (during the
night) and that are absent during the light cycle when the rats are undergoing lypolysis.
Although experiment 6 presents supplemental calories, it does so in the form of a food
that is eaten orally, thus allowing for gut-related signals. These aspects of the protocol
may have undermined the effect of circadian rhythms on compensation of feeding.
These results imply that some factor other than availability may be promoting
increased caloric intake in this model of NES, as opposed to Corwin's model of BED, in
which temporal availability seems to be key. This may imply that considering NES and
BED as components of a single recurring dysfunctional eating pattern (Tanofsky-Kraff
and Yanovski 2004) may not be functional, or at least a component to be considered in
construction and interpretation of rat models. Human behavioral antecedents, patterns,
and consequences of food intake (e.g., anxiety, social facilitation, meal structure and
frequency, and fear of weight gain) are not available in this rat model and thus, need to be
addressed before conclusions can be made.
Concluding Remarks
These studies explore the facets of availability and their effect on food intake,
caloric balance, and body weight gain. The results suggest that some aspects of
availability, especially the caloric density of supplemental calorie sources (snacks) and
previous experience with foods impact these measures. The effect of spatial and
temporal availability need to be further explored. It is possible that increased spatial
availability of a dessert or intermittent presentation of a dessert of high energy density
could elucidate the impact of these factors. These also need to be explored and animal
models constructed in the context of eating disorders, such as NES and BED. Food
availability seems to have the power to overwhelm homeostatic controls of body weight

81
and must be further explored and understood if effective prevention and treatment
strategies for obesity are to be developed.
82
LIST OF REFERENCES
Ackroff K, Sclafani A. (1999). Palatability and foraging cost interact to control caloric intake. Journal of Experimental Psychology, 25, 28-36.
Bagnasco M, Dube MG, Katz A, Kalra PS, Kalra SP. (2003). Leptin expression in hypothalamic PVN reverses dietary obesity and hyperinsulinemia but stimulates ghrelin. Obesity Research, 11, 1463-70.
Benoit SC, Clegg DJ, Seeley RJ, Woods SC. (2004). Insulin and leptin as adiposity signals. Recent Progress in Hormonal Research, 59, 267-85.
Berteus Forslund H, Torgerson JS, Sjostrom L, Lindroos AK. (2005). Snacking frequency in relation to energy intake and food choices in obese men and women compared to a reference population. International Journal of Obesity, 29, 711-9.
Bianchini F, Kaaks R, Vainio H. (2002). Overweight, obesity, and cancer risk. Lancet Oncology, 3, 565-74.
Bolles RC. (1980). Some functionalistic thoughts about regulation. In FM Toates and TR Halliday's (Eds.) Analysis of Motivational Processes (p. 63-76). Academic Press, New York
Bray GA. (1996). Static theories in a dynamic world: a glucodynamic theory of food intake. Obesity Research, 4, 489-92.
Center for Disease Control and Prevention. (2004). Trends in intake of energy and macronutrients – United States, 1971-2000. Morbidity & Mortality Weekly Report, 53, 80-2
Cannon WB. (1929). Organization for physiological homeostasis. Physiological Reviews, 9, 399-431.
Chan JM, Rimm EB, Colditz GA, Stampfer MJ, Willet WC. (1994). Obesity, fat distribution, and weight gain as risk factors for clinical diabetes in men. Diabetes Care, 17, 961-9.
Collier GH. (1985). Satiety: an ecological perspective. Brain Research Bulletin, 14, 693-700.
Collier G, Johnson DF. (2000). Sucrose intake as a function of its cost and the cost of chow. Physiology and Behavior, 70, 477-87.

83
Corbit JD, Stellar E. (1964). Palatability, food intake, and obesity in normal and hyperphagic rats. Comparative Physiological Psychology, 58, 63-7.
Corwin RL, Buda-Levin A. (2004). Behavioral models of binge-type eating. Physiology and Behavior, 82, 123-30.
Darmaillacq AS, Chichery R, Poirier R, Dickel L. (2004). Effect of early feeding experience on subsequent prey preference by cuttlefish, Sepia officinalis. Developmental Psychobiology, 45, 239-44.
de Castro JM. (2005). Macronutrient and dietary energy density influences on the intake of free-living humans. Appetite, in press as e-publication, 1-5
de Castro JM, Plunket S. (2002). A general model of intake regulation. Neuroscience and Biobehavioral Reviews, 26, 589-95.
Drewnowski A. (2004). Obesity and the food environment: dietary energy density and diet costs. American Journal of Preventative Medicine, 27, 154-62.
Ello-Martin JA, Ledikwe JH, Rolls BJ. (2005). The influence of food portion size and energy density on energy intake: implications for weight management. American Journal of Clinical Nutrition, 82, 236-41.
Flegal KM, Carroll MD, Ogden CL, Johnson CL. (2002). Prevalence and trends in obesity among United States adults, 1999-2000. Journal of the American Medical Association, 288, 1723-7.
Friedman MI, Stricker EM. (1976). The physiological psychology of hunger: a physiological perspective. Psychological Review, 83, 409-31.
Garcia F, Kimeldorf DJ, Hunt EL. (1956). Conditioned responses to manipulative procedures resulting from exposure to gamma radiation. Radiation Research, 5, 79-87.
Gutierrez-Fisac JL, Banega JR, Artalejo FR, Regidor E. (2000). Increasing prevalence of overweight and obesity among Spanish adults, 1987-1997. International Journal of Obesity and Related Metabolic Disorders, 24, 1677-82.
Hoebel BG, Teitelbaum P. (1971). Weight regulation in normal and hypothalamic hyperphagic rats. Journal of Comparative and Physiological Psychology, 61, 189-93.
Jansen A. (1998). A learning model of binge eating: cue reactivity and cue exposure. Behavioral Research Therapy, 36, 257-72.
Keesey RE. (1989). Physiological regulation of body weight and the issue of obesity. Medical Clinical Research in North America, 73, 15-22.

84
Kennedy GC. (1953). The role of depot fat in the hypothalamic control of food intake in the rat. Processes of the Royal Society of Britain, 140, 578-92.
Leathwood PD, Ashley DV. (1983). Behavioral strategies in the regulation of food choice. Experiential Supplements, 44, 171-96.
Lucas F, Ackroff K, Sclafani A. (1989). Dietary fat-induced hyperphagia in rats as a function of fat type and physical form. Physiology and Behavior, 45, 937-46.
Martins D, Tareen N, Pan D, Norris K. (2003). The relationship between body mass index, blood pressure, and pulse rate among normotensive and hypertensive participants in the NHANES. Cellular and Molecular Biology, 49, 1305-9.
Mayer J. (1954). Regulation of energy intake and the body weight: the glucostatic and lipostatic hypotheses. Annals of the New York Academy of Sciences, 63, 15-43.
Mokadad AH, Ford ES, Bowman BA, Diets WH, Vinico F, Bales VS, Marks JS. (2003). Prevalence of obesity, diabetes, and obesity-related health risk factors, 2001. Journal of the America Medical Association, 289, 76-9.
Must A, Spandano J, Coakley EH, Field AE, Colditz G, Dietz WH. (1999). The disease burden associated with overweight and obesity. Journal of the America Medical Association, 282, 1523-9.
Neudeck P, Florin I, Tuschen-Caffier B. (2001). Food exposure in patients with bulimia nervosa. Psychotherapy and Psychosomatic Research, 70, 193-200.
Pol G, den Hartog C. (1966). The dependence on protein quality of the protein to calorie ratio in a freely selected diet and the usefulness of giving protein and calories separately in protein evaluation experiments. British Journal of Nutrition, 20, 649-61.
Ramirez I. (1991). Influence of experience on response to bitter taste. Physiology and Behavior, 49, 387-91.
Raynor HA, Epstein LH. (2001). Dietary variety, energy regulation, and obesity. Psychology Bulletin, 127, 325-41.
Rolls BJ. (2000). The role of energy density in the overconsumption of fat. Journal of Nutrition, S1, 268-71.
Rolls BJ, Rolls ET, Rowe EH, Sweeney K. (1981). Sensory specific satiety in man. Physiology and Behavior, 27, 137-42.
Rolls BJ, Drewnowski A, Ledikwe JH. (2005). Changing the energy density of the diet as a strategy for weight management. Journal of the American Dietetic Association, 105, 98-103.

85
Rudolf MC, Greenwood DC, Cole TJ, Levine R, Sohota P, Walker J, Holland P, Cade J, Truscott J. (2004). Rising obesity and expanding waistlines in schoolchildren: a cohort study. Archives of Disorders of Childhood, 89, 235-7.
Sclafani A. (2004). Oral and postoral determinants of food reward. Physiology and Behavior, 81, 773-9.
Sclafani A. (1980). Dietary obesity. In A. Stunkard (Ed.) Obesity, (pp.166-81). Saunders Publishers, New York.
Sclafani A, Ackroff, K. (2003). Reinforcement value of sucrose measured by progressive ratio operant licking in the rat. Physiology and Behavior, 79, 663-70.
Spector AC. (2000). Linking gustatory neurobiology to behavior in vertebrates. Neuroscience and Biobehavioral Reviews, 24, 391-410.
Stellar E. (1954). The physiology of motivation. Psychological Reviews, 61, 5-22.
Stunkard AJ, Allison KC, O'Reardon JP. (2005). The night-eating syndrome: a progress report. Appetite, 45, 182-6.
Tanofsky-Kraff M, Yanovski SZ. (2004). Eating disorder or Disordered eating? Non-normative eating patterns in obese individuals. Obesity Research, 12, 1361-6.
Tordoff MG. (2002). Obesity by choice: the powerful influence of nutrient availability on nutrient intake. American Journal of Physiology: Regulatory, Integrative, and Comparative Physiology, 282, 536-9.
Vickers Z. (1999). Long-term acceptability of limited diets. Life Support and Biophysical Science, 6, 29-33.
Walls EK, Willing AE, Koopmans HS. (1991). Intravenous nutrient-induced satiety depends on feeding-related gut signals. American Journal of Physiology: Regulatory, Integrative, and Comparative Physiology, 261, 313-22.
Wansink B. (2004). Environmental factors that increase the food intake and consumption volume of unknowing consumers. Annual Review of Nutrition, 24, 455-79.
Warwick ZS, Schiffman SS. (1992). Role of dietary fat in calorie intake and weight gain. Neuroscience and Biobehavioral Reviews, 16, 585-96.
Warwick ZS, Weingarten HP. (1995). Dietary fat content affects energy intake and weight gain independent of diet caloric density in rats. Physiology and Behavior, 7, 85-90.

86
Warwick ZS, Synowski SJ, Bell KR. (2002). Dietary fat content affects energy intake and weight gain independent of diet caloric density in rats. Physiology and Behavior, 77, 85-90.
Woods SC. (1991). The eating paradox: how we tolerate food. Psychological Review, 98, 488-505.
Woods SC, Seeley RJ, Rushing PA, D'Alessio DA, Tso P. (2003). A controlled high-fat diet induces an obese syndrome in rats. Nutrient Metabolism, 1081-7.
Woods SC, D'Alessio DA, Tso P, Rushing PA, Clegg DJ, Benoit SC, Gotoh K, Liu M, Seeley RJ. (2004). Consumption of a high-fat diet alters the homeostatic regulation of energy balance. Physiology and Behavior, 83, 573-8.

87
BIOGRAPHICAL SKETCH
Clare Marie Mathes was born in Detroit, Michigan. She completed high school at
Chippewa Valley in Clinton Township, Michigan. Clare received her B.S. in psychology
from Western Michigan University, Kalamazoo, Michigan, in May 2002. She graduated
summa cum laude and with honors for defense of an undergraduate thesis in behavior
analysis. In 2003, she was accepted into the laboratory of Dr. Neil Rowland in the
behavioral neuroscience area of the Department of Psychology at the University of
Florida where she has been studying since. Clare received her M.S. in psychology from
the University of Florida in 2005. She plans to continue at UF in pursuit of her PhD.
Related Documents