1 EFFECT OF FIRE SIZE AND SEVERITY ON SUBSEQUENT FIRES USING DIFFERENCED NORMALIZED BURN RATIOS IN PINE DOMINATED FLATWOOD FORESTS IN FLORIDA By SPARKLE LEIGH MALONE A THESIS PRESENTED TO THE GRADUATE SCHOOL OF THE UNIVERSITY OF FLORIDA IN PARTIAL FULFILMENT OF THE REQUIREMENTS FOR THE DEGREE OF MASTER OF SCIENCE UNIVERSITY OF FLORIDA 2010

Welcome message from author
This document is posted to help you gain knowledge. Please leave a comment to let me know what you think about it! Share it to your friends and learn new things together.
Transcript

1
EFFECT OF FIRE SIZE AND SEVERITY ON SUBSEQUENT FIRES USING DIFFERENCED NORMALIZED BURN RATIOS IN PINE DOMINATED FLATWOOD
FORESTS IN FLORIDA
By
SPARKLE LEIGH MALONE
A THESIS PRESENTED TO THE GRADUATE SCHOOL OF THE UNIVERSITY OF FLORIDA IN PARTIAL FULFILMENT OF THE REQUIREMENTS FOR THE DEGREE
OF MASTER OF SCIENCE
UNIVERSITY OF FLORIDA
2010

2
© 2010 Sparkle Leigh Malone

3
To all those who supported me through this process

4
ACKNOWLEDGMENTS
Without the help and support of many people this project would not have been
possible. I am most grateful to my committee members (Dr. Amr Adb-Elrahman, Dr.
Leda Kobziar, and Dr. Christina Staudhammer) for their endless guidance and their
commitment to this project. I would also like to express my gratitude for the support
offered by faculty (Dr. Taylor Stein and Dr. George Blakeslee), students in the school of
forestry, and friends who not only provided encouragement but sacrificed their own time
for the sake of this project.
Data analysis assistance was graciously provided by Dr. Mary Christman, Dr.
Christina Staudhammer, and Nilesh Timilsina. Many thanks to the Quantitative Biology
Lab (Nilesh Timilsina, Todd Bush, Helen Claudio, and Dr. Louise Loudermilk) for their
relentless encouragement throughout this process. I would also like to thank the
Kobziar Fire Science Lab for their assistance.
Funding was provided by Conserved Forest Ecosystems: Outreach and Research
(CFEOR). Special thanks are necessary for Jason Drake at the U.S. Forest Service
Supervisors Office in Tallahassee, Florida for providing both data for this project and
inspiration. Finally, I would like to thank my family for their continued support in my
academic endeavors.

5
TABLE OF CONTENTS page
ACKNOWLEDGMENTS .................................................................................................. 4
LIST OF TABLES ............................................................................................................ 7
LIST OF FIGURES .......................................................................................................... 8
LIST OF ABBREVIATIONS ........................................................................................... 11
ABSTRACT ................................................................................................................... 12
CHAPTER
1 INTRODUCTION TO FIRE IN THE SOUTHEASTERN UNITED STATES ............. 14
Introduction ............................................................................................................. 14 Suppression in Pine Flatwoods ........................................................................ 15 Fire as a Forest Management tool .................................................................... 16 Fire Severity ..................................................................................................... 19 Measuring Fire Severity with DNBRs ............................................................... 20
Study Site ............................................................................................................... 23 Conclusion .............................................................................................................. 23
2 EFFECTS OF FIRE FREQUENCY, SIZE, AND TIME BETWEEN FIRE EVENTS IN NORTH FLORIDA FLATWOODS ....................................................... 26
Introduction ............................................................................................................. 26 Measuring Fire Severity.................................................................................... 27 Study Site ......................................................................................................... 31
Methods .................................................................................................................. 32 Data .................................................................................................................. 32 Model Development ......................................................................................... 33
Results .................................................................................................................... 37 Data .................................................................................................................. 37 Probability Modeling ......................................................................................... 38
Probability of experiencing moderate to high severity during a fire ............ 38 Probability of increasing in severity in subsequent fires ............................. 39 Probability of burning during a fire ............................................................. 40 Probability of decreasing in severity in subsequent fires ............................ 41 Fire size analysis ....................................................................................... 42
Discussion .............................................................................................................. 42 Probability of Experiencing Moderate to High Severity During a Fire ............... 42 Probability of Increasing in Severity ................................................................. 45 Probability of Burning ....................................................................................... 46 Probability of Decreasing in Severity ................................................................ 47

6
Conclusion .............................................................................................................. 48
3 PREDICTING FIRE SEVERITY IN PINE FLATWOODS USING DIFFERENCED NORMALIZED BURN RATIOS TO RECORD FIRE EVENTS ................................ 80
Introduction ............................................................................................................. 80 Measuring Fire Severity.................................................................................... 80 Study Site ......................................................................................................... 83
Methods .................................................................................................................. 84 Image Analysis ................................................................................................. 84 Data .................................................................................................................. 84 Model Development ......................................................................................... 85 Spatial Model .................................................................................................... 89
Results .................................................................................................................... 89 Probability of High Severity Prescribed Fire ..................................................... 89 Probability of Moderate to High Severity Wildfire ............................................. 90 Spatial Models .................................................................................................. 91
Discussion .............................................................................................................. 92 Probability of High Severity Prescribed Fire ..................................................... 92 Probability of Moderate to High Severity Wildfire ............................................. 93 Spatial Models .................................................................................................. 94
Conclusion .............................................................................................................. 95
4 CONCLUSION ...................................................................................................... 118
APPENDIX: SEVERITY DATASETS ........................................................................... 120
LIST OF REFERENCES ............................................................................................. 131
BIOGRAPHICAL SKETCH .......................................................................................... 136
7
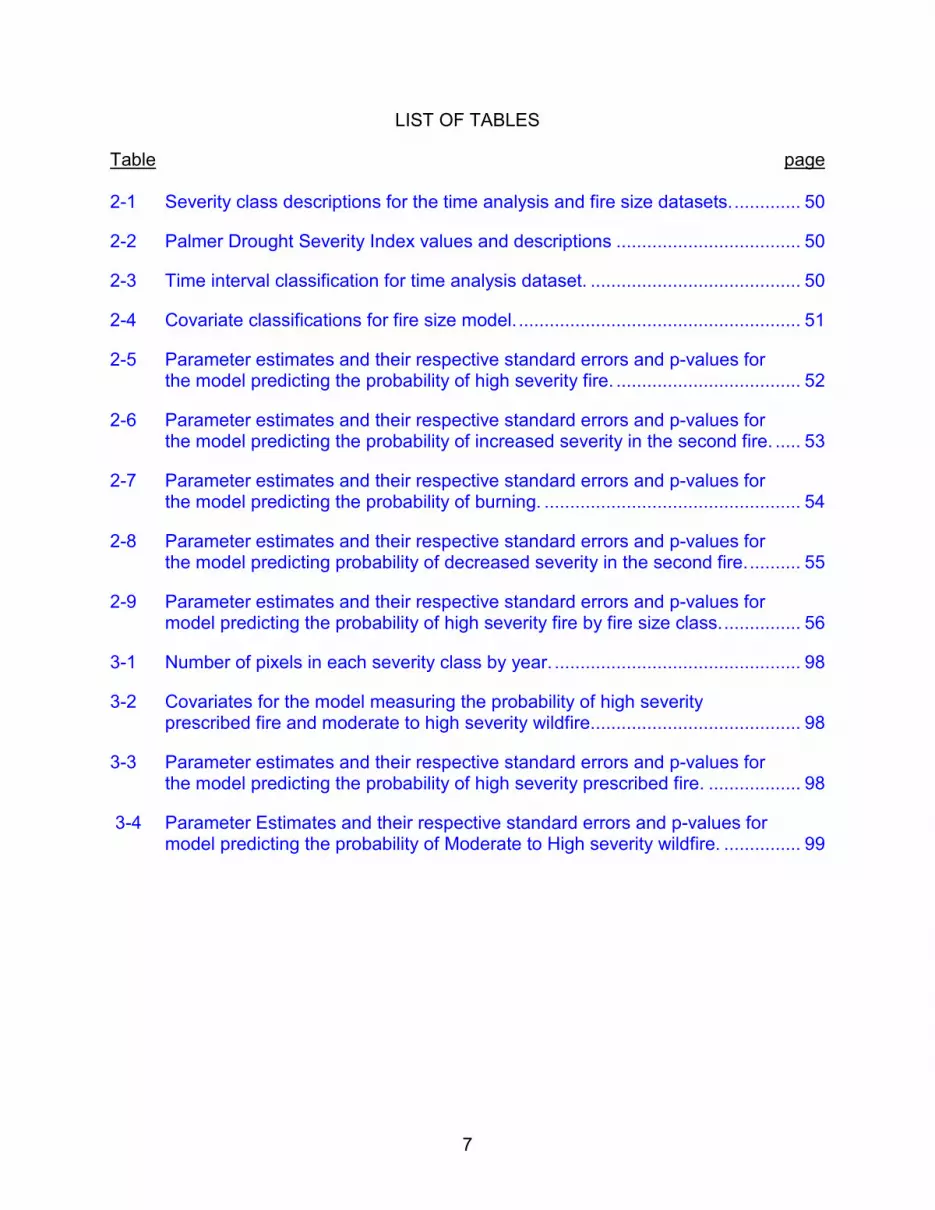
LIST OF TABLES
Table page 2-1 Severity class descriptions for the time analysis and fire size datasets. ............. 50
2-2 Palmer Drought Severity Index values and descriptions .................................... 50
2-3 Time interval classification for time analysis dataset. ......................................... 50
2-4 Covariate classifications for fire size model. ....................................................... 51
2-5 Parameter estimates and their respective standard errors and p-values for the model predicting the probability of high severity fire. .................................... 52
2-6 Parameter estimates and their respective standard errors and p-values for the model predicting the probability of increased severity in the second fire. ..... 53
2-7 Parameter estimates and their respective standard errors and p-values for the model predicting the probability of burning. .................................................. 54
2-8 Parameter estimates and their respective standard errors and p-values for the model predicting probability of decreased severity in the second fire. .......... 55
2-9 Parameter estimates and their respective standard errors and p-values for model predicting the probability of high severity fire by fire size class. ............... 56
3-1 Number of pixels in each severity class by year. ................................................ 98
3-2 Covariates for the model measuring the probability of high severity prescribed fire and moderate to high severity wildfire. ........................................ 98
3-3 Parameter estimates and their respective standard errors and p-values for the model predicting the probability of high severity prescribed fire. .................. 98
3-4 Parameter Estimates and their respective standard errors and p-values for model predicting the probability of Moderate to High severity wildfire. ............... 99

8
LIST OF FIGURES
Figure page 1-1 Osceola National Forest in North Florida. ........................................................... 25
2-1 USFS forest type classifications. ........................................................................ 57
2-2 NRCS soil drainage class classification. ............................................................. 58
2-1 Portion of pixels burned in each severity level in fire 1 and fire 2. ...................... 59
2-2 Distribution of pixels among severity classes with 1-2 years between fire events separated by type of fire and the probability of moving from one severity class to the next. ................................................................................... 60
2-3 Distribution of pixels among severity classes with 3-4 years between fire events separated by type of fire and the probability of moving from one severity class to the next. ................................................................................... 61
2-4 Distribution of pixels among severity classes with 5-6 years between fire events separated by type of fire and the probability of moving from one severity class to the next. ................................................................................... 62
2-5 Distribution of pixels among severity classes with 7-8 years between fire events separated by type of fire and the probability of moving from one severity class to the next. ................................................................................... 63
2-6 Distribution of pixels among severity classes with 9-10 years between fire events separated by type of fire and the probability of moving from one severity class to the next. ................................................................................... 64
2-7 Percentage of pixels increasing and decreasing in severity level by time and type of fire. .......................................................................................................... 65
2-3 Fire size compared with Palmer drought severity index between 1996 and 2010. This suggests large fire events are associated with prolonged droughts. ............................................................................................................ 66
2-4 Percentage of pixels burned at each severity class by fire size class. Larger fires have a higher portion of their cells in the high severity class. ..................... 67
2-8 Probability of experiencing high severity in fire 2 by time interval and fire type. .................................................................................................................... 68
2-9 Probability of experiencing high severity in fire 2 by severity level of fire 1 and time interval for prescribed fires. ......................................................................... 69

9
2-10 Probability of experiencing high severity in fire 2 by severity level of fire 1 and time interval for wildfires. .................................................................................... 70
2-11 Probability of increasing fire severity by time interval and fire type. .................... 71
2-12 Probability of increasing fire severity by severity level of the last fire and time between fires for wildfires. .................................................................................. 72
2-13 Probability of increasing fire severity by severity level of the last fire and time between fires for prescribed fires. ....................................................................... 73
2-14 Probability of burning by time interval, fire type, and fire severity level. .............. 74
2-15 Probability of burning by fire severity level and time interval for wildfires. .......... 75
2-16 Probability of burning by fire severity level and time interval for prescribed fires. .................................................................................................................... 76
2-17 Probability of decreasing in severity level by time interval and severity level of fire 1. .................................................................................................................. 77
2-18 Probability of decreasing in severity by severity level of fire 1 and time interval for wildfires. ............................................................................................ 78
2-19 Probability of decreasing in severity by severity level of fire 1 and time interval for prescribed fires. ................................................................................ 79
3-1 Time since last fire for the Osceola National Forest (1998-2008) ..................... 100
3-2 Fire frequency from 1998-2008 for the Osceola National Forest. ..................... 101
3-3 Severity level of the last fire event (1998-2007)................................................ 102
3-4 Florida Geographic Database Library Map of forest types for the Osceola National Forest. ................................................................................................ 103
3-5 Map of the community types, hydric and mesic, for the Osceola National Forest. .............................................................................................................. 104
3-6 Relationship between the probability of high severity prescribed fire, frequency of fire, and time since last fire. ......................................................... 105
3-7 Relationship between the probability of high severity prescribed fire, the severity level of the last fire event, and time since last fire. .............................. 106
3-8 Relationship between the probability of high severity prescribed fire, frequency of fire, and time since last fire. ......................................................... 107

10
3-9 Relationship between the probability of moderate to high severity wildfire, frequency of fire, and time since last fire. ......................................................... 108
3-10 Relationship between the probability of moderate to high severity wildfire, fire frequency, and time since last fire. ................................................................... 109
3-11 Probability of high severity prescribed fire versus observed severity levels for 2008 prescribed fires. ....................................................................................... 110
3-12 The probability of high severity prescribed fire in 2008. .................................... 111
3-13 The probability of high severity prescribed fire in 2008 by community type. ..... 112
3-14 Severity levels of 2008 prescribed fires on the Osceola National forest. .......... 113
3-15 The probability of high severity prescribed fire in 2008 by forest type. ............. 114
3-16 The probability of moderate to high severity fire for 2008. ................................ 115
3-17 The probability of moderate to high severity wildfire for 2008 by community type. .................................................................................................................. 116
3-18 The probability of moderate to high severity wildfire in 2008 by forest type. ..... 117
A-1 Severity levels of fire events for the 1998 fire season. ..................................... 120
A-2 Severity levels of fire events for the 1999 fire season. ..................................... 121
A-3 Severity levels of fire events for the 2000 fire season. ..................................... 122
A-4 Severity levels of fire events for the 2001 fire season. ..................................... 123
A-5 Severity levels of fire events for the 2002 fire season. ..................................... 124
A-6 Severity levels of fire events for the 2003 fire season. ..................................... 125
A-7 Severity levels of fire events for the 2004 fire season. ..................................... 126
A-8 Severity levels of fire events for the 2005 fire season. ..................................... 127
A-9 Severity levels of fire events for the 2006 fire season. ..................................... 128
A-10 Severity levels of fire events for the 2007 fire season. ..................................... 129
A-11 Severity levels of fire events for the 2008 fire season. ..................................... 130

11
LIST OF ABBREVIATIONS
AIC Akaike’s information criterion
BIC Bayesian information criterion
dNBR differenced Normalized Burn Ratio
MTBS Monitoring trends in burn severity
NBR Normalized burn ratio
NRCS Natural Resource Conservation Service
NRMSC Northern Rocky Mountain Science Center
PDSI Palmer drought severity index
TSLF Time since last fire
USFS United States Forest Service
USGS United States Geological Survey
WUI Wildland urban interface

12
Abstract of Thesis Presented to the Graduate School of the University of Florida in Partial Fulfillment of the Requirements for the Degree of Master of Science
EFFECT OF FIRE SIZE AND SEVERITY ON SUBSEQUENT FIRES USING
DIFFERENCED NORMALIZED BURN RATIOS IN PINE DOMINATED FLATWOOD FORESTS IN FLORIDA
By
Sparkle Malone
August 2010
Chair: Christina Staudhammer Cochair: Leda Kobziar
Florida forests naturally experienced frequent low intensity fires, yet fire exclusion
polices have altered the forest structure. The Osceola National Forest in north Florida
has experienced high wildfire occurrence for a number of years. Vegetation
communities within the Osceola are fire dependent and require regular burning for
ecosystem health. Although prescribed fire has been used to reduce wildfire risk and
maintain ecosystem integrity across much of the forest, managers are still working to
reintroduce fire to long-unburned units. The objective of this study is to use differenced
Normalized Burn Ratio (dNBR) to evaluate the relationships between previous fire
severity, size, and historical frequency to inform prioritization and timing of future fire
use. Based on remotely-sensed Landsat imagery, dNBR analysis captures spectral
features over a time interval, and indicates the degree of change that is due to fire. This
analysis has shown that fires in areas burned 5 or more years prior exhibited a higher
probability of experiencing moderate-high severity fire and have a higher probability of
increasing in severity level in subsequent fires. Areas that have not experienced fire in
10 years are indistinguishable from areas that have never burned. Using dNBR as a

13
method of analyzing past fire severity is a useful tool for managers to determine the
lasting effects of prior fire severity. The analysis has further provided an effective
method of determining fire frequencies necessary to maintain the optimum level of
wildfire protection.

14
CHAPTER 1 INTRODUCTION TO FIRE IN THE SOUTHEASTERN UNITED STATES
Introduction
Fuel is any combustible material that is used to maintain fire. Without regular
fire, fuel loads in forested ecosystems grow to dangerous levels increasing the risk of
catastrophic wildfire. In systems where fire is a natural component, fuel management is
important for ecosystem health. Wildfire risk is not only affected by fuel, the increase in
population in the wildland urban interface (WUI) is also of great importance.
Anthropogenic influences are a major source of wildfire ignitions. Land managers are
currently working to reduce fuel accumulation in efforts to reduce the risk of catastrophic
wildfires but sensitive areas within WUI create additional problems. Land managers are
challenged with protecting surrounding land in a way that contributes to their
management goals.
The focus of this project is on a forest wide burn severity analysis in a north
central Florida forest using differenced Normalized Burn Ratios (dNBR) for fires that
occurred between 1998 and 2008. This analysis is important for the evaluation of past
fire history and the effects it can have on subsequent fires. This study provides
valuable information regarding appropriate fire regimes to keep fuel loads low enough to
mitigate the effects of wildfires. This method of fire assessment using remote sensing
techniques can easily be modified to evaluate past fire effects for any land manager to
impart site specific statistics to their land management practices. The main objectives of
this study are:

15
1. Determine how past fire size and severity level effect subsequent fire behavior?
2. Identify the relationship between fire size and the proportion of area burned at high severity?
Suppression in Pine Flatwoods
Pine flatwoods are successional communities with southern mixed hardwoods,
mixed hardwoods, or bay heads as the climax community (Monk 1968). Without regular
disturbance, this fire maintained community shifts to one of the 3 climax communities.
Soil moisture and fertility determine which climax community is attained (Monk 1968).
Historically, fires were ignited by Indian hunting parties to corral game, by naval store
operators to reduce wildfire risk, by cattle owners to encourage grass growth, and by
lightning (Heyward 1939). Pine flatwoods burned at a frequency of every 1-15 years
(Maliakal et al. 2000). In the 1920s fire suppression began in the region (Frost 1993).
Long-term fire exclusion altered stand structure permitting hardwood species to occupy
pine flatwood forest at high densities (Gilliam et al. 1999; Heyward 1939). The lack of
disturbance created conditions outside the evolutionary history of species adapted to
this disturbance regime giving species adapted to less frequent disturbance the
advantage (Maliakal et al. 2000).
Pyrogenic species survive fire by either sprouting to regenerate or are able to
withstand repeated burning by maintaining features that allow the plant to survive fires
(Abrahamson 1984). Pine species have evolved to have thick bark and high crowns
(Waldrop et al.1992) while other species re-sprout or seed (Abrahamson et al. 1996).
The majority of non-coniferous woody species re-sprout from underground reserves
rather that re-seeding (Abrahamson et al. 1996). Changes in vegetation following

16
extended periods of suppression leads to more intense, patchier, and less frequent
fires which may require more extreme conditions to burn (Maliakal et al. 2000).
Fire as a Forest Management tool
One of the most effective tools for fuel management in the southeastern United
States is prescribed burning (Davis et al. 1963). The purpose of using prescribed fire as
a management tool is to reduce fuel accumulations to levels that minimize damage from
wildfire and wildfire occurrence (Davis et al. 1963), improve wildlife habitat, reintroduce
fire to pyrogenic communities and, conserve biodiversity (Outcalt et al. 2004). Fire
management in Florida is largely dictated by urban encroachment, forest fragmentation,
and the challenges associated with smoke management (Wolcott et al. 2007). As long
as fuel loads are kept below 5 years, using fire to reduce the occurrence of catastrophic
wildfires is a profitable investment (Davis et al. 1963). Past research has shown that
wildfires could be kept small and damage limited with regular use of prescribed fire.
Regular prescribed burning keeps fuel accumulations on the forest floor and in the
understory within tolerable levels (Outcalt et al. 2004).
The amount of time that has passed after fire can greatly affect wildfire behavior
and effects. Davis et al. (1963) found the wildfire occurrence rate for areas on the
Osceola that contained fuel loads 3 years and older were higher than lower fuel loads.
Large fires were also found to be restricted by roughs 5 years and greater (Davis et al.
1963). As fires moved into younger roughs, intensity level was reduced to a degree
where suppression was possible (Davis et al. 1963). Outcalt et al. (2004) also found a
significant relationship between time since last fire and fire intensity. As time increased,
fire intensity also increased (Outcalt et al. 2004). Fuel accumulations of 3 years or less

17
support fewer fires, lower fire intensities, and lower annual burned acreage (Davis et al.
1963).
Prescribed burns are implemented under optimal circumstances where
conditions are suitable for vegetation consumption but not at levels to cause fire to
become unmanageable. Favorable conditions are characterized by cool weather,
relatively constant winds, dry litter, and wet soil (Davis et al. 1963). During prescribed
burns wet areas burn lightly if at all. Understory fuel is partially consumed with little
consumption of the duff layer (Outcalt et al. 2004). Therefore, wet areas (cypress
ponds) generally carry very heavy fuel volumes. During extended drought periods,
these areas (cypress ponds) dry up making them capable of very large very intense
wildfires (Davis et al. 1963).
Mortality is a major issue in prescribed fire management. Prescribed fire is used
to reduce the effects of catastrophic wildfire where a higher amount of mortality is likely
to result. Outcalt et al. (2004) found prescribed fire to be efficient in reducing mortality
levels and timber loss. Tree mortality was 64% in previously unburned areas and 17%
in areas burned within the last 3 years (Outcalt et al. 2004). Outcalt et al. (2004) also
found that relative moisture levels of an area influenced tree mortality. Mortality was
significantly higher on wetter sites, likely due to high fuel loads. It was also shown that
during extreme drought conditions, mortality was significantly higher on sites where fires
had been absent for 5 or more years.
The most favorable timing of prescribed fire depends on management objectives
and site characteristics. Flatwoods are generally burned either during winter (dormant

18
season) or summer burns (growing season). Vegetation and fuel consumption differs
significantly between the two.
Winter, in north central Florida, is typically a dry season with most precipitation
coming from periodic cold fronts. Ambient temperatures are lower reducing the total
amount of heat transferred to surrounding vegetation during fire, resulting in less
damage to plant tissues. Prescribed fires following fronts are manageable and allow the
upper layers of litter to carry fire while lower layers are unavailable. This time of year,
grasses and other fine fuels are avialible to burn while deciduous hardwoods have their
food reserves below ground and are prepared to sprout back following fire. Dormant
season burning affects the size, cover, and vigor of hardwoods but is not effective at
reducing abundance.
Early spring is typically a season marked by thunderstorm development and
lightning ignitions. Hydric communities are most likely available to burn during this time
yet the prolonged time between precipitation events, make this season less desirable
for most management objectives. Spring fires are useful for stimulating seed, raising
insect populations, and increasing the quality of browse to boost food availability for
wildlife.
Although summer is the hottest season, it is also the wettest. The increase in
temperature causes fires to be more intense and more likely to cause damage to plants.
This is also the season of thunderstorms. Unstable atmospheres associated with such
events bring lighting, unpredictable wind speeds and direction that can complicate
prescribed burning. Burns during this season must be carefully monitored. Summer
fires reduce hardwood vigor allowing grasses and forbs to increase in abundance.

19
Fire Severity
Fire severity is a measure of ecological and physical change attributed to fire
(Agee 1993; Hardy 2005). It is influenced by both abiotic and biotic factors. Abiotic
determinants include weather, moisture, time of day, sunlight incidence, and slope
(Oliveras et al. 2009). Vegetation attributes such as species, tree size, succession
stage, and pathogens are among the many factors influencing fire severity (Cocke et al.
2005). The variability in landscape and weather conditions during a fire are the cause
of heterogeneous burn patterns (Cocke et al. 2005). Major differences in severity are
also associated with the location of the fire perimeter (Oliveras et al. 2009). Head fires
burn with greater flame lengths and intensity than backing fires. Head fires move in the
same direction as the wind while backing fires move against the wind. Consequently,
we would expect to see greater severity in areas burned by heading fires than in areas
burned by backing fires.
Low severity burns are characterized by lightly burned areas where only fine
fuels are consumed with minor scorching of trees in the understory (Wagtendonk et al.
2004). Areas of moderate severity retain some fuels on the forest floor and have crown
scorching in mid-large trees with mortality of small trees (Wagtendonk et al. 2004).
High severity zones are generally composed of complete combustion of all litter, duff
and small logs, mortality of small-med trees, and consumption of large tree crowns
(Wagtendonk et al. 2004). Unburned and low burn areas serve as seed sources for
more severely burned sections (Cocke et al. 2005).
Severity is important to monitor as its effects on exotic species establishment,
soil responses, and regeneration can be significant. Large fires may remove existing
plant biomass, providing ideal habitat for exotic species (Kuezi et al. 2008). Responses

20
in soil condition following fire can range from affirmative nutrient availability to loss of
nutrients, soil micro-organisms, and changes in physical structure of the soil (Busse et
al. 2005). The degree of canopy degeneration due to cambium and crown scorch can
severely impact the ability to re-sprout or seed. Combined with the biophysical
condition, plant recovery following a severe fire can prove nearly impossible for remnant
vegetation (White et al.1996).
The same fire behavior can result in very different severity effects in over and
understory vegetation, as well as in soil conditions (Wagtendonk et al. 2004). Burn
severity effects aren’t always evident directly following fire. Therefore, a fire severity
analysis will help managers anticipate the short and long term effects of severity level,
and how to better predict areas of potential high severity. The burn severity analysis will
further improve our understanding of why and where fires burn severely.
Measuring Fire Severity with DNBRs
Fire severity can be effectively measured through remote sensing techniques. A
differenced Normalized Burn Ratio (dNBR) captures the spectral response, over a time
interval, and indicates the degree of change that is due to fire (Wagtendonk et al. 2004;
Miller et al. 2006). The mapping methodology was initially developed and tested by the
USGS Northern Rocky Mountain Science Center (NRMSC). Multi-temporal image
differencing was employed to enhance contrast and detection of changes from pre- and
post-fire images using Landsat Thematic Mapper (TM) bands 4 and 7 (Wagtendonk et
al. 2004). Normalized Burn Ratios (NBR) were designed to enhance the bands’
response to fire by normalizing their difference to compensate for variations in the
overall brightness of the scene (Wagtendonk et al. 2004). The use of shortwave
infrared bands was found to have the highest accuracy (Cocke et al. 2005). Employed

21
as a radiometric index, dNBRs are directly related to burn severity (Wagtendonk et al.
2004) and as long as the fire is within the resolution range of the satellite sensor, 30m, it
is detectable (White et al. 1996).
Sensitivity to vegetation and soil moisture, changes in canopy cover, biomass
removal, and soil chemical composition allow dNBRs to define different levels of burn
severity. Fire effects on soil, litter, and vegetation impact the spectral response of the
post-fire image (White et al. 1996 and Cocke et al. 2005). The degree of change
between the two images determines the extent to which fire has affected the area of
interest (White et al.1996). An increase in dNBR corresponds to an increase in severity
level. Unburned areas have values near zero, signifying little to no change between the
pre- and post-fire image (Wagtendonk et al. 2004). High severity areas have higher
DNBRs due to greater vegetation die off (Kuezi et al. 2008). In order to model the fire
severity accurately it is important to pair the pre- and post-fire images by phenology and
moisture levels (Wagtendonk et al. 2004). Timing of acquisition can impact dNBRs if
there is a significant difference in vegetation and moisture levels due to phenology, not
fire (Wagtendonk et al. 2004).
Important to consider when using dNBRs is the chance that values are being
influenced by events other than fire. Turner et al. (1994) used dNBRs in Yellowstone
National Park and discovered bias in particular severity classes due to pine beetle
infestation (White et al. 1996). Jakubauskas et al. (1990) found that burn severity is
detected differently among conifers, deciduous trees, and shrubs due to re-vegetation
patterns. In addition, drought stress and vegetation re-growth makes it difficult to
discern low severity and unburned areas (Cocke et al. 2005). The highest accuracy is

22
achieved in detecting high severity burns (Cocke et al. 2005). More severely burned
areas have a much greater difference in vegetation cover changing the radiation budget
in the post fire image by a greater degree (White et al. 1996).
DNBR is used within the United States to appraise fire severity following major
fires (Wagtendonk et al. 2004; Godwin 2008). Image differencing is one of the most
accurate methods of detecting the level of change caused by fire (Cocke et al. 2005). It
can accurately detect burn severity in a way that is repeatable. Beyond any other band
combinations, NBRs emphasize the effects of fire. Other methods that use bands in the
visible part of the spectrum introduce atmospheric interference from dust and smoke
(Cocke et al. 2005). And, indices derived from near infrared and mid-infrared
reflectance are not sensitive enough to remotely sense water stress (Wagtendonk et al.
2004).
Studies using dNBRs have been in efforts to calibrate severity levels (Cocke et
al. 2005; Hoy et al. 2008), compare severity levels of a previous fires to a subsequent
fires (Collins et al. 2009; Allen et al. 2008;), interpret the effects of fuel management on
severity (Safford et al. 2009), and to monitor changes in vegetation over time (White
1996; Kuenzi et al. 2008) and topographical variations (Holden 2009; Oliveras et al.
2009). Currently in the United States there is a multi agency project, Monitoring Trends
in Burn Severity (MTBS), using dNBRs to map burn severity and perimeters of large
fires. This project uses data from 1984 – 2010 to identify national trends in burn
severity in efforts to determine the effectiveness of the National Fire Plan and Healthy
Forest Restoration Act.

23
Study Site
The Osceola National Forest is located in the northeastern portion of the state of
Florida (Latitude: 30.34371, Longitude: -82.47322) about 40 miles west of the city of
Jacksonville (Figure 1-1). The forest consists of pine flatwoods and areas of cypress
and bay swamps. Pine flatwoods have an overstory of pines on low, flat, sandy, acidic
soils with an understory of herbaceous plants and grasses. This community is fire
dependent and requires regular burning for pine germination and maintenance of plant
and animal communities. The lack of fire for prolonged periods will increase broad leaf
woody vegetation and reduce herbaceous plant cover and eventually reduce pine
germination. The main communities found within flatwoods on the Osceola are
Longleaf (Pinus palustris) wiregrass (Aristida beyrichiana), and slash pine (Pinus elliotti)
–gallberry (Illex glabra) -palmetto. In the low lying wet areas scattered throughout the
forest are cypress (Taxodium spp) ponds.
Fire management of the forest consist of a prescribe burn fire frequency of 2-5
years for most managed compartments with areas that have never been an active part
of their prescribed fire program. Fire frequencies are determined based on current
forest type and the desired future condition of the forest. The largest struggle fire
managers’ face on this forest is burning large acreages every year given few days that
are within specified prescribed fire weather conditions. Forest managers must also deal
with smoke management issues associated with being near a major urban area, an
interstate highway, and an airport.
Conclusion
Fire management in the southeast plays a crucial role in maintaining ecosystem
health and protecting private and public land. Evaluating fire severity for 11 years of

24
fire data for the Osceola National Forest has the potential to provide very important
information regarding fire frequencies necessary to reduce wildfire risk and the effects
of previous fires on subsequent fires. The analysis aims to identify the effects of fire
frequency, the time since last fire, and the severity level of past fires on fire behavior
using inexpensive remote sensing techniques. This information can then be used to
identify areas that should be a high priority for prescribed burning and areas that may
require immediate attention if threatened by wildfire.

25
Figure 1-1. Osceola National Forest in North Florida.

26
CHAPTER 2 EFFECTS OF FIRE FREQUENCY, SIZE, AND TIME BETWEEN FIRE EVENTS IN
NORTH FLORIDA FLATWOODS
Introduction
Prescribed fire is an important management tool in the south eastern United
States. In pyrogenic communities that require regular burning for ecosystem health,
forest managers are working to implement prescribed fire in place of natural wildfire
cycles. Florida forest naturally experienced frequent low intensity fires yet high
population, forest fragmentation, and dwindling budgets make prescribed fire
management increasingly difficult. Sensitive areas (around major highways and roads,
airports, and communities) reduce the amount of prescribed burning that can be done
safely. Land managers are faced with decisions on how to implement prescribed fire in
a manner that meets their management objectives and reduces the risk of catastrophic
wildfire.
At present, land manager objectives include: reduced fuel accumulation to levels
that minimize damage from wildfire (Davis et al. 1963), improved wildlife habitat, and the
conservation of biodiversity (Outcalt et al. 2004). Timing of burning, fire frequency
necessary to meet objectives, and the effects of fire are of major concern to land
managers. Managers could greatly benefit from a quantifiable method of evaluating fire
effects that is site specific. This study aims to develop a spatially explicit fire history for
the Osceola National Forest that can be used to determine past fire effects and future
implications.
Forested communities are in a constant state of change. They are continuously
recovering from some sort of disturbance. The state of the community is a function of
the frequency of disturbance, the time between disturbance events, and the severity of

27
the disturbance. The main source of disturbance associated with the species
composition and abundance of pine flatwoods forests is fire.
In pyrogenic communities the frequency, intensity, and the amount of time
between disturbances dictate community composition and further impacts the
vegetative response to fire. Pyrogenic species promote and are able to support the
spread of fire through the community. Without fire, pyrogenic communities become
invaded with fire sensitive species reducing the communities’ flammability. Fire
sensitive species affect the way fire spreads through this community. These species
don’t facilitate fire as well as pyrogenic communities and may promote dangerous fire
behavior if fuel loads are high.
Measuring Fire Severity
Fire severity is a measure of ecological and physical change attributed to fire
(Agee 1993; Hardy 2005). Severity is influenced by weather, moisture, time of day,
sunlight incidence, slope (Oliveras et al. 2009), species, tree size, succession stage,
and pathogens (Cocke et al. 2005). Landscape variability and differences in micro-
climate contribute to heterogeneous burn patterns and hence patchy severity (Cocke et
al. 2005). Major variations in severity are also associated with the location of the fire
perimeter (Oliveras et al. 2009). Head fires burn with greater flame lengths and
intensity than backing fires. As a result, we would expect to see greater severity in
areas burned by a head fires than in areas burned by backing fires.
Severity levels are characterized by the amount of fuel consumed, fire effects on
residual vegetation, mortality, and changes in moisture levels. Low severity burns are
characterized by lightly burned areas where only fine fuels are consumed with minor
scorching of trees in the understory (Wagtendonk et al. 2004). Areas of moderate

28
severity retain some fuels on the forest floor and have crown scorching in mid-large
trees with mortality of small trees (Wagtendonk et al. 2004). High severity zones have a
high degree of combustion of litter, duff and small logs, mortality of small-med trees,
and consumption of large tree crown foliage (Wagtendonk et al. 2004).
The same fire behavior can result in very different severity effects in over- and
understory vegetation (Wagtendonk et al. 2004). Large, high severity fires have the
potential to remove existing plant biomass, providing ideal habitat for exotic species
(Kuezi et al. 2008). Responses in soil condition can range from affirmative nutrient
availability to loss of nutrients, soil micro-organisms, and changes in physical structure
of the soil (Busse et al. 2005). The degree of canopy degeneration due to cambium and
crown scorch can severely impact the ability to re-sprout or seed. Plant recovery
following a severe fire can prove nearly impossible for remnant vegetation (White et
al.1996). Therefore, severity is important to monitor as its effects on exotic species
establishment, soil responses, and regeneration can be significant.
To identify the effects of fire, remote sensing techniques can be utilized to model
changes that are due to fire. Techniques have been developed to measure the amount
of change to a system caused by fire. Normalized Burn Ratios (NBR) were designed to
enhance the response of Landsat Thematic Mapper (TM) bands 4 and 7 to fire
(Wagtendonk et al. 2004)(1). Multi-temporal image differencing is then employed to
enhance contrast and detection of changes from pre- and post-fire images
(Wagtendonk et al. 2004).

29
1
2 Differenced Normalized Burn Ratios determine the level of severity a 30 meter by
30 meter unit of landscape experienced due to a fire event by measuring the amount of
change between a pre and post fire image (2). Employed as a radiometric index,
dNBRs are directly related to burn severity (Cocke et al. 2005; Hoy et al. 2008; Godwin
2008; Allen et al. 2008, Wagtendonk et al. 2004). Fires within the resolution range of
the satellite sensor, 30 meter, can be detected (White et al.1996).
Previous studies have used dNBRs to identify and monitor the effects of fire.
Studies have used dNBRs to calibrate severity levels to specific forest types (Cocke et
al. 2005; Hoy et al. 2008; Godwin 2008; Allen et al. 2008), compare severity levels
between fire events (Collins et al. 2009; Allen et al. 2008;), interpret the effects of fuel
management techniques on severity levels (Safford et al. 2009; Finney et al. 2005;
Safford et al. 2009; Wimberly et al. 2009), and to monitor changes in vegetation over
time (White 1996; Kuenzi et al. 2008) and topographical variations (Holden 2009;
Oliveras et al. 2009; Duffy et al. 2007). There have also been efforts to relate remotely
sensed severity to biophysical attributes and processes. Boer et al. (2008) used dNBRs
to define severity as a change in leaf area index (LAI) in a pre and post fire image.
Currently, there is a multi agency project, Monitoring Trends in Burn Severity (MTBS),
using dNBRs to map burn severity and the perimeters of large wildfires for the entire
United States. MTBS is using data from 1984-2010 to identify national trends in burn
severity to determine the effectiveness of the National Fire Plan and Healthy Forest
Restoration Act. Duffy et al. (2007) analyzed the relationship between the area burned

30
by wildfire and remotely sensed severity level. This study used NBRs for 24 wildfires in
Alaska. The study found that the average burn severity increased with the natural
logarithm of the area of the wildfire. Larger fires were more likely to contain areas that
were more severely burned than smaller fires. Epting et al. (2005) evaluated the
usefulness of 13 remotely sensed indices of burn severity to find that NBR and dNBR
were the most accurate (Escuin et al. 2009), exhibiting high accuracy when compared
with field based severity indices in forested areas. To our knowledge, no other study
has used dNBRs to model how fire severity from previous fire affects subsequent fire
over time. The Osceola National Forest in North Florida presents a unique opportunity
to conduct such an analysis. Landsat imagery enables an investigation into the
effectiveness of the Osceola’s prescribed burning program for reducing wildfire severity,
and lends insight into the complex interplay between fire severity, fuels recovery rates,
time between fires, and subsequent fire severity.
Detecting burn severity for fires on the Osceola National Forest is in efforts to
anticipate the short and long term effects of severity level and the effects of time
intervals between fire events, and to predict areas of potential high severity. The burn
severity analysis will further improve our understanding of why and where fires burn
severely. The following questions fuel this investigation:
1. How does past fire size and severity level affect subsequent fire behavior?
2. Is there a relationship between the size of fires and the proportion of area burned at high severity?
We hypothesize that fires with a high severity level will have a negative effect on
the severity level of fires occurring within three years. High severity fires are expected to
have a lower severity level in subsequent fires as long as the second fire is within three

31
years. Vegetation recovery is not expected to reach pre-fire conditions within this time
frame. We also hypothesize that larger fires will have a higher probability of
experiencing high severity.
Study Site
On the Osceola National Forest, thousands of acres are burned every year to
reduce fuel levels and manipulate succession stages. The Osceola is Located in north
central Florida (Latitude: 30.34371, Longitude: -82.47322) 40 miles outside the city of
Jacksonville. The Osceola consist of pine flatwoods with an overstory of pines on low,
flat, sandy, acidic soils; pine flatwoods have an understory of herbaceous plants,
grasses, palmetto, and woody species. This community is fire dependent and requires
regular burning for ecosystem health. The main communities found within flatwoods on
the Osceola are longleaf pine (Pinus palustris) -wiregrass (Aristida beyrichiana) and
slash pine (Pinus elliotti) -gallberry (Illex glabra) -saw palmetto (Serenoa repens). Fire
management on the Osceola and much of Florida is largely dictated by urban
encroachment, forest fragmentation, and the challenges associated with smoke
management (Wolcott et al. 2007; Duncan et al. 2004). These anthropogenic
influences have reduced fire sizes and recurrence, increasing fuel connectivity and load
(Duncan et al. 2004).
Prescribed burns are implemented under conditions that are suitable for
vegetation consumption, yet not at levels to cause fire to become unmanageable.
Favorable conditions are characterized by cool weather, consistent winds, dry litter, and
wet soil (Davis et al. 1963). Prescribed fires are performed under conditions that
promote low severity fire though variability in the landscape and weather conditions can
cause higher severity levels. Hydric areas burn lightly if at all during prescribed burns.

32
Understory fuel is partially consumed with little consumption of the duff layer (Outcalt et
al. 2004). Therefore, wet areas generally carry very heavy fuel volumes and during
extended drought periods, these areas dry up making them capable of very large, very
intense wildfires (Davis et al. 1963; Maliakal et al. 2000). The season of prescribed fire
is determined by management objectives and site characteristics. Flatwoods are
generally burned either during winter (dormant season) or early summer (growing
season).
Methods
Data
DNBRs were developed for each fire event greater than 1ac on the Osceola
National Forest. Severity levels were defined based on general severity classes
provided by the United States Geological Survey (USGS). Severity classes were
reclassified and merged into 4 main levels; unburned cells, low severity cells, moderate
severity, and high severity (Table 2-1). To test the hypotheses, two datasets were
developed, a time and fire size dataset. The time analysis dataset consisted of
consecutive fire events (prescribed and wildfire), that were then separated into time
intervals to indicate the time between fire events. To control for the number of times a
pixel burned between fire events, pixels had to be unburned previous to the first fire and
remain unburned until the second fire. For each pixel the following information was
included in the data set: severity level of fire event 1, severity level of fire event 2,
community type (hydric or mesic), forest type (pine, hardwood, and pine/hardwood), and
Palmer drought severity index (PDSI) for the year before each event and the year of
each event.

33
PDSI, developed in the 1965 by Wayne Palmer, is the most effective way of
determining long-term drought (NOAA 2009). This method compares weather
conditions to determine if they are abnormally dry or abnormally wet compared to
historical weather data. The palmer index is based on the supply-and-demand concept
of the water balance equation, taking into account more than just the precipitation deficit
at specific locations. The index uses temperature, rain fall information, and the local
available water content of the soil to determine dryness that is standardized to local
climate. Standardization allows the index to be compared against different locations
and time periods. PDSI uses 0 as normal and negative numbers (-1 to -6) to indicate
drought (Table 2-2). Moderate drought is a -2, severe -3, and extreme drought is -4. To
reflect excess rain the index uses positive numbers. A major advantage of this index is
that it is standardized to local climate and can be applied to any part of the United
States.
The fire size dataset was comprised of the 115 wildfires that occurred and were
recorded on the Osceola National Forest from 1998-2008. Fires had to be at least 1
acre to be included in the dataset. For each fire the portion of cells burned in each
severity class, the size in acres, season of fire, Forest Service forest type classification
(Figure 2-1), soil drainage class (Figure 2-2), and PDSI values for the year of and
before the fire event were recorded.
Model Development
Logistic regression techniques were utilized to model the probability of
experiencing a high severity fire (model 1), the probability of increasing in severity level
(model 2), the probability of burning (model 3), and the probability of decreasing in
severity (model 4) for the time dataset. Logistic regression can be used to measure

34
binary responses by describing the relationship between one or more independent
variables and the binary response.
3
Responses are coded as [0, 1] to [- , ] and is a realization of a random variable
that can take on the values of 0 and 1 with probabilities and 1- (3). The
distribution of is a Bernoulli distribution with the mean (4) and variance (5)
depending on the underlying probability
4
5 To make the probability a linear function of a vector of observed covariates
the probability is transformed to remove the range restrictions (6).
6
Logits map probabilities from [0, 1] to [- , ]. Negative logits represent probabilities
below ½ and positive logits represent probabilities above ½. Solving for the probability
of success requires exponentiating the logit and calculating the odds of success (7).
7
Maximum likelihood methods were used for parameter estimation. With this
approach, parameters are estimated iteratively until parameters that maximize the log of

35
the likelihood are obtained. Goodness of fit statistics, Akaike’s information criterion
(AIC) and Bayesian information criterion (BIC), were used to compare competing
models. AIC is a statistic that is used to rank different models based on how close fitted
values are to true values (8) (Littell et al. 2006).
8
Where: k is the number of parameters in the statistical model and L is the maximized
value of the likelihood function for the estimated model (8). Like AIC, BIC was used to
rank models with a different numbers of parameters to avoid increasing the likelihood by
over-fitting the model (Littell et al. 2006).
9
Where: n is the sample size. Unexplained variation in the dependent variable and the
number of covariates increases the BIC and AIC values (9). For both AIC and BIC, the
lowest score indicates the best model.
The ratio of the Pearson chi-square to its degrees of freedom is used to
determine if the model displays lack of fit. Values closer to 1 indicate that the model fits
the data well (Littell et al. 2006). To address the assumption of independence among
observations, a generalized linear mixed model was used using the SAS procedure
PROC GLIMMIX. Correlation among responses is incorporated into the model by
adding random components to the linear predictor. To account for the correlation
among responses, random residuals were modeled.
Raster data is spatially correlated due to the adjacency of pixels. Although it
would have been more effective to model the spatial correlation directly, without the aid

36
of a super computer this option is infeasible. The GLIMMIX procedure can also make
use of several predictor variables that may be either numerical or categorical (Littell et
al. 2006).
In this analysis we evaluated the probability of experiencing (1) moderate to high
severity, (2) increased severity level, (3) burning, and (4) decreased severity between
the first fire and the second fire at different time intervals. Variables used in the 4
models include: the severity level of the first fire event (unburned, low severity,
moderate severity, and high severity), the time interval between fires (1-2, 3-4, 5-6, 7-8
and 9-10 years) (Table 2-3), the type of fire in the second fire event (wild or prescribed),
and the PDSI for the year before and the year of each fire. The logit of the probability
was modeled as
10
where: is the intercept, (for =1, 2, 3, 4) is the net effect of the ith severity level for
the first fire, (for j = 1, 2, 3, 4, 5) is the net effect of the jth time intervals between fire
events, (for k= 1,2 ) is the effect of the type of fire, is the effect of PDSI for the year
prior to fire 1, is the PDSI for the year of fire 1, is the PDSI for the year before fire
2, is the PDSI for the year of fire 2 and ijk is the random error (10). Final model
covariates were indicated by parameters that were significant based on the Wald chi-
square statistic and the model with the lowest AIC and BIC value. Interactions between
all parameters were also considered. Non- significant parameters were removed from
the full model one at a time. To test for differences among categorical levels, least
square means were produced and differences were tested.
37
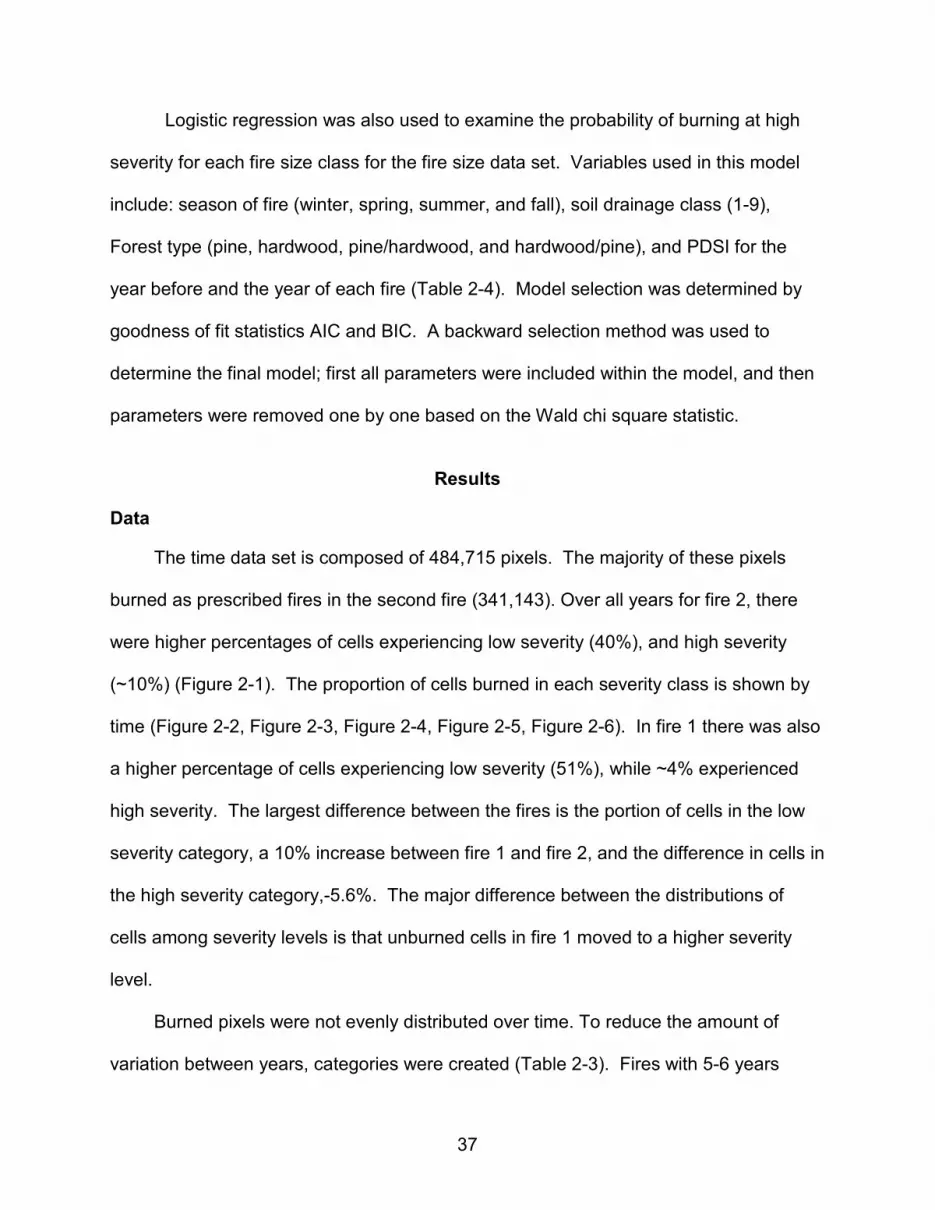
Logistic regression was also used to examine the probability of burning at high
severity for each fire size class for the fire size data set. Variables used in this model
include: season of fire (winter, spring, summer, and fall), soil drainage class (1-9),
Forest type (pine, hardwood, pine/hardwood, and hardwood/pine), and PDSI for the
year before and the year of each fire (Table 2-4). Model selection was determined by
goodness of fit statistics AIC and BIC. A backward selection method was used to
determine the final model; first all parameters were included within the model, and then
parameters were removed one by one based on the Wald chi square statistic.
Results
Data
The time data set is composed of 484,715 pixels. The majority of these pixels
burned as prescribed fires in the second fire (341,143). Over all years for fire 2, there
were higher percentages of cells experiencing low severity (40%), and high severity
(~10%) (Figure 2-1). The proportion of cells burned in each severity class is shown by
time (Figure 2-2, Figure 2-3, Figure 2-4, Figure 2-5, Figure 2-6). In fire 1 there was also
a higher percentage of cells experiencing low severity (51%), while ~4% experienced
high severity. The largest difference between the fires is the portion of cells in the low
severity category, a 10% increase between fire 1 and fire 2, and the difference in cells in
the high severity category,-5.6%. The major difference between the distributions of
cells among severity levels is that unburned cells in fire 1 moved to a higher severity
level.
Burned pixels were not evenly distributed over time. To reduce the amount of
variation between years, categories were created (Table 2-3). Fires with 5-6 years

38
between events had the highest percentage of cells that burned at high severity in the
second fire, with 53% for wild fires and 24.9% for prescribed fires burning at high
severity (Figure 2-4). Time interval 3-4 years and 7-8 years had the highest portion of
cells remaining unburned in the second fire event; ~70.8% and 49.4% remained
unburned 3-4 years and 7-8 years after wildfire, respectively 51.4% and 81.6%
remained unburned 3-4 years and 7-8 years after prescribed fires, respectively (Figure
2-3, Figure 2-5). In the second fire, wildfires had a much larger portion of the cells in
the unburned and high severity category, 44% and 17%, respectively, versus prescribed
fires. Overall, there was very little change in the proportion of pixels burned in each
severity class between fire 1 and fire 2 ignoring time between events. Until time
between fires reaches 5-6 years, prescribed fires decease in severity in the second fire
more than they increase in severity. After 5-6 years more cells increased in severity
than cells decreased in severity. Wildfires had a higher portion of the pixels decrease in
severity over all time intervals except time interval 5-6 years where 77% of the cells
increased in severity between the first and second fire.
Probability Modeling
Probability of experiencing moderate to high severity during a fire
Severity level ( ) at the first fire, time intervals between the first and second fire ( ),
type of fire ( ), and the interaction between severity level and time interval , were
significant predictors of the probability of experiencing high severity fire (11).
11

39
The effects of PDSI were not significant parameters. The overall model was significant
and the parameters were significant based on the Wald chi-square statistic (Table 2-5).
Moderate and high severity levels were merged for this analysis to avoid convergence
issues associated with low counts in the high severity category. The ratio of the
Pearson chi-square statistic to its degrees of freedom is approximately 1 indicating good
fit of the model to the data.
The probability of experiencing a moderate to high severity fire was higher for
wildfires than prescribed fires. Overall, the probability of burning at a moderate to high
severity class was low for all severity classes in fire 1 for prescribed fires (Figure 2-9).
The probability of moderate to high severity was high for wildfires when the time interval
was 5-6 years between fires (Figure 2-10). Areas with moderate and high severity in
the first fire had the highest probability of high severity fire for both wild and prescribed
fires (Figure 2-10, Figure 2-9). At 1-2 years between fire events, the probability of
moderate to high severity fire was the lowest (Figure 2-9). The highest probability by
time interval was at 5-6 years between fires, followed by 7-8, then 9-10 years. For
wildfires, 3-4 and 7-10 years between events yielded very low (<1%) probability of
moderate to high severity (Figure 2-10). Time interval 5-6 years had very high (>70%)
probabilities of moderate to high severity for wildfire (Figure 2-10).
Probability of increasing in severity in subsequent fires
Model 2 estimates the probability of severity level increasing from the first fire to the
second fire.
12

40
The model includes the effects of severity level at fire 1 ( ), time interval between fire
events ( ), fire type ( ), and PDSI value for the year prior to and the year of each fire
( , , , and ) for the kth measurement in the ith severity level and the jth time
interval (12). The overall model was significant and the 8 parameters were significant
based on their Wald chi-square statistics (Table 2-6). The ratio of the Pearson chi-
square statistic to its degrees of freedom was close to 1(0.99), indicating good model fit
to the data.
The probability of increasing in severity was modeled for all events where fire
could increase (where the severity level in fire 1 was less than 4). As expected, the
model shows that the probability of increasing in severity was highest for unburned
cells, then low severity pixels and lowest for medium severity over all time intervals
(Figure 2-11,Figure 2-12, Figure 2-13). For all severity levels the probability of
increasing in severity was highest at 5-6 and 9-10 years between fire events (Figure 2-
12, Figure 2-13). The probability of increasing in severity level was higher for wildfires
than for prescribed fires and showed the same decreasing trend with increased severity
both fire types. Time Interval 7-8 years was surprisingly low for both wild and
prescribed fires.
Probability of burning during a fire
Model 3 examines the probability of burning (13).
13 The severity level of fire 1( ), time interval ( ), fire type, and PDSI for the year prior to
fire 1 and 2 and the PDSI for the year of fire 1 ( , , and respectively) were all

41
included within the final model(13). The model was significant and all parameters were
significant based on their Wald chi-square statistics (Table 2-7). The ratio of the
Pearson chi-square statistic to its degrees of freedom was close to 1(1.02) indicating
good fit of the model to the data.
The probability of burning was approximately the same for each severity class
(Figure 2-15, Figure 2-16). Areas that had been burned by prescribed fires had a higher
probability of burning than areas that had been burned by wildfires for all time intervals
and severity levels (Figure 2-15). Over time, the probability of burning peaked (~80-
90% depending on severity level) at 5-6 years and, was the lowest for 1-2 and 7-8 years
between fires.
Probability of decreasing in severity in subsequent fires
Model 4 predicts the probability of fire severity decreasing in the second fire (14).
14
The severity level of the first fire ( ), time interval between fire1 and fire 2 ( ), fire
type ( ), PDSI value for the year prior to and the year of both fire 1 and fire 2 ( , , ,
and ), and the interaction between severity level and fire type were kept in the final
model (14). The model was significant and the parameters were significant based on
their Wald chi-square statistic (Table 2-8). The ratio of the Pearson chi-square statistic
to its degrees of freedom was close to 1(1.03) indicating good model fit.
The probability of decreasing fire severity was modeled for all severity classes
except unburned. Over all time intervals and severity levels, the probability of
decreasing was lower for wildfires than for prescribed fires except at the low severity

42
level (Figure 2-17). At the low severity level, the probability of fire severity level
decreasing for wildfires was the lowest and the probability increased with increased
severity level. Both wild and prescribed fires show a reduced probability of decreasing
fire severity level when fires were 5-6 years apart. The probability of decreasing fire
severity level increased as the severity level increased for both fire types (Figure 2-18,
Figure 2-19).
Fire size analysis
A useful model could not be found for the probability of burning at high severity
using the fire size dataset. Fire size class was not a significant indicator of the
probability of experiencing a high severity fire. The data indicated that larger fires had a
higher portion of their pixels in the high severity size class so it was expected that larger
fires would have a higher probability of experiencing high severity fire. The best model
of the probability of high severity fire based on goodness of fit statistics included only
fire size class yet the model yielded no significant relationship between fire size and the
probability of experiencing high severity. The model parameters were not significant
based on their Wald chi-square statistics (Table 2-9). The ratio of the Pearson chi-
square statistic to its degrees of freedom was equal to 1 indicating good model fit.
Discussion
Probability of Experiencing Moderate to High Severity During a Fire
The probability of experiencing high severity fire has important implications for fire
effects and the degree to which wildfires are being mitigated. Based on the severity
level of the first fire event and time between events, this also has the capacity to identify
target intervals between fires. The probability of experiencing moderate to high severity
in the second fire was highest for time interval 5-6 years for all severity levels of the first

43
fire and both fire types (Figure 2-10). This indicates that by this point, vegetation has
reached pre-fire conditions regardless of the severity level it burned at in the first fire.
Davis et al. (1963) collected ground data from 380 fires in Florida and Georgia from
1955 to 1958 to evaluate prescribe fire effectiveness in reducing fire size and intensity.
This analysis found that fuel loads must be less than 5 years to adequately reduce the
occurrence of catastrophic wildfire on the Osceola National Forest. Vegetation is able
to recover quickly due to fast growing and re-sprouting species further fueled by an
increase in nutrient availability as a result of fire. Lemon (1949) found that the
maximum amount of litter is approached at 5 years and, by 8 years vegetation returned
to pre-burn status. This study used permanent plots on the Alapaha Experimental
Range (Georgia) to monitor changes in vegetation following prescribed fire. At 1-2
years between fires, wildfires have a higher probability of moderate to high severity fire
compared to longer time intervals where the probability is nearly 0. Factors beyond the
length of time between fire events may be the cause for the relationship between short
time intervals and the probability of moderate to high severity for wildfires. Weather
conditions and errors associated with the amount of biomass present in the pre-fire
image may be affecting this. We would expect the probability of moderate to high
severity fire to increase as the time interval increased yet, the lack of an increase over
time suggests that vegetation that isn’t burning as often on the Osceola National Forest
remains unburned (Maliakal et al. 2000). This may be explained by the change in
flammability associated with natural succession in the pine flatwoods forest type. In
long-unburned stands, vegetation composition is shifting away from flammable saw
palmetto /gallberry complex with pine overstory towards less flammable, higher

44
moisture-content, hardwood dominance. Previously unburned cells likely remained
unburned in subsequent fires due to fuel that was not available to burn and a
combination of weather conditions.
As expected, the probability of high severity fire is higher for wildfires than for
prescribed fires. Prescribed fires are performed under optimal conditions where the
chance of mortality of fire-adapted species such as longleaf and slash pine, saw
palmetto and gallberry, is small. In contrast, most wildfires greater than 1 ac in size
occurred during optimal fire spread conditions, with high winds, lower relative
humidities, and dry fuels. Regardless of the severity class of the first fire, the probability
of moderate to high severity in the second fire was low for prescribed fires (<30%). This
suggests one of two things: either that regardless of the severity of the prescribed burn,
it is mitigating severity in subsequent fires; or the areas that are prescribed burned are
repeatedly prescribed burned, so that the second fire is typically of lower severity.
The moderate and high severity class had the highest probability of moderate to
high severity for both fire types (prescribed and wildfires). Within this dataset, areas
that have a history of burning at a moderate to high severity often continue the trend
regardless of the amount of time since the last fire event or the type of fire. This can be
due to a number of effects such as the type of fuel at the site, delayed mortality inflating
the severity signal over time, or the continued burning resulting in reduced vegetation
vigor, which appears via the dNBR analysis to be higher severity. This may then result
in a bias in the high severity class towards areas with less vegetation and ground fuels.
The reduction in fuel may promote more complete consumption resulting in an increase
in severity.

45
Variations in the landscape may also be a major cause for unexpected
relationships regarding time intervals between fire events. In hydric areas, if fuel
availability is reduced due to high moisture contents, distortions in the relationship
between time interval between fires and the probability of moderate to high severity may
occur. Even though these areas burned lightly in previous fires and time intervals were
long, the probability of moderate to high severity fire was still low. Variations in the
landscape adds additional variation to fire effects, prescribed fire planning, and fire
suppression efforts. In the future, adding depth to water table, dominant understory
vegetation, and dominant overstory vegetation may help to sort out unexpected
relationships between fire effects and time.
Probability of Increasing in Severity
The model predicting the probability of fires increasing in severity gave similar
results to the previous model (probability of experiencing high severity) for both fire
types. The probability of increasing in severity was higher for wildfire than for prescribed
fire. As expected, the probability of increasing in severity was the highest for unburned
cells and increased as the time interval increased (Figure 2-12) for all time intervals
except 3-4 and 7-8 years where the probability of increasing was close to 0. Most
prescribed fires on the Osceola are maintained at a 3-4year cycle. Therefore, most fires
that occur at this time interval were prescribed fires. Fires occurring with 7-8 years
between events consistently had a lower than expected probability of having higher
severity over all severity levels. Vegetation that has remained unburned for 7-8 years,
in this dataset, may not be available to burn as readily as vegetation with time between
events <6 years due to fuel moisture content and changes in species composition.

46
Without fire, fire-adapted species are replaced by broadleaf woody species that don’t
facilitate the spread of fire as well as fire adapted species.
The time interval 5-6 years was identified once again, this time as being
associated with the highest probability of increasing fire severity, followed very closely
by 9-10 years. This time interval (5-6 years) may be the point at which vegetation has
recovered from previous fire events to a degree where the next fire event has enough
fuel available to burn and at increased severity levels. Lavoie et al. (2010) found that
living biomass recovered within 3 years of a fire event and predicted that fuel loads
would return to pre-fire conditions by 5-8 years in a similar pine flatwoods forest also in
North Florida. This suggest that time between fire events should not exceed 4 years.
Land managers should consider fire return intervals that are between 1-4 years in pine
flatwoods to mitigate moderate to high severity fire and increasing severity levels in
subsequent fires.
Probability of Burning
The probability of burning followed the same trend for each severity class and was
highest for the time interval 5-6 years for both wild and prescribed fires. The probability
of burning was low when fires were 1-2 years apart and increased with time interval.
Short time intervals between fires affect the way fire spreads due to the lack of
continuous combustible material to maintain fire spread. Once again 7-8 years between
fires had a lower probability of burning than expected indicating vegetation that had
been burning at this interval has reduced availability. The probability of burning was
higher for prescribed fires than for wildfires. Prescribed fires are performed under
conditions and in areas that facilitate understory vegetation and litter consumption

47
whereas wildfires often result in incomplete patchy burning of the under and over story
species due to rapid changes in climatic conditions and vegetation availability.
Probability of Decreasing in Severity
As severity levels increased, the probability of subsequent fires decreasing in
severity level increased. At all severity levels the probability of decreasing in severity
was lowest for fires occurring 5-6 years apart followed by 9-10 years apart. By 5-6 years
between fires we would expect fuel levels to recover to a point where wildfire risk is high
and past fires no longer have an effect on subsequent fires. This model supports the
hypothesis that fires with moderate to high severity levels have a negative effect on
severity level of fires occurring within 3 years. Land managers should consider 1-4 year
fire frequencies for pine flatwoods to reduce the risk of moderate to high severity
prescribed and wildfires. This evidence strongly suggests that beyond a five year
interval, severity will be higher than what the majority of management objectives seek.
Areas previously burned by low severity fire had a high probability of remaining
unburned in the next fire event if they were burned in a wildfire. This relationship
indicates that during a wildfire, land that previously burned at a low severity level may
have had vegetation that was unavailable to burn during the subsequent fire. Because
the land previously burned at a low severity level, there should be enough vegetation
there to carry higher severity fires should conditions be suitable. For moderate and high
severity levels first fires, the probability of decreasing severity was higher for prescribed
fires. So, areas that previously burned at moderate and high severity levels had a
higher probability of decreasing in severity level if they were prescribed burned.

48
Conclusion
Fire history for the Osceola National Forest was effectively modeled to determine
past trends in fire effects and future implications of fire management decisions. The
models also provide valuable information regarding the influence of severity level and
time between events for both prescribed and wildfires. The data shows that vegetation
on this forest recovers quickly following fire and that fuel loads reach levels where they
are available to burn within 1 year and are at pre-fire conditions by 5 years. The data
also identifies areas that are within fire perimeters and are consistently remaining
unburned. Likely hydric communities, land that has gone unburned for 7-8 years
showed signs that the fuel just wasn’t available to carry high severity fire from 1998-
2008. Hydric communities may require extreme drought condition to reduce moisture
levels.
All four models identified the time interval 5-6 years as a point where the effects of
previous fires had little to no effect on subsequent fires. At this point, the probability of
high severity fire, increasing severity level in subsequent fire, and the likelihood of
burning at all is highest. This is also a point where the probability of decreasing severity
in subsequent fires was lowest. These findings indicate that time between fires should
be kept below 5 years. Results from this work are supported by other studies
suggesting that the use of remote sensing techniques sufficiently represent
relationships between time since last fire and the severity level of past fire events on
subsequent fire behavior.
The relationship involving time between fire events and fire severity are influenced
by variations in the landscape. Fire effects are influenced by the type of vegetation and
the availability of that vegetation. Land managers must consider vegetation recovery

49
and availability differences by both forest and community types to determine the risk of
the high severity fire. Although hydric communities are often unavailable to burn, fuel
loads in these communities are high and must be managed. Land managers may
consider other alternatives to mitigate high fuel loads in hydric communities.
Although previous studies have found a relationship between fire size and high
severity (Duffy et al 2007) a useful model could not be found for the probability of high
severity fire using the fire size dataset. The data indicated that larger fires had a higher
portion of area in the high severity size class yet this relationship was not significant.
Out of 115 wildfires included within this dataset, few fires were large. Most fires were
less than 50 ac in size (93 fires). Although large fires had a higher portion of their cells
in high the high severity class, the vast majority of the area was burned by moderate
and low severity fire. A larger dataset may be required to capture the relationship
between fire size and high severity.
Errors introduced by severity level classification may also influence the models.
General severity level classifications were used and further generalized from seven
levels to four. In the future, severity levels should be calibrated to pine flatwood forest
of the southeastern U.S for the best results. Also, delineation of fire perimeters is not
exact and may introduce error into the unburned and low severity levels.

50
Table 2-1. Severity class descriptions for the time analysis and fire size datasets. Severity Class Description Reclassified Severity Classes
1 Unburned within a fire perimeter (DNBR -100 - 99)
1 Unburned within a fire perimeter
(DNBR 100 - 99) 3 Enhanced Regrowth/Low
Severity (DNBR -500 - -101, 100 - 269)
2 Low Severity
(DNBR -500 - -101, 100 - 269) 4 Low-Med Severity
(DNBR 270 - 439) 3
Med Severity (DNBR 270 - 439)
5 Med-High Severity (DNBR 440 - 659)
4 High Severity
(DNBR 440 - 1300) 6 High Severity (DNBR 660 - 1300)
Table 2-2. Palmer Drought Severity Index values and descriptions
Palmer Drought Severity Index 4.0 or more exceptionally wet 3.0 to 3.99 very wet 2.0 to 2.99 moderately wet 1.0 to 1.99 slightly wet 0.5 to 0.99 incipient wet spell
0.49 to -0.49 near normal -0.5 to -0.99 incipient dry spell -1.0 to -1.99 mild drought -2.0 to -2.99 moderate drought -3.0 to -3.99 severe drought -4.0 or less extreme drought
Table 2-3. Time interval classification for time analysis dataset. Time Interval (years) Code Observations
1-2 1 115,273
3-4 2 136,254
5-6 3 131,409
7-8 4 79,886
9-10 5 21,893

51
Table 2-4. Covariate classifications for fire size model. Variable Class Code
Fire Size Class 1-15ac 1 16-50ac 2 50- 150ac 3 150-500ac 4 >500ac 5
Season Spring 1 Summer 2 Fall 3 Winter 4
Forest Type Pine 1 Hardwood 2 Pine Hardwood 3 Hardwood Pine 4
Soil Drainage
Somewhat poorly drained 1
Somewhat- poorly drained 2 Somewhat-very poorly drained 3 Poorly Drained 4 Poorly- very poorly drained 5 very poorly drained 6 standing water- poorly drained 7

52
Table 2-5. Parameter estimates and their respective standard errors and p-values for the model predicting the probability of high severity fire.
Parameter Categories Estimate Std. Error P-value Intercept -3.8923 0.06453 <0.0001 Severity of fire 1 Unburned -0.1251 0.01703 <0.0001 Low -0.4520 0.01716 <0.0001 Med-High 0 . . Time between fires 1-2 years -1.7801 0.1018 <0.0001 3-4 years -0.5907 0.07174 <0.0001 5-6 years 3.0129 0.06509 <0.0001 7-8 years
9-10 years 1.4293 0
0.06713 .
<0.0001 .
Type of fire Wildfires -3.0456 0.5039 <0.0001 Prescribed Fires 0 . .
Time between fires* Type of Fire
1-2 years- Wildfire 6.6121 0.5102 0.0034 1-2 years- Prescribed 0 . . 3-4 years- Wildfire 2.2647 0.5190 <0.0001 3-4 years- Prescribed 0 . . 5-6 years- Wildfire 4.3310 0.5040 <0.0001 5-6 years- Prescribed 0 . .
7-8 years- Wildfire 0.2111 0.5137 0.6812 7-8 years- Prescribed 0 . . 9-10 years- Wildfire 0 . 9-10 years-
Prescribed 0 .
Residual 0.9981 . .

53
Table 2-6. Parameter estimates and their respective standard errors and p-values for the model predicting the probability of increased severity in the second fire.
Parameter Categories Estimate Std. Error P-value Intercept -1.3176 0.02894 <0.0001 Severity of fire 1 Unburned 3.2190 0.01976 <0.0001
Low 0.9239 0.01917 <0.0001 Med 0 . . Time between fires 1-2 years -1.9621 0.02665 <0.0001 3-4 years -1.1353 0.01973 <0.0001 5-6 years -0.1612 0.02780 <0.0001 7-8 years
9-10 years -1.8658 0
0.02556 .
<0.0001 .
Type of Fire Wildfires 0.1889 0.009466 <0.0001 Prescribed Fires 0 . .
PDSI (year before Fire 1) -0.04698 0.007130 <0.0001 PDSI (year of Fire 1) 0.09065 0.005490 <0.0001 PDSI (year before Fire 2) 0.4761 0.005154 <0.0001 Residual 0.9879 . .

54
Table 2-7. Parameter estimates and their respective standard errors and p-values for the model predicting the probability of burning.
Parameter Categories Estimate Std. Error P-value Intercept 2.2829 0.02519 <0.0001 Severity of fire 1 Unburned -0.8139 0.01715 <0.0001
Low -0.6254 0.01654 <0.0001 Med -0.5244 0.01985 <0.0001 High 0 . .
Time between fires 1-2 years -0.8888 0.01790 <0.0001 3-4 years -0.8372 0.01525 <0.0001 5-6 years 0.6326 0.02318 <0.0001 7-8 years
9-10 years -1.0399 0
0.01969 .
<0.0001 .
Type of Fire Wildfires -0.4576 0.007613 <0.0001 Prescribed fires 0 . .
PDSI (year before Fire 1) -0.2168 0.005665 <0.0001 PDSI (year of Fire 1) 0.2542 0.004379 <0.0001 PDSI (year before Fire 2) 0.2874 0.003676 <0.0001 Residual 1.0249 . .
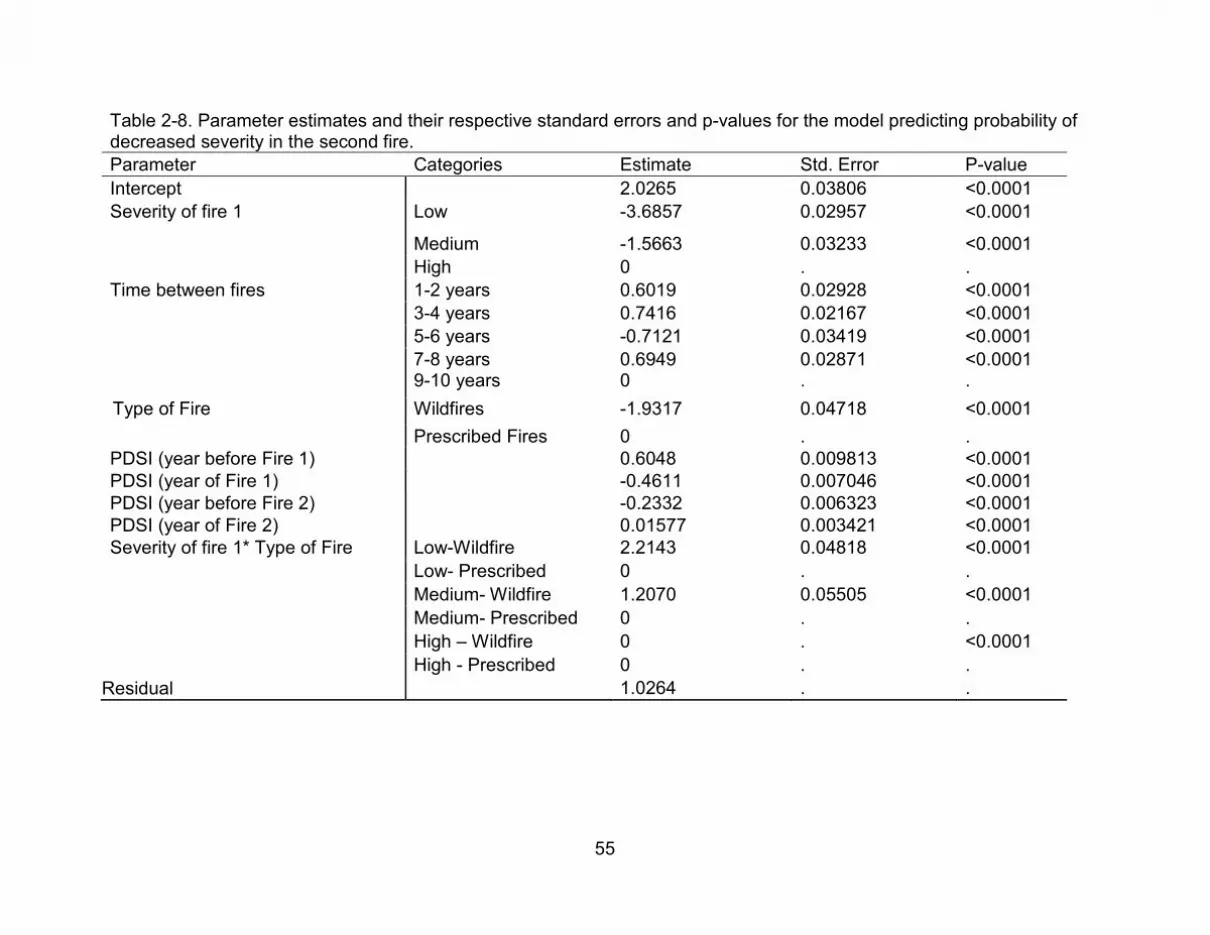
55
Table 2-8. Parameter estimates and their respective standard errors and p-values for the model predicting probability of decreased severity in the second fire. Parameter Categories Estimate Std. Error P-value Intercept 2.0265 0.03806 <0.0001 Severity of fire 1 Low -3.6857 0.02957 <0.0001
Medium -1.5663 0.03233 <0.0001 High 0 . . Time between fires 1-2 years 0.6019 0.02928 <0.0001 3-4 years 0.7416 0.02167 <0.0001 5-6 years -0.7121 0.03419 <0.0001 7-8 years
9-10 years 0.6949 0
0.02871 .
<0.0001 .
Type of Fire Wildfires -1.9317 0.04718 <0.0001 Prescribed Fires 0 . .
PDSI (year before Fire 1) 0.6048 0.009813 <0.0001 PDSI (year of Fire 1) -0.4611 0.007046 <0.0001 PDSI (year before Fire 2) -0.2332 0.006323 <0.0001 PDSI (year of Fire 2) 0.01577 0.003421 <0.0001 Severity of fire 1* Type of Fire Low-Wildfire 2.2143 0.04818 <0.0001
Low- Prescribed 0 . . Medium- Wildfire 1.2070 0.05505 <0.0001 Medium- Prescribed 0 . . High – Wildfire 0 . <0.0001 High - Prescribed 0 . .
Residual 1.0264 . .

56
Table 2-9. Parameter estimates and their respective standard errors and p-values for model predicting the probability of high severity fire by fire size class. Parameter Categories Estimate Std. Error P-value Intercept Fire size class
-1.9994 0.09005 <0.0001 1 -1.2949 2.8899 0.6550 2 -0.2208 1.2268 0.8575 3 -0.2040 1.2681 0.8725 4 -0.8258 0.4992 0.1009
5 0 . .

57
Figure 2-1. USFS forest type classifications.

58
Figure 2-2. NRCS soil drainage class classification.

59
Figure 2-1. Portion of pixels burned in each severity level in fire 1 and fire 2.

60
Figure 2-2. Distribution of pixels among severity classes with 1-2 years between fire events separated by type of fire and the probability of moving from one severity class to the next.

61
Figure 2-3. Distribution of pixels among severity classes with 3-4 years between fire events separated by type of fire and the probability of moving from one severity class to the next.

62
Figure 2-4. Distribution of pixels among severity classes with 5-6 years between fire events separated by type of fire and the probability of moving from one severity class to the next.

63
Figure 2-5. Distribution of pixels among severity classes with 7-8 years between fire events separated by type of fire and
the probability of moving from one severity class to the next.

64
Figure 2-6. Distribution of pixels among severity classes with 9-10 years between fire events separated by type of fire and
the probability of moving from one severity class to the next.

65
Figure 2-7. Percentage of pixels increasing and decreasing in severity level by time and type of fire.

66
Figure 2-3. Fire size compared with Palmer drought severity index between 1996 and 2010. This suggests large fire
events are associated with prolonged droughts.

67
Figure 2-4. Percentage of pixels burned at each severity class by fire size class. Larger fires have a higher portion of their
cells in the high severity class.

68
Figure 2-8. Probability of experiencing high severity in fire 2 by time interval and fire type.

69
Figure 2-9. Probability of experiencing high severity in fire 2 by severity level of fire 1 and time interval for prescribed fires.

70
Figure 2-10. Probability of experiencing high severity in fire 2 by severity level of fire 1 and time interval for wildfires.

71
Figure 2-11. Probability of increasing fire severity by time interval and fire type.

72
Figure 2-12. Probability of increasing fire severity by severity level of the last fire and time between fires for wildfires.

73
Figure 2-13. Probability of increasing fire severity by severity level of the last fire and time between fires for prescribed fires.

74
Figure 2-14. Probability of burning by time interval, fire type, and fire severity level.

75
Figure 2-15. Probability of burning by fire severity level and time interval for wildfires.

76
Figure 2-16. Probability of burning by fire severity level and time interval for prescribed fires.

77
Figure 2-17. Probability of decreasing in severity level by time interval and severity level of fire 1.

78
Figure 2-18. Probability of decreasing in severity by severity level of fire 1 and time interval for wildfires.

79
Figure 2-19. Probability of decreasing in severity by severity level of fire 1 and time interval for prescribed fires.

80
CHAPTER 3 PREDICTING FIRE SEVERITY IN PINE FLATWOODS USING DIFFERENCED
NORMALIZED BURN RATIOS TO RECORD FIRE EVENTS
Introduction
Fire severity can be measured using remote sensing techniques to monitor
changes in fire regimes over time and to map fire history. Fire severity is a measure of
ecological and physical change attributed to fire (Agee 1993; Hardy 2005) and is
influenced by both biotic and abiotic factors. Severity is altered by weather, moisture,
time of day, sunlight incidence (Oliveras et al. 2009), species, tree size, succession
stage, and pathogens (Cocke et al. 2005). Severity is important to monitor as it can
have a significant effect on exotic species establishment, soil responses, regeneration,
and ecosystem health.
Measuring Fire Severity
Normalized burn ratios (NBR) use short wave inferred bands, from Landsat
Thematic Mapper (TM) bands 4 and 7 (Wagtendonk et al. 2004), to detect the severity
level of a burned area (1). At this spectrum, differences in reflectance due to fire
induced changes in soil moisture, canopy cover, biomass, and soil chemical
composition is captured and compared to pre-fire conditions to determine the level of
change or severity that occurred as a result of the fire event.
1
Difference normalized burn ratios (dNBR) capture the degree of change that can be
attributed to fire by using a pre- and post- fire image (2).

81
2
The mapping methodology was originally developed and tested by the USGS
Northern Rocky Mountain Science Center (NRMSC). Employed as a radiometric index,
dNBRs are directly related to burn severity (Wagtendonk et al. 2004) and, as long as
the fire is within the resolution range of the satellite sensor, 30m, it is detectable (White
et al.1996). Combined with existing information about fire locations and perimeters, fire
histories can be mapped to monitor trends in severity over time, frequency of fire, and
time since last fire on a pixel level. This detailed dataset can then be used to make
inferences about future fires.
Using remote sensing data to determine specific and effective return intervals
can have serious implications for land managers. Currently land managers are using
indiscriminate frequencies that range anywhere from 1-10 years between fire events for
pine flatwoods management. Depending on site characteristics, frequencies may
require modification for more or less productive sites. With a detailed fire history, land
managers can identify areas that require immediate attention to both mitigate the risk of
wildfire and prevent successional change.
Previous studies have used dNBRs to calibrate severity levels to specific forest
types (Cocke et al. 2005; Hoy et al. 2008; Godwin 2008), compare severity levels
between fire events (Collins et al. 2009; Allen et al. 2008;), interpret the effects of fuel
management techniques on severity levels (Safford et al. 2009), and to monitor
changes in vegetation over time (White 1996; Kuenzi et al. 2008) and topographical
variations (Holden 2009; Oliveras et al. 2009). In the United States there is currently a
multi agency project, Monitoring Trends in Burn Severity (MTBS), which is using dNBRs
to map burn severity and the perimeters of large wildfires in the entire United States.

82
MTBS is using data from 1984–2010 to identify national trends in burn severity to
determine the effectiveness of the National Fire Plan and Healthy Forest Restoration
Act. As of now, no other study has used dNBRs to model the fire history of an entire
forest. This study uses all prescribed and documented wildfires (greater than 1 ac) to
create a complete fire history for the entire Osceola National Forest using dNBRs for
each fire event.
The objective of this analysis is to determine the risk of high severity prescribed
fire and the probability of moderate to high severity wildfires using data from 1998-2008.
The probability high severity prescribed fire is important for monitoring fire effects and
how these effects meet management objectives. Prescribed burns are implemented
under optimal circumstances where conditions are suitable for vegetation consumption
but not at levels to cause fire to become unmanageable and cause high mortality of
overstory species. Optimally, prescribed fires should cause low levels of mortality in
overstory species and understory fuel should be partially consumed with little
consumption of the duff layer (Outcalt et al. 2004). High severity fires are characterized
by complete combustion of most of the litter layer, duff and small logs, with mortality of
small-med trees, and consumption of large tree crowns (Wagtendonk et al. 2004).
During prescribed fires, land managers aim for low-moderate severity fire.
Considering wildfires, fire behavior that causes moderate to high severity levels
may cause extensive challenges in suppression efforts and high mortality rates.
Therefore, a model predicting the probability of moderate to high severity fire would
be appropriate as low severity wildfires would be preferred from a suppression and
salvage stand point. We hypothesize that the number of times a pixel burns will

83
influence its probability of burning, at high severity for prescribed fires and moderate-
high severity for wildfires, if burned within 5 years and we also expect mesic
communities to have a higher probability of burning at high severity than hydric
communities for prescribed fires and the opposite for wildfires.
Study Site
The Osceola National forest located in north central Florida (Latitude: 30.34371,
Longitude: -82.47322) about 40 miles west of the city of Jacksonville (Figure 1-1). The
majority of the forest is pine flatwoods with scattered areas of cypress and bay swamps.
With an overstory of pines on low, flat, sandy, acidic soils; pine flatwoods have an
understory of herbaceous plants, grasses, palmetto, and woody species. Flatwoods
communities are fire dependent and require regular burning for regeneration of fire-
adapted species and ecosystem health. On the Osceola National Forest, communities
include Longleaf pine (Pinus palustris) -wiregrass (Aristida beyrichiana), and slash pine
(Pinus elliotti) -gallberry (Illex glabra) -saw palmetto (Serenoa repens). Cypress ponds
(Taxodium spp) are found scattered throughout the forest in low lying wet areas. In this
fire maintained community the lack of fire for prolonged periods will increase broad leaf
woody vegetation and reduce herbaceous plant cover and eventually reduce pine
germination. Fire suppression would cause significant changes in species composition
that would then lead to changes in ecological processes within this system.
Fire management on the Osceola National forest is quite active. The majority of
the forest is prescribed burned at a frequency of every 2-5 years. There are also
sensitive areas within the forest that are not currently and actively managed by fire. Fire
regimes are determined on a compartment level based on the current forest type and
the desired future condition of the compartment. On this forest, fire managers are faced

84
with burning large acreages annually with few days that are within prescribed fire
weather conditions. Sensitive areas near the forest like Lake City Municipal Airport, I-
10, and the City of Jacksonville, provide addition constraints for fire managers.
Methods
Image Analysis
Landsat 7 ETM imagery was provided by the United States Geological Survey
(USGS). The USGS provided geometrically and radiometerically corrected NBRs.
Geometric corrections involved removing distortions from imagery caused by the sensor
geometry. The geocorrection process consisted of two steps: (1) rectification, and (2)
resampling. Geo-rectification was performed in order to relate pixels to their exact
ground location and resampling determined the pixel values. Radiometric corrections
involved the removal of atmospheric noise to accurately represent ground conditions. In
this process the pixel values were modified to account for noise produced by
atmospheric interference, sun-sensor geometry, and the sensor itself.
Following geometric and radiometric corrections, pixel values were in digital
numbers. Digital numbers are a measure of at-satellite radiance. Finally, digital
numbers are converted to at-satellite reflectance. NBRs were derived from a ratio of
bands 4 and 7 (1) that has been corrected to at-satellite reflectance and range from ~-
1000 to 1000. Pre-processed NBRs were provided by the USGS Global Visualization
Viewer (http://glovis.usgs.gov).
Data
A fire history dataset was created using the dNBRs for each fire event (prescribed
and wildfires). DNBRs were created for each event using images closest to the date of
the fire event. General severity levels provided by the United States Geological Survey
85
(USGS) were reclassified to 4 severity levels; unburned, low severity, moderate
severity, and high severity (Table 2-1). To account for variation due to phenology and
surface moisture conditions in the pre- and post- fire images, the mean value of
unchanged pixels were subtracted from the dNBR (Collins et al. 2009). DNBRs were
then clipped using fire perimeter shape files provided by the U.S. Forest Service. Next,
fires were merged to create an image that represented fire events for each year
(Appendix A, Table 3-1). The layers created for each year were finally used to calculate
model covariates. (1) Time since last fire is the number of years since last fire (Figure 3-
1). (2) Frequency is the number of times a pixel has burned within the dataset (Figure
3-2). (3) Latest severity level is the severity level of the last fire event (Figure 3-3).
These three layers were then compiled to create a fire history for each individual pixel.
Calculations were made using ArcGIS software.
Forest type and community type were obtained from the Florida Geographic Data
Library (http://www.fgdl.org/metadataexplorer/explorer.jsp). The forest type layer was
developed by the University of Florida Geoplan Center (Figure 3-4). Vegetative
communities were distinguished based on Davis (1967). Swamps, marshes and other
areas classified by the National Hydraulic Dataset as having standing water were
classified as hydric and the rest of the forest was classified as mesic based on soil and
forest types (Figure 3-5).
Model Development
Logistic regression was utilized to determine the probability of burning at a high
severity for prescribed fires and moderate-high severity for wild fires, on a pixel level, in
2008. Logistic regression is used to measure binary responses by describing the

86
relationship between one or more independent variables and the binary response (Littel
et al. 2006). Responses are coded as 0 or 1:
3
Where is a realization of a random variable that can take on the values of 0 and 1
with probabilities and 1- (3). The distribution of is a Bernoulli distribution with
the mean (4) and variance (5) depending on the underlying probability
4
5
To make the probability, , a linear function of a vector of observed covariates ( ) ,
the probability is transformed to remove range restrictions (6).
6
Logits map probabilities from range [0, 1] to [-
probabilities below ½ and positive logits represent probabilities above ½. Solving for
the probability of success requires exponentiating the logit and calculating the odds of
success (7).
7
Maximum likelihood methods were used for parameter estimation. With this
approach, parameters were estimated iteratively until parameters that maximized the

87
log of the likelihood were obtained. Goodness of fit statistics, Akaike’s information
criterion (AIC) and Bayesian information criterion (BIC), were used to compare
competing models. AIC is a statistic used for model selection that ranks different
models based on how close fitted values are to true values (8) (Littell et al. 2006).
8
Where: k is the number of parameters in the statistical model and L is the maximized
value of the likelihood function for the estimated model (8). Like AIC, BIC was used to
rank models with a different numbers of parameters to avoid increasing the likelihood by
over fitting the model (Littell et al. 2006).
9
Where: n is the sample size (9). Unexplained variation in the dependent variable and
the number of covariates increases the AIC and BIC values. For both AIC and BIC, the
lowest score indicates the best model.
The ratio of the Pearson chi-square to its degrees of freedom is used to
determine if the model displays lack of fit. Values closer to 1 indicate that the model fits
the data well (Littell et al. 2006). To address the assumption of independence among
observations, a generalized linear mixed model was used using the SAS procedure
PROC GLIMMIX (Littell et al. 2006). Correlation among responses is incorporated into
the model by adding random components to the linear predictor. To account for the
correlation among responses, random residuals were modeled. Raster data is spatially
correlated due the adjacency of pixels. Although it would have been more effective to
model the spatial correlation directly, without the aid of a super computer this option is

88
infeasible. The GLIMMIX procedure can also make use of several predictor variables
that may be either numerical or categorical.
In this analysis we evaluated the probability of experiencing high severity and
moderate to high severity based on the history of fire for prescribed and wild fires.
Covariates included frequency of fire, time since last fire, severity level of the latest fire
(categorical), forest type (categorical) and, community type (categorical) (Table 3-2).
Frequency of fire is the number of times a fire occurred within the data frame. Time
since last fire is the number of years that passed since the last fire event. The latest
severity level is the severity level of the last fire event. Forest types are classified as
pine flatwoods, longleaf pine / xeric oaks, fresh water marshes and swamp forest; and
community types are classified as hydric or mesic.
A backward selection method was used to determine the appropriate covariates
for the final model. The Wald chi-square statistic was used to identify significant
covariates. Final model selection was also determined based on significant parameters
and the model with the lowest AIC and BIC value. Interactions between all parameters
were also considered. Non-significant parameters were removed from the full model
one at a time. To test for differences among categorical levels least square means
were produced and differences were tested.
Data used to create the logistic model included the years 1998-2006 for prescribed
fires and 1998-2007 for wildfires. Fire history was developed for pixels using data up to
2005. This data was used to predict the probability of prescribed fires burning at a high
severity level in year 2006. Fire history from 1998-2006 were used to model the
probability of wildfires burning at a moderate-high severity in 2007. These models were

89
then used to predict the probability of experiencing a high severity prescribed fire and
the probability of experiencing a moderate-high severity wildfire in 2008.
Spatial Model
The models, probability of high severity prescribed fire and moderate to high
severity wildfire, were recreated spatially using parameter estimates from logistic
regression and ArcGIS spatial analyst extension. Layers were created for each
parameter and calculations were made using the spatial analyst/ raster calculator. The
spatial model was used to show the probability of high severity prescribed fire and the
probability of moderate-high severity wildfire in 2008.
Results
Probability of High Severity Prescribed Fire
Severity level of the last fire i, frequency of fire X1ij, time since last fire X2ij, and the
interaction between frequency and time since last fire were significant parameters in the
model for prescribed fires (10).
ijijijijijiij XXXX 2132211)(logit
10
The model was significant and the parameters were significant based on their
Wald chi-square statistics (Table 3-3). The ratio of the Pearson chi-square statistic to
its degrees of freedom was approximately 1 indicating good model fit.
Time since last fire showed a positive relationship with the probability of high
severity; as the time interval increased the probability of high severity fire also increased
(Figure 3-6, Figure 3-7, Figure 3-8). The effect of the severity level of the last fire varied
by severity level; unburned, moderate, and high severity levels in the last fire increased
the probability of high severity in the subsequent fire and low severity level in the last

90
fire reduced the probability of high severity in the subsequent fire. Unburned areas had
a very high probability (>80%) of experiencing high severity fires regardless of the
amount of time that had passed since the last fire event (Figure 3-8). Areas that had
experienced low and high severity in the last fire had a low probability of experiencing
high severity in subsequent fire, followed by areas that experienced a moderate severity
level which approached a 50% probability at 7-9 years since the last fire. Frequency of
fire also had a positive relationship with the probability of high severity fire. As
frequency of fire increased, the probability of experiencing high severity subsequent fire
also increased (Figure 3-6).
Probability of Moderate to High Severity Wildfire
The model for the probability of experiencing a moderate to high severity wildfire
incorporated frequency of fire X1ij, time since last fire X2ij, and the interaction between
the two (11).
ijijijijijij XXXX 2132211)(logit 11
The model was significant and the parameters were significant based on their Wald chi-
square statistics (Table 3-4). The ratio of the Pearson chi-square statistic to its degrees
of freedom was approximately 1 indicating good model fit. As the time since last fire
increased, the probability of moderate-high severity fire also increased (Figure 3-9).
The increased probability over time since last fire varied by the number of fires that
occurred since 1998. Areas that had never experienced fire had a much higher
probability than previously burned areas. As the frequency of fire increased, the
probability decreased (Figure 3-10).

91
Spatial Models
The spatial models identified areas that had increased probability of burning at a
high severity based on fire history for prescribed fire (Figure 3-11, Figure 3-12), and
identified the probability of moderate to high severity for wildfires. Areas with
probabilities greater than 95% are highlighted as areas we would expect to burn
severely if a fire event were to occur.
The High severity model (for prescribed fires) identified areas that burned often,
as targets for high severity. Probabilities range from 35-99% for the entire forest. A
small portion of the forest had a probability greater than 95% (6.2%), while most of the
forest had a probability of high severity greater than 50% (84%). Although forest type
was not a significant predictor of high severity fire, the model indicated that mesic
communities had a small portion of the area with a probability greater than 95% (6.3%)
(Figure 3-13). Hydric communities had a higher portion of area (45%) with a probability
of high severity greater than 95%. A small percentage of the prescribed fires in 2008
actually burned at a high severity level (2.4%) (Figure 3-14) and these areas were often
found to have a probability of high severity that was at least 95%.
In the 2008 fire season there were very few wildfires greater than 1 ac that
occurred on the Osceola National forest. The model Identified areas that had not
burned or had burned only once from 1998-2007 as having a higher probability of
burning at a moderate-high severity level. Most of the forest had a probability less than
15% (Figure 3-16). The probability of burning at a moderate to high severity level was
quite low for the entire dataset (<20%). Although forest and community types were not
significant predictors of moderate to high severity, the model indicated that hydric
communities had a probability less than 1% for most areas (Figure 3-17). Mesic

92
communities had a higher probability (below 5%) for the majority of the area. Of the
four forest types, fresh water marshes had the highest probability of moderate-high
severity (>15%) (Figure 3-18).
Discussion
Probability of High Severity Prescribed Fire
The model predicting the probability of high severity for prescribed fires yielded
important information regarding the relationship between time between fire events, the
severity level of previous fires, and the frequency of fire. As time since last fire
increased, the probability of experiencing a high severity fire also increased. Previous
studies conducted on the Osceola National Forest, found that as time between fire
events increased, fire intensity also increased causing greater tree mortality following
fires (Outcalt et al. 2004). Vegetation recovery and fuel loads increase with time since
the last disturbance event. So, as the time since the last fire increases there is also an
increase in the amount of fuel and an increase in vertical structure of fuel. As fuel and
vertical structure increases, so should the probability of burning at a high severity level
due to the increase in combustible material. Increases in vertical structure also provide
ladder fuels that increase the chance of ground fires moving into tree crowns.
Areas previously burned by low severity fire had a lower probability of high severity
prescribed fire just as areas with high and moderate severity levels had a higher
probability of high severity fire. This indicates that fuel availability may be influencing
the amount of change caused by fire more than previous fires. Low severity fires may
be the result of fuel availability and not fuel accumulation. Areas with high and
moderate severity levels that have high probabilities of experiencing high severity at
short return intervals suggest that vegetation on these sites quickly recovered from fire

93
events and were able to burn severely again. Alternatively this may reflect a bias in the
high severity class. If these areas burned severely then there is likely less vegetation to
burn during subsequent events. If this vegetation is consumed during a fire it would
take less fuel consumption to cause a large amount of change between pre- and post-
fire images. This effect increases subsequent fire severity level and increases severity
level with increased fire frequencies. This phenomenon would explain the unexpected
relationship between frequency and the probability of high severity as well as the high
probability associated with prescribed fires versus wild fires.
Hydric communities had a higher probability of high severity prescribed fire then
mesic communities. This may be explained by the conditions chosen to perform
prescribed fires under. In stands that have been burned multiple times in the past, land
managers may choose weather conditions that are more risky to execute prescribed
fires. And, even though hydric areas are usually unavailable during prescribed fires,
when they are avialible they may burn at a high severity level.
Probability of Moderate to High Severity Wildfire
Predicting the probability of moderate to high severity wildfires yielded
information unlike the prescribed fire model. Time since last fire had the same
increasing relationship, yet fire frequency had a decreasing relationship in this model.
The relationship between frequency and the probability of moderate to high severity
wildfire is what we would expect; as the number of times an area burned increased, we
would expect there to be a reduced chance of experiencing higher severity levels
because fuel loads were reduced. Increased frequency also reduces the vigor in
vegetation recovery so that with each fire, vegetation re-growth declines.
94
Forest and community types were not significant indicators of high and moderate
to high severity fire. During prescribed fires we might expect similar fire effects (low
severity) in the different forest and community types as areas are burned under optimal
conditions. Yet, during wildfires we expect hydric communities to burn more severely if
the vegetation is avialible to burn due to high fuel loads especially during prolonged
drought periods (Outcalt et al. 2004). Within this dataset, few hydric communities
burned severely indicating that fuel was not avialible to burn during wildfires. We would
also expect that forest types would influence severity levels. The lack of significance
may be due to Osceola National Forest being composed mostly of pine flatwood and
mesic forest.
Spatial Models
The spatial models were effective in identifying, spatially, where you would expect
to observe high severity fire in the event a prescribed fire occurred and moderate to
high severity in the event a wildfire occurred. The prescribed fire model identified areas
that have a history of burning often as being at an increased risk of high severity fire.
Areas that have not burned in 10 years also had an elevated risk of high severity fire.
Most of the area burned in 2008 was burned by prescribed fire at moderate (45%) and
low (18%) severity levels. Sections of prescribed fires that actually burned at high
severity had probabilities of high severity greater than 50% and most of the area had
probability greater than 95%. This suggests that the model adequately identified areas
that were at a high risk of high severity fire based on its ability to recover from previous
fire, the effects of the last fire event, and the amount of time between events.
The wildfire model had low probabilities of moderate-high severity for the entire
forest for 2008. Areas that had not been burned were identified as having increased

95
risk of moderate to high severity fire. A single wildfire occurred on the Osceola in 2008
(less than 5 acres) and this wildfire had no areas of moderate or high severity.
Conclusion
Remote sensing techniques were successfully used to model fire history for the
Osceola National Forest to determine the risk of experiencing high and moderate
severity fire in the event of a fire. The models identified areas that require attention in
order to reduce the risk of high and moderate to high severity fire. The prescribed fire
model identified areas that burn often as having an elevated risk of high severity. This
relationship between fire frequencies and high severity implied that either the vegetation
with high frequencies was at the highest risk due largely to fast recovery time for
prescribed fires or that there was a bias in the high severity class for areas with less
vegetation. Forests that can burn on short time intervals need to as a response to the
short time period required for fuel loads and live vegetation to return to pre-fire
conditions. Yet, continued burning would also reduce the amount of vegetation available
for subsequent fires and this reduction could be causing a bias in the high severity
class.
Conditions suitable for prescribed fire are determined by climatic factors and fuel
loads, and are increasingly influenced by burned acreage quotas set by regional or
federal management. Forest managers are under pressure to burn as many acres as
possible each year. They may be willing to burn areas with high fire frequencies under
more risky weather conditions due to reduced fuel loads and short time since last fire.
Fire effects in these areas may then end up being more severe than in areas that are
burned under less extreme fire weather conditions.

96
Smoke sensitive areas are at an elevated risk for high severity and moderate to
high severity. These areas are dangerous to burn due to the risk of disrupting
transportation, reducing air quality, or damaging property. Conditions suitable to burn
sensitive areas occur rarely often increasing the amount of time between fire events.
Parts of the Osceola just north of the airport and that surround Interstate 10 have a
probability of high severity that ranges from 50-75% for prescribed fires. During
wildfires, the risk is elevated compared to probabilities for the rest of the forest (10-
19%). Both models identify these areas as being at an elevated risk requiring
significant suppression efforts in the event of fire.
The relationship between frequency and the probability of high severity may also
be due to error introduced by differences in biomass. Additional research to address
the amount of biomass in relation to dNBR values is necessary to determine if areas
with lower biomass have a higher probability of high severity due to the smaller amount
of vegetation necessary to cause a significant change in pre- and post- fire images. It
may also be useful to look at the effects of delayed mortality in areas with short fire
return intervals to identify if this would cause further bias in the high severity class.
Overall, the probability of moderate to high severity (for wildfires) is less than what
we would expect. The low probability may be caused by how wildfires are mapped.
Wildfire perimeters are mapped using Landsat imagery based on ocular estimates of
where fires occurred. The perimeters are not exact so wildfires tend to have a high
amount of unburned and low severity pixels. Also, most wildfires within this dataset are
less than 50 acres. Wildfire size is determined by both suppression efforts and fuel
availability. Therefore, smaller wildfires indicate that wildfires were not often exhibiting

97
fire behavior that would likely cause high severity fire effects. There were few wildfires
(Oak Fire 1998, Impassible 2004, and the Bugaboo 2007) that were large in size and
that required great suppression efforts assisted by weather conditions for suppression.
Larger fires had higher portions of moderate and high severity than smaller fires (not
significantly larger). So, for the entire dataset, very few areas burned at high severity
during wildfires (excluding the impassible fire of 2004) and there was not a very large
increase in the area burned by moderate severity for larger fires. Biases introduced by
perimeter estimates and the greater amount of smaller wildfires are the likely cause for
the low probability of experiencing moderate to high severity.

98
Table 3-1. Number of pixels in each severity class by year. Year Severity
High Moderate Low Unburned 1998 9720 18442 214519 106581 1999 5946 18791 111048 149600 2000 6404 1785 4961 7996 2001 56 180 372 505 2002 1 50 42680 71144 2003 1 27 179 72 2004 119570 58799 127579 31298 2005 3668 13045 63549 43737 2006 22283 23283 25804 9565 2007 120 7182 26136 69340 2008 2757 40332 17183 2757
Table 3-2. Covariates for the model measuring the probability of high severity
prescribed fire and moderate to high severity wildfire. Forest Type Community
Type Frequency Time since
Last Fire Last Severity
Level
Pine flatwoods Hydric The Number of times a
pixel burned at a severity
level greater than 1
Number of years since
last fire event where pixel burns at a
severity level greater than 1
Severity level of the last fire
event Longleaf/ xeric oaks
Fresh water marshes
Mesic
Swamp forest
Table 3-3. Parameter estimates and their respective standard errors and p-values for
the model predicting the probability of high severity prescribed fire. Parameter Estimate Std. Error P-value Intercept -3.0979 0.3210 <0.0001
Frequency of Fire 1.9709 0.1899 <0.0001 Time Since Last Fire 0.09361 0.02556 0.003
Severity Level of the last Fire
Unburned 1.5268 0.1458 <0.0001 Low Severity -0.5854 0.07704 <0.0001
Medium Severity 0.3493 0.08290 <0.0001 High Severity 0 . .
Residual 1.009 . .

99
Table 3-4. Parameter Estimates and their respective standard errors and p-values for
model predicting the probability of Moderate to High severity wildfire. Parameter Estimate Std. Error P-value Intercept -3.2121 0.1391 <0.0001 Frequency of Fire -1.5005 0.1302 <0.0001
Time Since Last Fire -0.1470 0.01383 <0.001 Frequency * Time Since Last Fire 0.2194 0.01404 <0.001 Residual 0.9975 . .

100
Figure 3-1. Time since last fire for the Osceola National Forest (1998-2008)

101
Figure 3-2. Fire frequency from 1998-2008 for the Osceola National Forest.

102
Figure 3-3. Severity level of the last fire event (1998-2007).

103
Figure 3-4. Florida Geographic Database Library Map of forest types for the Osceola
National Forest.

104
Figure 3-5. Map of the community types, hydric and mesic, for the Osceola National Forest.

105
Figure 3-6. Relationship between the probability of high severity prescribed fire, frequency of fire, and time since last fire.

106
Figure 3-7. Relationship between the probability of high severity prescribed fire, the severity level of the last fire event, and time since last fire.

107
Figure 3-8. Relationship between the probability of high severity prescribed fire, frequency of fire, and time since last fire.
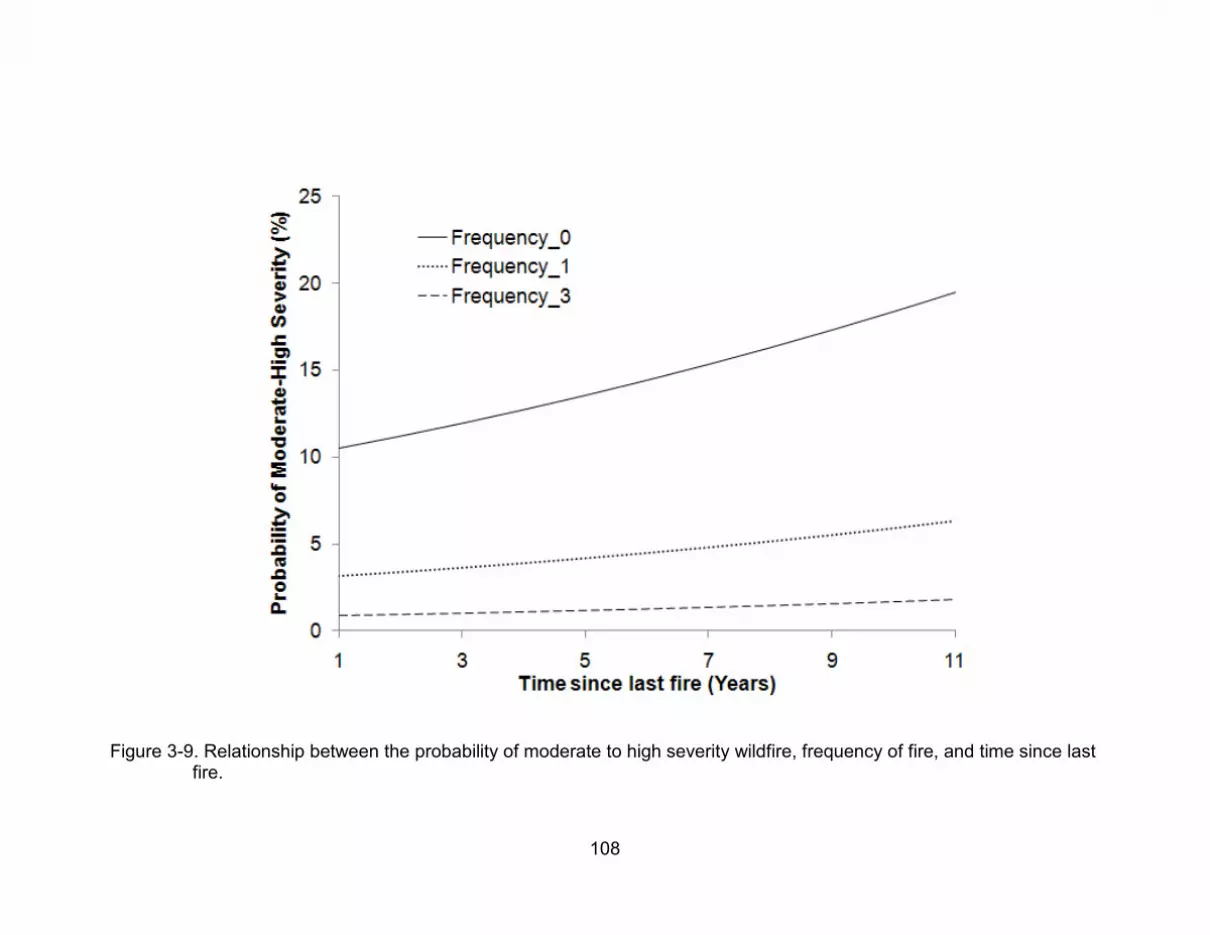
108
Figure 3-9. Relationship between the probability of moderate to high severity wildfire, frequency of fire, and time since last fire.
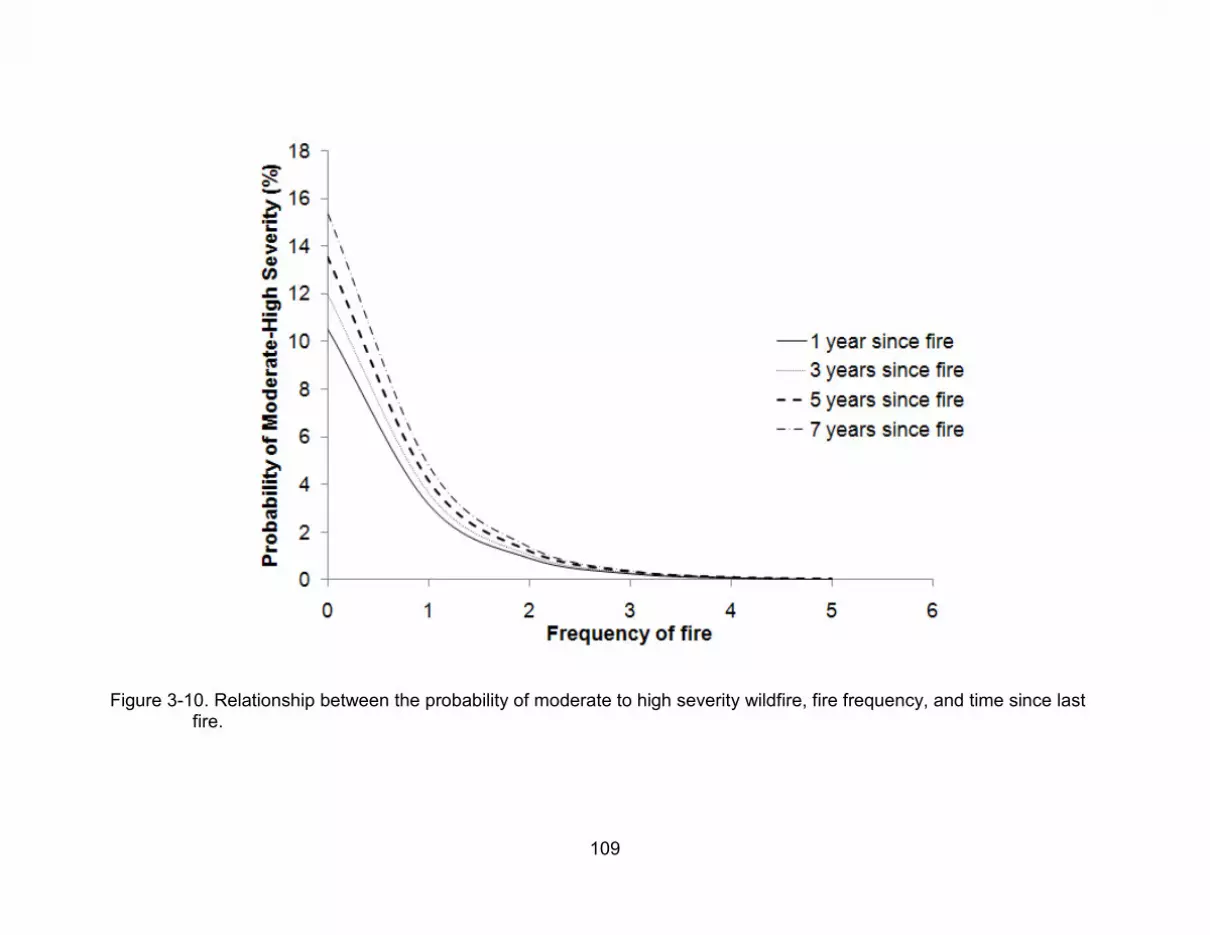
109
Figure 3-10. Relationship between the probability of moderate to high severity wildfire, fire frequency, and time since last fire.

110
Figure 3-11. Probability of high severity prescribed fire versus observed severity levels for 2008 prescribed fires.

111
Figure 3-12. The probability of high severity prescribed fire in 2008.

112
Figure 3-13. The probability of high severity prescribed fire in 2008 by community type.

113
Figure 3-14. Severity levels of 2008 prescribed fires on the Osceola National forest.

114
Figure 3-15. The probability of high severity prescribed fire in 2008 by forest type.

115
Figure 3-16. The probability of moderate to high severity fire for 2008.

116
Figure 3-17. The probability of moderate to high severity wildfire for 2008 by community
type.

117
Figure 3-18. The probability of moderate to high severity wildfire in 2008 by forest type.

118
CHAPTER 4 CONCLUSION
Remote sensing techniques used to model fires on the Osceola National forest
has provided valuable information regarding fire severity, the effect of time between
burns and the risks incurred by management decisions. Fuels on the Osceola National
Forest have fast recover times as evident by the relationship between frequency and
the probability of high severity. Forest land that burns more frequent also burns at a
higher severity. This indicates that fuels are able to regenerate at a rate to support
higher severity fires in short time periods.
The analysis has provided valuable information regarding the influence of
severity level and time between events. Models identified the time interval 5-6 years as
a point where the effects of previous fires had little to no effect on subsequent fires. At
this point, the probability of high severity fire, increasing severity level in subsequent
fire, and burning in successive fire is highest. This is also a point where the probability
of decreasing severity in subsequent fires was lowest. It has also become evident that
effects of previous fires have little to no influence on subsequent fires past 5-6 years.
Therefore fire frequencies larger than this will not adequately mitigate wildfire risk in
pine flatwoods.
Variations in the landscape influence the relationship between time between fire
events and fire severity. Fire effects are influenced by the type of vegetation and the
availability of that vegetation. Land managers must consider vegetation recovery and
availability differences by both forest and community types to determine the risk of the
high severity fire. Hydric areas have exhibited a lack of fire activity during wildfires,
implying that these areas have not been available to burn often. This raises the risk of

119
experiencing high severity fire during prolonged drought periods. When these high fuel
loads become available to burn they will likely burn quite severely (Maliakal et al. 2000).
To incorporate this into the model it may be useful to add a weighted overlay to identify
hydric communities and further weight them by time since last fire during prolonged
drought conditions. Land managers should also consider other options to treat heavy
fuel loads in these areas; including mechanical treatments.
To increase model performance it may be effective to include more
meteorological attributes into the models. This would allow the models to take into
account weather effects that may further identify areas that are at highest risk of
experiencing high severity. Spatial autocorrelation of fire severity and other model
covariates should also be incorporated into the models to account for variations in
space.

120
APPENDIX: SEVERITY DATASETS
Figure A-1. Severity levels of fire events for the 1998 fire season.

121
Figure A-2. Severity levels of fire events for the 1999 fire season.

122
Figure A-3. Severity levels of fire events for the 2000 fire season.

123
Figure A-4. Severity levels of fire events for the 2001 fire season.

124
Figure A-5. Severity levels of fire events for the 2002 fire season.

125
Figure A-6. Severity levels of fire events for the 2003 fire season.

126
Figure A-7. Severity levels of fire events for the 2004 fire season.

127
Figure A-8. Severity levels of fire events for the 2005 fire season.

128
Figure A-9. Severity levels of fire events for the 2006 fire season.

129
Figure A-10. Severity levels of fire events for the 2007 fire season.

130
Figure A-11. Severity levels of fire events for the 2008 fire season.

131
LIST OF REFERENCES
Abrahamson, Warren G. 1984. Species response to fire on the Florida Lake Wales Ridge. American Journal of Botany. 71: 35-43.
Abrahamson, Warren G. & Abrahamson, Christy R. 1996. Effects of fire on long unburned Florida uplands. Journal of Vegetation Science.7: 565-574.
Agee, J.K. 1993. Fire Ecology of Pacific Northwest Forest. Island Press, Washington,D.C.
Allen, Jennifer. & Sorbel Brian. 2008. Assessing the differnced Normalized Burn Ratio’s ability to map burn severity in boreal forest and tundra ecosystems of Alaska’s national parks. International Journal of Wildland Fire. 17: 463-475.
Boer, M M. Macfarlane, C. Norris, J. Sadler, R J. Wallace, J. & Grierson, P F. 2008. Mapping burned areas and burn severity patterns in SW Australian eucalypt forest using remotely-sensed changes in leaf area index, Remote Sensing of Environment. 112(12): 4358-4369.
Brose, Patrick. & Wade, Dale. 2002. Potential fire behavior in pine flatwood forest following three different fuel reduction treatments. Forest Ecology and Management. 163: 71-84.
Busse, Matt. Hubber, Ken. Fiddler,Gary. Shestak, Carol. & Powers, Robert. 2005. Lethal soil temperatures during burning of masticated forest residues. International Journal of Wildland Fire. 14: 267-276.
Cocke, Allison. Fule, Peter. & Crouse, Joseph. 2005. Comparison of Burn severity assessment using difference Normalized Burn Ratio and ground data. International Journal of Wildland Fire. 14: 189-198.
Collins, Brandon. Miller, Jay. Thode, Andrea. Kelly, Maggi. Wagtendonk,Jan. & Stephens, Scott. 2009. Interactions Among Wildland Fires in a Long-Established Sierra Nevada Natural Fire Area. Ecosystems. 12: 114-128.
Crawford, Julie A. Wahren, C-H. A, Kyle, S. & Moir, W. H. 2001. Responses of exotic plant species to fires in Pinus ponderosa forests in northern Arizona. Journal of Vegetation Science. 12: 261–268.
Davis, John H. 1967. General map of natural vegetation of Florida. Agricultural Experiment Stations, Institute of Food and Agricultural Sciences, University of Florida.
Davis, Lawrence S. & Cooper, Robert W. 1963. How prescribed burning affects wildfire occurrence. Journal of Forestry. 61(12): 915-917.

132
Dombeck, Michael P. Williams, Jack E. & Wood, Christopher A. 2004.Wildfire policy and public lands: integrating scientific understanding with social concerns across landscapes. Conservation Biology. 18: 4.
Duffy, P A. Epting, J. Graham, J M. Rupp, T S. & McGuire, A D. 2007. Analysis of Alaskan burn severity patterns using remotely sensed data. International Journal of Wildland Fire. 16: 277–284.
Duguy, Beatriz. Antonio Alloza, Jose. Roder, Achim. Vallejo, Ramon. & Pastor, Francisco. 2007. Modeling the effects of landscape fuel treatments on fire growth and behavior in a Mediterranean landscape (eastern Spain). International Journal of Wildland Fire. 16(5): 619-632.
Duncan, Brean W. & Schmalzer, Paul A. 2004. Anthropogentic influences on potential fire spread in a pyrogenic ecosystem of Florida, USA. Landscape Ecology. 19: 153-165.
Earth Resources Observation and Science (EROS) 2009. http://glovis.usgs.gov/ distribution/downloadnotices.shtml. Accessed January 2010.
Epting, J. Verbyla, D. & Sorbel, B. 2005. Evaluation of remotely sensed indices for assessing burn severity in interior Alaska using Landsat TM and ETM+. Remote Sensing of Environment. 96(3-4): 328-339.
Escuin, S. Navarro, R. & Fernandez, P. 2009. Fire severity assessment by using NBR (Normalized Burn Ratio) and NDVI (Normalized Difference Vegetation Index) derived from Landsat TM/ETM Images. International Journal of Remote Sensing. 29(4): 1053-1073.
Finney, M.A. McHugh, C.W. & Grenfell, I.C. 2005. Stand- and landscape-level effects of prescribed burning on two Arizona wildfires. Canadian Journal of Forest Research. 35(7): 1714-1722.
FireModels.org (Fire Behavior and Fire Danger Software). 2009. FARSITE. http://firemodels.fire.org/content/view/112/143/. Accessed January 2010.
Florida Exotic Pest Plant Council. 2009. 2009 Invasive plant list. http://www.fleppc.org/ list/list.htm. Accessed January 2010.
Gilliam, Frank S. & Platt, William J. 1999. Effects of longterm fire exclusion on tree species composition and stand structure in an oldgrowth Pinus palustris (Longleaf pine ) forest. Plant Ecology. 140: 15-26.
Glitzenstein, Jeff. Streng, Donna. Achtemeier, Gary. Naeher, Luke. & Wade, Dale. 2006. Fuels and fire behavior in chipped and unchipped plots: implications for land management near wildland urban interface. Forest Ecology and Management. 236:18-29.

133
Godwin, David R. 2008. Burn severity in a central Florida sand pine scrub wilderness area. University of Florida Press.
Hardy, C.C. 2005. Wildland fire hazard and risk: problems, definitions, and context. Forest Ecology and Management. 211: 73-82.
Heyward, Frank. 1939. The relation of fire to stand composition of longleaf pine forests. Ecology. 20(2): 287-304.
Holden, Zachary. Morgan, Penelope. & Evans, Jeffery. 2009. A predictive model of burn severity based on 20-year satellite- infrared burn severity data in a large southwestern U.S. wilderness area. Forest Ecology and Management. 258: 2399-2406.
Hoy, Elizabeth. French, Nancy. Turetsky, Merritt. Trigg, Simon. & Kasischke, Eric. 2008. Evaluating the potential of landsat TM/ETM+ imagery for assessing fire severity in Alaska black spruce forest. International Journal of Wildland Fire. 17: 500-514.
Jakubauskas, M.E. Lulla, K.P. & Mausel, P.W. 1990. Assessment of vegetation change in fire altered forest landscape. Photogrammetric Engineering and Remote Sensing. 56(3): 371-377.
Kane, Jeffery. Varner, Morgan. & Knapp, Eric. 2009. Novel fuel bed characteristic with mechanical mastication treatments in northern California and south-western Oregon, USA. International Journal of Wildland Fire. 18: 686-697.
Kobziar, Leda N. McBride, Joe R. & Stephens, Scott L. 2009. The efficacy of fire and fuels reduction treatments in Sierra Nevada pine plantation. International Journal of Wildland Fire. 18: 791-801.
Kreye, Jesse. Fuels break study sampling. 2009. Kobziar Fire Science Lab. Conversation: December 2009.
Kuenzi, Amanda. Fule, Peter. & Sieg, Carolyn. 2008. Effects of fire severity and pre-fire stand treatment on plant community recovery after a large wildfire. Forest Ecology and Management. 255: 855-865.
Lavoie, M. Starr, G. Mack, M.C. Martin, T.A. & Gholz, H.L. 2010. Effects of a prescribed fire on understory vegetation , carbon pools, and soil nutrients in longleaf pine-slash pine forest in Florida. Natural Areas Journal. 30: 82-94.
Lemon, Paul C. 1949. Successional responses of herbs in the longleaf- slash pine forest after fire. Ecology. 30: 135-145.
Littell, Ramon C. Milliken, George A. Stroup, Walter W. Wolfinger, Russell D. & Schabenberger, Oliver. 2006. SAS for Mixed Models. 2nd Edition. SAS Publishing, Caryn, NC.

134
Maliakal, Satya K. & Menges, Eric S. 2000. Community composition and regeneration of Lake Wales Ridge wiregrass flatwoods in relation to time since last fire. Journal of Torrey Botanical Society. 127(2): 125-138.
Miller, Jay.D. & Thode, Andrea E. 2007. Quantifying burn severity in a heterogeneous landscape with relative version of the delta Normalized Burn Ratio (dNBR). Remote Sensing of Environment. 109: 66-80.
Monk, Carl D. 1968. Succesional and environmental relationships of the forest vegetation of north central Florida. American Midland Naturalist. 79(2): 441-457
Monroe, Martha. Long, Alan. & Maynowski, Susan. 2003. Wildland Fire in the southeast: negotiating guidelines for defensible space. Journal of Forestry. 101: 14-19.
National Fire and Aviation Management. 2009. Fire Weather Data. http://fam.nwcg.gov/fam-web/weatherfirecd/. Accessed January .2010
National Invasive Species Information Center (USDA). 2009. National Invasive Species Management Plan. 2006. http://www.invasivespeciesinfo.gov/. Accessed January 2010.
National Oceanic and Atmospheric Administration (NOAA). 2009 Palmer Drought Severity Index. http://www.drought.noaa.gov/palmer.html. Accessed June 2010.
Oliveras, Imma. Gracia, Marc. More, Gerard. & Retana, Javier. 2009. Factors influencing the patterns of fire severity in large wildland fire under extreme meteorological conditions in the Mediterranean basin. International Journal of Wildland Fire. 18: 755-764.
OTA. 1993. Harmful non-indigenous species in the United States. Office of Technology and Assessment, United States Congress, Washington DC.
Outcalt, Kenneth W. & Wade, Dale D. 2004. Fuels management reduces tree mortality from wildfires in southeastern United States. Southern Journal of Applied Forestry. 28(1): 28-34.
Pimentel, David. Zuniga, Rodolfo. & Morrison, Doug. 2005. Update on the environmental and economic cost associated with alien-invasive species in the United States. Ecological Economics. 52: 273-288.
Reiner, Alicia L. Vaillant, Nicole M. Fite-Kaufman, JoAnn. & Dailey, Scott N. 2009. Mastication and prescribed fire impacts on fuel in a 25-year old ponderosa pine plantation, southern Sierra Nevada. Forest Ecology and Management. 258: 2365-2372.

135
Safford, Hugh. Schmidt, David. & Carson, Chris. 2009. Effects of fuel treatments on fire severity in an area of wildland-urban interface, Angora Fire, Lake Tahoe Basin, California. Forest Ecology and Management. 258: 773-787.
Schmidt, Davis A. Taylor, Alan H. & Skinner, Carl N. 2008. The influence of fuels treatment and landscape arrangement on simulated fire behavior, Southern Cascade range, California. Forest Ecology and Management. 255: 3170-3184.
Stephens, Scott. & Moghadds, Jason. 2005. Experimental fuel treatment impacts on forest structure, potential fire behavior, and predicting tree mortality in California mixed conifer forest. Forest Ecology and Management. 215: 21-36.
Stratton, Richard. 2005. Assessing the effectiveness of landscape fuel treatments on fire growth and behavior. Journal of Forestry. 93; 1041-1052.
Tuner, Monica G. Hargrove, William W. Gardner,Robert H. & Romme, William H. 1994. Effects of fire on landscape heterogeneity in Yellowstone National Park, Wyoming. Journal of Vegetation Science. 5: 731-742.
United States Geologic Service (USGS) . 2009. Digital Elevation Model. http://seamless.usgs.gov/website/seamless/ viewer.htm. Accessed January 2010.
United States Geologic Service (USGS) . 2009. Difference Normalized Burn Ratio. http://burnseverity.cr.usgs.gov/pdfs/LAv4_BR_ CheatSheet.pdf. Accessed January 2010.
Wagtendonk, Jan. Root, Ralph. & Key, Carl. 2004. Comparison of AVIRS and Landsat ETM+ detection capabilities for burn severity. Remote Sensing of Environment. 92: 397-408.
Waldrop, Thomas A. White, David L. & Jones, Steven M. 1992. Fire regimes for pine-grassland communities in the southeastern United States. Forest Ecology and Management. 47: 195-210.
White, Joseph D. Ryan, Kevein C. Key, Carl C. & Runnig, Stephen W. 1996. Remote sensing of forest fire severity and vegetation recovery. International journal of Wildland Fire. 6(3): 125-136.
Wimberly, Michael C. Cochrane, Mark A. Baer, Adam D. & Pabst, Kari. 2009. Assessing fuel treatment effectiveness using satellite imagery and spatial statistics. Ecological Applications. 19(6): 1377-1384.
Wolcott, Leslie. O’Brien, Joseph J. & Mordecai, Kathryn. 2007. A Survey of Land Managers on Wildland Hazardous Fuels Issues in Florida: a technical note. Sothern Journal of Applied Forestry. 31(30): 148-150.

136
BIOGRAPHICAL SKETCH
Sparkle Leigh Malone was born in the spring of 1985, in Chicago, Illinois to Rita
and Rodney Malone. She grew up in Miami, Florida, after her family moved from
Chicago to Miami when she was an infant. Sparkle graduated from Dr. Michael Krop
Senior High School in 2003. Her college career began in 2005 at Florida Agricultural
and Mechanical University in Tallahassee, FL. Her major area of study was agronomy.
In 2007 she transferred into the University of Florida’s School of Forest Resources and
Conservation by way of the 1890s scholars program. Here, Sparkle majored in forestry
with a specialization in informatics. She obtained a Bachelor of Science from the
university in the spring of 2009 and a master’s degree in the summer of 2010.
Related Documents