1 23 Environmental Earth Sciences ISSN 1866-6280 Environ Earth Sci DOI 10.1007/s12665-013-2289-z Effect of fines content and void ratio on the saturated hydraulic conductivity and undrained shear strength of sand–silt mixtures Mostefa Belkhatir, Tom Schanz & Ahmed Arab

Welcome message from author
This document is posted to help you gain knowledge. Please leave a comment to let me know what you think about it! Share it to your friends and learn new things together.
Transcript
1 23
Environmental Earth Sciences ISSN 1866-6280 Environ Earth SciDOI 10.1007/s12665-013-2289-z
Effect of fines content and void ratio onthe saturated hydraulic conductivity andundrained shear strength of sand–siltmixtures
Mostefa Belkhatir, Tom Schanz &Ahmed Arab

1 23
Your article is protected by copyright and
all rights are held exclusively by Springer-
Verlag Berlin Heidelberg. This e-offprint is
for personal use only and shall not be self-
archived in electronic repositories. If you
wish to self-archive your work, please use the
accepted author’s version for posting to your
own website or your institution’s repository.
You may further deposit the accepted author’s
version on a funder’s repository at a funder’s
request, provided it is not made publicly
available until 12 months after publication.
ORIGINAL ARTICLE
Effect of fines content and void ratio on the saturated hydraulicconductivity and undrained shear strength of sand–silt mixtures
Mostefa Belkhatir • Tom Schanz • Ahmed Arab
Received: 8 January 2012 / Accepted: 25 January 2013
� Springer-Verlag Berlin Heidelberg 2013
Abstract The hydraulic conductivity represents an
important indicator parameter in the generation and redis-
tribution of excess pore pressure of sand–silt mixture soil
deposits during earthquakes. This paper aims to determine
the relationship between the undrained shear strength
(liquefaction resistance) and the saturated hydraulic con-
ductivity of the sand–silt mixtures and how much they are
affected by the percentage of low plastic fines (finer than
0.074 mm) and void ratio of the soil. The results of flexible
wall permeameter and undrained monotonic triaxial tests
carried out on samples reconstituted from Chlef river sand
with 0, 10, 20, 30, 40, and 50 % non-plastic silt at an
effective confining pressure of 100 kPa and two initial
relative densities (Dr = 20, 91 %) are presented and dis-
cussed. It was found that the undrained shear strength
(liquefaction resistance) can be correlated to the fines
content, intergranular void ratio and saturated hydraulic
conductivity. The results obtained from this study reveal
that the saturated hydraulic conductivity (ksat) of the sand
mixed with 50 % low plastic fines can be, in average, four
orders of magnitude smaller than that of the clean sand.
The results show also that the global void ratio could not be
used as a pertinent parameter to explain the undrained
shear strength and saturated hydraulic conductivity
response of the sand–silt mixtures.
Keywords Undrained shear strength � Saturated
hydraulic conductivity � Fines content � sand–silt mixture �Void ratio
List of symbols
B Skempton’s pore pressure parameter
D10 Effective grain diameter
D50 Mean grain size
Dr Post consolidation relative density
e Post consolidation global void ratio
es Intergranular void ratio at the end of consolidation
emax Maximum global void ratio
emin Minimum global void ratio
Fc Fines content
Gs Specific gravity of the sand
Gf Specific gravity of the fines
G Specific gravity of the sand–silt mixture
Ip Plasticity index
ksat Saturated hydraulic conductivity
qpeak Undrained monotonic shear strength at the peak
c Total unit weight of soil
Introduction
The El Asnam (Algeria) earthquake of 1980 October 10
with an estimated wave magnitude of 7.3 (Ms = 7.3) is one
of the most destructive earthquake recorded in northern
Africa and more largely in the Western Mediterranean
Basin. This event occurred nearly at the same location as
the earthquake of 1954 (epicenter located at 36.285�N and
1.566�E in the locality of Beni-Rached). The earthquake
epicenter of the main shock was located 12 km in the east
M. Belkhatir (&) � A. Arab
Laboratory of Materials Sciences and Environment,
Hassiba Benbouali University of Chlef,
Route de Sendjes, BP 151, 02000 Chlef, Algeria
e-mail: [email protected]
T. Schanz
Laboratory of Foundation Engineering, Soil and Rock
Mechanics, Bochum Ruhr University, Bochum, Germany
123
Environ Earth Sci
DOI 10.1007/s12665-013-2289-z
Author's personal copy
region of Chlef City (210 km west of Algiers) at latitude
36.143�N and longitude 1.413�E with a focal depth of
about 10 km. The approximate duration of the quake was
between 35 and 40 s. The earthquake devastated the city of
El Asnam (actual Chlef), population estimated at 125,000,
and the nearby towns and villages. The large loss of life
(reportedly 5,000 to 20,000 casualties) and property was
attributed to the collapse of buildings. In several places of
the affected area, especially along Chlef river banks great
masses of sandy soils were ejected on to the ground surface
level. Belkhatir et al. (2010a) reported that a major damage
to certain civil and hydraulic structures (earthdams,
embankments, bridges, slopes and buildings) was caused
by this earthquake.
Liquefaction of sandy soil deposits during earthquakes
is one of the most important problems in the field of geo-
technical earthquake engineering. During earthquakes, the
undrained shear strength (liquefaction resistance) of satu-
rated sandy soil mass decreases due to a rapid build up of
excess pore water pressure within a short time. When the
excess pore pressure reaches the initial consolidation
pressure level, the effective stress becomes zero, inducing a
partial or a complete shear strength loss, called initial liq-
uefaction. At the state of initial liquefaction the soil mass
behaves as a liquid, causing tremendous damages to the
soil foundations and earth structures. Sand boils, settlement
or tilting of structures, failures of earth dams and slopes,
lateral spreading of bridge foundations, ground failures are
some examples of liquefaction damages. Numerous
researches have been reported on different factors influ-
encing the soil liquefaction phenomenon such as soil,
sample and testing parameters. However, most of the pre-
vious research has been concentrated on the liquefaction of
clean sands. But many natural soils contain a significant
amount of fines and many unstable phenomena occur in
soil layers with different amount of fines. Recent laboratory
research work carried out by Zlatovic and Ishihara (1995),
Lade and Yamamuro (1997), Thevanayagam et al (1997),
Thevanayagam (1998), Yamamuro and Lade (1998),
Amini and Qi (2000), Naeini (2001), Naeini and Baziar
(2004), Dash and Sitharam (2009), Sharafi and Baziar
(2010), Belkhatir et al. (2010a, b), Dash and Sitharam
(2011a, b) reveals that sand deposited with silt content can
be much more liquefiable than clean sand. Also, strain
properties and pore pressure generation in silty sand sam-
ples are quite different from clean sand. These new findings
emphasize the specific important features of deposits with
mixture of sand and silt. However, the conclusion forth-
coming from previous studies appears somewhat contra-
dictory and different.
The hydraulic conductivity influences in an important
manner the generation and redistribution of excess pore
pressure, thus, the undrained shear strength (liquefaction
resistance) of sandy soils subjected to earthquake loadings.
This soil parameter may be influenced by the type and
percentage of fines, sand gradation, void ratio, confining
pressure and density. The individual effects of these factors
cannot be practically determined from conventional field
tests. However, laboratory testing allows more control of
the different parameters that affect the hydraulic conduc-
tivity of soils.
Very limited laboratory results have been reported in the
published literature to assess the magnitude of the effects
of the percentage of fines, void ratio, confining pressure
and density on the saturated hydraulic conductivity of
sands mixed with fines. Thevanayagam (2000) observed
that the hydraulic conductivity, ksat was found to be one
order of magnitude smaller for silty sand compared to clean
sand for Ottawa sand mixed with low plastic fines. The-
vanayagam (2000) found values of k in the range of
0.6 9 10-3 to 1.3 9 10-3 cm/s for Ottawa sand,
9.0 9 10-5 cm/s for sand with 15 % fines, and 0.6 9 10-5
to 1.2 9 10-5 cm/s for sand with 25 % fines. Sathees
(2006) and Bandini and Sathiskumar (2009) also reported
mostly similar ranges of the hydraulic conductivity (ksat)
for two sands mixed with non-plastic fines.
This paper aims to evaluate the effects of fines content,
void ratio and relative density on the saturated hydraulic
conductivity and undrained shear strength characteristics of
sand–silt mixtures.
Experimental program
Description of materials
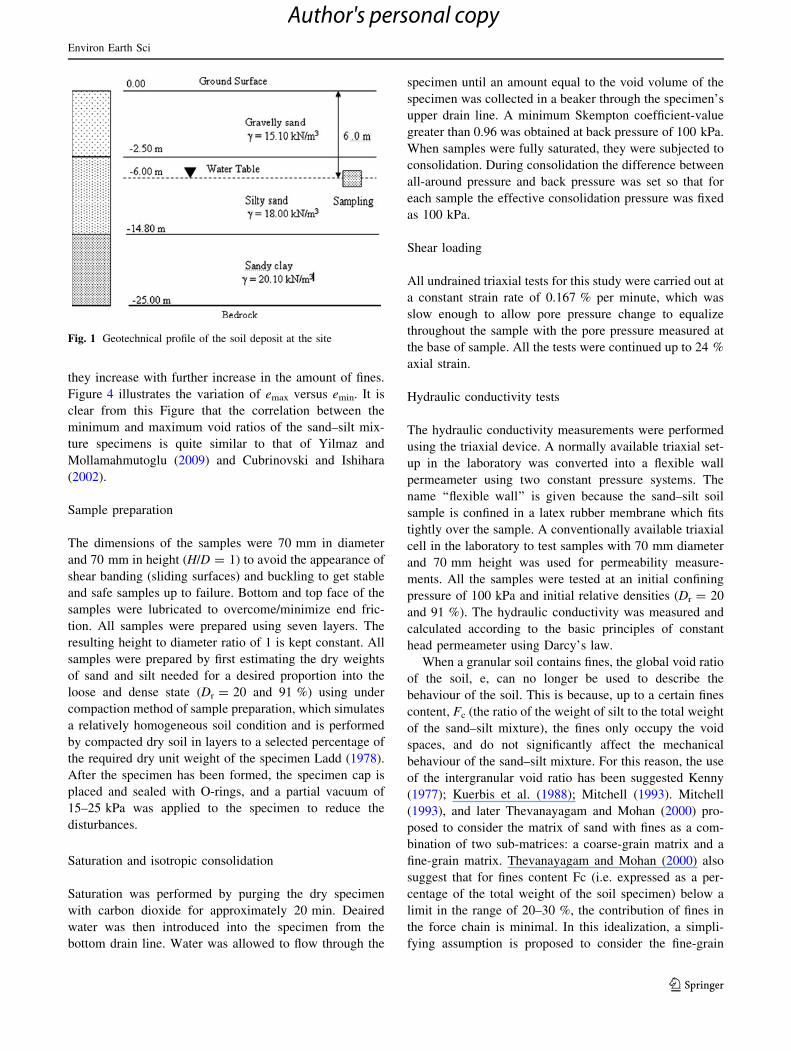
The soil samples used in this study was taken about 6.0 m
below ground surface from the bank of Chlef River where
severe liquefaction occurred during the El Asnam earth-
quake in 1980 (Fig. 1). Chlef sand has been used for all
tests presented in this laboratory investigation. Individual
sand particles are subrounded and predominant minerals
are feldspar and quartz. The tests were conducted on the
mixtures of Chlef sand and silt. Plasticity index (Ip) of the
silt is 5 %. Chlef sand was mixed with 0, 10, 20, 30, 40 and
50 % silt to get different fines contents. The index prop-
erties of the sand, sand–silt mixtures and silt used in this
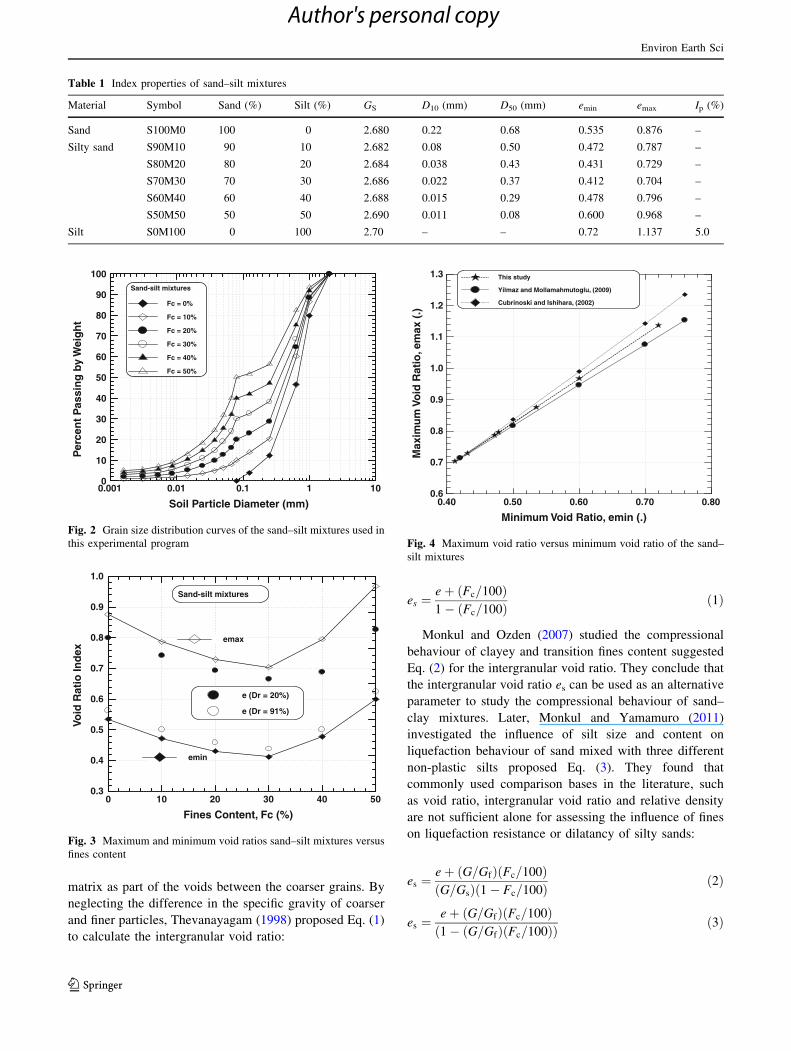
laboratory research are presented in Table 1. The grain size
distribution curves of the tested materials are shown in
Fig. 2. The variation of emax (maximum void ratio corre-
sponding to the loosest state of the soil sample) and emin
(minimum void ratio corresponding to the densest state of
the soil sample) versus the fines content Fc (the ratio of the
weight of silt to the total weight of the sand–silt mixture) is
given in Fig. 3. We note that the two indices decrease with
the increase of the fines content until Fc = 30 %, then,
Environ Earth Sci
123
Author's personal copy
they increase with further increase in the amount of fines.
Figure 4 illustrates the variation of emax versus emin. It is
clear from this Figure that the correlation between the
minimum and maximum void ratios of the sand–silt mix-
ture specimens is quite similar to that of Yilmaz and
Mollamahmutoglu (2009) and Cubrinovski and Ishihara
(2002).
Sample preparation
The dimensions of the samples were 70 mm in diameter
and 70 mm in height (H/D = 1) to avoid the appearance of
shear banding (sliding surfaces) and buckling to get stable
and safe samples up to failure. Bottom and top face of the
samples were lubricated to overcome/minimize end fric-
tion. All samples were prepared using seven layers. The
resulting height to diameter ratio of 1 is kept constant. All
samples were prepared by first estimating the dry weights
of sand and silt needed for a desired proportion into the
loose and dense state (Dr = 20 and 91 %) using under
compaction method of sample preparation, which simulates
a relatively homogeneous soil condition and is performed
by compacted dry soil in layers to a selected percentage of
the required dry unit weight of the specimen Ladd (1978).
After the specimen has been formed, the specimen cap is
placed and sealed with O-rings, and a partial vacuum of
15–25 kPa was applied to the specimen to reduce the
disturbances.
Saturation and isotropic consolidation
Saturation was performed by purging the dry specimen
with carbon dioxide for approximately 20 min. Deaired
water was then introduced into the specimen from the
bottom drain line. Water was allowed to flow through the
specimen until an amount equal to the void volume of the
specimen was collected in a beaker through the specimen’s
upper drain line. A minimum Skempton coefficient-value
greater than 0.96 was obtained at back pressure of 100 kPa.
When samples were fully saturated, they were subjected to
consolidation. During consolidation the difference between
all-around pressure and back pressure was set so that for
each sample the effective consolidation pressure was fixed
as 100 kPa.
Shear loading
All undrained triaxial tests for this study were carried out at
a constant strain rate of 0.167 % per minute, which was
slow enough to allow pore pressure change to equalize
throughout the sample with the pore pressure measured at
the base of sample. All the tests were continued up to 24 %
axial strain.
Hydraulic conductivity tests
The hydraulic conductivity measurements were performed
using the triaxial device. A normally available triaxial set-
up in the laboratory was converted into a flexible wall
permeameter using two constant pressure systems. The
name ‘‘flexible wall’’ is given because the sand–silt soil
sample is confined in a latex rubber membrane which fits
tightly over the sample. A conventionally available triaxial
cell in the laboratory to test samples with 70 mm diameter
and 70 mm height was used for permeability measure-
ments. All the samples were tested at an initial confining
pressure of 100 kPa and initial relative densities (Dr = 20
and 91 %). The hydraulic conductivity was measured and
calculated according to the basic principles of constant
head permeameter using Darcy’s law.
When a granular soil contains fines, the global void ratio
of the soil, e, can no longer be used to describe the
behaviour of the soil. This is because, up to a certain fines
content, Fc (the ratio of the weight of silt to the total weight
of the sand–silt mixture), the fines only occupy the void
spaces, and do not significantly affect the mechanical
behaviour of the sand–silt mixture. For this reason, the use
of the intergranular void ratio has been suggested Kenny
(1977); Kuerbis et al. (1988); Mitchell (1993). Mitchell
(1993), and later Thevanayagam and Mohan (2000) pro-
posed to consider the matrix of sand with fines as a com-
bination of two sub-matrices: a coarse-grain matrix and a
fine-grain matrix. Thevanayagam and Mohan (2000) also
suggest that for fines content Fc (i.e. expressed as a per-
centage of the total weight of the soil specimen) below a
limit in the range of 20–30 %, the contribution of fines in
the force chain is minimal. In this idealization, a simpli-
fying assumption is proposed to consider the fine-grain
Fig. 1 Geotechnical profile of the soil deposit at the site
Environ Earth Sci
123
Author's personal copy
matrix as part of the voids between the coarser grains. By
neglecting the difference in the specific gravity of coarser
and finer particles, Thevanayagam (1998) proposed Eq. (1)
to calculate the intergranular void ratio:
es ¼eþ ðFc=100Þ1� ðFc=100Þ ð1Þ
Monkul and Ozden (2007) studied the compressional
behaviour of clayey and transition fines content suggested
Eq. (2) for the intergranular void ratio. They conclude that
the intergranular void ratio es can be used as an alternative
parameter to study the compressional behaviour of sand–
clay mixtures. Later, Monkul and Yamamuro (2011)
investigated the influence of silt size and content on
liquefaction behaviour of sand mixed with three different
non-plastic silts proposed Eq. (3). They found that
commonly used comparison bases in the literature, such
as void ratio, intergranular void ratio and relative density
are not sufficient alone for assessing the influence of fines
on liquefaction resistance or dilatancy of silty sands:
es ¼eþ ðG=GfÞðFc=100ÞðG=GsÞ 1� Fc=100ð Þ ð2Þ
es ¼eþ ðG=GfÞðFc=100Þ1� ðG=GfÞðFc=100Þð Þ ð3Þ
Table 1 Index properties of sand–silt mixtures
Material Symbol Sand (%) Silt (%) GS D10 (mm) D50 (mm) emin emax Ip (%)
Sand S100M0 100 0 2.680 0.22 0.68 0.535 0.876 –
Silty sand S90M10 90 10 2.682 0.08 0.50 0.472 0.787 –
S80M20 80 20 2.684 0.038 0.43 0.431 0.729 –
S70M30 70 30 2.686 0.022 0.37 0.412 0.704 –
S60M40 60 40 2.688 0.015 0.29 0.478 0.796 –
S50M50 50 50 2.690 0.011 0.08 0.600 0.968 –
Silt S0M100 0 100 2.70 – – 0.72 1.137 5.0
0.001 0.01 0.1 1 10
Soil Particle Diameter (mm)
0
10
20
30
40
50
60
70
80
90
100
Per
cen
t P
assi
ng
by
Wei
gh
t
Sand-silt mixtures
Fc = 0%
Fc = 10%
Fc = 20%
Fc = 30%
Fc = 40%
Fc = 50%
Fig. 2 Grain size distribution curves of the sand–silt mixtures used in
this experimental program
0 10 20 30 40 50
Fines Content, Fc (%)
0.3
0.4
0.5
0.6
0.7
0.8
0.9
1.0
Void
Rat
io In
dex
Sand-silt mixtures
e (Dr = 20%)
e (Dr = 91%)
emin
emax
Fig. 3 Maximum and minimum void ratios sand–silt mixtures versus
fines content
0.40 0.50 0.60 0.70 0.80
Minimum Void Ratio, emin (.)
0.6
0.7
0.8
0.9
1.0
1.1
1.2
1.3
Max
imu
m V
oid
Rat
io, e
max
(.)
This study
Yilmaz and Mollamahmutoglu, (2009)
Cubrinoski and Ishihara, (2002)
Fig. 4 Maximum void ratio versus minimum void ratio of the sand–
silt mixtures
Environ Earth Sci
123
Author's personal copy
where Gs and Gf are the specific gravity of coarser and finer
grains forming the soil respectively. G is the specific
gravity of the sand–silt mixture. Fc is the fines content and
e is the global void ratio. Note that in the Eqs. (2) and (3)
the difference in the specific gravity of coarser and finer
particles is not neglected.
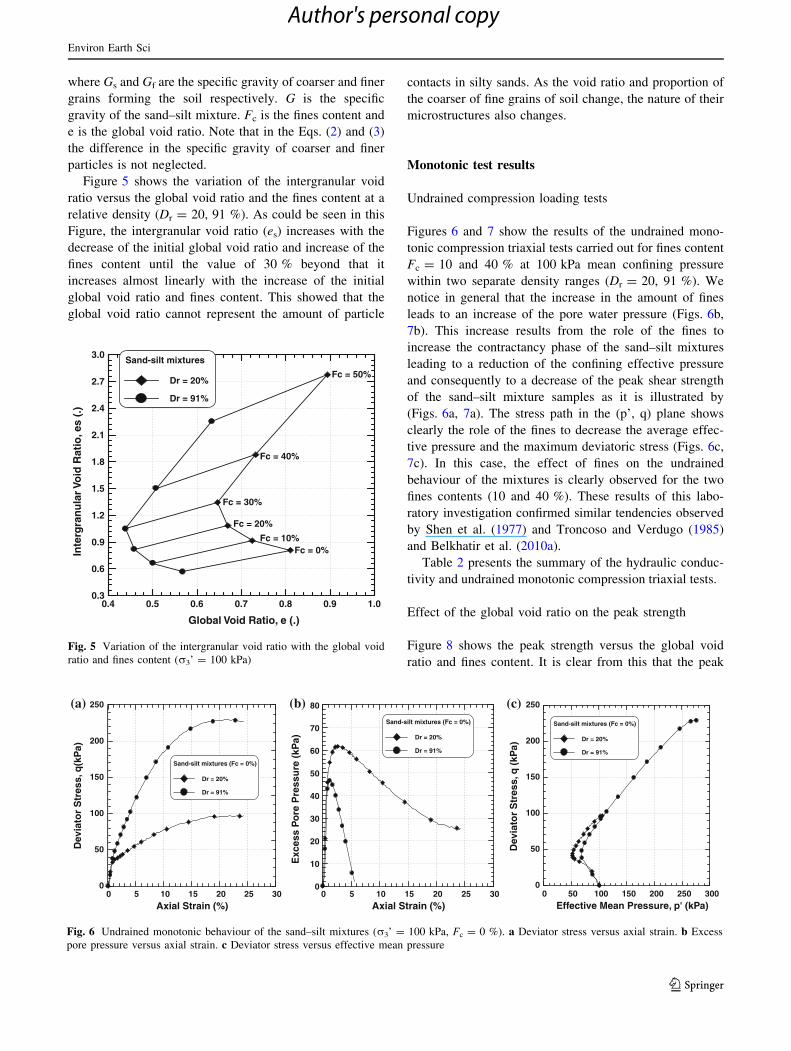
Figure 5 shows the variation of the intergranular void
ratio versus the global void ratio and the fines content at a
relative density (Dr = 20, 91 %). As could be seen in this
Figure, the intergranular void ratio (es) increases with the
decrease of the initial global void ratio and increase of the
fines content until the value of 30 % beyond that it
increases almost linearly with the increase of the initial
global void ratio and fines content. This showed that the
global void ratio cannot represent the amount of particle
contacts in silty sands. As the void ratio and proportion of
the coarser of fine grains of soil change, the nature of their
microstructures also changes.
Monotonic test results
Undrained compression loading tests
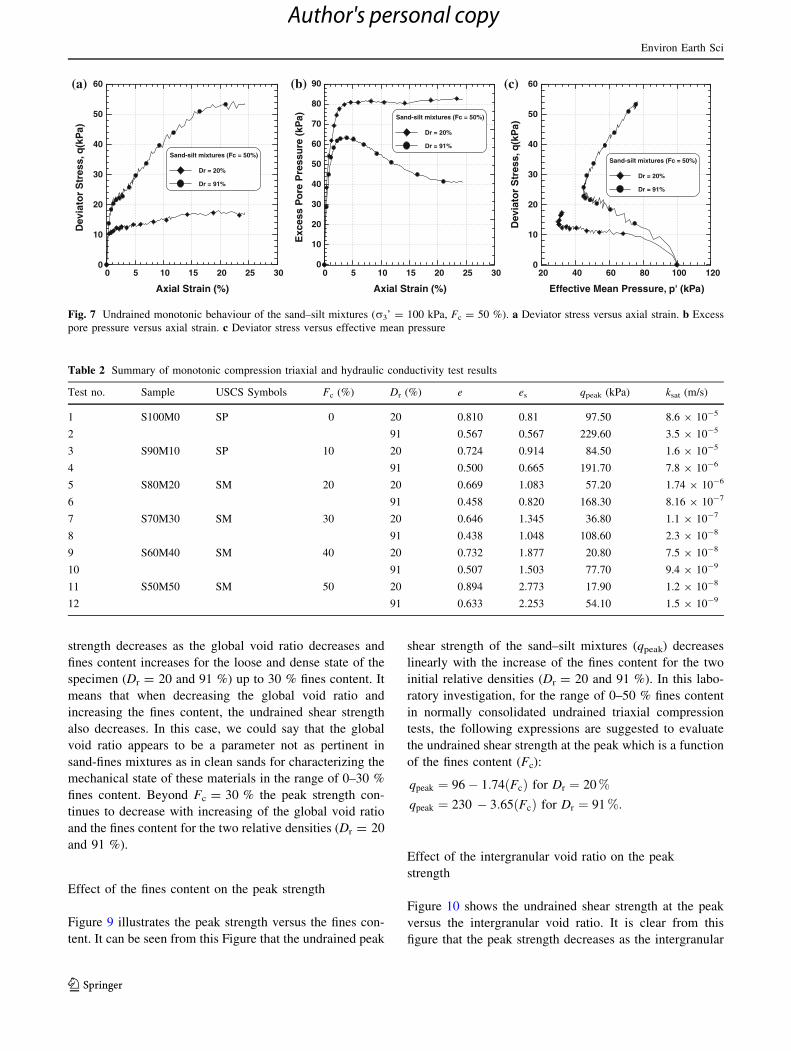
Figures 6 and 7 show the results of the undrained mono-
tonic compression triaxial tests carried out for fines content
Fc = 10 and 40 % at 100 kPa mean confining pressure
within two separate density ranges (Dr = 20, 91 %). We
notice in general that the increase in the amount of fines
leads to an increase of the pore water pressure (Figs. 6b,
7b). This increase results from the role of the fines to
increase the contractancy phase of the sand–silt mixtures
leading to a reduction of the confining effective pressure
and consequently to a decrease of the peak shear strength
of the sand–silt mixture samples as it is illustrated by
(Figs. 6a, 7a). The stress path in the (p’, q) plane shows
clearly the role of the fines to decrease the average effec-
tive pressure and the maximum deviatoric stress (Figs. 6c,
7c). In this case, the effect of fines on the undrained
behaviour of the mixtures is clearly observed for the two
fines contents (10 and 40 %). These results of this labo-
ratory investigation confirmed similar tendencies observed
by Shen et al. (1977) and Troncoso and Verdugo (1985)
and Belkhatir et al. (2010a).
Table 2 presents the summary of the hydraulic conduc-
tivity and undrained monotonic compression triaxial tests.
Effect of the global void ratio on the peak strength
Figure 8 shows the peak strength versus the global void
ratio and fines content. It is clear from this that the peak
0.4 0.5 0.6 0.7 0.8 0.9 1.0 Global Void Ratio, e (.)
0.3
0.6
0.9
1.2
1.5
1.8
2.1
2.4
2.7
3.0
Inte
rgra
nu
lar V
oid
Rat
io, e
s (.
)
Sand-silt mixtures
Dr = 20%
Dr = 91%
Fc = 50%
Fc = 40%
Fc = 30%
Fc = 20%
Fc = 10%Fc = 0%
Fig. 5 Variation of the intergranular void ratio with the global void
ratio and fines content (r3’ = 100 kPa)
Axial Strain (%)
0
50
100
150
200
250
Dev
iato
r S
tres
s, q
(kP
a)
Sand-silt mixtures (Fc = 0%)
Dr = 20%
Dr = 91%
Axial Strain (%)
0
10
20
30
40
50
60
70
80
Exc
ess
Po
re P
ress
ure
(kP
a)
Sand-silt mixtures (Fc = 0%)
Dr = 20%
Dr = 91%
0 5 10 15 20 25 30 0 5 10 15 20 25 30 0 50 100 150 200 250 300Effective Mean Pressure, p' (kPa)
0
50
100
150
200
250
Dev
iato
r S
tres
s, q
(kP
a)
Sand-silt mixtures (Fc = 0%)
Dr = 20%
Dr = 91%
(a) (b) (c)
Fig. 6 Undrained monotonic behaviour of the sand–silt mixtures (r3’ = 100 kPa, Fc = 0 %). a Deviator stress versus axial strain. b Excess
pore pressure versus axial strain. c Deviator stress versus effective mean pressure
Environ Earth Sci
123
Author's personal copy
strength decreases as the global void ratio decreases and
fines content increases for the loose and dense state of the
specimen (Dr = 20 and 91 %) up to 30 % fines content. It
means that when decreasing the global void ratio and
increasing the fines content, the undrained shear strength
also decreases. In this case, we could say that the global
void ratio appears to be a parameter not as pertinent in
sand-fines mixtures as in clean sands for characterizing the
mechanical state of these materials in the range of 0–30 %
fines content. Beyond Fc = 30 % the peak strength con-
tinues to decrease with increasing of the global void ratio
and the fines content for the two relative densities (Dr = 20
and 91 %).
Effect of the fines content on the peak strength
Figure 9 illustrates the peak strength versus the fines con-
tent. It can be seen from this Figure that the undrained peak
shear strength of the sand–silt mixtures (qpeak) decreases
linearly with the increase of the fines content for the two
initial relative densities (Dr = 20 and 91 %). In this labo-
ratory investigation, for the range of 0–50 % fines content
in normally consolidated undrained triaxial compression
tests, the following expressions are suggested to evaluate
the undrained shear strength at the peak which is a function
of the fines content (Fc):
qpeak ¼ 96� 1:74 Fcð Þ for Dr ¼ 20 %
qpeak ¼ 230 � 3:65 Fcð Þ for Dr ¼ 91 %:
Effect of the intergranular void ratio on the peak
strength
Figure 10 shows the undrained shear strength at the peak
versus the intergranular void ratio. It is clear from this
figure that the peak strength decreases as the intergranular
Axial Strain (%)
0
10
20
30
40
50
60D
evia
tor
Str
ess,
q(k
Pa)
Sand-silt mixtures (Fc = 50%)
Dr = 20%
Dr = 91%
Axial Strain (%)
0
10
20
30
40
50
60
70
80
90
Exc
ess
Po
re P
ress
ure
(kP
a) Sand-silt mixtures (Fc = 50%)
Dr = 20%
Dr = 91%
0 5 10 15 20 25 30 0 5 10 15 20 25 30 20 40 60 80 100 120
Effective Mean Pressure, p' (kPa)
0
10
20
30
40
50
60
Dev
iato
r S
tres
s, q
(kP
a)
Sand-silt mixtures (Fc = 50%)
Dr = 20%
Dr = 91%
(a) (b) (c)
Fig. 7 Undrained monotonic behaviour of the sand–silt mixtures (r3’ = 100 kPa, Fc = 50 %). a Deviator stress versus axial strain. b Excess
pore pressure versus axial strain. c Deviator stress versus effective mean pressure
Table 2 Summary of monotonic compression triaxial and hydraulic conductivity test results
Test no. Sample USCS Symbols Fc (%) Dr (%) e es qpeak (kPa) ksat (m/s)
1 S100M0 SP 0 20 0.810 0.81 97.50 8.6 9 10-5
2 91 0.567 0.567 229.60 3.5 9 10-5
3 S90M10 SP 10 20 0.724 0.914 84.50 1.6 9 10-5
4 91 0.500 0.665 191.70 7.8 9 10-6
5 S80M20 SM 20 20 0.669 1.083 57.20 1.74 9 10-6
6 91 0.458 0.820 168.30 8.16 9 10-7
7 S70M30 SM 30 20 0.646 1.345 36.80 1.1 9 10-7
8 91 0.438 1.048 108.60 2.3 9 10-8
9 S60M40 SM 40 20 0.732 1.877 20.80 7.5 9 10-8
10 91 0.507 1.503 77.70 9.4 9 10-9
11 S50M50 SM 50 20 0.894 2.773 17.90 1.2 9 10-8
12 91 0.633 2.253 54.10 1.5 9 10-9
Environ Earth Sci
123
Author's personal copy
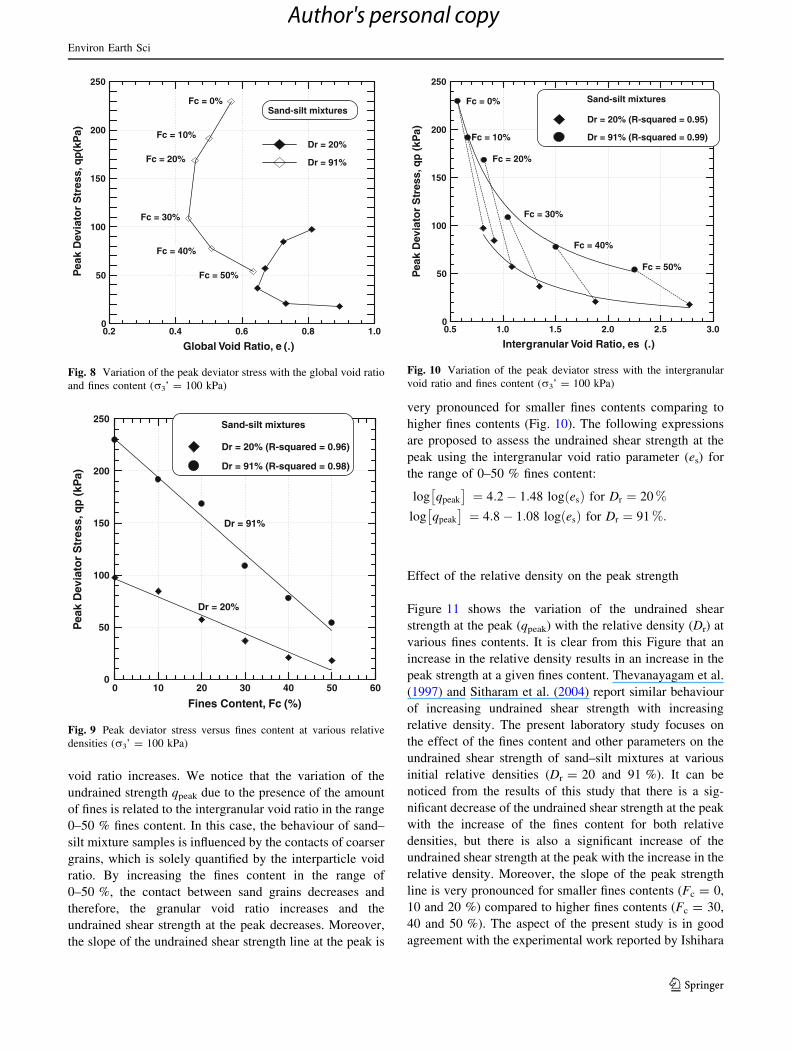
void ratio increases. We notice that the variation of the
undrained strength qpeak due to the presence of the amount
of fines is related to the intergranular void ratio in the range
0–50 % fines content. In this case, the behaviour of sand–
silt mixture samples is influenced by the contacts of coarser
grains, which is solely quantified by the interparticle void
ratio. By increasing the fines content in the range of
0–50 %, the contact between sand grains decreases and
therefore, the granular void ratio increases and the
undrained shear strength at the peak decreases. Moreover,
the slope of the undrained shear strength line at the peak is
very pronounced for smaller fines contents comparing to
higher fines contents (Fig. 10). The following expressions
are proposed to assess the undrained shear strength at the
peak using the intergranular void ratio parameter (es) for
the range of 0–50 % fines content:
log qpeak
� �¼ 4:2� 1:48 log esð Þ for Dr ¼ 20 %
log qpeak
� �¼ 4:8� 1:08 log esð Þ for Dr ¼ 91 %:
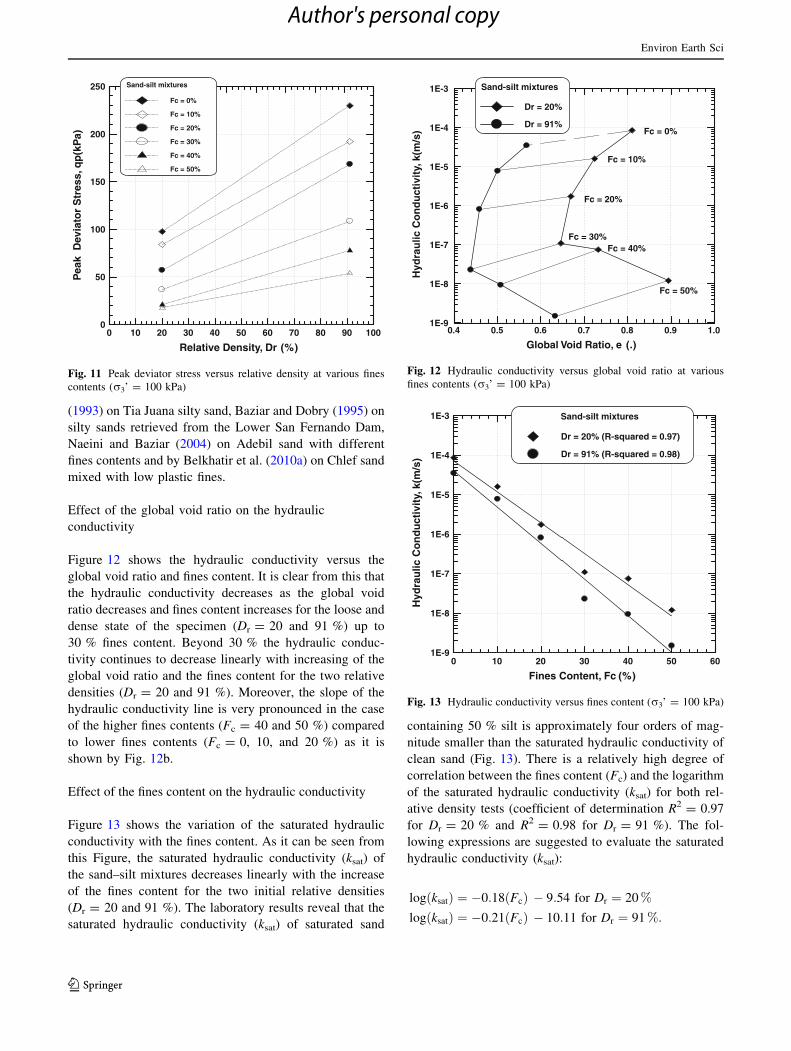
Effect of the relative density on the peak strength
Figure 11 shows the variation of the undrained shear
strength at the peak (qpeak) with the relative density (Dr) at
various fines contents. It is clear from this Figure that an
increase in the relative density results in an increase in the
peak strength at a given fines content. Thevanayagam et al.
(1997) and Sitharam et al. (2004) report similar behaviour
of increasing undrained shear strength with increasing
relative density. The present laboratory study focuses on
the effect of the fines content and other parameters on the
undrained shear strength of sand–silt mixtures at various
initial relative densities (Dr = 20 and 91 %). It can be
noticed from the results of this study that there is a sig-
nificant decrease of the undrained shear strength at the peak
with the increase of the fines content for both relative
densities, but there is also a significant increase of the
undrained shear strength at the peak with the increase in the
relative density. Moreover, the slope of the peak strength
line is very pronounced for smaller fines contents (Fc = 0,
10 and 20 %) compared to higher fines contents (Fc = 30,
40 and 50 %). The aspect of the present study is in good
agreement with the experimental work reported by Ishihara
0.2 0.4 0.6 0.8 1.0
Global Void Ratio, e (.)
0
50
100
150
200
250P
eak
Dev
iato
r S
tres
s, q
p(k
Pa)
Sand-silt mixturesFc = 0%
Fc = 10%
Fc = 20%
Fc = 30%
Fc = 40%
Fc = 50%
Dr = 20%
Dr = 91%
Fig. 8 Variation of the peak deviator stress with the global void ratio
and fines content (r3’ = 100 kPa)
0 10 20 30 40 50 60
Fines Content, Fc (%)
0
50
100
150
200
250
Pea
k D
evia
tor
Str
ess,
qp
(kP
a)
Sand-silt mixtures
Dr = 20% (R-squared = 0.96)
Dr = 91% (R-squared = 0.98)
Dr = 20%
Dr = 91%
Fig. 9 Peak deviator stress versus fines content at various relative
densities (r3’ = 100 kPa)
0.5 1.0 1.5 2.0 2.5 3.0
Intergranular Void Ratio, es (.)
0
50
100
150
200
250
Pea
k D
evia
tor
Str
ess,
qp
(kP
a)
Fc = 0%
Fc = 10%
Fc = 20%
Fc = 30%
Fc = 40%
Fc = 50%
Sand-silt mixtures
Dr = 20% (R-squared = 0.95)
Dr = 91% (R-squared = 0.99)
Fig. 10 Variation of the peak deviator stress with the intergranular
void ratio and fines content (r3’ = 100 kPa)
Environ Earth Sci
123
Author's personal copy
(1993) on Tia Juana silty sand, Baziar and Dobry (1995) on
silty sands retrieved from the Lower San Fernando Dam,
Naeini and Baziar (2004) on Adebil sand with different
fines contents and by Belkhatir et al. (2010a) on Chlef sand
mixed with low plastic fines.
Effect of the global void ratio on the hydraulic
conductivity
Figure 12 shows the hydraulic conductivity versus the
global void ratio and fines content. It is clear from this that
the hydraulic conductivity decreases as the global void
ratio decreases and fines content increases for the loose and
dense state of the specimen (Dr = 20 and 91 %) up to
30 % fines content. Beyond 30 % the hydraulic conduc-
tivity continues to decrease linearly with increasing of the
global void ratio and the fines content for the two relative
densities (Dr = 20 and 91 %). Moreover, the slope of the
hydraulic conductivity line is very pronounced in the case
of the higher fines contents (Fc = 40 and 50 %) compared
to lower fines contents (Fc = 0, 10, and 20 %) as it is
shown by Fig. 12b.
Effect of the fines content on the hydraulic conductivity
Figure 13 shows the variation of the saturated hydraulic
conductivity with the fines content. As it can be seen from
this Figure, the saturated hydraulic conductivity (ksat) of
the sand–silt mixtures decreases linearly with the increase
of the fines content for the two initial relative densities
(Dr = 20 and 91 %). The laboratory results reveal that the
saturated hydraulic conductivity (ksat) of saturated sand
containing 50 % silt is approximately four orders of mag-
nitude smaller than the saturated hydraulic conductivity of
clean sand (Fig. 13). There is a relatively high degree of
correlation between the fines content (Fc) and the logarithm
of the saturated hydraulic conductivity (ksat) for both rel-
ative density tests (coefficient of determination R2 = 0.97
for Dr = 20 % and R2 = 0.98 for Dr = 91 %). The fol-
lowing expressions are suggested to evaluate the saturated
hydraulic conductivity (ksat):
log ksatð Þ ¼ �0:18 Fcð Þ � 9:54 for Dr ¼ 20 %
log ksatð Þ ¼ �0:21 Fcð Þ � 10:11 for Dr ¼ 91 %:
0 10 20 30 40 50 60 70 80 90 100
Relative Density, Dr (%)
0
50
100
150
200
250P
eak
Dev
iato
r S
tres
s, q
p(k
Pa)
Sand-silt mixtures
Fc = 0%
Fc = 10%
Fc = 20%
Fc = 30%
Fc = 40%
Fc = 50%
Fig. 11 Peak deviator stress versus relative density at various fines
contents (r3’ = 100 kPa)
0.4 0.5 0.6 0.7 0.8 0.9 1.0
Global Void Ratio, e (.)
1E-9
1E-8
1E-7
1E-6
1E-5
1E-4
1E-3
Hyd
rau
lic C
on
du
ctiv
ity,
k(m
/s)
Sand-silt mixtures
Dr = 20%
Dr = 91%Fc = 0%
Fc = 10%
Fc = 20%
Fc = 30%Fc = 40%
Fc = 50%
Fig. 12 Hydraulic conductivity versus global void ratio at various
fines contents (r3’ = 100 kPa)
0 10 20 30 40 50 60
Fines Content, Fc (%)
1E-9
1E-8
1E-7
1E-6
1E-5
1E-4
1E-3H
ydra
ulic
Co
nd
uct
ivit
y, k
(m/s
)Sand-silt mixtures
Dr = 20% (R-squared = 0.97)
Dr = 91% (R-squared = 0.98)
Fig. 13 Hydraulic conductivity versus fines content (r3’ = 100 kPa)
Environ Earth Sci
123
Author's personal copy
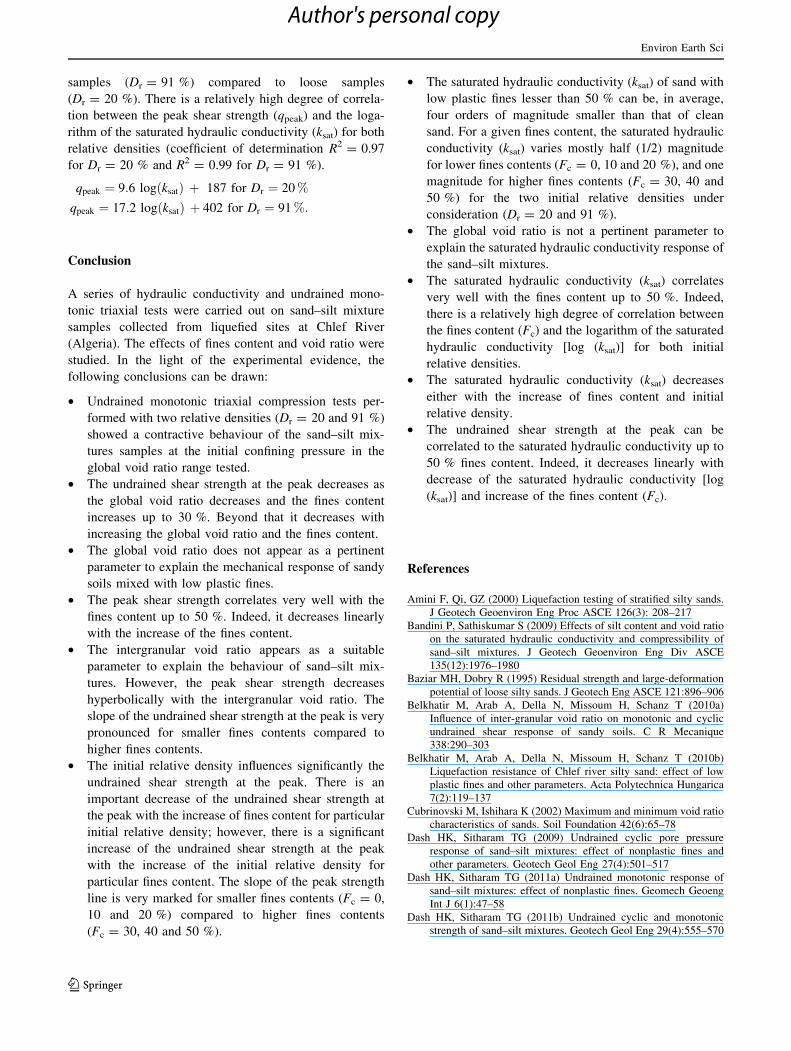
Effect of the intergranular void ratio on the hydraulic
conductivity
Figure 14 presents the saturated hydraulic conductivity
(ksat) versus the intergranular void ratio. It is clear from this
Figure that the saturated hydraulic conductivity decreases
linearly in a significant manner until 30 % fines content
with the increase of the intergranular void ratio. After that
it continues to decrease moderately for both densities
(Dr = 20 and 91 %). Moreover, the slope of the saturated
hydraulic conductivity line is very pronounced for higher
fines contents (intergranular void ratio) comparing to lower
fines contents (Fig. 14).
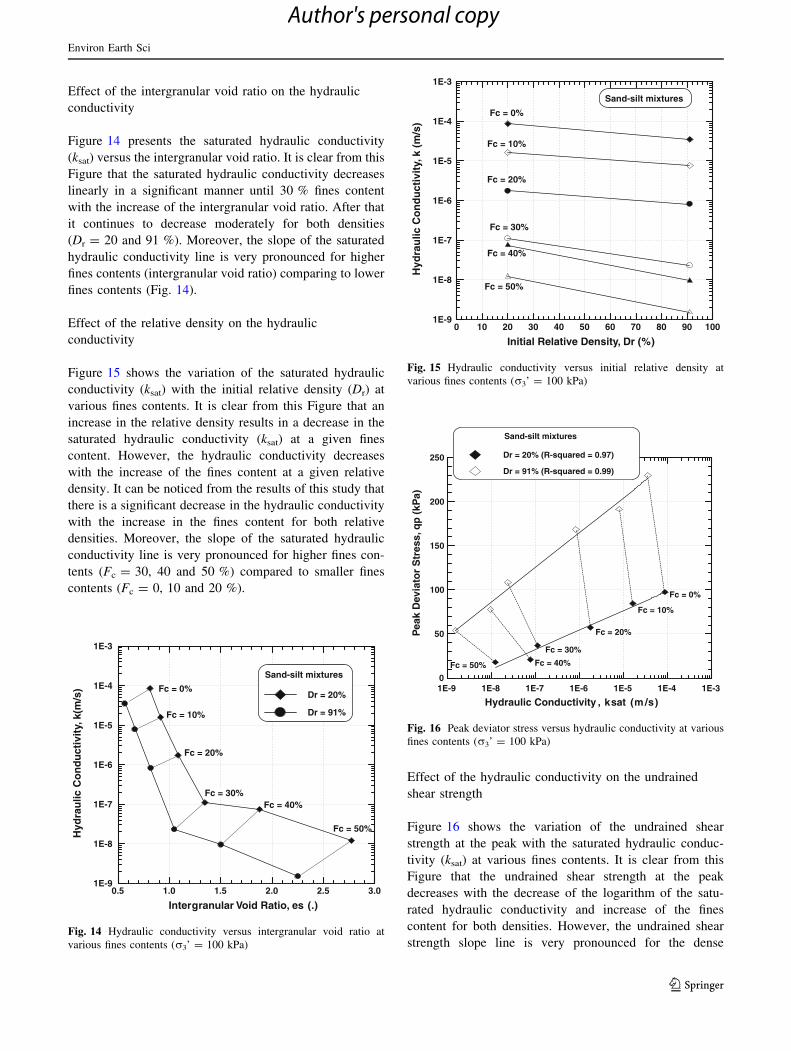
Effect of the relative density on the hydraulic
conductivity
Figure 15 shows the variation of the saturated hydraulic
conductivity (ksat) with the initial relative density (Dr) at
various fines contents. It is clear from this Figure that an
increase in the relative density results in a decrease in the
saturated hydraulic conductivity (ksat) at a given fines
content. However, the hydraulic conductivity decreases
with the increase of the fines content at a given relative
density. It can be noticed from the results of this study that
there is a significant decrease in the hydraulic conductivity
with the increase in the fines content for both relative
densities. Moreover, the slope of the saturated hydraulic
conductivity line is very pronounced for higher fines con-
tents (Fc = 30, 40 and 50 %) compared to smaller fines
contents (Fc = 0, 10 and 20 %).
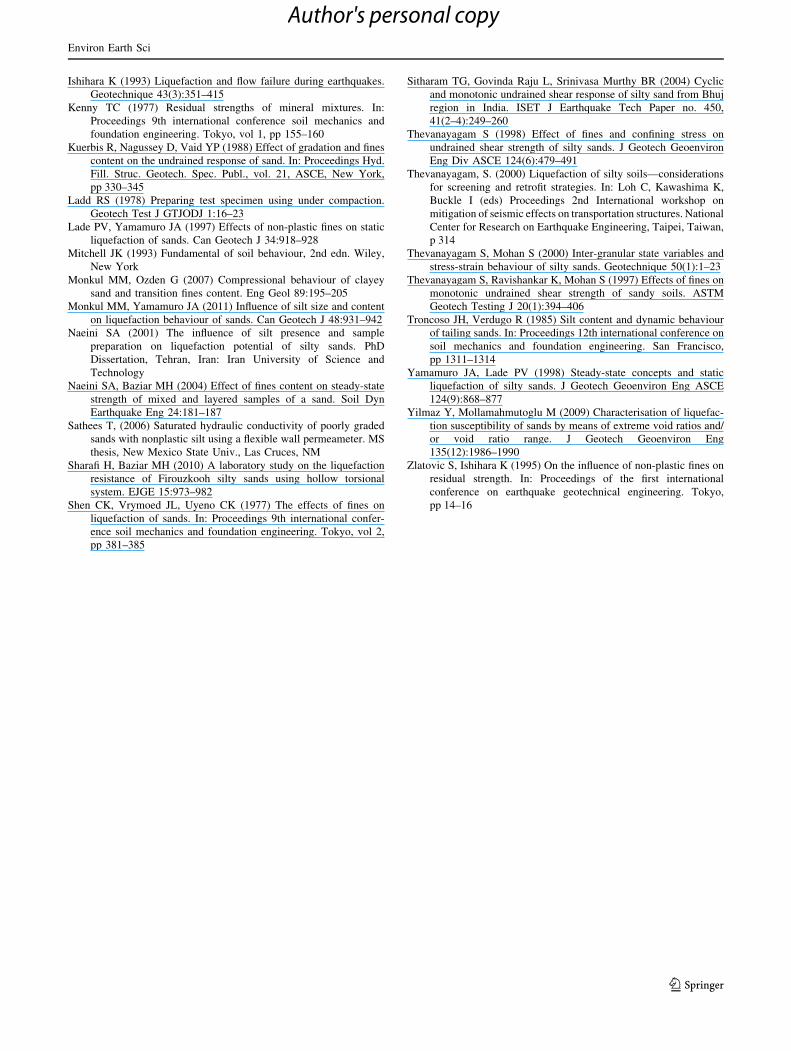
Effect of the hydraulic conductivity on the undrained
shear strength
Figure 16 shows the variation of the undrained shear
strength at the peak with the saturated hydraulic conduc-
tivity (ksat) at various fines contents. It is clear from this
Figure that the undrained shear strength at the peak
decreases with the decrease of the logarithm of the satu-
rated hydraulic conductivity and increase of the fines
content for both densities. However, the undrained shear
strength slope line is very pronounced for the dense
0.5 1.0 1.5 2.0 2.5 3.0
Intergranular Void Ratio, es (.)
1E-9
1E-8
1E-7
1E-6
1E-5
1E-4
1E-3
Hyd
rau
lic C
on
du
ctiv
ity,
k(m
/s)
Sand-silt mixtures
Dr = 20%
Dr = 91%
Fc = 0%
Fc = 10%
Fc = 20%
Fc = 30%Fc = 40%
Fc = 50%
Fig. 14 Hydraulic conductivity versus intergranular void ratio at
various fines contents (r3’ = 100 kPa)
0 10 20 30 40 50 60 70 80 90 100
Initial Relative Density, Dr (%)
1E-9
1E-8
1E-7
1E-6
1E-5
1E-4
1E-3
Hyd
rau
lic C
on
du
ctiv
ity,
k (
m/s
)
Sand-silt mixtures
Fc = 0%
Fc = 10%
Fc = 20%
Fc = 30%
Fc = 40%
Fc = 50%
Fig. 15 Hydraulic conductivity versus initial relative density at
various fines contents (r3’ = 100 kPa)
1E-9 1E-8 1E-7 1E-6 1E-5 1E-4 1E-3
Hydraulic Conductivity , ksat (m /s)
0
50
100
150
200
250
Pea
k D
evia
tor
Str
ess,
qp
(kP
a)
Fc = 0%
Fc = 10%
Fc = 20%
Fc = 30%
Fc = 40%Fc = 50%
Sand-silt mixtures
Dr = 20% (R-squared = 0.97)
Dr = 91% (R-squared = 0.99)
Fig. 16 Peak deviator stress versus hydraulic conductivity at various
fines contents (r3’ = 100 kPa)
Environ Earth Sci
123
Author's personal copy
samples (Dr = 91 %) compared to loose samples
(Dr = 20 %). There is a relatively high degree of correla-
tion between the peak shear strength (qpeak) and the loga-
rithm of the saturated hydraulic conductivity (ksat) for both
relative densities (coefficient of determination R2 = 0.97
for Dr = 20 % and R2 = 0.99 for Dr = 91 %).
qpeak ¼ 9:6 log ksatð Þ þ 187 for Dr ¼ 20 %
qpeak ¼ 17:2 log ksatð Þ þ 402 for Dr ¼ 91 %:
Conclusion
A series of hydraulic conductivity and undrained mono-
tonic triaxial tests were carried out on sand–silt mixture
samples collected from liquefied sites at Chlef River
(Algeria). The effects of fines content and void ratio were
studied. In the light of the experimental evidence, the
following conclusions can be drawn:
• Undrained monotonic triaxial compression tests per-
formed with two relative densities (Dr = 20 and 91 %)
showed a contractive behaviour of the sand–silt mix-
tures samples at the initial confining pressure in the
global void ratio range tested.
• The undrained shear strength at the peak decreases as
the global void ratio decreases and the fines content
increases up to 30 %. Beyond that it decreases with
increasing the global void ratio and the fines content.
• The global void ratio does not appear as a pertinent
parameter to explain the mechanical response of sandy
soils mixed with low plastic fines.
• The peak shear strength correlates very well with the
fines content up to 50 %. Indeed, it decreases linearly
with the increase of the fines content.
• The intergranular void ratio appears as a suitable
parameter to explain the behaviour of sand–silt mix-
tures. However, the peak shear strength decreases
hyperbolically with the intergranular void ratio. The
slope of the undrained shear strength at the peak is very
pronounced for smaller fines contents compared to
higher fines contents.
• The initial relative density influences significantly the
undrained shear strength at the peak. There is an
important decrease of the undrained shear strength at
the peak with the increase of fines content for particular
initial relative density; however, there is a significant
increase of the undrained shear strength at the peak
with the increase of the initial relative density for
particular fines content. The slope of the peak strength
line is very marked for smaller fines contents (Fc = 0,
10 and 20 %) compared to higher fines contents
(Fc = 30, 40 and 50 %).
• The saturated hydraulic conductivity (ksat) of sand with
low plastic fines lesser than 50 % can be, in average,
four orders of magnitude smaller than that of clean
sand. For a given fines content, the saturated hydraulic
conductivity (ksat) varies mostly half (1/2) magnitude
for lower fines contents (Fc = 0, 10 and 20 %), and one
magnitude for higher fines contents (Fc = 30, 40 and
50 %) for the two initial relative densities under
consideration (Dr = 20 and 91 %).
• The global void ratio is not a pertinent parameter to
explain the saturated hydraulic conductivity response of
the sand–silt mixtures.
• The saturated hydraulic conductivity (ksat) correlates
very well with the fines content up to 50 %. Indeed,
there is a relatively high degree of correlation between
the fines content (Fc) and the logarithm of the saturated
hydraulic conductivity [log (ksat)] for both initial
relative densities.
• The saturated hydraulic conductivity (ksat) decreases
either with the increase of fines content and initial
relative density.
• The undrained shear strength at the peak can be
correlated to the saturated hydraulic conductivity up to
50 % fines content. Indeed, it decreases linearly with
decrease of the saturated hydraulic conductivity [log
(ksat)] and increase of the fines content (Fc).
References
Amini F, Qi, GZ (2000) Liquefaction testing of stratified silty sands.
J Geotech Geoenviron Eng Proc ASCE 126(3): 208–217
Bandini P, Sathiskumar S (2009) Effects of silt content and void ratio
on the saturated hydraulic conductivity and compressibility of
sand–silt mixtures. J Geotech Geoenviron Eng Div ASCE
135(12):1976–1980
Baziar MH, Dobry R (1995) Residual strength and large-deformation
potential of loose silty sands. J Geotech Eng ASCE 121:896–906
Belkhatir M, Arab A, Della N, Missoum H, Schanz T (2010a)
Influence of inter-granular void ratio on monotonic and cyclic
undrained shear response of sandy soils. C R Mecanique
338:290–303
Belkhatir M, Arab A, Della N, Missoum H, Schanz T (2010b)
Liquefaction resistance of Chlef river silty sand: effect of low
plastic fines and other parameters. Acta Polytechnica Hungarica
7(2):119–137
Cubrinovski M, Ishihara K (2002) Maximum and minimum void ratio
characteristics of sands. Soil Foundation 42(6):65–78
Dash HK, Sitharam TG (2009) Undrained cyclic pore pressure
response of sand–silt mixtures: effect of nonplastic fines and
other parameters. Geotech Geol Eng 27(4):501–517
Dash HK, Sitharam TG (2011a) Undrained monotonic response of
sand–silt mixtures: effect of nonplastic fines. Geomech Geoeng
Int J 6(1):47–58
Dash HK, Sitharam TG (2011b) Undrained cyclic and monotonic
strength of sand–silt mixtures. Geotech Geol Eng 29(4):555–570
Environ Earth Sci
123
Author's personal copy
Ishihara K (1993) Liquefaction and flow failure during earthquakes.
Geotechnique 43(3):351–415
Kenny TC (1977) Residual strengths of mineral mixtures. In:
Proceedings 9th international conference soil mechanics and
foundation engineering. Tokyo, vol 1, pp 155–160
Kuerbis R, Nagussey D, Vaid YP (1988) Effect of gradation and fines
content on the undrained response of sand. In: Proceedings Hyd.
Fill. Struc. Geotech. Spec. Publ., vol. 21, ASCE, New York,
pp 330–345
Ladd RS (1978) Preparing test specimen using under compaction.
Geotech Test J GTJODJ 1:16–23
Lade PV, Yamamuro JA (1997) Effects of non-plastic fines on static
liquefaction of sands. Can Geotech J 34:918–928
Mitchell JK (1993) Fundamental of soil behaviour, 2nd edn. Wiley,
New York
Monkul MM, Ozden G (2007) Compressional behaviour of clayey
sand and transition fines content. Eng Geol 89:195–205
Monkul MM, Yamamuro JA (2011) Influence of silt size and content
on liquefaction behaviour of sands. Can Geotech J 48:931–942
Naeini SA (2001) The influence of silt presence and sample
preparation on liquefaction potential of silty sands. PhD
Dissertation, Tehran, Iran: Iran University of Science and
Technology
Naeini SA, Baziar MH (2004) Effect of fines content on steady-state
strength of mixed and layered samples of a sand. Soil Dyn
Earthquake Eng 24:181–187
Sathees T, (2006) Saturated hydraulic conductivity of poorly graded
sands with nonplastic silt using a flexible wall permeameter. MS
thesis, New Mexico State Univ., Las Cruces, NM
Sharafi H, Baziar MH (2010) A laboratory study on the liquefaction
resistance of Firouzkooh silty sands using hollow torsional
system. EJGE 15:973–982
Shen CK, Vrymoed JL, Uyeno CK (1977) The effects of fines on
liquefaction of sands. In: Proceedings 9th international confer-
ence soil mechanics and foundation engineering. Tokyo, vol 2,
pp 381–385
Sitharam TG, Govinda Raju L, Srinivasa Murthy BR (2004) Cyclic
and monotonic undrained shear response of silty sand from Bhuj
region in India. ISET J Earthquake Tech Paper no. 450,
41(2–4):249–260
Thevanayagam S (1998) Effect of fines and confining stress on
undrained shear strength of silty sands. J Geotech Geoenviron
Eng Div ASCE 124(6):479–491
Thevanayagam, S. (2000) Liquefaction of silty soils—considerations
for screening and retrofit strategies. In: Loh C, Kawashima K,
Buckle I (eds) Proceedings 2nd International workshop on
mitigation of seismic effects on transportation structures. National
Center for Research on Earthquake Engineering, Taipei, Taiwan,
p 314
Thevanayagam S, Mohan S (2000) Inter-granular state variables and
stress-strain behaviour of silty sands. Geotechnique 50(1):1–23
Thevanayagam S, Ravishankar K, Mohan S (1997) Effects of fines on
monotonic undrained shear strength of sandy soils. ASTM
Geotech Testing J 20(1):394–406
Troncoso JH, Verdugo R (1985) Silt content and dynamic behaviour
of tailing sands. In: Proceedings 12th international conference on
soil mechanics and foundation engineering. San Francisco,
pp 1311–1314
Yamamuro JA, Lade PV (1998) Steady-state concepts and static
liquefaction of silty sands. J Geotech Geoenviron Eng ASCE
124(9):868–877
Yilmaz Y, Mollamahmutoglu M (2009) Characterisation of liquefac-
tion susceptibility of sands by means of extreme void ratios and/
or void ratio range. J Geotech Geoenviron Eng
135(12):1986–1990
Zlatovic S, Ishihara K (1995) On the influence of non-plastic fines on
residual strength. In: Proceedings of the first international
conference on earthquake geotechnical engineering. Tokyo,
pp 14–16
Environ Earth Sci
123
Author's personal copy
Related Documents