Int. J. Electrochem. Sci., 14 (2019) 662 – 678, doi: 10.20964/2019.01.60 International Journal of ELECTROCHEMICAL SCIENCE www.electrochemsci.org Effect of Electrolysis Parameters on the Specific Surface Area of Nickel Powder: Optimization using Box-Behnken Design Ali H. Abbar Chemical Engineering Department, University of Al-Qadisiyah, Iraq E-mail: [email protected], [email protected] Received: 3 September 2018 / Accepted: 4 November 2018 / Published: 30 November 2018 The effect of three electrolysis operating parameters on the specific surface area of electrolytic nickel powder was investigated by adopting response surface methodology approach. Box-Behnken design was selected to optimize the electrodeposition process and to estimate the effects and interactions of current density, nickel sulfate concentration, and temperature. BETS, XRD-diffraction, optical microscopy, and atomic force microscopy (AFM) were used to characterize the nickel powder. The results revealed that the current density has the major effect on the specific surface area of nickel powder followed by nickel sulfate concentration. No significant effect of temperature was observed. The optimum conditions for producing nickel powder at a maximum specific surface area of 1.05m 2 g -1 with an average particle size of 680.65 nm were a current density of 500 mAcm -2 , nickel sulfate concentration of 20 g L -1 , and an operating temperature of 38 °C. The corresponding current efficiency and energy consumption were 30%, 24.0 kWh kg -1 respectively. The prepared powder has better specifications than the industrial type (Type 255-carbonyl process). Analysis of variance (ANOVA) showed a high coefficient of determination (R 2 ) value of 0.978, thus ensuring an adequately adjustment of the second-order regression model with the experimental data. The conformity results proved that the Box-Behnken design could be efficiently used to optimize the process parameters for the electrolytic preparation of metal powders. Keywords: electrodeposition, nickel powder, surface area, Box–Behnken design, optimization 1. INTRODUCTION Nickel (Ni) powder has significant industrial applications. It is commonly used in the fabrication of electrodes for fuel cells, in the preparation of skeletons of the active material for alkaline batteries, anticorrosion paints, as catalysts in the chemical industries, and additionally several other applications that depend on the magnetic properties of nickel powder [1]. In powder metallurgy, mixtures of nickel and cobalt powders are used as constituents of metal-cutting and drilling hard metals. Nickel nanoparticles are used for targeted transfer of pharmaceutical and biologically active substances in

Welcome message from author
This document is posted to help you gain knowledge. Please leave a comment to let me know what you think about it! Share it to your friends and learn new things together.
Transcript
Int. J. Electrochem. Sci., 14 (2019) 662 – 678, doi: 10.20964/2019.01.60
International Journal of
ELECTROCHEMICAL SCIENCE
www.electrochemsci.org
Effect of Electrolysis Parameters on the Specific Surface Area of
Nickel Powder: Optimization using Box-Behnken Design
Ali H. Abbar
Chemical Engineering Department, University of Al-Qadisiyah, Iraq
E-mail: [email protected], [email protected]
Received: 3 September 2018 / Accepted: 4 November 2018 / Published: 30 November 2018
The effect of three electrolysis operating parameters on the specific surface area of electrolytic nickel
powder was investigated by adopting response surface methodology approach. Box-Behnken design was
selected to optimize the electrodeposition process and to estimate the effects and interactions of current
density, nickel sulfate concentration, and temperature. BETS, XRD-diffraction, optical microscopy, and
atomic force microscopy (AFM) were used to characterize the nickel powder. The results revealed that
the current density has the major effect on the specific surface area of nickel powder followed by nickel
sulfate concentration. No significant effect of temperature was observed. The optimum conditions for
producing nickel powder at a maximum specific surface area of 1.05m2 g-1 with an average particle size
of 680.65 nm were a current density of 500 mAcm-2, nickel sulfate concentration of 20 g L-1, and an
operating temperature of 38 °C. The corresponding current efficiency and energy consumption were
30%, 24.0 kWh kg-1 respectively. The prepared powder has better specifications than the industrial type
(Type 255-carbonyl process). Analysis of variance (ANOVA) showed a high coefficient of
determination (R2) value of 0.978, thus ensuring an adequately adjustment of the second-order regression
model with the experimental data. The conformity results proved that the Box-Behnken design could be
efficiently used to optimize the process parameters for the electrolytic preparation of metal powders.
Keywords: electrodeposition, nickel powder, surface area, Box–Behnken design, optimization
1. INTRODUCTION
Nickel (Ni) powder has significant industrial applications. It is commonly used in the fabrication
of electrodes for fuel cells, in the preparation of skeletons of the active material for alkaline batteries,
anticorrosion paints, as catalysts in the chemical industries, and additionally several other applications
that depend on the magnetic properties of nickel powder [1]. In powder metallurgy, mixtures of nickel
and cobalt powders are used as constituents of metal-cutting and drilling hard metals. Nickel
nanoparticles are used for targeted transfer of pharmaceutical and biologically active substances in
Int. J. Electrochem. Sci., Vol. 14, 2019
663
medicine and biology [2]. Suspensions of cobalt and nickel powders are used as oil additives for in-
process repair of worn-out parts of automobile [3].
Ni powder can be made by different methods including the decomposition of nickel carbonyl,
reduction of aqueous solution of a nickel salt with hydrogen under pressure (hydrometallurgical Sherritt
process), water atomization of molten nickel, and electrochemical method [4]. Hydrometallurgical and
atomization methods give relatively large particles and it is difficult to produce fine particle sizes
economically while the other two methods give much finer particles [5].
The Electrochemical method provides Ni powders with particle size ranging from a few
nanometers to several micrometers based on the operating conditions of the electrodeposition process.
The main properties of the electrolytic Ni powder are dendritic shape of the particles, good
compressibility, and the highest purity. By selecting the appropriate process parameters such as metal
ion concentration, pH of the electrolyte, current density, cathode potential, temperature, type of the anode
and cathode, and the distance between them, it is possible to control the crystallization mechanism to
acquire the required shape and size of powder particles [6].
Ni powder electrodeposition was performed using two types of electrolyte: Acid electrolytes [7-
9] and ammoniacal electrolytes [10-15]. The characteristic of acid electrolytes is that decreasing the
nickel ion concentration in solution and increasing current density result in reducing the powder fragility.
However, no oxides and basic salts existing in the structure of this powder and it could be stored in a dry
place for an indefinite period without structure change or oxidation. For ammoniacal electrolytes, using
of higher concentration of ammonia results in producing disperse and pure (without hydroxide
impurities) nickel deposits [16]. A number of researchers [17-19] have recommended sulphate-chloride
or all-chloride electrolytes for nickel powder electrodeposition. However, using such electrolytes is not
always justified due to the unequal of the cathodic and anodic current efficiencies when nickel anodes
are used, hence a necessary correction of nickel ion concentration is required for keeping a constant
electrolyte composition during electrolysis. The use of all-sulphate electrolytes overcomes these
shortcomings and gives superior results than sulphate-chloride electrolytes in spite of their lower
electrical conductivity in comparison with sulphate-chloride or chloride electrolytes. [20].
Intensive studies have been conducted on the Nickel powder electrodeposition, most of these
studies concerned with the investigation of the morphological structure (XRD, EDS, SEM) of Ni
powders [8,14,16,21], while fewer studies were devoted to investigate the effect of operating variables
on the particle size and apparent density of nickel powder [9,12,13,15,22]. However, no information is
available on the effect of operating variables like current density, metal ion concentration, pH, and
temperature on the specific surface area of Ni powder. Specific surface area as the most important
physical property of Ni powder has an important effect on the physical and mechanical behavior of the
powder metallurgy products prepared from this powder that have been used in different applications like
electrical applications [23]. Therefore the investigation of the mutual effect of the operating variables on
the specific surface area could be given a right picture of the strategy used for producing this powder at
excellent properties.
Traditionally optimization of experimental conditions is usually achieved by altering a single
variable while maintaining all other variables fixed at a certain set of conditions. This approach
disregards the combined effects or interactions between variables. Another drawback is the increase in
Int. J. Electrochem. Sci., Vol. 14, 2019
664
the number of runs required to achieve the research which in turn cause an increase of time and expenses
[24, 25]. To overcome this problem, response surface methodology (RSM) can be used as a motivating
approach to recognize the process variables which drive to optimal response by conducting a less number
of experiments. RSM is a combination of statistical and mathematical methods suitable for developing,
improving, and optimizing processes parameters and can be utilized for estimating the relative
significance of several operating parameters even in the existence of complex interactions [26]. Box–
Behnken design is part of RSM, where each experimental factor is tested at three levels and the
experimental response is compared with the predicted response [27, 28]. RSM has been successfully
used in various sectors of the industry including metal removal processes [29], chemical and biological
processes, drug and food industry [30]. To the best of our knowledge, the application of RSM in nickel
powder electrodeposition is not yet reported.
The aim of this work is to study the effect of three operating variables including current density,
nickel sulfate concentration, and temperature on the specific surface area of nickel powder and determine
the optimal values of these variables using Box–Behnken design.
2. EXPERIMENTAL WORK
2.1. Materials
All chemicals used were of analytical grade (BDH) and the experimental solution was prepared
using double distilled water. Electrodeposition of Nickel powder was conducted from a solution
containing 1 M (NH4)2SO4, 0.7 M NH4OH with different concentrations of nickel sulfate (NiSO4.7H2O).
2.2. Electrolytic cell
A Pyrex beaker (0.5 L) equipped with a polytetraflouroethylene (PTFE) cover plate was used as
a single compartment electrolytic cell for electrodeposition of nickel powder. A stainless steel (316-
AISL) plate with dimensions (2 cm width × 13 cm long) was used as cathode while a nickel plate (99.9%)
having the same dimensions was used as anode. The active surface area of each electrode was 10 cm2.
The back face of the cathode was plated by an epoxy to inhibit of nickel electrodeposition. Moreover,
the distance between the anode and the cathode was kept at 3 cm, and all runs were finished after a total
charge of 20250 coulombs was passed. Power supply- model UNI-T: UTP3315TF-L was used to run the
galvanostatic electrodeposition of nickel. To maintain the temperature constant during the electrolysis,
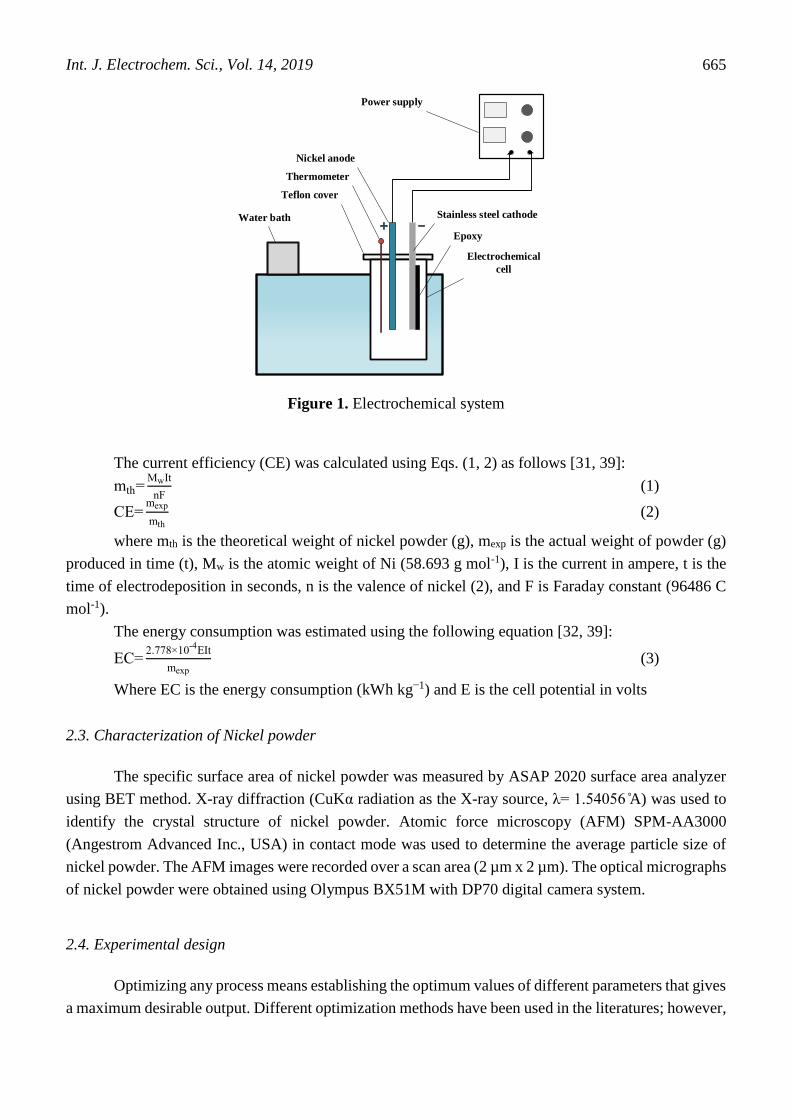
the cell body was immersed in a water bath. Fig. 1 represents the schematic diagram of the
electrochemical system. At the end of each run, nickel powder was easily removed from the cathode
surface and washed with distilled water and neutralized with 0.1M HCl. After that, the powder was
filtered and treated with an alcohol-acetone mixture (ethanol-acetone = 1:1) to remove water, then dried
for 2 h in 120 °C. Finally the produced powder was weighed and kept in a small polyethylene plastic
bottle.
Int. J. Electrochem. Sci., Vol. 14, 2019
665
Water bath
Power supply
Nickel anode
Stainless steel cathode
Epoxy
Electrochemical
cell
Teflon cover
Thermometer
Figure 1. Electrochemical system
The current efficiency (CE) was calculated using Eqs. (1, 2) as follows [31, 39]:
mth=MwIt
nF (1)
CE=mexp
mth (2)
where mth is the theoretical weight of nickel powder (g), mexp is the actual weight of powder (g)
produced in time (t), Mw is the atomic weight of Ni (58.693 g mol-1), I is the current in ampere, t is the
time of electrodeposition in seconds, n is the valence of nickel (2), and F is Faraday constant (96486 C
mol-1).
The energy consumption was estimated using the following equation [32, 39]:
EC=2.778×10
-4EIt
mexp (3)
Where EC is the energy consumption (kWh kg−1) and E is the cell potential in volts
2.3. Characterization of Nickel powder
The specific surface area of nickel powder was measured by ASAP 2020 surface area analyzer
using BET method. X-ray diffraction (CuKα radiation as the X-ray source, λ= 1.54056 ̊A) was used to
identify the crystal structure of nickel powder. Atomic force microscopy (AFM) SPM-AA3000
(Angestrom Advanced Inc., USA) in contact mode was used to determine the average particle size of
nickel powder. The AFM images were recorded over a scan area (2 µm x 2 µm). The optical micrographs
of nickel powder were obtained using Olympus BX51M with DP70 digital camera system.
2.4. Experimental design
Optimizing any process means establishing the optimum values of different parameters that gives
a maximum desirable output. Different optimization methods have been used in the literatures; however,
Int. J. Electrochem. Sci., Vol. 14, 2019
666
RSM is the empirical preferred one. It is collective statistical and mathematical techniques depend on
the fitting of a polynomial equation (empirical models) to the experimental data. This method creates a
polynomial function which relates the response to the factors studied. To do that, it considers the factors
only at certain levels (mostly -1, 0, 1). Response surface methodology produces an experimental design
for model preparation, which is a particular set of runs defined by a matrix consisted of the different
level combinations of the factors involved. RSM regressively fits the experimental results of the design
to a model (first, second or higher order) then the coefficients involved in the model are determined.
General designs relating to these models are: 1) First-Order Designs: The most well-known first-order
designs are 2k factorial (k is the number of control parameters) and Plackett–Burman designs. 2) Second-
Order Designs: The most commonly employed second-order designs are the 3 k factorial, Box–Behnken,
and the central composite designs [33].
Box–Behnken design (BBD) is an autonomous, rotatable quadratic design without inserted
factorial or fractional factorial points where the combinations of variables are at the midpoints of the
edges of the variable space and at the center. Besides, Box–Behnken design permits evaluating the
response function at middle levels and permits the determination of the system performance at any
experimental point within the range studied via suitable design and analysis of experiments [34]. In
comparison with traditional factorial design methods, choosing Box–Behnken designs can decrease the
number of experimental sets without reducing the optimization accuracy [35]. Therefore, Box–Behnken
design offers more efficient matrices and is more economical design.
In Box–Behnken design, the number of runs was determined according to the formula N=2k(k-
1) + cp, where k refers to the number of factors while (cp) represents the number of the central points.
Besides, all factor levels should be regulated only at three levels (-1, 0, +1) with equally spaced intervals
between these levels [33]. The quadratic equation model for predicting the optimal point based on this
deign can be expressed as follows [27]:
Y=β0+∑ β
ixi +∑ β
iixii
2 +∑ βijxixj+ε (4)
Where Y is the predicted response, β0 is the constant coefficient, βi is the ith linear coefficient of
the input factor xi, βii is the ith quadratic coefficient of the input factor xi, βij is the different interaction
coefficients between the input factors xi and xj, and ε is the error of the model [27].
The optimization procedure consists of different consecutive steps; firstly the response of the
statistically designed combinations is studied. Secondly, the coefficients of the model are determined by
fitting the experimental data to the response functions. Thirdly, predicting the response of the fitted
model, and finally the suitability of the model is checked by performing analysis of variance (ANOVA)
[35].
In the present research, the Box–Behnken experimental design was used to investigate and
confirm the electrolysis parameters affecting the specific surface area of electrochemically prepared
nickel powder. Current density (A), nickel sulfate concentration (B), and temperature (C) were the input
variables, while the specific surface area of nickel powder was chosen as a response(Y). Equation (4)
then could be written as follows:
Y=β0+β
1A+β
2B+β
3C+β
12AB+β
13AC+β
23BC+β
11A
2+β
22B2+β
33C
2 (5)
Based on the preliminary experimental results, the levels selected for the input variables are
shown in Table 1.Table 2 displays the experimental design derived from BBD. Box–Behnken design
Int. J. Electrochem. Sci., Vol. 14, 2019
667
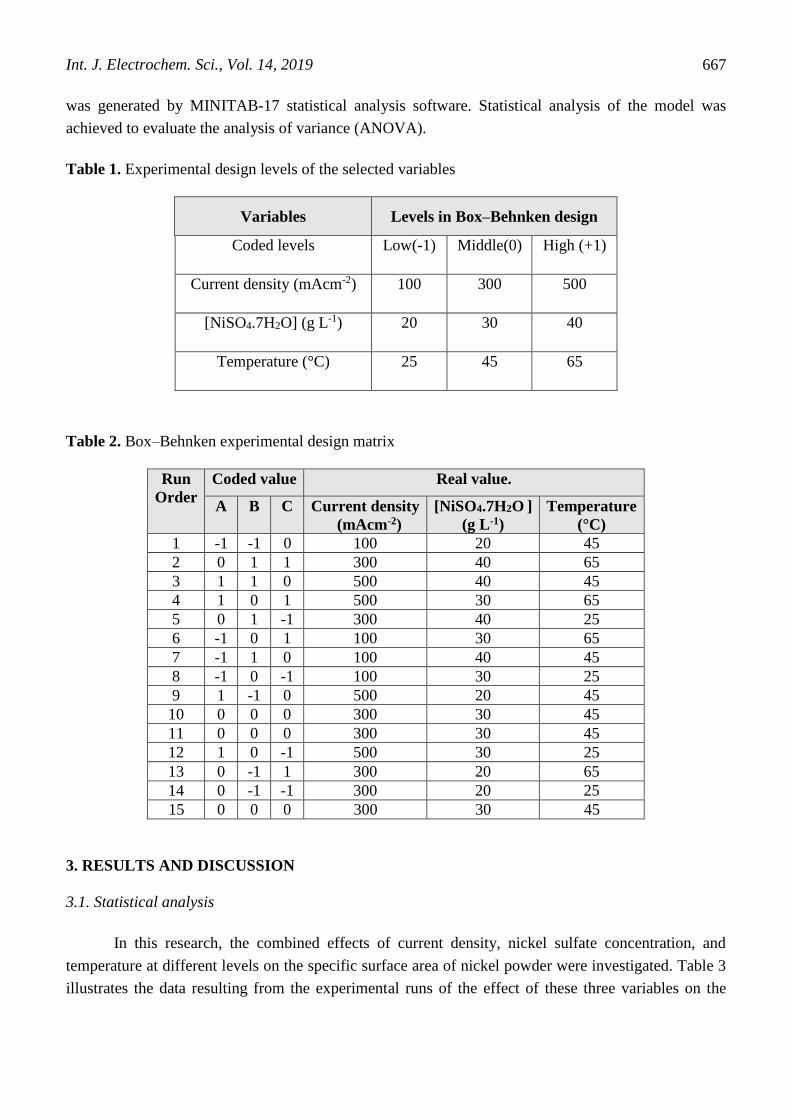
was generated by MINITAB-17 statistical analysis software. Statistical analysis of the model was
achieved to evaluate the analysis of variance (ANOVA).
Table 1. Experimental design levels of the selected variables
Levels in Box–Behnken design Variables
High (+1) Middle(0) Low(-1) Coded levels
500 300 100 )2-density (mAcmCurrent
40 30 20 )1-O] (g L2.7H4[NiSO
65 45 25 Temperature (°C)
Table 2. Box–Behnken experimental design matrix
Real value. Coded value Run
Order Temperature
(°C)
[NiSO4.7H2O ]
(g L-1)
Current density
(mAcm-2)
C B A
45 20 100 0 -1 -1 1
65 40 300 1 1 0 2
45 40 500 0 1 1 3
65 30 500 1 0 1 4
25 40 300 -1 1 0 5
65 30 100 1 0 -1 6
45 40 100 0 1 -1 7
25 30 100 -1 0 -1 8
45 20 500 0 -1 1 9
45 30 300 0 0 0 10
45 30 300 0 0 0 11
25 30 500 -1 0 1 12
65 20 300 1 -1 0 13
25 20 300 -1 -1 0 14
45 30 300 0 0 0 15
3. RESULTS AND DISCUSSION
3.1. Statistical analysis
In this research, the combined effects of current density, nickel sulfate concentration, and
temperature at different levels on the specific surface area of nickel powder were investigated. Table 3
illustrates the data resulting from the experimental runs of the effect of these three variables on the
Int. J. Electrochem. Sci., Vol. 14, 2019
668
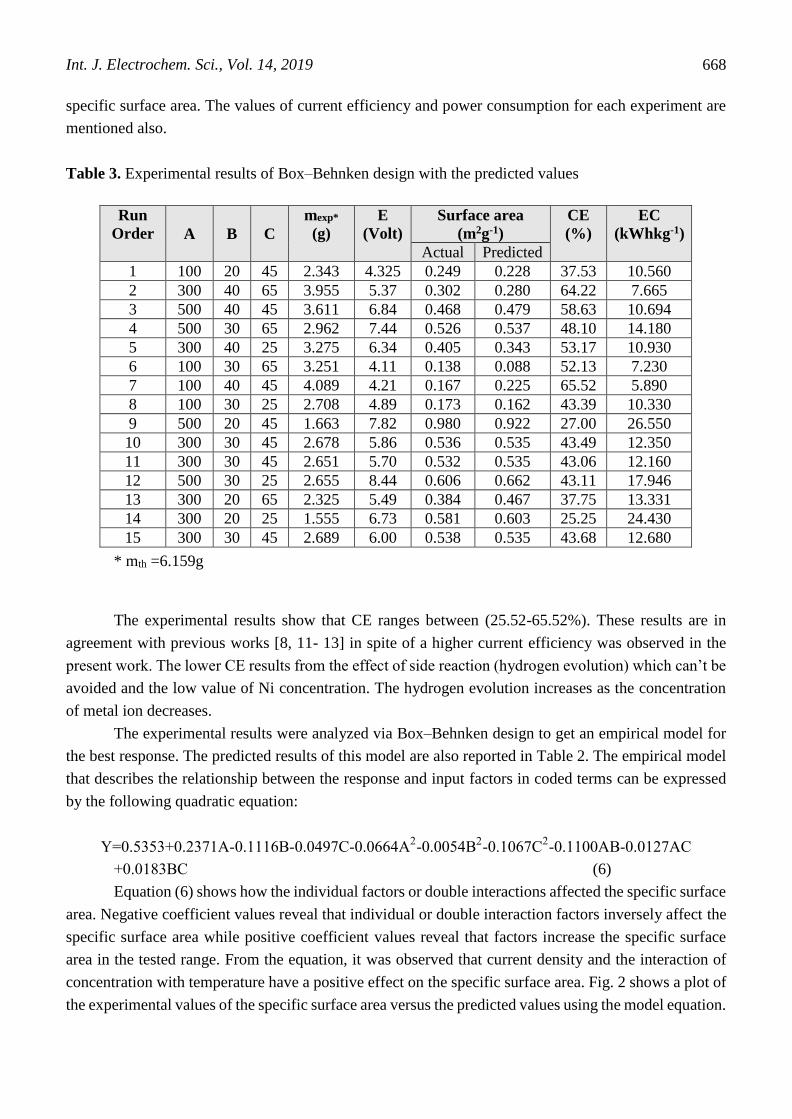
specific surface area. The values of current efficiency and power consumption for each experiment are
mentioned also.
Table 3. Experimental results of Box–Behnken design with the predicted values
EC
(kWhkg-1)
CE
(%)
Surface area
(m2g-1)
E
(Volt)
mexp*
(g) C B A
Run
Order
Predicted Actual
10.560 37.53 0.228 0.249 4.325 2.343 45 20 100 1
7.665 64.22 0.280 0.302 5.37 3.955 65 40 300 2
10.694 58.63 0.479 0.468 6.84 3.611 45 40 500 3
14.180 48.10 0.537 0.526 7.44 2.962 65 30 500 4
10.930 53.17 0.343 0.405 6.34 3.275 25 40 300 5
7.230 52.13 0.088 0.138 4.11 3.251 65 30 100 6
5.890 65.52 0.225 0.167 4.21 4.089 45 40 100 7
10.330 43.39 0.162 0.173 4.89 2.708 25 30 100 8
26.550 27.00 0.922 0.980 7.82 1.663 45 20 500 9
12.350 43.49 0.535 0.536 5.86 2.678 45 30 300 10
12.160 43.06 0.535 0.532 5.70 2.651 45 30 300 11
17.946 43.11 0.662 0.606 8.44 2.655 25 30 500 12
13.331 37.75 0.467 0.384 5.49 2.325 65 20 300 13
24.430 25.25 0.603 0.581 6.73 1.555 25 20 300 14
12.680 43.68 0.535 0.538 6.00 2.689 45 30 300 15
* mth =6.159g
The experimental results show that CE ranges between (25.52-65.52%). These results are in
agreement with previous works [8, 11- 13] in spite of a higher current efficiency was observed in the
present work. The lower CE results from the effect of side reaction (hydrogen evolution) which can’t be
avoided and the low value of Ni concentration. The hydrogen evolution increases as the concentration
of metal ion decreases.
The experimental results were analyzed via Box–Behnken design to get an empirical model for
the best response. The predicted results of this model are also reported in Table 2. The empirical model
that describes the relationship between the response and input factors in coded terms can be expressed
by the following quadratic equation:
Y=0.5353+0.2371A-0.1116B-0.0497C-0.0664A2-0.0054B2-0.1067C
2-0.1100AB-0.0127AC
+0.0183BC (6)
Equation (6) shows how the individual factors or double interactions affected the specific surface
area. Negative coefficient values reveal that individual or double interaction factors inversely affect the
specific surface area while positive coefficient values reveal that factors increase the specific surface
area in the tested range. From the equation, it was observed that current density and the interaction of
concentration with temperature have a positive effect on the specific surface area. Fig. 2 shows a plot of
the experimental values of the specific surface area versus the predicted values using the model equation.
Int. J. Electrochem. Sci., Vol. 14, 2019
669
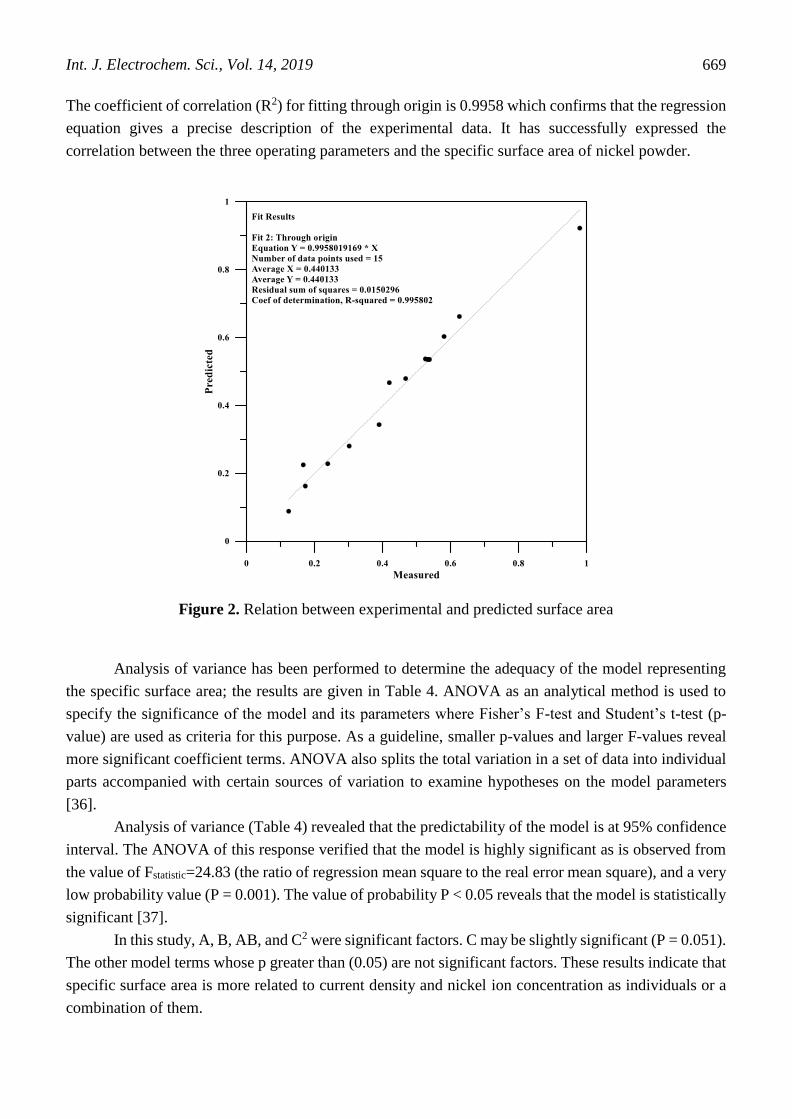
The coefficient of correlation (R2) for fitting through origin is 0.9958 which confirms that the regression
equation gives a precise description of the experimental data. It has successfully expressed the
correlation between the three operating parameters and the specific surface area of nickel powder.
Figure 2. Relation between experimental and predicted surface area
Analysis of variance has been performed to determine the adequacy of the model representing
the specific surface area; the results are given in Table 4. ANOVA as an analytical method is used to
specify the significance of the model and its parameters where Fisher’s F-test and Student’s t-test (p-
value) are used as criteria for this purpose. As a guideline, smaller p-values and larger F-values reveal
more significant coefficient terms. ANOVA also splits the total variation in a set of data into individual
parts accompanied with certain sources of variation to examine hypotheses on the model parameters
[36].
Analysis of variance (Table 4) revealed that the predictability of the model is at 95% confidence
interval. The ANOVA of this response verified that the model is highly significant as is observed from
the value of Fstatistic=24.83 (the ratio of regression mean square to the real error mean square), and a very
low probability value (P = 0.001). The value of probability P < 0.05 reveals that the model is statistically
significant [37].
In this study, A, B, AB, and C2 were significant factors. C may be slightly significant (P = 0.051).
The other model terms whose p greater than (0.05) are not significant factors. These results indicate that
specific surface area is more related to current density and nickel ion concentration as individuals or a
combination of them.
Int. J. Electrochem. Sci., Vol. 14, 2019
670
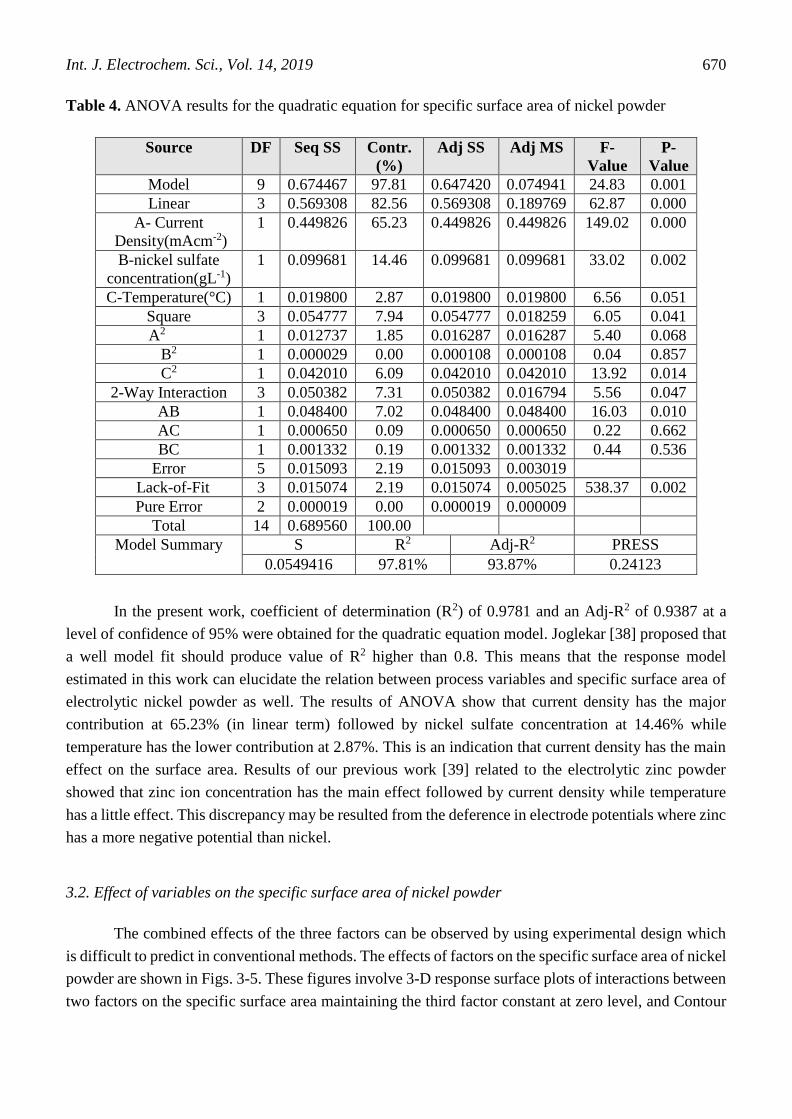
Table 4. ANOVA results for the quadratic equation for specific surface area of nickel powder
Source DF Seq SS Contr.
(%)
Adj SS Adj MS F-
Value
P-
Value
Model 9 0.674467 97.81 0.647420 0.074941 24.83 0.001
Linear 3 0.569308 82.56 0.569308 0.189769 62.87 0.000
A- Current
Density(mAcm-2)
1 0.449826 65.23 0.449826 0.449826 149.02 0.000
B-nickel sulfate
concentration(gL-1)
1 0.099681 14.46 0.099681 0.099681 33.02 0.002
C-Temperature(°C) 1 0.019800 2.87 0.019800 0.019800 6.56 0.051
Square 3 0.054777 7.94 0.054777 0.018259 6.05 0.041
2A 1 0.012737 1.85 0.016287 0.016287 5.40 0.068
B2 1 0.000029 0.00 0.000108 0.000108 0.04 0.857
C2 1 0.042010 6.09 0.042010 0.042010 13.92 0.014
2-Way Interaction 3 0.050382 7.31 0.050382 0.016794 5.56 0.047
AB 1 0.048400 7.02 0.048400 0.048400 16.03 0.010
AC 1 0.000650 0.09 0.000650 0.000650 0.22 0.662
BC 1 0.001332 0.19 0.001332 0.001332 0.44 0.536
Error 5 0.015093 2.19 0.015093 0.003019
Lack-of-Fit 3 0.015074 2.19 0.015074 0.005025 538.37 0.002
Pure Error 2 0.000019 0.00 0.000019 0.000009
Total 14 0.689560 100.00
Model Summary
S R2 Adj-R2 PRESS
0.0549416 97.81% 93.87% 0.24123
In the present work, coefficient of determination (R2) of 0.9781 and an Adj-R2 of 0.9387 at a
level of confidence of 95% were obtained for the quadratic equation model. Joglekar [38] proposed that
a well model fit should produce value of R2 higher than 0.8. This means that the response model
estimated in this work can elucidate the relation between process variables and specific surface area of
electrolytic nickel powder as well. The results of ANOVA show that current density has the major
contribution at 65.23% (in linear term) followed by nickel sulfate concentration at 14.46% while
temperature has the lower contribution at 2.87%. This is an indication that current density has the main
effect on the surface area. Results of our previous work [39] related to the electrolytic zinc powder
showed that zinc ion concentration has the main effect followed by current density while temperature
has a little effect. This discrepancy may be resulted from the deference in electrode potentials where zinc
has a more negative potential than nickel.
3.2. Effect of variables on the specific surface area of nickel powder
The combined effects of the three factors can be observed by using experimental design which
is difficult to predict in conventional methods. The effects of factors on the specific surface area of nickel
powder are shown in Figs. 3-5. These figures involve 3-D response surface plots of interactions between
two factors on the specific surface area maintaining the third factor constant at zero level, and Contour
Int. J. Electrochem. Sci., Vol. 14, 2019
671
plots which are two-dimensional pictures of the response for selected factors. The contour plots are the
projections of the response surfaces in the x–y plane that give a direct determination of the effects of
variables on the response. An elliptical contour plot reveals that the interactions between them are
significant while a circular contour plot reveals that no interactions could be existed [40].
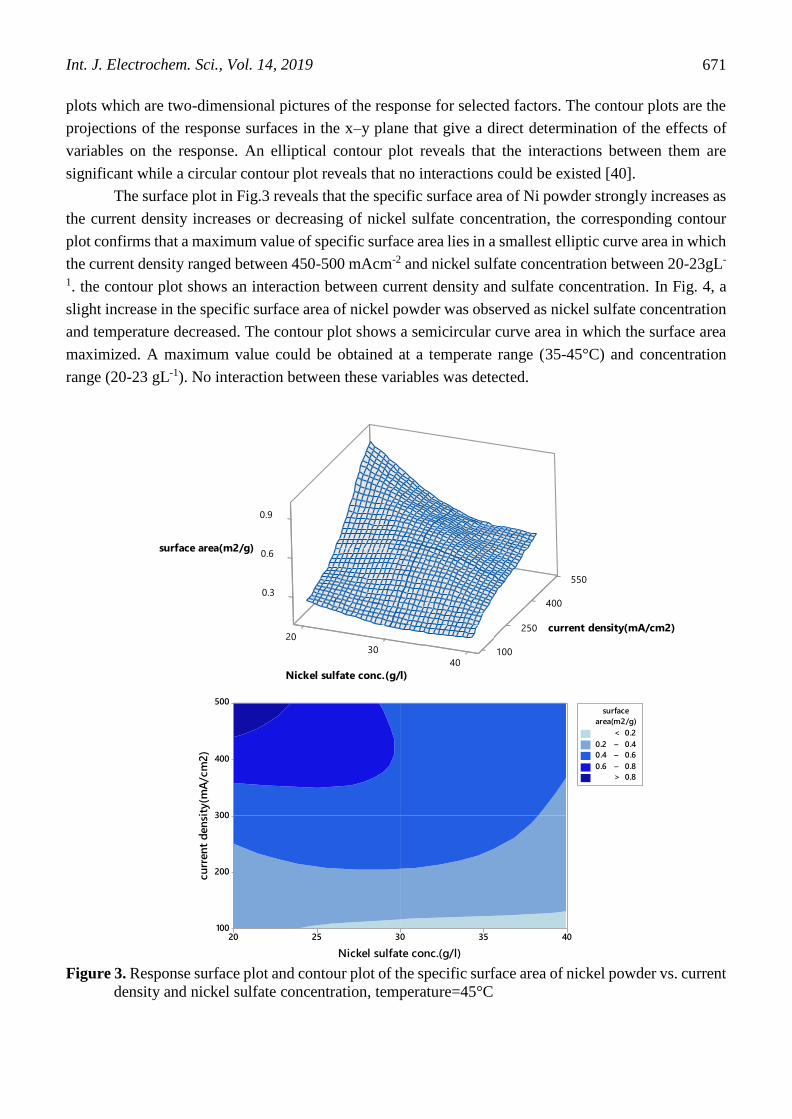
The surface plot in Fig.3 reveals that the specific surface area of Ni powder strongly increases as
the current density increases or decreasing of nickel sulfate concentration, the corresponding contour
plot confirms that a maximum value of specific surface area lies in a smallest elliptic curve area in which
the current density ranged between 450-500 mAcm-2 and nickel sulfate concentration between 20-23gL-
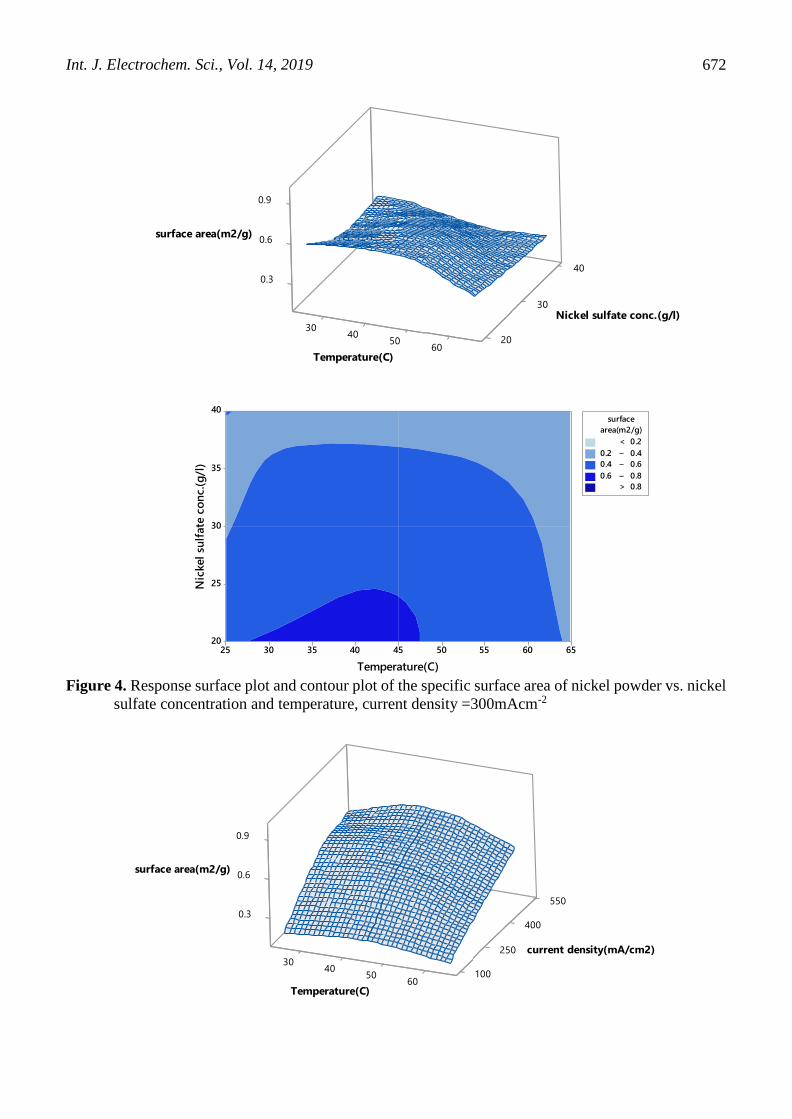
1. the contour plot shows an interaction between current density and sulfate concentration. In Fig. 4, a
slight increase in the specific surface area of nickel powder was observed as nickel sulfate concentration
and temperature decreased. The contour plot shows a semicircular curve area in which the surface area
maximized. A maximum value could be obtained at a temperate range (35-45°C) and concentration
range (20-23 gL-1). No interaction between these variables was detected.
Figure 3. Response surface plot and contour plot of the specific surface area of nickel powder vs. current
density and nickel sulfate concentration, temperature=45°C
02
03
.30
.60
04
052
001
400
052
550
0.9
surfac )g/2e area(m
)2mc/Am(ytisneurrent dc
taflus leN ci e conc.(g/l)k
urface Plot of surface area(m2/ vs current density(; NickelS sulfate c
Nickel sulfate conc.(g/l)
cu
rren
t d
en
sity
(mA
/cm
2)
4035302520
500
400
300
200
100
>
–
–
–
< 0.2
0.2 0.4
0.4 0.6
0.6 0.8
0.8
area(m2/g)
surface
Contour Plot of surface area(m2/ vs current density(; Nickel sulfate c
Int. J. Electrochem. Sci., Vol. 14, 2019
672
Figure 4. Response surface plot and contour plot of the specific surface area of nickel powder vs. nickel
sulfate concentration and temperature, current density =300mAcm-2
3004
50
30.
6.0
0260
30
40
0.9
e area(m2/g)cafrus
aflus lekciN c )l/g(.noc et
e )CmperaT ture(
urface Plot of surface area(m2/ v ( Nickel sulfate c; TemperatureS C)s
Temperature(C)
Nic
kel
sulf
ate
co
nc.(
g/l
)
656055504540353025
40
35
30
25
20
>
–
–
–
< 0.2
0.2 0.4
0.4 0.6
0.6 0.8
0.8
area(m2/g)
surface
Contour Plot of surface area(m2/ vs Nickel sulfate c; Temperature(C)
0340
50
0 3.
0.6
60
250
100
004
250
505
90.
surf ce aa )g/2m(aer
/cm2)Am(ytisned tnerruc
peT r tum re(C)e a
urface Plot of surface area(m2/ v e current dS nsity(; Temperature(C)s
Int. J. Electrochem. Sci., Vol. 14, 2019
673
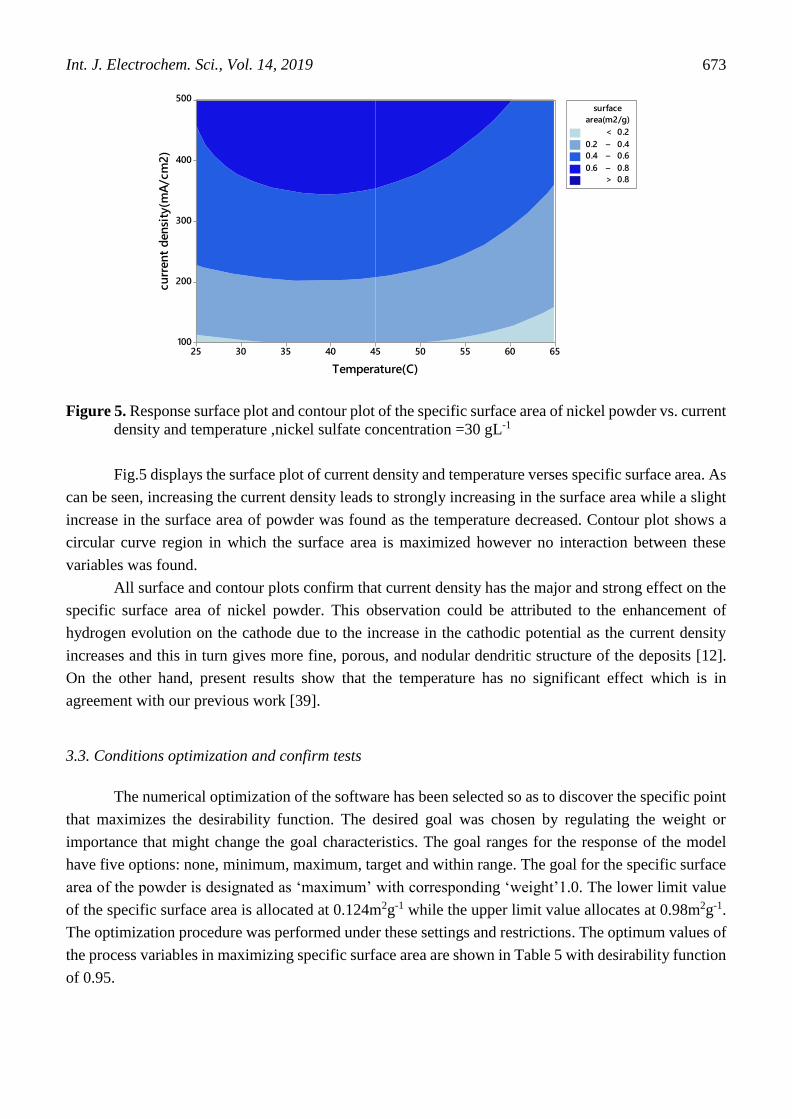
Figure 5. Response surface plot and contour plot of the specific surface area of nickel powder vs. current
density and temperature ,nickel sulfate concentration =30 gL-1
Fig.5 displays the surface plot of current density and temperature verses specific surface area. As
can be seen, increasing the current density leads to strongly increasing in the surface area while a slight
increase in the surface area of powder was found as the temperature decreased. Contour plot shows a
circular curve region in which the surface area is maximized however no interaction between these
variables was found.
All surface and contour plots confirm that current density has the major and strong effect on the
specific surface area of nickel powder. This observation could be attributed to the enhancement of
hydrogen evolution on the cathode due to the increase in the cathodic potential as the current density
increases and this in turn gives more fine, porous, and nodular dendritic structure of the deposits [12].
On the other hand, present results show that the temperature has no significant effect which is in
agreement with our previous work [39].
3.3. Conditions optimization and confirm tests
The numerical optimization of the software has been selected so as to discover the specific point
that maximizes the desirability function. The desired goal was chosen by regulating the weight or
importance that might change the goal characteristics. The goal ranges for the response of the model
have five options: none, minimum, maximum, target and within range. The goal for the specific surface
area of the powder is designated as ‘maximum’ with corresponding ‘weight’1.0. The lower limit value
of the specific surface area is allocated at 0.124m2g-1 while the upper limit value allocates at 0.98m2g-1.
The optimization procedure was performed under these settings and restrictions. The optimum values of
the process variables in maximizing specific surface area are shown in Table 5 with desirability function
of 0.95.
Temperature(C)
cu
rren
t d
en
sity
(mA
/cm
2)
656055504540353025
500
400
300
200
100
>
–
–
–
< 0.2
0.2 0.4
0.4 0.6
0.6 0.8
0.8
area(m2/g)
surface
Contour Plot of surface area(m2/ vs current density(; Temperature(C)
Int. J. Electrochem. Sci., Vol. 14, 2019
674
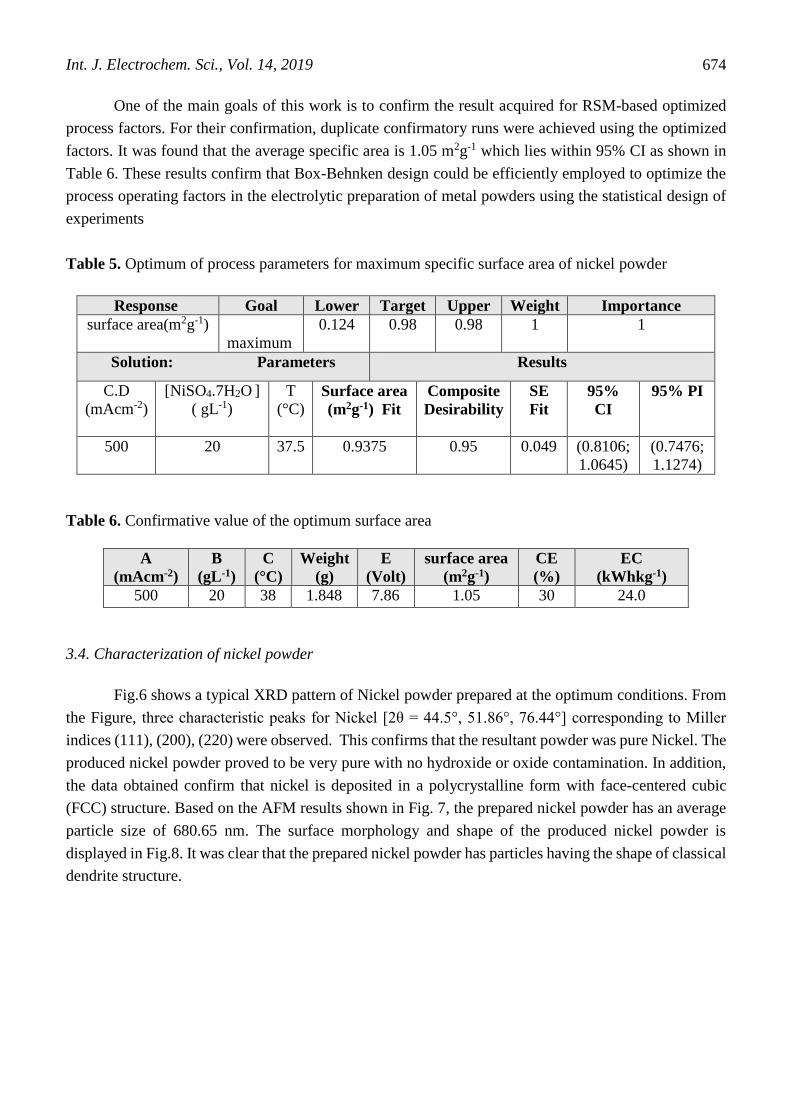
One of the main goals of this work is to confirm the result acquired for RSM-based optimized
process factors. For their confirmation, duplicate confirmatory runs were achieved using the optimized
factors. It was found that the average specific area is 1.05 m2g-1 which lies within 95% CI as shown in
Table 6. These results confirm that Box-Behnken design could be efficiently employed to optimize the
process operating factors in the electrolytic preparation of metal powders using the statistical design of
experiments
Table 5. Optimum of process parameters for maximum specific surface area of nickel powder
Importance Weight Upper Target Lower Goal Response
1 1 0.98 0.98 0.124
maximum
)1-g2surface area(m
Results Solution: Parameters
95% PI 95%
CI
SE
Fit
Composite
Desirability
Surface area
(m2g-1) Fit
T
(°C)
[NiSO4.7H2O ]
( gL-1)
C.D
)2-mAcm(
(0.7476;
1.1274)
(0.8106;
1.0645)
0.049 0.95 0.9375 37.5
20 500
Table 6. Confirmative value of the optimum surface area
EC
(kWhkg-1)
CE
(%)
surface area
(m2g-1)
E
(Volt)
Weight
(g)
C
(°C)
B
(gL-1)
A
(mAcm-2)
24.0 30 1.05 7.86 1.848 38 20 500
3.4. Characterization of nickel powder
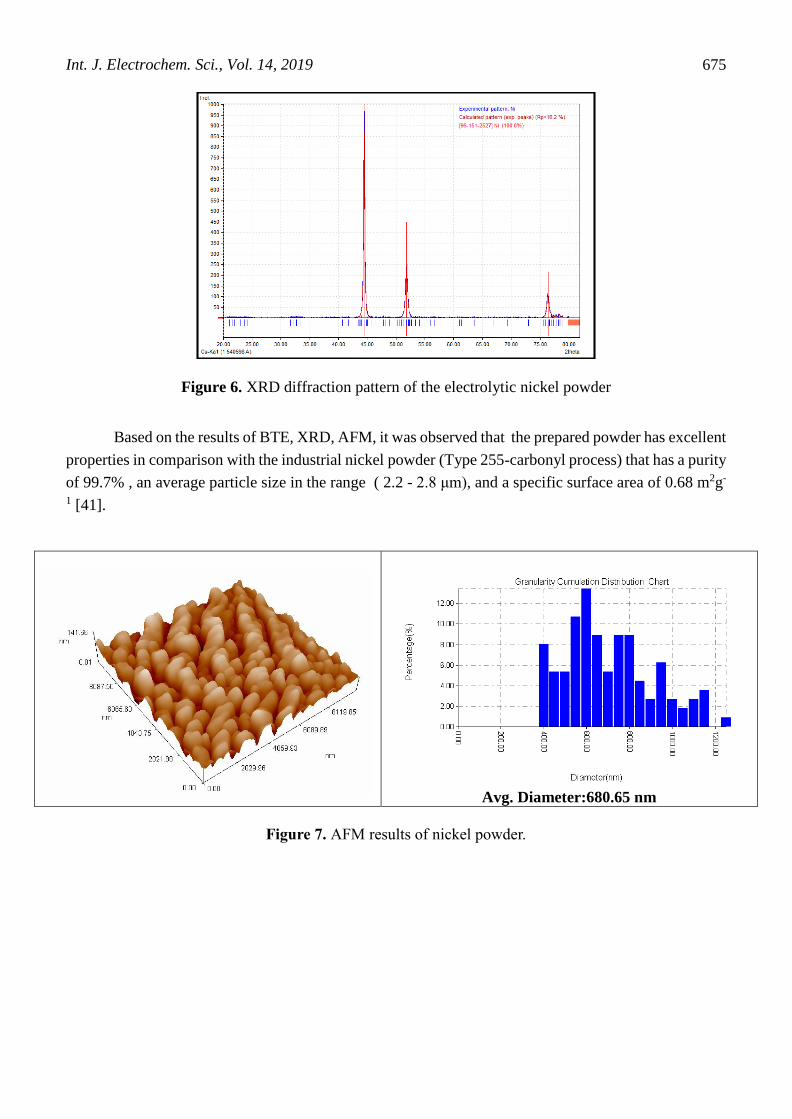
Fig.6 shows a typical XRD pattern of Nickel powder prepared at the optimum conditions. From
the Figure, three characteristic peaks for Nickel [2θ = 44.5°, 51.86°, 76.44°] corresponding to Miller
indices (111), (200), (220) were observed. This confirms that the resultant powder was pure Nickel. The
produced nickel powder proved to be very pure with no hydroxide or oxide contamination. In addition,
the data obtained confirm that nickel is deposited in a polycrystalline form with face-centered cubic
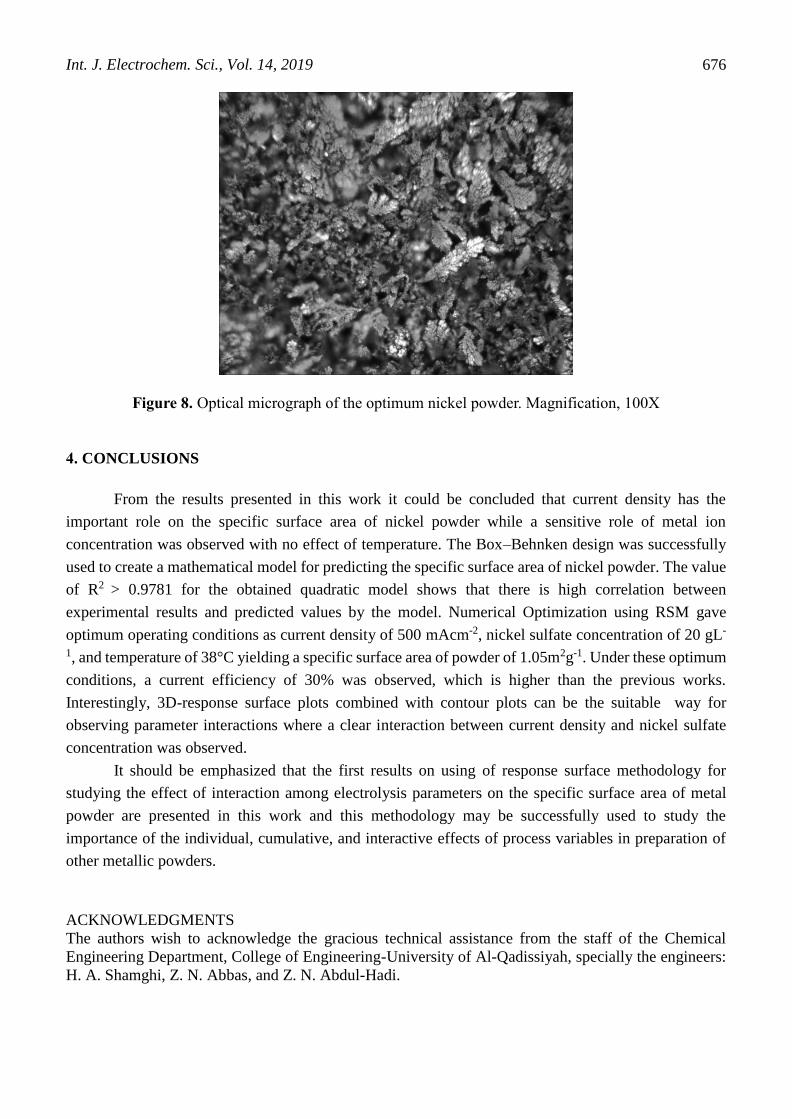
(FCC) structure. Based on the AFM results shown in Fig. 7, the prepared nickel powder has an average
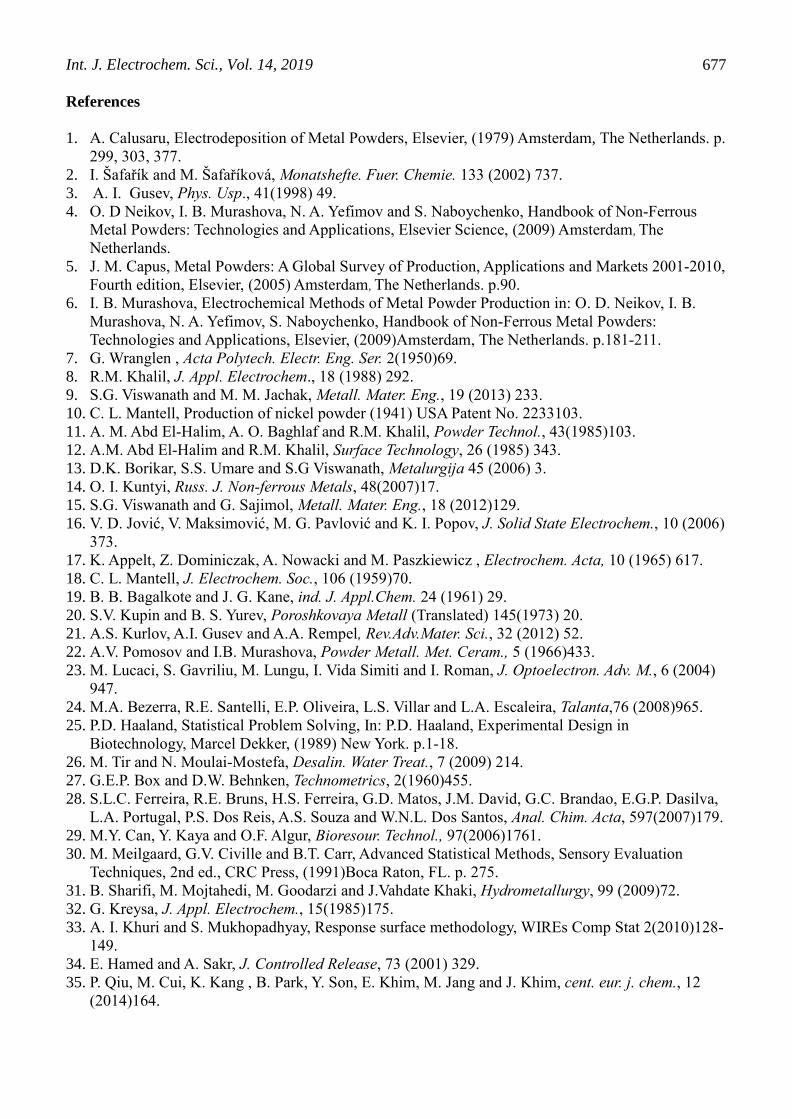
particle size of 680.65 nm. The surface morphology and shape of the produced nickel powder is
displayed in Fig.8. It was clear that the prepared nickel powder has particles having the shape of classical
dendrite structure.
Int. J. Electrochem. Sci., Vol. 14, 2019
675
Figure 6. XRD diffraction pattern of the electrolytic nickel powder
Based on the results of BTE, XRD, AFM, it was observed that the prepared powder has excellent
properties in comparison with the industrial nickel powder (Type 255-carbonyl process) that has a purity
of 99.7% , an average particle size in the range ( 2.2 - 2.8 μm), and a specific surface area of 0.68 m2g-
1 [41].
Avg. Diameter:680.65 nm
Figure 7. AFM results of nickel powder.
Int. J. Electrochem. Sci., Vol. 14, 2019
676
Figure 8. Optical micrograph of the optimum nickel powder. Magnification, 100X
4. CONCLUSIONS
From the results presented in this work it could be concluded that current density has the
important role on the specific surface area of nickel powder while a sensitive role of metal ion
concentration was observed with no effect of temperature. The Box–Behnken design was successfully
used to create a mathematical model for predicting the specific surface area of nickel powder. The value
of R2 > 0.9781 for the obtained quadratic model shows that there is high correlation between
experimental results and predicted values by the model. Numerical Optimization using RSM gave
optimum operating conditions as current density of 500 mAcm-2, nickel sulfate concentration of 20 gL-
1, and temperature of 38°C yielding a specific surface area of powder of 1.05m2g-1. Under these optimum
conditions, a current efficiency of 30% was observed, which is higher than the previous works.
Interestingly, 3D-response surface plots combined with contour plots can be the suitable way for
observing parameter interactions where a clear interaction between current density and nickel sulfate
concentration was observed.
It should be emphasized that the first results on using of response surface methodology for
studying the effect of interaction among electrolysis parameters on the specific surface area of metal
powder are presented in this work and this methodology may be successfully used to study the
importance of the individual, cumulative, and interactive effects of process variables in preparation of
other metallic powders.
ACKNOWLEDGMENTS
The authors wish to acknowledge the gracious technical assistance from the staff of the Chemical
Engineering Department, College of Engineering-University of Al-Qadissiyah, specially the engineers:
H. A. Shamghi, Z. N. Abbas, and Z. N. Abdul-Hadi.
Int. J. Electrochem. Sci., Vol. 14, 2019
677
References
1. A. Calusaru, Electrodeposition of Metal Powders, Elsevier, (1979) Amsterdam, The Netherlands. p.
299, 303, 377.
2. I. Šafařík and M. Šafaříková, Monatshefte. Fuer. Chemie. 133 (2002) 737.
3. A. I. Gusev, Phys. Usp., 41(1998) 49.
4. O. D Neikov, I. B. Murashova, N. A. Yefimov and S. Naboychenko, Handbook of Non-Ferrous
Metal Powders: Technologies and Applications, Elsevier Science, (2009) Amsterdam, The
Netherlands.
5. J. M. Capus, Metal Powders: A Global Survey of Production, Applications and Markets 2001-2010,
Fourth edition, Elsevier, (2005) Amsterdam, The Netherlands. p.90.
6. I. B. Murashova, Electrochemical Methods of Metal Powder Production in: O. D. Neikov, I. B.
Murashova, N. A. Yefimov, S. Naboychenko, Handbook of Non-Ferrous Metal Powders:
Technologies and Applications, Elsevier, (2009)Amsterdam, The Netherlands. p.181-211.
7. G. Wranglen , Acta Polytech. Electr. Eng. Ser. 2(1950)69.
8. R.M. Khalil, J. Appl. Electrochem., 18 (1988) 292.
9. S.G. Viswanath and M. M. Jachak, Metall. Mater. Eng., 19 (2013) 233.
10. C. L. Mantell, Production of nickel powder (1941) USA Patent No. 2233103.
11. A. M. Abd El-Halim, A. O. Baghlaf and R.M. Khalil, Powder Technol., 43(1985)103.
12. A.M. Abd El-Halim and R.M. Khalil, Surface Technology, 26 (1985) 343.
13. D.K. Borikar, S.S. Umare and S.G Viswanath, Metalurgija 45 (2006) 3.
14. O. I. Kuntyi, Russ. J. Non-ferrous Metals, 48(2007)17.
15. S.G. Viswanath and G. Sajimol, Metall. Mater. Eng., 18 (2012)129.
16. V. D. Jović, V. Maksimović, M. G. Pavlović and K. I. Popov, J. Solid State Electrochem., 10 (2006)
373.
17. K. Appelt, Z. Dominiczak, A. Nowacki and M. Paszkiewicz , Electrochem. Acta, 10 (1965) 617.
18. C. L. Mantell, J. Electrochem. Soc., 106 (1959)70.
19. B. B. Bagalkote and J. G. Kane, ind. J. Appl.Chem. 24 (1961) 29.
20. S.V. Kupin and B. S. Yurev, Poroshkovaya Metall (Translated) 145(1973) 20.
21. A.S. Kurlov, A.I. Gusev and A.A. Rempel, Rev.Adv.Mater. Sci., 32 (2012) 52.
22. A.V. Pomosov and I.B. Murashova, Powder Metall. Met. Ceram., 5 (1966)433.
23. M. Lucaci, S. Gavriliu, M. Lungu, I. Vida Simiti and I. Roman, J. Optoelectron. Adv. M., 6 (2004)
947.
24. M.A. Bezerra, R.E. Santelli, E.P. Oliveira, L.S. Villar and L.A. Escaleira, Talanta,76 (2008)965.
25. P.D. Haaland, Statistical Problem Solving, In: P.D. Haaland, Experimental Design in
Biotechnology, Marcel Dekker, (1989) New York. p.1-18.
26. M. Tir and N. Moulai-Mostefa, Desalin. Water Treat., 7 (2009) 214.
27. G.E.P. Box and D.W. Behnken, Technometrics, 2(1960)455.
28. S.L.C. Ferreira, R.E. Bruns, H.S. Ferreira, G.D. Matos, J.M. David, G.C. Brandao, E.G.P. Dasilva,
L.A. Portugal, P.S. Dos Reis, A.S. Souza and W.N.L. Dos Santos, Anal. Chim. Acta, 597(2007)179.
29. M.Y. Can, Y. Kaya and O.F. Algur, Bioresour. Technol., 97(2006)1761.
30. M. Meilgaard, G.V. Civille and B.T. Carr, Advanced Statistical Methods, Sensory Evaluation
Techniques, 2nd ed., CRC Press, (1991)Boca Raton, FL. p. 275.
31. B. Sharifi, M. Mojtahedi, M. Goodarzi and J.Vahdate Khaki, Hydrometallurgy, 99 (2009)72.
32. G. Kreysa, J. Appl. Electrochem., 15(1985)175.
33. A. I. Khuri and S. Mukhopadhyay, Response surface methodology, WIREs Comp Stat 2(2010)128-
149.
34. E. Hamed and A. Sakr, J. Controlled Release, 73 (2001) 329.
35. P. Qiu, M. Cui, K. Kang , B. Park, Y. Son, E. Khim, M. Jang and J. Khim, cent. eur. j. chem., 12
(2014)164.

Int. J. Electrochem. Sci., Vol. 14, 2019
678
36. R. Arunachalam and G. Annadurai, J. Environ. Sci. Technol., 4 (2011) 65.
37. M.S. Phadke, Quality Engineering Using Robust Design, Prentice Hall, (1989) New Jersey, USA.
38. A.M. Joglekar, and A.T. May, Cereal Food World, 32(1987)857.
39. A. H. Abbar, S. A. Rushdi and H. M. Al-Tameemi, Int. J. Electrochem. Sci., 12(2017)7075.
40. J. Aravind, C. Lenin, C. Nancyflavia, P. Rashika and S. Saravanan, Int. J. Environ. Sci. Technol., 12
(2015)105.
41. V. A. Tracey, Powder Metall., 9(1966)54.
© 2019 The Authors. Published by ESG (www.electrochemsci.org). This article is an open access
article distributed under the terms and conditions of the Creative Commons Attribution license
(http://creativecommons.org/licenses/by/4.0/).
Related Documents