Atmospheric Environment 38 (2004) 6149–6156 Effect of drought on isoprene emission rates from leaves of Quercus virginiana Mill. E. Pegoraro a, , A. Rey a,1 , J. Greenberg b , P. Harley b , J. Grace a , Y. Malhi a,2 , A. Guenther b a School of GeoSciences, University of Edinburgh, Darwin Building, Mayfield Road, Edinburgh EH9 3JU, Scotland, UK b Atmospheric Chemistry Division, National Center for Atmospheric Research, P.O. Box 3000, Boulder, Colorado 80307-3000, USA Received 26 February 2004; received in revised form 6 July 2004; accepted 15 July 2004 Abstract Leaf isoprene emission rates (F iso ) were studied in 2-year old trees of live oak (Quercus virginiana Mill.) during two drying–rewatering cycles. During the first drying–rewatering cycle, photosynthesis (A) and stomatal conductance (g s ) decreased by 92%(77%) and 91%(78%), respectively, while F iso remained essentially constant for 8 days of treatment. After 12 days under severe drought conditions, F iso was reduced by 64%(76%). Similar values were found during the second drying–rewatering cycle. During the recovery phase of both cycles, F iso recovered more quickly than A and g s . The lower drought sensitivity of F iso compared with that of A resulted in a higher percentage of fixed C lost as isoprene (C iso /C A ) as plants became more stressed, reaching peaks of 50% when A was almost zero. F iso showed a strong negative linear relationship with pre-dawn leaf water potential (c PD ) that could be a useful parameter to include in isoprene emission models to account for effects of drought stress on leaf F iso . r 2004 Elsevier Ltd. All rights reserved. Keyword: Photosynthesis; Stomatal conductance; Live oak; Water-stress; Leaf water potential 1. Introduction Isoprene is the most abundant hydrocarbon emitted by many tree species with an annual global flux estimated at 5 10 14 g year 1 (Guenther et al., 1995). Because of its high reactivity, isoprene exerts profound effects on tropospheric chemistry through the produc- tion of ozone and other oxidants, and increases the lifetime of greenhouse gases such as methane. For this reason, there is an increasing need to understand the effect of future climate change scenarios on isoprene production. Several environmental factors are known to affect the emission of isoprene by plants (Harley et al., 1999; Fuentes et al., 2000). Some studies have focused on the effect of water-stress on isoprene emission rates (F iso ) (e.g. Tingey et al., 1981; Sharkey and Loreto, 1993; Lerdau et al., 1997; Guenther et al., 1999; Bruggemann and Schnitzler, 2002). Although in general F iso were much less sensitive to drought than photosynthetic rates (A), results are variable among studies and no clear ARTICLE IN PRESS www.elsevier.com/locate/atmosenv 1352-2310/$ - see front matter r 2004 Elsevier Ltd. All rights reserved. doi:10.1016/j.atmosenv.2004.07.028 Corresponding author. E-mail address: [email protected] (E. Pegoraro). 1 Present address: Institute of Environmental Sciences (ICAM), University of Castilla la Mancha, Campus Tecnolo´- gico de la Fa´brica de Armas, Av. Carlos III, s/n, Edficio Sabatini, E-45071 Toledo, Spain. 2 Present address: School of Geography and the Environment, University of Oxford, UK.

Welcome message from author
This document is posted to help you gain knowledge. Please leave a comment to let me know what you think about it! Share it to your friends and learn new things together.
Transcript

ARTICLE IN PRESS
1352-2310/$ - se
doi:10.1016/j.at
�Correspond
E-mail addr1Present ad
(ICAM), Unive
gico de la Fab
Sabatini, E-4502Present addr
University of O
Atmospheric Environment 38 (2004) 6149–6156
www.elsevier.com/locate/atmosenv
Effect of drought on isoprene emission rates from leaves ofQuercus virginiana Mill.
E. Pegoraroa,�, A. Reya,1, J. Greenbergb, P. Harleyb, J. Gracea,Y. Malhia,2, A. Guentherb
aSchool of GeoSciences, University of Edinburgh, Darwin Building, Mayfield Road, Edinburgh EH9 3JU, Scotland, UKbAtmospheric Chemistry Division, National Center for Atmospheric Research, P.O. Box 3000, Boulder, Colorado 80307-3000, USA
Received 26 February 2004; received in revised form 6 July 2004; accepted 15 July 2004
Abstract
Leaf isoprene emission rates (Fiso) were studied in 2-year old trees of live oak (Quercus virginiana Mill.) during two
drying–rewatering cycles. During the first drying–rewatering cycle, photosynthesis (A) and stomatal conductance (gs)
decreased by 92%(77%) and 91%(78%), respectively, while Fiso remained essentially constant for 8 days of
treatment. After 12 days under severe drought conditions, Fiso was reduced by 64%(76%). Similar values were found
during the second drying–rewatering cycle. During the recovery phase of both cycles, Fiso recovered more quickly than
A and gs. The lower drought sensitivity of Fiso compared with that of A resulted in a higher percentage of fixed C lost as
isoprene (Ciso/CA) as plants became more stressed, reaching peaks of 50% when A was almost zero. Fiso showed a
strong negative linear relationship with pre-dawn leaf water potential (cPD) that could be a useful parameter to include
in isoprene emission models to account for effects of drought stress on leaf Fiso.
r 2004 Elsevier Ltd. All rights reserved.
Keyword: Photosynthesis; Stomatal conductance; Live oak; Water-stress; Leaf water potential
1. Introduction
Isoprene is the most abundant hydrocarbon emitted
by many tree species with an annual global flux
estimated at 5� 1014 g year�1 (Guenther et al., 1995).
Because of its high reactivity, isoprene exerts profound
e front matter r 2004 Elsevier Ltd. All rights reserve
mosenv.2004.07.028
ing author.
ess: [email protected] (E. Pegoraro).
dress: Institute of Environmental Sciences
rsity of Castilla la Mancha, Campus Tecnolo-
rica de Armas, Av. Carlos III, s/n, Edficio
71 Toledo, Spain.
ess: School of Geography and the Environment,
xford, UK.
effects on tropospheric chemistry through the produc-
tion of ozone and other oxidants, and increases the
lifetime of greenhouse gases such as methane. For this
reason, there is an increasing need to understand the
effect of future climate change scenarios on isoprene
production.
Several environmental factors are known to affect the
emission of isoprene by plants (Harley et al., 1999;
Fuentes et al., 2000). Some studies have focused on the
effect of water-stress on isoprene emission rates (Fiso)
(e.g. Tingey et al., 1981; Sharkey and Loreto, 1993;
Lerdau et al., 1997; Guenther et al., 1999; Bruggemann
and Schnitzler, 2002). Although in general Fiso were
much less sensitive to drought than photosynthetic rates
(A), results are variable among studies and no clear
d.

ARTICLE IN PRESSE. Pegoraro et al. / Atmospheric Environment 38 (2004) 6149–61566150
pattern has been observed. Some studies have observed
that plants can exhibit higher Fiso upon relief of water-
stress than in pre-stress conditions (Sharkey and Loreto,
1993).
It is known that isoprene biosynthesis occurs within
the chloroplast, and early experiments with isotopically
labelled carbon dioxide (13CO2) have shown that ca.
80% of the C in isoprene is derived from newly
assimilated photosynthetic C (Sanadze et al., 1972;
Mgaloblishvili et al., 1979), with roughly 20% coming
from alternate sources (Karl et al., 2002; Schnitzler
et al., 2004). A recent study showed that under
stress conditions such as water-stress or high-tempera-
ture, this partitioning may vary in favour of alternate
sources under conditions of low A (Funk et al., 2004).
Typically, in non-stressed conditions, the percentage of
assimilated C emitted as isoprene (Ciso/CA) at 30 1C is
around 2%, which represents a non-trivial loss of C to
the plant (Sharkey et al., 1991; Baldocchi et al., 1995;
Monson and Fall, 1989; Harley et al., 1999; Fang et al.,
1996). However, the C loss can exceed 50% during
periods of stress when A is depressed (Sharkey and
Loreto, 1993).
In order to improve our understanding of the
environmental and physiological control on Fiso from
temperate tree species, we conducted a controlled
laboratory experiment. The specific objectives of the
study were: (1) to investigate the effect of water-stress on
Fiso, specifically the short (days) and medium-term
(weeks) response of Fiso to drought stress; (2) to explore
the relationship between Fiso and A; (3) to calculate the
isoprene: carbon dioxide flux ratio for this species, under
normal and water-stress conditions; (4) to find a
physiological parameter that could be used in models
to estimate the Fiso response to water-stress. It was
hypothesised that: (a) in the short-term (few days), the
Fiso are less sensitive to water-stress than A; (b) in the
medium-term, the Fiso will correlate with a physiological
parameter of stress.
2. Materials and methods
2.1. Plant material
In January 2002, 16 2-year old trees of Live oak
(Quercus virginiana Mill.) were obtained from the
Camellia Forest Nursery (Chapel Hill, NC, USA). The
2-year old trees were transplanted to 6 dm3 plastic pots
(30 cm high and 16 cm wide) containing commercial
potting soil (Miracle Grow) and placed in the National
Center for Atmospheric Research (NCAR, Boulder,
CO) phytotron (a temperature-controlled greenhouse
with supplemental lighting) for 70 days until the end of
March when the experiment started.
2.2. Experimental design
Eight of the trees in the phytotron were randomly
chosen as ‘control’ plants (C) (well-watered plants) and
eight as ‘treatment’ plants (T) (subject to drought stress).
Four of these plants (two treatment and two control)
were used for destructive sampling and were monitored
continuously for leaf temperature (Tleaf) and soil
volumetric water content ðyÞ with leaf thermocouples
(0.1 mm in diameter) and Delta-T probes (ML2 Theta
Probe, Delta-T Devices, Cambridge, UK), respectively,
connected to a datalogger (CR10, Campbell Scientific,
Logan, UT, USA). These plants were not used for the
Fiso measurements. In order to take into account the
influence of growing conditions inside the phytotron on
Fiso, air temperature (Tair), relative humidity (RH), and
photosynthetic active radiation (PAR) were continu-
ously measured and stored on an hourly basis in a CR10
datalogger.
Water-stress was imposed on eight previously non-
stressed plants by withholding water during two
successive drying–rewatering cycles. In the first cycle
water was withheld from 21 March to 2 April (12 days)
and in the second cycle from 18 April to 28 April (10
days). During both cycles, T plants were watered to field
capacity approximately 12 h before the start of the
drought phase of each cycle. Initially, A and Fiso were
measured every three days and then daily when Fiso
started to change more dramatically after treatment.
The drying cycle was ended when Fiso of the T plants
were reduced to less than 50% of the values measured in
the C plants. At the end of each drought period, T plants
were watered daily over the following recovery period
(the first from 2 April to 18 April, the second from 28
April to 8 May) to allow plants to recover before
starting the following cycle. The end of the recovery
period in the first cycle was established as the time when
the Fiso measured in the T plants reached the same mean
emission rates as those measured in the C plants. During
the first cycle, C plants were watered every 3 days,
whereas during the second cycle they were watered every
other day. The watering regime was changed to every
other day because during the first cycle the C plants
suffered a slight water-stress that affected mainly
A and gs.
2.3. Water status
In order to monitor water-stress the following
parameters were measured: y; pot mass (M) and pre-
dawn leaf water potential (cPD). y was continuously
monitored over the duration of the entire experiment
using two Delta-T soil moisture sensors. The two
sensors were inserted to 10 cm depth into the pot of a
T plant and a C plant, and hourly average signals were
collected with a CR10 data logger. In addition, y was

ARTICLE IN PRESSE. Pegoraro et al. / Atmospheric Environment 38 (2004) 6149–6156 6151
measured with a portable sensor (ML2x Theta Probe,
Delta-T Devices, Cambridge, UK), inserted into the pot
at the time of each gas exchange measurement. M and ywere measured at the time of each gas exchange
measurement just before putting the leaf into the leaf
cuvette.
cPD was measured using detached leaves with a
Scholander pressure chamber (Model 610 Pressure
Chamber, PMS Instrument Co., Corvallis, OR, USA).
Because measurements with the pressure bomb are
destructive, leaves used for these measurements were
collected from the two T and two C plants that were not
used for Fiso measurements. However, during the drying
period of the second cycle cPD was also measured in
leaves from the 12 T and C plants to increase the number
of replicates.
2.4. Sampling protocol
All gas exchanges, y; pot mass, and cPD measure-
ments were performed in a single day using one leaf per
plant for the gas exchange measurements. Two different
leaves on each plant were used for measurements in the
two cycles. At the beginning of the experiment, fully
expanded leaves from the top of the canopy were
randomly chosen and tagged for subsequent measure-
ments. Prior to measurement, each plant was taken from
the greenhouse to an adjacent laboratory where a gas
exchange measurement system was set up. After a
15 min period at a PAR of 600 mmol m�2 s�1, the gas
exchange measurements were started.
2.5. Leaf gas exchange measurements
A, gs and intercellular CO2 concentration (Ci) were
measured using a LI-6400 gas exchange measurement
system (Li-Cor, Lincoln, NE, USA). To avoid large
oscillations in the CO2 level of the air supply
(374mmol mol�174%), the LI-6400 inlet drew air from
outside the laboratory and an empty canister of 2 dm3
volume was placed in line before the instrument to
buffer against short-term variations. The air supply was
humidified using an in-line bubbler because of the very
low RH of the external air. RH inside the cuvette was
maintained at 60% (710%).
For measurements of Fiso, an air sample of 300 ml was
pulled from the outlet of the leaf cuvette through a ‘T’
junction and 20 cm of Teflons PFA tubing into a
custom-made inlet system capable of vacuum sample
collection and isoprene cryofocusing. The isoprene
sample was then transferred to the 0.25 mm ID� 30 m
MXT-624 capillary column (RESTEK Corporation,
Bellefonte, PA, USA) of a portable gas chromatograph
(SRI 310, Buck Scientific, East Norwalk, CT, USA) by a
flow of high-purity He that was used as carrier gas.
Isoprene was separated with a carrier (He) flow of
3 ml min�1 and with a temperature programme from 40
to 200 1C at 10 1C min�1. Isoprene eluting from the
column was measured using a flame ionisation detector
(FID), and the peak was integrated using PeakSimple-32
integrator (SRI, Buck Scientific, East Norwalk, CT,
USA). Additional details of the analytical system can be
found in Greenberg et al. (2003). Before the start of the
experiment the FID-gas chromatograph was tested for a
few days for linear response and detection stability. The
linearity and the good stability (ca. 2%) of the results
suggested that a single injection of a known isoprene
standard (25.5 ppb in N2) on each measurement day was
sufficient to calibrate the system.
All measurements were made between 10:00 a.m. and
3.00 p.m., and measurements on each leaf were made at
the same time each day (7 one hour). All measurements
were made under the same standard conditions: T of
28 1C, PAR of 800 mmol m�2 s�1 and air flow of
400mmol s�1. After a leaf was placed in the cuvette, a
minimum of 10 min was allowed for equilibration, and
all measurements were made after steady-state condi-
tions were realised, as indicated by continuous monitor-
ing of CO2 and H2O fluxes.
2.6. Statistical analyses
In order to analyse the data, the experiment was
considered as two cycles: cycle I (21 March–2 April) and
cycle II (18 April–8 May), each comprising a drought
and a recovery phase. All data analyses were done with
SAS software (SAS Institute Inc., Cary, NC, 1995).
Results of the whole experiment were analysed using a
multivariate analysis of variance (MANOVA). For A
and gs, data were transformed into logarithms to satisfy
the assumption of homogeneity of variance. To take into
account the overall effect during the course of the
experiment, data were first analysed using a two-way
ANOVA with repeated measures with drought as a
factor (proc GLM) where treatment, time and their
interaction were considered. When this test was sig-
nificant at a 5% level of probability, a single ANOVA
was used to test specific differences on each date. Linear
and nonlinear regressions (Proc NLIN) were used to
determine the relationships between different physiolo-
gical variables. Values in the text are reported as
means71 standard error (SE).
3. Results
3.1. Growth conditions
Inside the phytotron, plants were grown under a 12 h
day (from 7:00 a.m. to 7:00 p.m.) and a PAR of
33374mmol m�2 s�1 (n ¼ 48) with average maximum
of 511717mmol m�2 s�1 (n ¼ 48) (Fig. 1A). Tleaf for T

ARTICLE IN PRESSM
ean
PA
R (
µ mo
l m-2
s-1
)
100
150
200
250
300
350
400
Mea
nT
leaf
(o C
)
16
18
20
22
24
26
C leaf T T leaf T
Date
24/ 02
/ 02
02/ 03
/ 02
08/ 03
/ 02
14/ 03
/ 02
20/ 03
/ 02
26/ 03
/ 02
01/ 04
/ 02
07/ 04
/ 02
13/ 04
/ 02
19/ 04
/ 02
25/ 04
/ 02
01/ 05
/ 02
07/ 05
/ 02
13/ 05
/ 02
θ(m
3m
-3)
0.0
0.1
0.2
0.3
0.4
0.5
0.6
0.7
C SMT SM
(C)
(A)
(B)
Fig. 1. Growth conditions inside the phytotron during the
experiment: daylight average photosynthetic active radiation
(PAR) (A) and leaf temperature (Tleaf) (B), and 24 h average of
soil volumetric water content ðyÞ (C) for T and C plants.
θ (
m3 m
-3)
0.00.10.20.30.40.50.60.7
A (
µ mol
m-2
s-1)
0
2
4
6
8
g s (
mol
m-2
s-1)
0.00
0.02
0.04
0.06
0.08
DRY
Days from start of the experiment (21/3/2002)
0 4 8 12 16 20 24 28 32 36 40 44 48
F iso
(nm
ol m
-2 s
-1)
0
5
10
15
20
25
30
FIRST CYCLE
WET DRY WET
SECOND CYCLE
(A)
(D)
(C)
(B)
Fig. 2. Time course of isoprene emission rates (Fiso) (A),
photosynthetic rates (A) (B), stomatal conductance (gs) (C) and
soil volumetric water content ðyÞ (D) during the first and second
drying-rewatering cycles. Each point is the mean7SE ðn ¼ 6Þ:
E. Pegoraro et al. / Atmospheric Environment 38 (2004) 6149–61566152
and C plants was on average 22.970.9 1C (n ¼ 48).
During the two periods of drought stress, Tleaf of the T
plants tended to be higher than Tleaf of the C plants as a
consequence of the reduced cooling effect of transpira-
tion (Fig. 1B). During March, there were two strong
temperature declines caused by the extreme external
weather (snowstorms). These temperature drops affected
the phytotron internal temperature and clearly influ-
enced Tleaf as shown in Fig. 1B. Towards the end of
March, temperatures increased and remained stable in
the phytotron during the whole period of the experi-
ment. The y measured for the C plants was on average
0.570.005 m3 m�3 (n ¼ 38). During the two drought
periods, y decreased to less than 0.1 m3 m�3 in the first
cycle, and to ca. 0.2 m3 m�3 in the second cycle in the T
plants (Fig. 1C).
3.2. Drought effect on leaf isoprene emission and gas-
exchange parameters
At the beginning of the experiment (21 March, day 0),
there was no significant difference (all P40:05) in y (ca.
0.45 m3 m�3), Fiso (ca. 17 nmol m�2 s�1) and gas ex-
change parameters (A: ca. 5.6mmol m�2 s�1; gs: ca.
0.048 mol m�2 s�1) between T and C plants (Fig. 2).
In the T plants, after 6 days of treatment, y was
reduced to ca. 0.1 m3 m�3 (Fig. 2A). Drought strongly
decreased A and gs to 1.9470.55mmol m�2 s�1 and
0.01370.002 mol m�2 s�1, respectively on day 6 (Fig. 2B
and C), while Fiso remained essentially constant until
day 6 at approximately 16.572.1 nmol m�2 s�1 (Fig.
2D). Fiso started to decline daily from day 8 of the
experiment when y was less than 0.1 m3 m�3 and cPD
was ca. –1 MPa. The isoprene emission rate decreased to
6.271.1 nmol m�2 s�1 at the end of the first drying cycle
on day 12, with a cPD of ca.–2 MPa. In contrast to the
slow decline in the Fiso over time, A and gs decreased
very rapidly from day 2 to almost zero on day 8, and
remained essentially constant until day 14. Both A
and gs tracked the decline in y (although with a one day
lag period).

ARTICLE IN PRESS
θθ (m3 m-3)
0.0 0.2 0.4 0.6
Cis
o/C
A (
%)
0
2
4
6
8
10
R2 = 0.75y = 0.996x-0.672
Fig. 3. Relationship between the percentage of assimilated C
emitted as isoprene (Ciso/CA) and soil volumetric water content
ðyÞ for the T plants during the dry periods. Ciso/CA is shown
only for days in which photosynthetic rate (A) was 40:5: Each
point represents the mean of six replicates.
E. Pegoraro et al. / Atmospheric Environment 38 (2004) 6149–6156 6153
In the C plants Fiso remained essentially constant at
ca. 18 nmol m�2 s�1. A and gs dropped from 5.871.0mmol m�2 s�1 and 0.04070.007 mol m�2 s�1, res-
pectively on day 8 to 1.870.8mmol m�2 s�1 and
0.01370.004 mol m�2 s�1 on day 10, as a consequence
of a small drought stress. y decreased from 0.4270.03 to
0.2070.04 m3 m�3 during the 3 day interval between day
6 and day 9 during which the C plants were not watered.
During the 16-day recovery period (from day 12 to day
28), Fiso recovered quickly upon re-watering, reaching
the C emission rate (ca. 15 nmol m�2 s�1) on day 13. A
and gs still showed a slight sign of water-stress at the
start of the second cycle, but the differences between T
and C plants on day 16 were not significant (P40:05).
During the second drought period, from day 28 to day
38, y decreased from 0.4570.01 to 0.04570.007 m3 m�3
(Fig. 2A). Similarly to the first cycle, in the second
cycle A and gs decreased at a faster rate than Fiso,
which began to decline later, reaching values of
0.1070.01mmol m�2 s�1, 0.002070.0002 mol m�2 s�1
and 11.171.2 nmol m�2 s�1, respectively by day 38
(Fig. 2B, C and D). In the second recovery period Fiso
from T plants reached C emission rates on day 44 at ca.
20.5 nmol m�2 s�1, with y having recovered to ca.
0.5 m3 m�3. A and gs from the T plants recovered to C
plant values by day 48 at ca. 5.74mmol m�2 s�1 and ca.
0.043 mol m�2 s�1, respectively. In the C plants, A, gs
and Fiso remained essentially stable at ca. 5.9 mmol
m�2 s�1, 0.05 mol m�2 s�1 and 19.5 nmol m�2 s�1, res-
pectively. y remained essentially constant at ca.
0.48 m3 m�3.
At the beginning and the end of the experiment and
during the recovery period, the Ciso/CA was only around
2%. During the two severe water-stress periods when A
was less than 0.5mmol m�2 s�1, the Ciso/CA reached
values as high as 50%. Because these values were
obtained when A was close to zero, calculations may
have been somewhat misleading. However, for values of
A larger than 0.5mmol m�2 s�1, the Ciso/CA still in-
creased significantly with decreasing y (Fig. 3). In the C
plants the Ciso/CA remained essentially constant at ca.
2%, with the exception of a rapid increase to values of
ca. 5% reached in response to the slight water-stress that
the C plants suffered during the first cycle.
During the two consecutive cycles there was a
significant difference between the response of Fiso and
that of A to changes in y; gs and cPD (P40:01 in all
cases for the repeated measures analysis). Although Fiso
responded to water-stress later and more slowly than A,
both showed a distinctive response to y during the
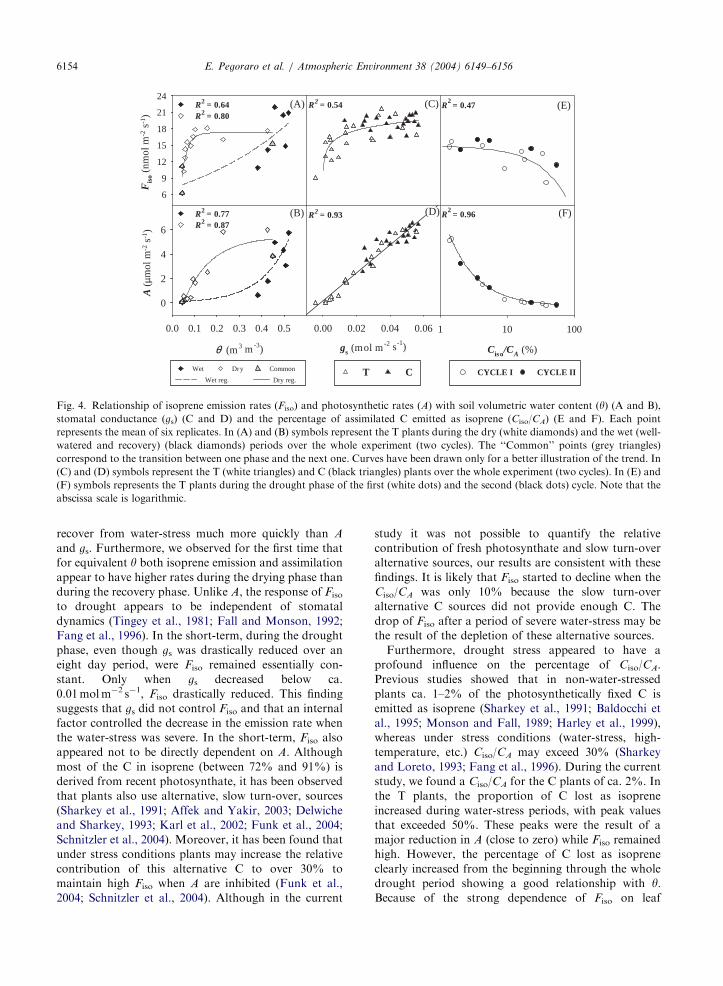
drought period and the recovery period (Fig. 4A and B).
For equivalent y; both isoprene and assimilation showed
higher rates during the drought phase than during the
recovery phase. Fiso did not show any relationship to gs
for gs values higher than 0.02 mol m�2 s�1. Only when gs
decreased below 0.02 mol m�2 s�1 in the T plants Fiso
dropped dramatically (Fig. 4C). As expected, and
opposite to Fiso, A showed a strong linear correlation
with gs (R2 ¼ 0:93) for both T and C plants (Fig. 4D).
Fiso only started to decline when A was already reduced
by as much as 90% which corresponded to a Ciso/CA of
ca. 10% (Fig. 4E and 4F). Fiso dropped significantly
when the C cost to the plant for isoprene emission was
very high, i.e. during the most severe period of the
drought when A was reduced almost to zero.
The effect of decreasing cPD on A was very strong
(Fig. 5A), with A immediately reduced to zero when cPD
reached ca. –1 MPa. Fiso and cPD showed a well-
correlated (R2 ¼ 0:64) linear negative trend (Fig. 5B).
The negative effect was not as pronounced as for A,
probably as a result of the little effect stomata have in
controlling Fiso from leaves (Fall and Monson, 1992).
The relationship between Fiso and A for the T plants
over the duration of the experiment, divided into
drought period and watered period, is shown in Fig. 6.
Fiso during drought did not decline much until A was
very low and was characterised by a faster recovery
during the rewatering period.
4. Discussion
Our results indicate that although Fiso decreased when
the water-stress was severe, it was considerably less
sensitive to drought than A and gs (Tingey et al., 1981;
Sharkey and Loreto, 1993; Fang et al., 1996; Lerdau et
al., 1997; Guenther et al., 1999; Bruggemann and
Schnitzler, 2002). It was also apparent that Fiso could
ARTICLE IN PRESS
Ciso/CA (%)
1 10 100
gs (mol m -2 s-1)
0.00 0.02 0.04 0.06
Fis
o (n
mol
m-2
s-1
)
6
9
12
15
18
21
24R
2 = 0.47
R2 = 0.96
R2 = 0.64R2 = 0.80
θ (m3 m -3)
0.0 0.1 0.2 0.3 0.4 0.5
A (
µmol
m-2
s-1
)
0
2
4
6
R2 = 0.77R2 = 0.87
Wet Dry Common
Dry reg.Wet reg.
R2 = 0.93
R2 = 0.54(A) (E)(C)
(D)
CT CYCLE I CYCLE II
(B) (F)
Fig. 4. Relationship of isoprene emission rates (Fiso) and photosynthetic rates (A) with soil volumetric water content ðyÞ (A and B),
stomatal conductance (gs) (C and D) and the percentage of assimilated C emitted as isoprene (Ciso/CA) (E and F). Each point
represents the mean of six replicates. In (A) and (B) symbols represent the T plants during the dry (white diamonds) and the wet (well-
watered and recovery) (black diamonds) periods over the whole experiment (two cycles). The ‘‘Common’’ points (grey triangles)
correspond to the transition between one phase and the next one. Curves have been drawn only for a better illustration of the trend. In
(C) and (D) symbols represent the T (white triangles) and C (black triangles) plants over the whole experiment (two cycles). In (E) and
(F) symbols represents the T plants during the drought phase of the first (white dots) and the second (black dots) cycle. Note that the
abscissa scale is logarithmic.
E. Pegoraro et al. / Atmospheric Environment 38 (2004) 6149–61566154
recover from water-stress much more quickly than A
and gs. Furthermore, we observed for the first time that
for equivalent y both isoprene emission and assimilation
appear to have higher rates during the drying phase than
during the recovery phase. Unlike A, the response of Fiso
to drought appears to be independent of stomatal
dynamics (Tingey et al., 1981; Fall and Monson, 1992;
Fang et al., 1996). In the short-term, during the drought
phase, even though gs was drastically reduced over an
eight day period, were Fiso remained essentially con-
stant. Only when gs decreased below ca.
0.01 mol m�2 s�1, Fiso drastically reduced. This finding
suggests that gs did not control Fiso and that an internal
factor controlled the decrease in the emission rate when
the water-stress was severe. In the short-term, Fiso also
appeared not to be directly dependent on A. Although
most of the C in isoprene (between 72% and 91%) is
derived from recent photosynthate, it has been observed
that plants also use alternative, slow turn-over, sources
(Sharkey et al., 1991; Affek and Yakir, 2003; Delwiche
and Sharkey, 1993; Karl et al., 2002; Funk et al., 2004;
Schnitzler et al., 2004). Moreover, it has been found that
under stress conditions plants may increase the relative
contribution of this alternative C to over 30% to
maintain high Fiso when A are inhibited (Funk et al.,
2004; Schnitzler et al., 2004). Although in the current
study it was not possible to quantify the relative
contribution of fresh photosynthate and slow turn-over
alternative sources, our results are consistent with these
findings. It is likely that Fiso started to decline when the
Ciso/CA was only 10% because the slow turn-over
alternative C sources did not provide enough C. The
drop of Fiso after a period of severe water-stress may be
the result of the depletion of these alternative sources.
Furthermore, drought stress appeared to have a
profound influence on the percentage of Ciso/CA.
Previous studies showed that in non-water-stressed
plants ca. 1–2% of the photosynthetically fixed C is
emitted as isoprene (Sharkey et al., 1991; Baldocchi et
al., 1995; Monson and Fall, 1989; Harley et al., 1999),
whereas under stress conditions (water-stress, high-
temperature, etc.) Ciso/CA may exceed 30% (Sharkey
and Loreto, 1993; Fang et al., 1996). During the current
study, we found a Ciso/CA for the C plants of ca. 2%. In
the T plants, the proportion of C lost as isoprene
increased during water-stress periods, with peak values
that exceeded 50%. These peaks were the result of a
major reduction in A (close to zero) while Fiso remained
high. However, the percentage of C lost as isoprene
clearly increased from the beginning through the whole
drought period showing a good relationship with y:Because of the strong dependence of Fiso on leaf

ARTICLE IN PRESS
A (
µmol
m-2
s-1
)
0
2
4
6
8
ψ PD (MPa)
-2 .5 -2 .0 -1.5 -1 .0 -0.5 0.0
Fis
o (n
mol
m-2
s-1
)
3
6
9
12
15
18
21
24R2 = 0.64
(A)
(B)
y = 5.27x +19.37
Fig. 5. Relationship between photosynthetic rates (A) (A) and
isoprene emission rates (Fiso) (B), and pre-dawn leaf water
potential (cPD) for the T plants during the whole experiment
(two cycles).
A (µmol m-2 s-1)
0 1 2 3 4 5 6 7 8
Fis
o (n
mol
m-2
s-1
)
3
6
9
12
15
18
21
24
R2 = 0.62
Drought periodWatered periodCommon points
Fig. 6. Relationship between isoprene emission rates (Fiso) and
photosynthetic rates (A) for the T plants during the dry (white
diamonds) and wet (well-watered and recovery) (black dia-
monds) periods, over the whole experiment (two cycles). The
‘‘Common points’’ (grey triangles) represent the transition days
between one phase and the next one. Each point represents the
average of six replicates.
E. Pegoraro et al. / Atmospheric Environment 38 (2004) 6149–6156 6155
temperature, this C loss may become even larger in areas
with warm climate where drought-induced stomatal
closure may have a large indirect effect on Fiso by
increasing leaf temperature.
In a climate change scenario with higher temperatures
and prolonged droughts, the ratio of Fiso to A could
dramatically increase with significant impact on the
global terrestrial C balance, especially in regions such as
the tropics which are estimated to contribute more than
80% of the annual isoprene flux (Jacob and Wofsy,
1988; Zimmerman et al., 1988; Guenther et al., 1995).
Although many studies have been published over the
past 10 years on Fiso by plants, additional research
focusing on water-stress using a range of species is
needed in order to enable us to model plant Fiso response
to drought in different climate scenarios. It is desirable
to relate biogenic emissions to measurable physiological
parameters that control emission variations. cPD is the
most likely candidate for describing the role of water
limitations on biogenic emissions from leaves and there
are several vegetation models that can be used to predict
it. This parameter also may be needed for estimating
accurate Tleaf during drought conditions. As our results
suggest, there may exist a tight relationship between Fiso
and cPD during water-stress episodes. Although it is
likely that the slope of the relationship between cPD and
Fiso varies widely between species, we believe that cPD
could be a useful parameter to include in isoprene
emission models to account for effects of drought stress.
Although measured under controlled conditions, the
observed values of cPD in this study are similar to those
observed for oak species in the field during summer
natural drought conditions (Martinez-Vilalta et al.,
2003; Bombelli and Gratani, 2003; Owens and Schrei-
ber, 1992). The coefficient of the relationship between
Fiso and cPD reported in this study could therefore be
used by modellers to set up a first model parameterisa-
tion that could be improved upon in the future.
Finally, investigations using potted plants and
laboratory measurements provide valuable information
from which to build hypotheses, but these studies often
yield results that differ from those observed using field-
grown adult plants in their natural environment. There
is therefore a strong need for further field studies to test
any definitive model for the Fiso response to water-stress
in natural ecosystems.
Acknowledgements
We thank Pierre Prevost for designing and construct-
ing some of the hardware and control software used for
this study. E. Pegoraro and A. Rey were partially
supported by the NCAR-ACD visitor program. The
National Center for Atmospheric Research is sponsored
by the National Science Foundation.

ARTICLE IN PRESSE. Pegoraro et al. / Atmospheric Environment 38 (2004) 6149–61566156
References
Affek, H.P., Yakir, D., 2003. Natural abundance carbon
isotope composition of isoprene reflects incomplete coupling
between isoprene synthesis and photosynthetic carbon flow.
Plant Physiology 131 (4), 1727–1736.
Baldocchi, D., Guenther, A.B., Harley, P.C., Klinger, L.,
Zimmerman, P., Lamb, B., Westberg, H., 1995. The Fluxes
and air chemistry of isoprene above a deciduous hardwood
forest. Philosophical Transactions of the Royal Society of
London Series A-Mathematical Physical and Engineering
Sciences 351 (1696), 279–296.
Bombelli, A., Gratani, L., 2003. Interspecific differences of
leaf gas exchange and water relations of three evergreen
Mediterranean shrub species. Photosynthetica 41 (4),
619–625.
Bruggemann, N., Schnitzler, J.P., 2002. Comparison of
isoprene emission, intercellular isoprene concentration and
photosynthetic performance in water-limited oak (Quercus
pubescens Willd. and Quercus robur L.) saplings. Plant
Biology 4 (4), 456–463.
Delwiche, C.F., Sharkey, T.D., 1993. Rapid appearence of C-13
in biogenic isoprene when (CO2)-C-13 is fed to intact leaves.
Plant Cell and Environment 16 (5), 587–591.
Fall, R.R., Monson, R.K., 1992. Isoprene emission rate and
intercellular isoprene concentration as influenced by stoma-
tal distribution and conductance. Plant Physiology 100 (2),
987–992.
Fang, C.W., Monson, R.K., Cowling, E.B., 1996. Isoprene
emission, photosynthesis, and growth in sweetgum (Liqui-
dambar styraciflua) seedlings exposed to short- and long-
term drying cycles. Tree Physiology 16 (4), 441–446.
Funk, J. L., Mak, J. E., Lerdau, M. T., 2004. Stress-induced
changes in carbon sources for isoprene production in
Populus deltoides. Plant Cell and Environment.
Guenther, A.B., Hewitt, C.N., Erickson, D., Fall, R.R., Geron,
C.D., Graedel, T., Harley, P.C., Klinger, L., Lerdau, M.,
Mckay, W.A., Pierce, T., Scholes, B., Steinbrecher, R.,
Tallamraju, R., Taylor, J., Zimmerman, P., 1995. A global
model of natural volatile organic compound emissions.
Journal of Geophysical Research—Atmospheres 100 (D5),
8873–8892.
Guenther, A.B., Archer, S., Greenberg, J.P., Harley, P.C.,
Helmig, D., Klinger, L., Vierling, L., Wildermuth, M.,
Zimmerman, P., Zitzer, S., 1999. Biogenic hydrocarbon
emissions and landcover/climate change in a subtropical
savanna. Physics and Chemistry of the Earth Part B-
Hydrology Oceans and Atmosphere 24 (6), 659–667.
Harley, P.C., Litvak, M.E., Sharkey, T.D., Monson, R.K.,
1999. Isoprene emission from velvet bean leaves—interac-
tions among nitrogen availability, growth photon flux
density, and leaf developement. Plant Physiology 105 (1),
279–285.
Jacob, D.J., Wofsy, S.C., 1988. Photochemistry of biogenic
emissions over the Amazon forest. Journal of Geophysical
Research—Atmospheres 93 (D2), 1477–1486.
Karl, T., Fall, R., Rosenstiel, T.N., Prazeller, P., Larsen, B.,
Seufert, G., Lindinger, W., 2002. On-line analysis of the
(CO2)-C-13 labeling of leaf isoprene suggests multiple
subcellular origins of isoprene precursors. Planta 215 (6),
894–905.
Lerdau, M., Guenther, A.B., Monson, R., 1997. Plant
production and emission of volatile organic compounds.
Bioscience 47 (6), 373–383.
Martinez-Vilalta, J., Mangiron, M., Ogaya, R., Sauret, M.,
Serrano, L., Penuelas, J., Pinol, J., 2003. Sap flow of three
co-occurring Mediterranean woody species under varying
atmospheric and soil water conditions. Tree Physiology 23
(11), 747–758.
Mgaloblishvili, M.P., Khetsuriani, N.D., Kalandadze, A.N.,
Sanadze, G.A., 1979. Localization of isoprene biosynthesis
in poplar chloroplasts. Plant Physiology 25, 837–842.
Monson, R.K., Fall, R.R., 1989. Isoprene emission from aspen
leaves—influence of environment and relation to photo-
synthesis and photorespiration. Plant Physiology 90 (1),
267–274.
Owens, M.K., Schreiber, M.C., 1992. Seasonal gas-exchange
characteristics of 2 evergreen trees in a semiarid environ-
ment. Photosynthetica 26 (3), 389–398.
Sanadze, G.A., Dzhaini, G.I., Tevzadze, T.M., 1972. Incor-
poration into the isoprene molecule of carbon from C13O2
assimilated during photosynthesis. Plant Physiology 19,
17–20.
Schnitzler, J.P., Graus, M., Kreuzwieser, J., Heizmann, U.,
Rennenberg, H., Wisthaler, A., Hansel, A., 2004. Contribu-
tion of different carbon sources to isoprene biosynthesis in
poplar leaves. Plant Physiology 135 (1), 152–160.
Sharkey, T.D., Loreto, F., 1993. Water-stress, temperature,
and light effects on the capacity for isoprene emission
and photosynthesis of kudzu leaves. Oecologia 95 (3),
328–333.
Sharkey, T.D., Loreto, F., Delwiche, C.F., 1991. High-carbon
dioxide and sun shade effects on isoprene emission from oak
and aspen tree leaves. Plant Cell and Environment 14 (3),
333–338.
Tingey, D.T., Evans, R.C., Gumpertz, M.L., 1981. Effects of
environmental conditions on isoprene emission from live
oak. Planta 152 (6), 565–570.
Zimmerman, P.R., Greenberg, J.P., Westberg, C.E., 1988.
Measurements of atmospheric hydrocarbons and biogenic
emission fluxes in the Amazon boundary layer. Journal of
Geophysical Research—Atmospheres 93 (D2), 1407–1416.
Related Documents